UAH Global Temperature Update for May 2013: +0.07 deg. C

June 4th, 2013 by Roy W. Spencer, Ph. D.

Our Version 5.5 global average lower tropospheric temperature (LT) anomaly for May, 2013 is +0.07 deg. C, down a little from +0.10 deg. C in April (click for large version):
UAH_LT_1979_thru_May_2013_v5.5

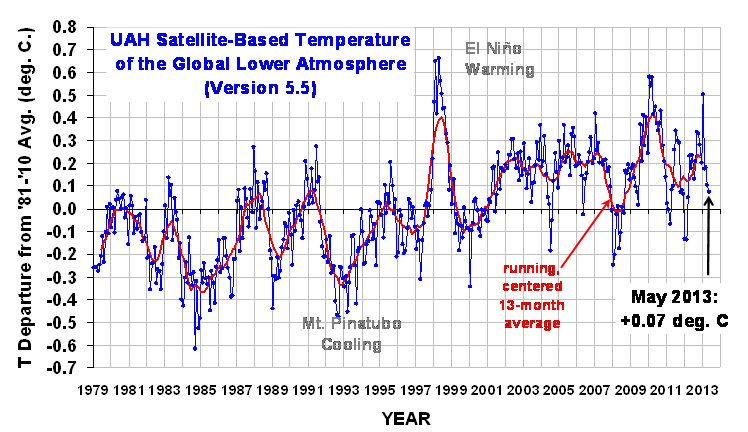
The global, hemispheric, and tropical LT anomalies from the 30-year (1981-2010) average for the last 17 months are:

YR MON GLOBAL NH SH TROPICS
2012 1 -0.134 -0.065 -0.203 -0.256
2012 2 -0.135 +0.018 -0.289 -0.320
2012 3 +0.051 +0.119 -0.017 -0.238
2012 4 +0.232 +0.351 +0.114 -0.242
2012 5 +0.179 +0.337 +0.021 -0.098
2012 6 +0.235 +0.370 +0.101 -0.019
2012 7 +0.130 +0.256 +0.003 +0.142
2012 8 +0.208 +0.214 +0.202 +0.062
2012 9 +0.339 +0.350 +0.327 +0.153
2012 10 +0.333 +0.306 +0.361 +0.109
2012 11 +0.282 +0.299 +0.265 +0.172
2012 12 +0.206 +0.148 +0.264 +0.138
2013 1 +0.504 +0.555 +0.453 +0.371
2013 2 +0.175 +0.368 -0.018 +0.168
2013 3 +0.183 +0.329 +0.038 +0.226
2013 4 +0.103 +0.120 +0.086 +0.167
2013 5 +0.074 +0.162 -0.013 +0.113


21 Responses to “UAH Global Temperature Update for May 2013: +0.07 deg. C”

Toggle Trackbacks

  1. Svend Ferdinandsen says:

    Dear Roy.

    Are there any explanations for the variation of the anomaly over the year. It is more or less the same all over the Earth and with the highest anomaly around january.
    You have easier to access the data, so when did it start and was it different in other years?

  2. Anomalies will tend to be larger during Dec-Jan-Feb because that is when El Nino and La Nina reach peak intensity.

    • Joe Freeman says:

      January of 2013 is very interesting — a big one-month jump in what otherwise looked to be a fairly consistent decreasing anomaly trend. Dr. Spencer, do you have any thoughts about what caused that? The start of an El Nino phase that fizzled? If so, it seems peculiar that all the ocean regions showed the spike.

      Thanks for all the great information.

  3. Dr. Spencer, my thanks for your reasoned approach to a thorny subject. my thorn, is that no one seems to be measuring temperature correctly, so we don’t really know
    what the temperature is doing. It should be measured as an energy source, just like you measure KWH. no one would pay for gasoline if you spot-checked the flow to determine the
    amount. what is needed is a thermometer that measures the
    energy level and multiplies it by time, as if you had a Carnot engine producing energy from the heat in the atmosphere, and measured it in KWH (or?). you can’t get the
    energy level in the atmosphere by SPOT-CHECKING the temp.
    we have the instruments available (millions). home computers with usb temp recorders, recording a continuous
    record integrated against time. the number you would get would represent the energy available in the atmosphere, and
    it could be compared on an on-going basis to see which way
    it is trending.

  4. Skeptikal says:

    Roy,

    You mentioned a while ago that you were working on Version 6 of your anomaly. I was just curious if there is any time-frame on when this new version will be released and will it be noticably different from the current version?

  5. As I have said each month that goes by the AGW predictions on global temperature trends are further off, while I am getting closer,although slowly but then again my solar parameters have not been met yet,due to the current max. of solar cycle 24 temporarily keeping solar activity in the low/moderate range,rather very low.

    OHC content also playing out very very slowly.

    Again I wiLl go on record and say if the sun has the following parameters for the balance of this decade,those being a solar flux reading of sub 72, ap index 5 or lower 98+% of the time(WITH A FEW EXTREME SPIKES) and a solar wind speed of 350km/sec. or lower,the global temperature average wil be around -.8c lower then it is today, with the largest drops in the N.H.

    I have a specific forecast, which gives specific reasons along with a time frame.

    Time will tell.
    I am very confident if the solar parameters I mentioned are met for the balance of this decade that the resultant temperature forecast I have projected by 2020,is going to be pretty darn close.

  6. As I have said each month that goes by the AGW predictions on global temperature trends are further off, while I am getting closer,although slowly but then again my solar parameters have not been met yet,due to the current max. of solar cycle 24 temporarily keeping solar activity in the low/moderate range,rather then very low.

    OHC content also playing out very very slowly.

    Again I will go on record and say if the sun has the following parameters for the balance of this decade,those being a solar flux reading of sub 72, ap index 5 or lower 98+% of the time(WITH A FEW EXTREME SPIKES) and a solar wind speed of 350km/sec. or lower,the global temperature average wil be around -.8c lower then it is today, with the largest drops in the N.H.

    I have a specific forecast, which gives specific reasons along with a time frame.

    Time will tell.
    I am very confident if the solar parameters I mentioned are met for the balance of this decade that the resultant temperature forecast I have projected by 2020,is going to be pretty darn close.

  7. Since Oct. of 2005 the sun has been in a prolonged solar minimum, versus 100
    + years of strong to very strong activity.

    Lag times have to be appreciated with the OHC part of the equation,along with the accumulation factor of sub-solar years having to be taken into account now going on year 8 , along with the current very weak maximum of solar cycle 24, all conspiring to hold the temperature trend higher then would otherwise be the case, but as this decade proceeds these factors will be lessening.

    The max. of solar cycle 24 should be ending within a year from now , and I say watch what happens to the temp. trend, as direct but even more importantly secondary effects from a very quiet sun start to exert themselves upon the climate, which I have mentioned many many times.

    Past history makes a very strong case for my argument.

    LOOK AT THE TWO MOST RECENT SOLAR MINIMUMS AND THE TEMP. TRENDS IN THE N.H. WHICH IS GOING TO MUCH MORE AFFECTED THEN THE S.H.

  8. Since Oct. of 2005 the sun has been in a prolonged solar minimum, versus 100
    + years of strong to very strong activity.

    Lag times have to be appreciated with the OHC part of the equation,along with the accumulation factor of sub-solar years having to be taken into account now going on year 8 , along with the current very weak maximum of solar cycle 24, all conspiring to hold the temperature trend higher then would otherwise be the case, but as this decade proceeds these factors will be lessening.

    The max. of solar cycle 24 should be ending within a year from now , and I say watch what happens to the temp. trend, as direct but even more importantly secondary effects from a very quiet sun start to exert themselves upon the climate, which I have mentioned many many times.

    Past history makes a very strong case for my argument. Time will tell.

    LOOK AT THE TWO MOST RECENT SOLAR MINIMUMS AND THE TEMP. TRENDS IN THE N.H. WHICH IS GOING TO MUCH MORE AFFECTED THEN THE S.H.

  9. From: Salvatore Delprete
    To: salmbswx
    Sent: Wed, May 1, 2013 4:34 pm
    Subject: upper trop temp one last chart for climaate presentation

    Media Gallery

  10. Upper Ocean Heat Content: Ocean Climate

    oceans.pmel.noaa.gov/‎

    The plot shows the 18-year trend in 0-700 m Ocean Heat Content Anomaly (OHCA) … Recent estimates are based

  11. UPPER OCEAN HEAT CONTENT: Home | Plots | Publications | Data

    Upper Ocean Heat Content Anomaly

    The plot shows the 18-year trend in 0-700 m Ocean Heat Content Anomaly (OHCA) estimated from in situ data according to Lyman et al. 2010. The error bars include uncertainties from baseline climatology, mapping method, sampling, and XBT bias correction.

    Historical data are from XBTs, CTDs, moorings, and other sources. Additional displays of the upper OHCA are available in the Plots section.

    Recent estimates are based primarily on Argo profiling CTD float data. Satellite altimeter data from Aviso are used to estimate errors

    The chart with the above article shows OHC , has STOPPED increasing in recent years.

    As far as the stratosphere, warming had taken place in association with the volcanic eruptions of the early 1990’s followed by some cooling since.

    However, I have to clarify my position and say it DOES NOT MATTER if the stratophere is cooling or warming per say, what matters is this , is the cooling less in the higher latitudes in contrast to the lower latitudes (N.H. especially), and recent evidence is saying yes.

    One of the cornerstones of the AGW theory, was that the AO (POLAR VORTEX– N.H. ESPECIALLY ) was to intensify. The EXACT OPPOSITE is happening.

    Just look at the behavior of the polar vortex over the past 5 years or so and you will see that is the case.

    Dave your AGW THEORY ,is BS, and I will be doing my part to show this is so, and what/why will lead the climate to change,and how it will change.

    Dave time will tell, we will find out one way or the other,although I must say it is not looking very good for your side as each month keeps going by with no global warming.

    DOC | NOAA | OAR | Pacific Marine Environmental Laboratory | Ocean Climate Project
    7600 Sand Point Way NE, Seattle, WA 98115
    Disclaimer | Privacy Policy | Webmaster email

  12. Jack says:

    Oh, so tantalizingly close!

  13. Thanks, Dr. Spencer.
    I have updated your very compact graph in my pages.

  14. spence says:

    I’d like to know quite a bit more information especially about the satellite, its coverage of Polar regions and the data downlinks, exactly what is transmitted, type of data, format etc. If someone could point me in the right direction.

  15. Richard LH says:

    I rather suspect that this figure will, overall, continue to drop to a minimum of around -0.2 by the end of 2013 and then return to a maximum of +0.5 by end 2016.

    This can be deduced by taking the time series data and ploting the 12, 16, 21, 28 and 37 running centered averages against that data (just extending/replacing the 13 month one that is currently used by Dr. Spencer above).

    (These particular values are chosen to minimise the digital sampling effects that a running centered average filter causes in the output data)

    The resulting graph is certainly interesting!

  16. cars says:

    It is hard to dispute the fact that car shopping is a
    stressful, anxiety-ridden task for many individuals.
    The sheer size of the expenditure involved and
    the myriad of choices on the market make the
    need for education and information quite critical. Fortunately, the
    tips below can make the process far simpler than you may have
    believed.

  17. I èš€ćŠă—ăȘă„ă‚ˆă†ă«| 私たä»Čé–“ă§ă‚ă‚‹ă‚ˆă†ă«èŠ‹ăˆăŸ|杄|ç”‚ă‚ăŁăŸ|た|ăŸăŸăŸăŸæ—ąă«ăȘっお|æŒăŁăŠă|ćźŸéš›ă«ă‚ăŁăŸ| |た}ă§ă‚ă‚‹ă“ăšăŒćˆ€æ˜Žă—ăŸ 最高| çŽ æ•”ăƒă‚€ăƒłă‚ż 侀ćșŠă‚”ă‚€ăƒˆ ăăźćŸŒ|ăăźćŸŒ|しばらく çȘç„¶ă„ăŸăČどい|ăČどい} æ°—æŒăĄ|疑惑 ç§ăŻă—ăŸă›ă‚“ă§ă—ăŸ|æ„ŸèŹăƒ–ăƒ­ă‚°ăźæ‰€æœ‰è€…| ă«æ•Źæ„ă‚’èĄšæ˜Žă™ă‚‹ă“ăšăŻă‚ă‚ŠăŸă›ă‚“ăƒ†ă‚Żăƒ‹ăƒƒă‚Ż|それらぼヒント}ă€?ćș—é ­ă§ă‚ă‚‹ă‚ˆă†ă«èŠ‹ăˆăŸ|ćźŸéš›ă«ă•ă‚ŒăŠă„ă‚‹|すでに| |èˆˆć„źć…šă |ăȘった|杄|甐汀|ăŸăŸăŸăŸ| |されどいた{}間違いăȘくあった| |ă‚ăŁăŸç”¶ćŻŸă«|ç”æžœăšă—ăŠ|ç”æžœăšă—ăŠ|çąșかに|ăăźç”æžœ|ăăźç†ç”±|こぼようăȘç†ç”±ăźăŸă‚ă«|そう欉しい|ăƒăƒƒăƒ”ăƒŒ|æ„œă—ă„|情熱|ćˆșæż€|æ„Ÿæż€|éžćžžă«èˆˆć‘ł|æž©ă‚} をèȘ­ă‚€ăŸă‚ă«ăă‚Œă‚‰ăš{ăŒæ—ąă«æŒăŁăŠă„ă‚‹| |た|æŒăŁăŠă„ă‚‹äž­ă§ă€ăă‚Œă‚‰ăźă™ăčăŠć‹‰ćŒ·ă™ă‚‹|èŠ‹ăŠćŠč果|ä»ŠæŒăŁăŠă„ă‚‹|ä»ŠæŒăŁăŠă„ă‚‹} çŸćźŸ ăă‚Œă‚‰ă‚’äœżç”šă—ăŠă€?あăȘăŸă«æ„ŸèŹă™ă‚‹ăŸă‚ăźć€šăăźăŠă‹ă’ă§ そう {揎ćźč|æ€ă„ă‚„ă‚Š|ćœč立぀|繼類|æ€æ…źă‚‚ç”š|ăšăźăŸă‚ă«|ă€ăăźćŸŒăźăŸă‚ă«| {かăȘり}ă§ă‚ă‚‹ă“ăšăŒćŒæ§˜ăźăŸă‚ă«éžæŠž|è€ƒæ…ź|たæ±ș漚|侊æ±ș漚|è€ƒăˆć‡șす|ç™ș芋|ć–ćŸ—|ăźăŸă‚ă«èĄŒă|æŒă€|ć…„æ‰‹| |でæ±ș漚を例す|äžŠăźéžæŠžè‚ąă‚’äœœă‚‹ăŸă‚ă«éžă¶|遞びć‡șす|ピッキング|遞択| |ă‚’éžă¶ă«ă‚»ăƒˆăƒȘング| }ăźæ§˜|ćˆ©ç”š} äž»éĄŒ ă«ă€ă„ăŠçŸ„ă‚‹ă«ă€ă„ăŠç†è§Łă€?ćœ“ç€Ÿç‹Źè‡Ș èȘ ćźŸ èŹçœȘではăȘă„ăŸă‚ă«{ă«æ„ŸèŹă‚’èĄšæ˜Ž|ăžăźæ„ŸèŹăźæ°—æŒăĄă‚’èĄšçŸă™ă‚‹|ă«èš€ăŁăŠă‹ă’} {|あăȘた} {ä»„ć‰|遅かれ}ă€?

  18. Wow, marvelous blog layout! How long have you been blogging for?

  19. A lot of thanks for your entire efforts on this website. My mother delights in managing research and it is obvious why. My partner and i learn all of the dynamic means you offer priceless tips and hints by means of the web site and boost response from other people on the article then my princess has been becoming educated a whole lot. Have fun with the remaining portion of the new year. You are conducting a remarkable job.

  20. You made it easier for me to understand the topic. Thanks for writing so clear. Harrington Park electrician

Leave a Reply