Summary: Atmospheric levels of carbon dioxide (CO2) continue to increase with no sign of the global economic slowdown in response to the spread of COVID-19. This is because the estimated reductions in CO2 emissions (around -11% globally during 2020) is too small a reduction to be noticed against a background of large natural variability. The reduction in economic activity would have to be 4 times larger than 11% to halt the rise in atmospheric CO2.
Changes in the atmospheric reservoir of CO2 occur when there is an imbalance between surface sources and sinks of CO2. While the global land and ocean areas emit approximately 30 times as much CO2 into the atmosphere as humans produce from burning of fossil fuels, they also absorb about an equal amount of CO2. This is the global carbon cycle, driven mostly by biological activity.
There are variations in the natural carbon cycle, such as during El Nino (more CO2 accumulation in the atmosphere) and La Nina (more CO2 removed from the atmosphere). Greater wildfire activity releases more CO2, while major volcanic eruptions (paradoxically) lead to greater photosynthesis from more diffuse sunlight and extra removal of CO2 from the air. The most dramatic variations are seasonal, as the land-dominated Northern Hemisphere experiences an annual cycle of vegetation growth (CO2 removal) and decay (CO2 release).
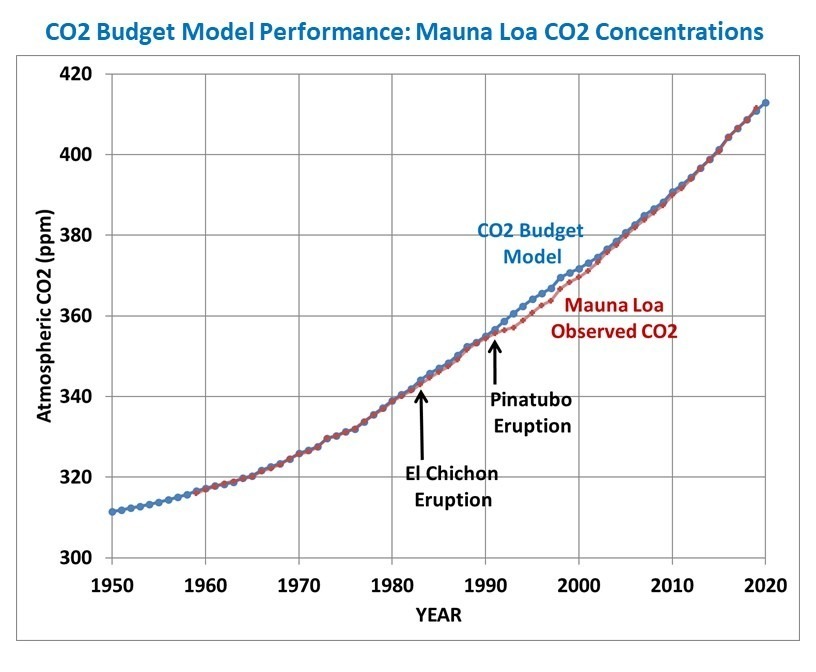
The increase in atmospheric CO2 observed since the 1950s is most likely dominated by anthropogenic CO2 emissions, which are twice as large as that needed to explain the observed rise. As I have shown before, a simple CO2 budget model driven by (1) estimates of global yearly anthropogenic CO2 emissions, (2) El Nino and La Nina activity, and (3) a CO2 removal rate that is proportional to how much “extra” CO2 is in the atmosphere compared to a “preferred baseline” CO2 level, yields an excellent fit to yearly CO2 observations at Mauna Loa, Hawaii.
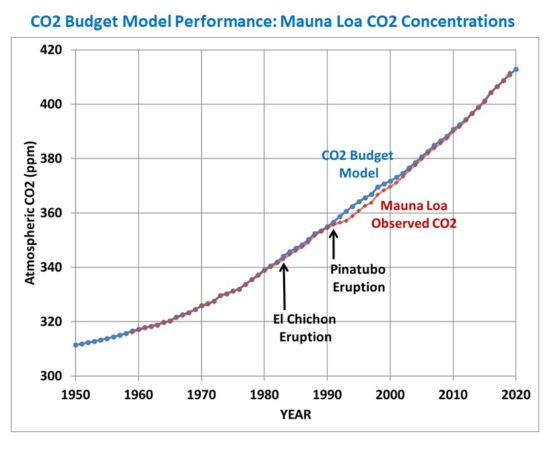
Fig. 1. Yearly Mauna Loa, HI CO2 observations since 1959 (red) versus a simple CO2 budget model (blue).
But those are yearly measurements, and we are now interested in whether the recent global economic slowdown is showing up in the monthly Mauna Loa CO2 data. If we remove the large seasonal variations (driven by the seasonal growth and decay of Northern Hemisphere vegetation), we see no evidence of the economic slowdown through April, 2020.
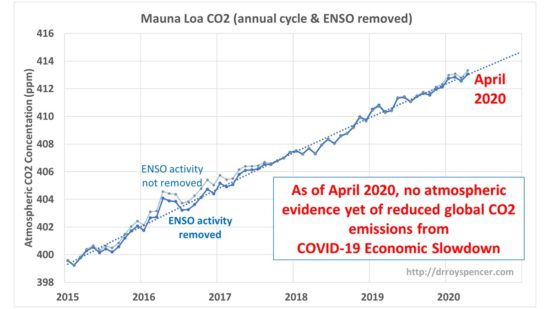
Fig. 2. Monthly CO2 data since 2015 from Mauna Loa, HI after the average seasonal cycle is statistically removed.
As can be seen in Fig. 2, there are some pretty large month-to-month jumps and dips around the long-term increase (represented by the dotted line). These are probably natural variations due to fluctuations in the average seasonal variations in vegetation growth and decay, wildfire activity, and El Nino and La Nina activity (which are imperfectly removed in the solid blue line in Fig. 2). Variations in economic activity might also be involved in these fluctuations.
The point is that given the large month-to-month variations in natural CO2 sources and sinks seen in Fig. 2, it would be difficult to see a downturn in the anthropogenic source of CO2 unless it was very large (say, over 50%) and prolonged (say over a year or longer).
Instead, the U.S. Energy Information Administration (EIA) estimates that the global economic slowdown this year due to the spread of the novel coronavirus will amount to only about an 11% reduction in global CO2 emissions. This is simply too small of a decrease in CO2 emissions to show up against a background of considerable monthly and yearly natural variability in the atmospheric CO2 budget.
That relatively small 11% reduction also illustrates how dependent humanity is on energy, since the economic disruption is leading to U.S. unemployment rates not seen since the Great Depression of the 1930s. Everything that humans do requires access to abundant and affordable energy, and even the current economic downturn is not enough to substantially reduce global CO2 emissions.
ADDENDUM: How much of a decrease in CO2 emissions would be required to stop the atmospheric rise in CO2?
An interesting aspect of the observed rise of atmospheric CO2 is that it indicates the greater the CO2 concentration, the faster the “extra” CO2 is removed by biological activity. The observed annual rate of removal is 2.3% of the excess above a baseline of 295 ppm. The greater the “excess”, the faster the rate of removal.
Because of this rapid rate of removal, the anthropogenic CO2 emissions do not have to go to zero to stop the observed rise in atmospheric CO2. Using my simple model (blue line in Fig. 1, above), I find that a 43% reduction in anthropogenic CO2 emissions in 2020 would — in the absence of natural fluctuations in the carbon cycle — lead to a halt in the observed rise of atmospheric CO2 in 2020 over 2019 levels. This is about 4 times larger than the EIA estimate of an 11% reduction in CO2 emissions for the year 2020.

 Home/Blog