Archive for April, 2013

A Simple Model of Global Average Surface Temperature

Tuesday, April 30th, 2013

And, yes, you can try this at home.

I put together a simple surface energy balance model in an Excel spreadsheet so people can play around with the inputs. It computes the time changing surface temperature for any combination of:

1) absorbed sunlight (nominally 161 W/m2)
2) ocean mixed layer depth (does not affect final equilibrium temperature)
3) initial temperature of the ocean mixed layer (does not affect final equilibrium temperature)
4) atmospheric IR transmittance (yes, you can set it to 1 if you are carrying your sky dragon slayer [SDS] ID card)
5) effective temperature of downwelling sky radiation (nominally 283 K, but in effect becomes zero if transmittance=1)
6) surface convective heat loss (nominally 97 W/m2)

The nominal values are set to be consistent with the Kiehl-Trenberth global energy budget diagram.

The simple model is good for developing intuition about how the equilibrium surface temperature changes when varying different input parameters. I would challenge people to see what other combinations of parameters result in the observed global average surface temperature, which is believed to be around 59 deg. F or so.

Again, the model is very simple; it changes the temperature of the assumed ocean mixed layer depending upon assumed rates of energy gain and energy loss by that layer.

Here’s an example plot:
simple-surface-model-output

And here is the model: simple-sfc-model

Example: Nighttime cooling with and without the greenhouse effect
There’s an interesting experiment you can run with the model to see how nighttime temperatures cool off depending upon whether there is a greenhouse effect or not. If you run the model starting the surface temperature around 288 K (the observed global average), turn solar absorption off (nighttime), make the time step 1/24 of a day (1 hour), and make the ocean mixed layer approximate a land surface (set depth to 0.1 meter), you will find that the surface cools about 20 deg F overnight when the atmospheric IR transmittance is set to 0.1 (realistic), but cools by about 70 deg. F if the transmittance is set to 1 (no greenhouse effect). In other words, large amounts of atmospheric “back radiation” (admittedly a poor term) are required to explain why nighttime temperatures do not cool off more than observed.

PLEASE keep the discussion about gaining insight from the simple model…I know all about its shortcomings.

How Can Home Insulation Keep Your House Warmer, When It Cools Your House?!

Wednesday, April 24th, 2013


<sarc> There is an obvious conspiracy from the HVAC and home repair industry, who for years have been telling us to add more insulation to our homes to keep them warmer in winter.

But we all know, from basic thermodynamics, that since insulation conducts heat from the warm interior to the cold outside, it actually COOLS the house.

So, how in the world are we expected to believe that adding MORE insulation, which we know acts to cool the house by conduction, is somehow going to WARM the inside of the house?

After all, how can cooler insulation further heat the inside of the house? Does heat flow from cold insulation to warmer temperatures? No!

I think I’ll start a new organization to reveal this scam. Maybe I’ll call it Principia Domus International. </sarc>

FOR THOSE NOT IN ON THE JOKE: The sky dragon slayers (people who think the greenhouse effect does not exist) claim greenhouse gases cannot make the Earth’s surface warmer because those gases, distributed up through the atmosphere, are at a colder temperature than the surface. I am demonstrating a thermodynamic point which is true, no matter whether infrared radiation (in the case of the atmosphere) or insulation (in the case of the house) are involved in the energy loss. The point is this: The temperature of anything that is heated is partly governed by the nature of its cooler surroundings, because those cooler surroundings affect the rate of heat loss by the warmer object. As long as there is an energy source (the Sun), the surface temperature of the Earth can be INCREASED by reducing the rate of net energy loss by the surface.

Global Warming Slowdown: The View from Space

Tuesday, April 16th, 2013

Since the slowdown in surface warming over the last 15 years has been a popular topic recently, I thought I would show results for the lower tropospheric temperature (LT) compared to climate models calculated over the same atmospheric layers the satellites sense.

Courtesy of John Christy, and based upon data from the KNMI Climate Explorer, below is a comparison of 44 climate models versus the UAH and RSS satellite observations for global lower tropospheric temperature variations, for the period 1979-2012 from the satellites, and for 1975 – 2025 for the models:
CMIP5-global-LT-vs-UAH-and-RSS
Clearly, there is increasing divergence over the years between the satellite observations (UAH, RSS) and the models. The reasons for the disagreement are not obvious, since there are at least a few possibilities:

1) the real climate system is not as sensitive to increasing CO2 as the models are programmed to be (my preferred explanation)

2) the extra surface heating from more CO2 has been diluted more than expected by increased mixing with cooler, deeper ocean waters (Trenberth’s explanation)

3) increased manmade aerosol pollution is causing a cooling influence, partly mitigating the manmade CO2 warming

If I am correct (explanation #1), then we will continue to see little warming into the future. Additional evidence for lower climate sensitivity in the above plot is the observed response to the 1991 Pinatubo eruption: the temporary temperature dip in 1992-93, and subsequent recovery, is weaker in the observations than in the models. This is exactly what would be predicted with lower climate sensitivity.

On the other hand, if Trenberth is correct (explanation #2), then there should be a period of rapid surface warming that resumes at some point, since the climate system must eventually try to achieve radiative energy equilibrium. Of course, exactly when that might be is unknown.

Explanation #3 (anthropogenic aerosol cooling), while theoretically possible, has always seemed like cheating to me since the magnitude of aerosol cooling is so uncertain it can be invoked in any amount desired to explain the observations. Besides, blaming a lack of warming on humans just seems a little bizarre.

The dark line in the above plot is the 44-model average, and it approximately represents what the IPCC uses for its official best estimate of projected warming. Obviously, there is a substantial disconnect between the models and observations for this statistic.

I find it disingenuous for those who claim that, because not ALL of individual the models disagree with the observations, the models are somehow vindicated. What those pundits fail to mention is that the few models which support weaker warming through 2012 are usually those with lower climate sensitivity.

So, if you are going to claim that the observations support some of the models, and least be honest and admit they support the models that are NOT consistent with the IPCC best estimates of warming.

Lightning Strike Video

Sunday, April 14th, 2013

leader-stroke
I’ve mentioned the TV tower I live next to (er…I mean “mast”), and at 1,000 1,500 ft tall it is a great lightning attractor. Since the top of the tower is up at a 60+ deg. angle, it’s a little hard on the neck to watch, so I sometimes lie down in the backyard to watch.

The severe storms that moved through town on Thursday gave me a chance to capture some lightning video with my Sony Handycam. Lightning was coming out of a thunderstorm anvil in advance of the squall line and hitting the tower before the rain arrived, a prime time for viewing. The strokes were coming every 3-5 minutes. The lightning strike I got video of started with an upward leader stroke (see the above frame grab).

In the video (below) the conducting channel of air is blown rapidly sideways by the wind, leading to a right-angle turn in the bolt at the top of the antenna. Then there’s a second stroke which reconnects more directly to the antenna, but it’s really only noticeable when individual frames are examined.

This is handheld, and I’m zoomed in pretty tight, but the Handycam’s image stabilization does a pretty good job. Oh..and turn the sound up!

Direct Evidence of Earth’s Greenhouse Effect

Wednesday, April 10th, 2013

After yesterday’s post about what determines temperature, I thought I would revisit one of the most convincing evidences of Earth’s greenhouse effect.

As I’ve mentioned before, a handheld infrared thermometer is a great little tool to help gain physical insight into the thermal radiative (infrared) effect the atmosphere has on surface temperature.

Here I’m going to give an example of how the IR thermometer responds to a clear sky versus a cloud, and I invite alternative ideas of what is causing the resulting indicated temperature changes.

First, I want to demonstrate how the IR thermometer does indeed respond, remotely, to the temperature of any object it is pointed at. I made the following measurements inside our break room freezer (reading about 9 deg. F), and while pointed at the coffee pot (reading about 129 deg. F):
IR-thermometer-freezer-coffee
(I’m not going to address the absolute accuracy of the measurements, which is probably not better than a few degrees, since we will be dealing with temperature changes of ten of degrees or more. If you work with these things enough you will see they are sensitive to changes smaller than 1 deg. F.)

Then, I took measurements outside our UAH building while pointing the IR thermometer at the sky. For reference, the ambient air temperature at our weather station about 100 ft away was 78 deg. F, and the dewpoint was 63 deg. F.

The thermometer is pointed first at a clear patch of sky (reading 27 deg. F), and then an adjacent cloud (reading 41 deg. F):
IR-thermometer-clear-sky-cloud
Now, my question is this:

What caused the IR thermometer reading to warm up by 14 deg. when it went from clear sky to the cloud?

I’m especially interested to hear an answer from those who tell me there is no such thing as downwelling sky radiation (aka “back radiation”). No matter what you believe is happening, it is rather obvious that the cloud influences the temperature reading differently than clear sky. (If you are thinking it is a reflected sunlight effect, you can perform the experiment at night and see the same effect; furthermore, the highest cloud temperatures you will get are from the thickest, *blackest* clouds on the bottom…so it’s not a reflected sunlight effect).

What Does the IR Thermometer Actually Measure?

As I mentioned in my previous post “What Determines Temperature?”, temperature is an energy budget issue, the result of energy gain versus energy loss.

Inside the IR thermometer, there is a thermopile (an electronic circuit very sensitive to temperature differences) with thermistors measuring temperature at both ends. When you point the thermometer at an object with a different temperature than the thermopile, an IR lens (which has a beamwidth of about 5 deg.) allows IR radiation to flow between the lens end of the thermopile and the target object.

If the target object is warmer than the viewing end of the thermopile, the net IR flow is from the object toward the thermopile, which begins to warm. Circuitry measures how fast those temperature changes occur and extrapolates an estimate of the target object’s temperature. (The thermometer has no idea what the infrared emissivity of the object is, so my unit simply assumes an emissivity of 0.95).

If the target object is colder than the thermocouple, the net flow of IR radiation is from the thermocouple to the object, and the thermocouple cools.

In the cloud case, the cloud has a higher emitting temperature because it is at a lower altitude, and it is more opaque in the infrared than the clear sky is.

A similar effect can be achieved from just the clear sky, by pointing the IR thermometer up at different elevation angles. Increasing temperatures will be indicated as the elevation angle is lowered toward the horizon. Today, I measured about 15 deg. F pointing straight up to about 35 deg. F when pointed about 20 deg. above the horizon.

In this clear-sky case, infrared absorbers/emitters (aka “greenhouse gases”) in the atmosphere, which are partly (but not totally) transparent at the IR frequency band the thermometer is tuned to, become more opaque as the thermometer is pointed at lower elevation angles. As the elevation angle is lowered, the path length through the atmospheric absorbers increases, and the altitudes from which the IR emission is being received are lower and thus at higher emitting temperatures.

This is the most convincing, do-it-yourself, direct observational evidence of downwelling sky radiation I have been able to find, and it makes a great little science experiment for students. What makes it “direct” evidence is that it actually measures the surface temperature effect (at surface of the thermopile) of changing downwelling IR radiation from the sky. This is the same thing happening continuously at the surface of the Earth as the strength of the greenhouse effect changes from water vapor, clouds,..oh yeah, and carbon dioxide.

And if you STILL don’t see how this demonstrates the greenhouse effect, imagine what would happen if you suddenly removed all of that atmosphere and clouds: there would be a sudden increase in the rate of net IR flow from the surface of the Earth to outer space, and temperatures would drop. THAT is the greenhouse effect.

For those who do not believe the above explanation, give us your alternative answer to the question: what causes the IR thermometer indicated temperature to increase from (1) clear sky to cloud, and (2) zenith clear sky to low-elevation clear sky?

What Determines Temperature?

Tuesday, April 9th, 2013

I continue to get blog comments and e-mails from well-intentioned folks who still don’t understand what determines temperature.

More specifically, I’m talking about those who claim that the atmosphere cannot influence the temperature of the surface because the atmosphere is (usually) colder than the surface. You know who you are. 😉

Their argument goes like this…since net heat flow must be from warmer to colder temperatures (the 2nd Law of Thermodynamics), the presence of the cold atmosphere cannot cause “heating” of the surface. I understand the source of this confusion, and it’s partly a matter of semantics: rather than saying that the “atmosphere heats the surface”, it would be less confusing to say that the “atmosphere reduces the ability of the surface to cool”.

To examine the issue, I’m going to keep the discussion as simple as I possibly can without sacrificing accuracy. Let’s return to one of my favorite examples, an open pot of warm water on the stove. Let’s assume the stove is set on low, and the water has reached a rather warm temperature.

Now, we all know from personal experience that if you put a lid on the pot, you can cause the water’s temperature to rise.

But how can that be, if the lid is colder than the water?

It’s because temperature is determined by both the rates of energy gain AND energy loss, and the lid reduces the water’s ability to cool to its surroundings. It doesn’t matter what the specific mechanism of energy loss is: conductive, convective, evaporative, or radiative.

When we put a lid on the pot, we reduce the rate of evaporative and convective heat loss, as well as radiative loss from the water surface, and the water’s temperature rises until the pot once again reaches a state of energy equilibrium. Convective and radiative energy losses increase with the water’s increasing temperature compared to its surroundings. In a sense, the lid further insulates the warm water from its cooler surroundings, where “insulates” means reducing heat flow in a general sense.

The same is true of the atmosphere. Greenhouse gases in the atmosphere represent a sort of “radiative lid”, reducing the rate at which the Earth’s surface cools to outer space.

One of the major points I am making is that you cannot determine equilibrium temperature based upon the rate of energy input alone: it’s a function of rates of energy gain AND energy loss.

An extreme example is the Sun. At the core of the Sun, “weak nuclear force” reactions produce energy (so I am told) at a rate even less what the human body produces…yet temperatures in the core reach an estimated 15,000,000 deg. C. The reason why the temperature reaches such extreme values is that energy LOSS outward from the Sun’s core is so inefficient.

The everyday examples of the presence of cooler objects keeping things warmer than they would otherwise be are everywhere. For example, coffee in a cold Styrofoam cup. Stack a second cup with the first, and the temperature of the coffee will stay warmer than it would otherwise be.

In fact, everything I can think of that has a heated warm core has its equilibrium temperature controlled by cooler materials surrounding that core. A blanket over your body, etc.

No doubt my detractors will claim I am making absurd comparisons, between a pot of water and the climate system. No, the basic principles of heat flow are the same. If you pump energy into an object, no matter what it is, its temperature will increase until it’s mechanisms of energy LOSS increase to the point where they equal the rate of energy gain. The temperature will then stabilize.

But those mechanisms of energy loss routinely involve materials with cooler temperatures than the warm object itself, materials which reduce the rate of energy loss.

I’ve purposely stayed away from arguments over the specific ways in which infrared radiation courses through the atmosphere so that I can make the more general point.

This issue is so basic I cannot fathom how seemingly intelligent people refuse to accept it, and are so militant in their attempts to refute it. I sometimes wonder whether they are funded by global warming alarmists to waste my time. 😉

More on Trenberth’s Missing Heat

Monday, April 8th, 2013

More on Trenberth’s Missing Heat

While I don’t necessarily buy Trenberth’s latest evidence for a lack of recent surface warming, I feel I need to first explain why Trenberth is correct that it is possible for the deep ocean to warm while surface warming is seemingly by-passed in the process.

Then I will follow up with observations which run counter to his (and his co-authors’) claim that an increase in ocean surface wind-driven mixing has caused the recent lack of global warming.

Can Deep Ocean Warming Bypass the Surface?

It depends on what one means by “warming”. A temperature change is the net result of multiple processes adding and subtracting heat. Warming of the deep ocean originally caused by radiative forcing of the climate system cannot literally bypass the surface without some effect on temperature. But that effect might be to keep some cooling process from causing an even steeper dive in temperature.

It’s like adding a pint of warm water, and a gallon of cold water, to a sink full of room temperature water. Did adding the pint of warm water cause the temperature in the sink to rise?

To appreciate this, we first need to understand the basic processes which maintain the vertical temperature distribution in the global oceans. The following cartoon shows a North-South cross section of measured ocean temperatures in the Atlantic.

ocean-mixing
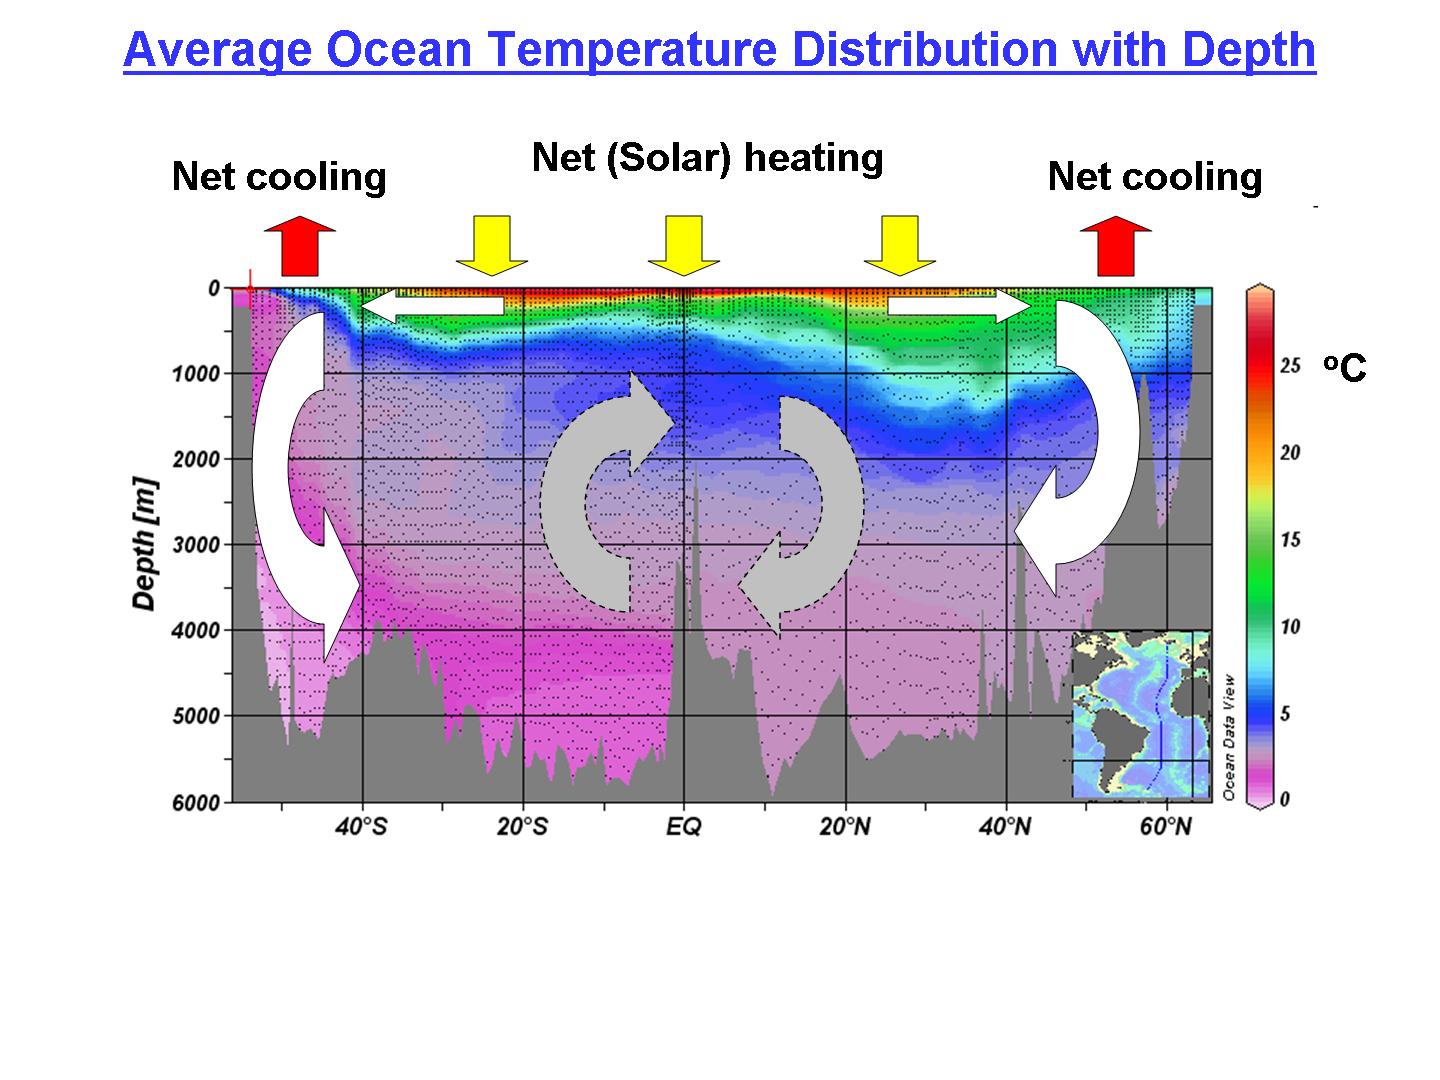
The average temperature distribution represents a balance between 3 major processes:

(1) surface heating by the sun (mitigated by surface evaporation and infrared radiative loss) which warms the relatively shallow ocean mixed layer;

(2) cold deepwater formation at high latitudes, which slowly sinks and fills up the oceans on time scales of centuries to millennia, and

(3) vertical mixing from wind-driven waves, the thermohaline circulation, and turbulence generated by flow over ocean bottom topography (the latter being partly driven by tidal forces).

The key thing to understand is that while processes (1) and (2) continuously act to INCREASE the temperature difference between the warm mixed layer and the cold deep ocean, the vertical mixing processes in (3) continuously act to DECREASE the temperature difference, that is, make the ocean more vertically uniform in temperature.

The average temperature distribution we see is the net result of these different, competing processes. And so, a change in ANY of these processes can cause surface warming or cooling, without any radiative forcing of the climate system whatsoever.

So, let’s look at a few ocean mixing scenarios in response to radiative forcing of the climate system (e.g. from increasing CO2, increasing sunlight, etc.), all theoretical:

Scenario 1) Warming with NO change in ocean mixing: It this case, surface warming is gradually mixed downward in the ocean, leading to warming trends that are a maximum at the ocean surface, but which decrease exponentially with depth.

Scenario 2) Warming with a SMALL increase in ocean mixing. This case will result in weaker surface warming, and slightly stronger warming of the deep ocean, both compared to Scenario 1. The warming still might decrease exponentially with depth.

Scenario 3) Warming with a LARGER increase in ocean mixing. This case could lead to an actual surface temperature decrease, but warming of the deep ocean, similar to what I believe Trenberth is claiming.

Yes, the surface waters “warmed” before the deep ocean in Scenario 3, but it was in the form of a weaker temperature drop than would have otherwise occurred.

Because of the immense heat capacity of the deep ocean, the magnitude of deep warming in Scenario 3 might only be thousandths of a degree. Whether we can measure such tiny levels of warming on the time scales of decades or longer is very questionable, and the new study co-authored by Trenberth is not entirely based upon observations, anyway.

I only bring this issue up because I think there are enough legitimate problems with global warming theory to not get distracted by arguing over issues which are reasonably well understood. It takes the removal of only one card to cause a house of cards to fall.

But it also points out how global warming or cooling can occur naturally, at least theoretically, from natural chaotic variations in the ocean circulation on long time scales. Maybe Trenberth believes the speedup in the ocean circulation is due to our driving SUVs and flipping on light switches. He has already stated that more frequent El Ninos are caused by anthropogenic global warming. (Except now they are less frequent — go figure).

In some sense, natural global warming and cooling events are made possible by the fact that we live within an exceedingly thin warm surface “skin” of a climate system in which most of the mass (the deep ocean) is exceedingly cold. Any variations in the heat exchange between those two temperature worlds (such as during El Nino with decreased mixing, or La Nina with increased mixing) can cause large changes in our thin-skinned world. It than sense, Trenberth is helping to point out a reason why climate can change naturally.

Have Ocean Winds Increased Recently?

Trenberth and co-authors claim that their modeling study suggests an increase in ocean surface winds since 2004 has led to greater mixing of heat down into the ocean, limiting surface warming.

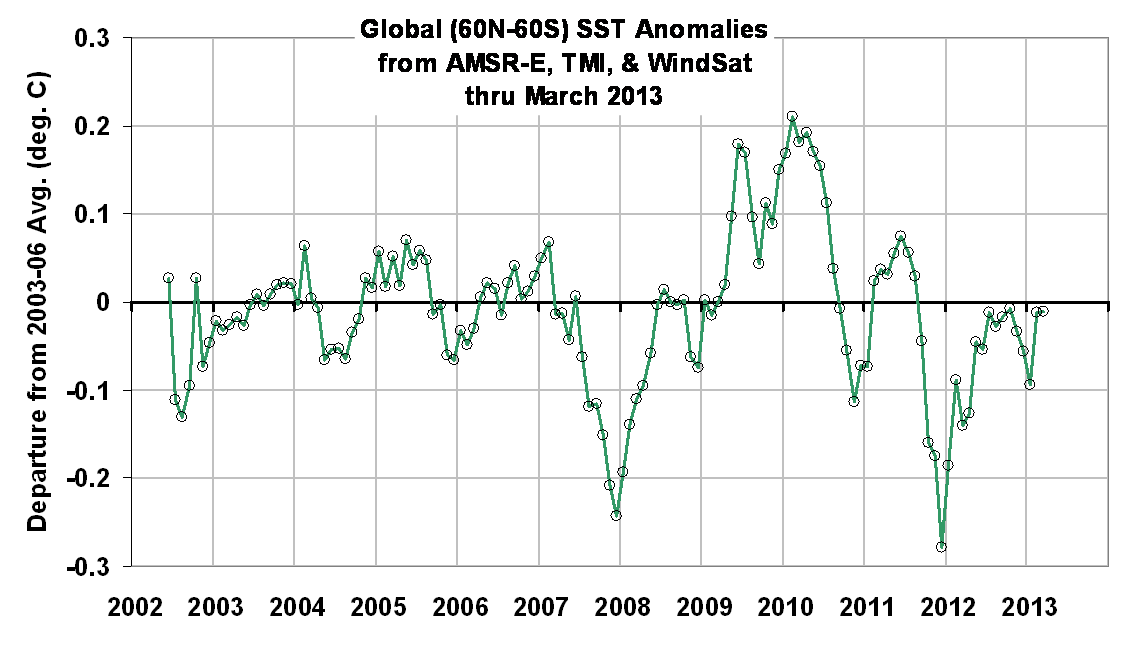
Fortunately, we can examine this claim with satellite observations. We have daily global measurements of ocean surface roughness and foam generation, calibrated in terms of an equivalent 10 meter height wind speed, from AMSR-E:
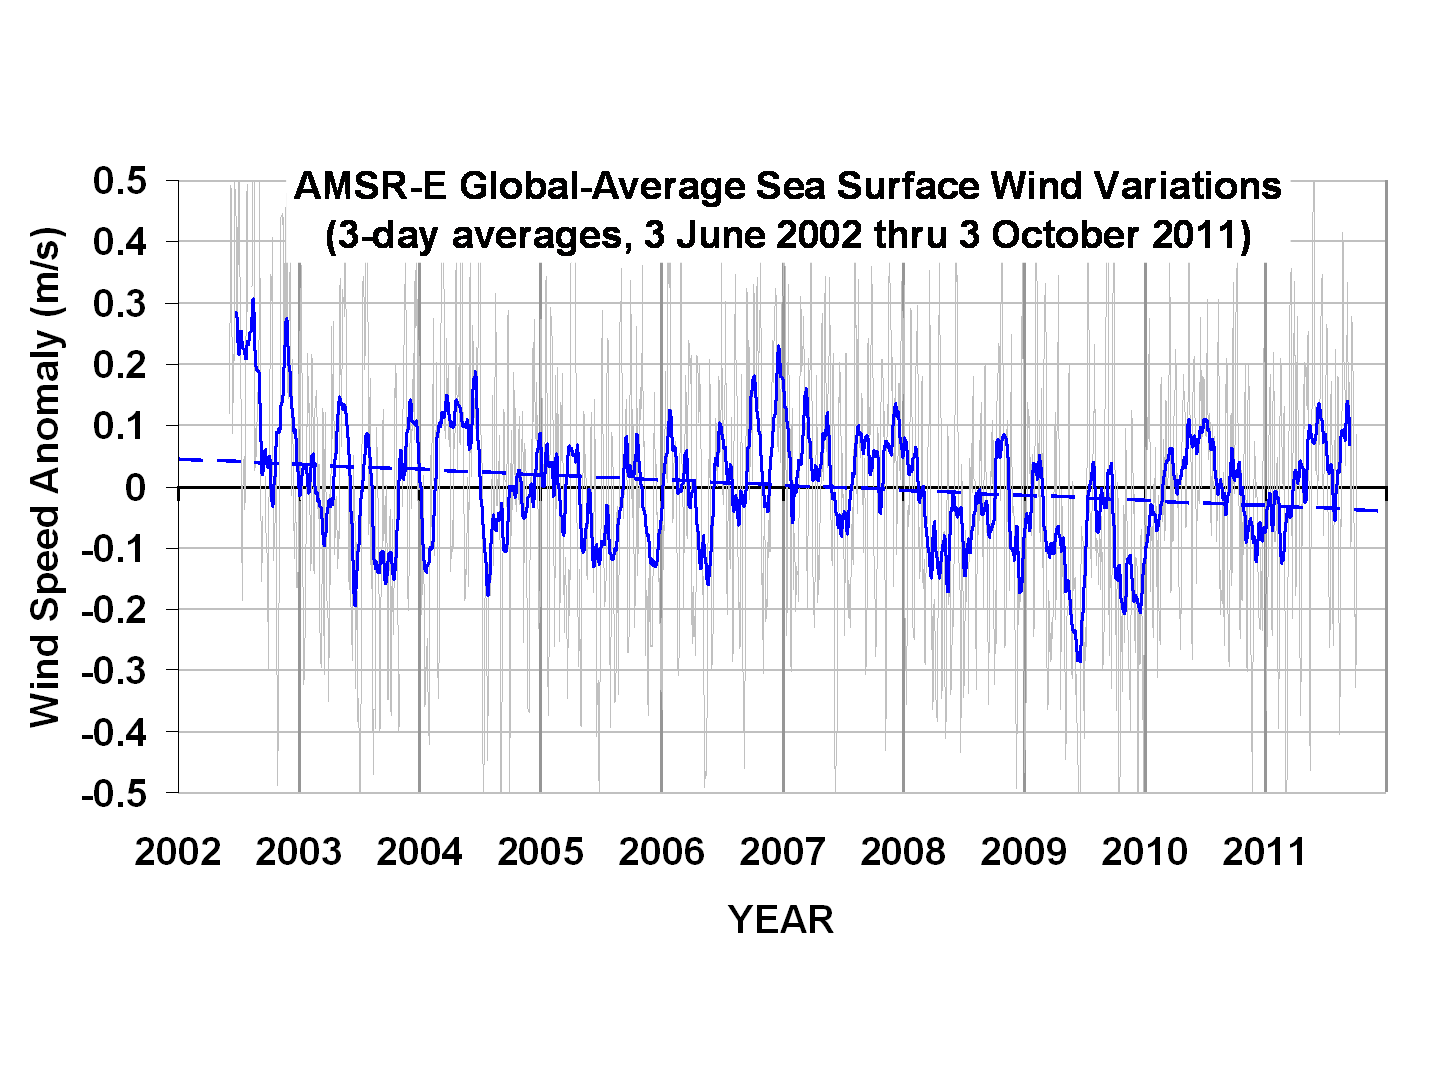
AMSR-E-ocean-surface-wind-anomalies
I don’t know about you, but I don’t see an increase in surface winds since 2004 in the above plot. This plot, which is based upon wind retrievals that have been compared to (as I recall) close to 1 million buoy observations, really needs to be extended back in time with SSM/I and SSMIS data, which would take it back to mid-1987. That’s on my to-do list.

So far, I would say that the so-called missing heat problem is not yet solved. I have argued before that I don’t think it actually exists, since the “missing heat” argument assumes that feedbacks in the climate system are positive and that radiative energy is accumulating in the system faster than surface warming would seem to support.

For the reasons outlined above, Trenberth’s view of deep ocean storage of the missing heat is still theoretically possible since increased vertical ocean mixing doesn’t have to be wind-driven. But I remain unconvinced by arguments that depend upon global deep ocean temperature changes being measured to an accuracy of hundredths or even thousandths of a degree.

Finally, as I have mentioned before, even if increased rate of mixing of heat downward is to blame for a recent lack of surface warming, the total energy involved in the warming of the deep oceans is smaller than that expected for a “sensitive” climate system. Plots of changes in ocean heat content since the 1950’s might look dramatic with an accumulation of gazillions of Joules, but the energy involved is only 1 part in 1,000 of the average energy flows in and out of the climate system. To believe this tiny energy imbalance is entirely manmade, and has never happened before, requires too much faith for even me to muster.

Stossel Show Video: Schmidt vs. Spencer

Monday, April 8th, 2013

Here’s a Youtube video of the Stossel segment on which Gavin Schmidt and I appeared on March 28.

Global Microwave Sea Surface Temperature Update for March, 2013: -0.01 deg. C

Tuesday, April 2nd, 2013

The satellite-based microwave global average sea surface temperature (SST) update for March 2013 is -0.01 deg. C, relative to the 2003-2006 average (click for large version):
RSS_mwSST_2002_thru_Mar_2013

The anomalies are computed relative to only 2003-2006 because those years were relatively free of El Nino and La Nina activity, which if included would cause temperature anomaly artifacts in other years. Thus, these anomalies cannot be directly compared to, say, the Reynolds anomalies which extend back to the early 1980s. Nevertheless, they should be useful for monitoring signs of recent ocean surface warming, which appears to have stalled since at least the early 2000’s. (For those who also track our lower tropospheric temperature [“LT”] anomalies, these SST anomalies average about 0.20 deg. C cooler since mid-2002).

The SST retrievals come from Remote Sensing Systems (RSS), and are based upon passive microwave observations of the ocean surface from AMSR-E on NASA’s Aqua satellite, the TRMM satellite Microwave Imager (TMI), and WindSat. While TMI has operated continuously through the time period (but only over the tropics and subtropics), AMSR-E stopped nominal operation in October 2011, after which Remote Sensing Systems patched in SST data from WindSat. The various satellite datasets have been carefully intercalibrated by RSS.

Despite the relatively short period of record, I consider this dataset to be the most accurate depiction of SST variability over the last 10+ years due to these instruments’ relative insensitivity to contamination by clouds and aerosols at 6.9 GHz and 10.7 GHz.

UAH Global Temperature Update for March 2013: +0.18 deg. C (again)

Monday, April 1st, 2013

Our Version 5.5 global average lower tropospheric temperature (LT) anomaly for March, 2013 is +0.18 deg. C, essentially unchanged from February (click for large version):
UAH_LT_1979_thru_Mar_2013_v5.5
Later I will post the microwave sea surface temperature update, but it is also unchanged from February.

The global, hemispheric, and tropical LT anomalies from the 30-year (1981-2010) average for the last 15 months are:

YR MON GLOBAL NH SH TROPICS
2012 1 -0.134 -0.065 -0.203 -0.256
2012 2 -0.135 +0.018 -0.289 -0.320
2012 3 +0.051 +0.119 -0.017 -0.238
2012 4 +0.232 +0.351 +0.114 -0.242
2012 5 +0.179 +0.337 +0.021 -0.098
2012 6 +0.235 +0.370 +0.101 -0.019
2012 7 +0.130 +0.256 +0.003 +0.142
2012 8 +0.208 +0.214 +0.202 +0.062
2012 9 +0.339 +0.350 +0.327 +0.153
2012 10 +0.333 +0.306 +0.361 +0.109
2012 11 +0.282 +0.299 +0.265 +0.172
2012 12 +0.206 +0.148 +0.264 +0.138
2013 1 +0.504 +0.555 +0.453 +0.371
2013 2 +0.175 +0.368 -0.018 +0.168
2013 3 +0.184 +0.332 +0.036 +0.221