UAH Global Temperature Update for March 2013: +0.18 deg. C (again)

April 1st, 2013 by Roy W. Spencer, Ph. D.

Our Version 5.5 global average lower tropospheric temperature (LT) anomaly for March, 2013 is +0.18 deg. C, essentially unchanged from February (click for large version):
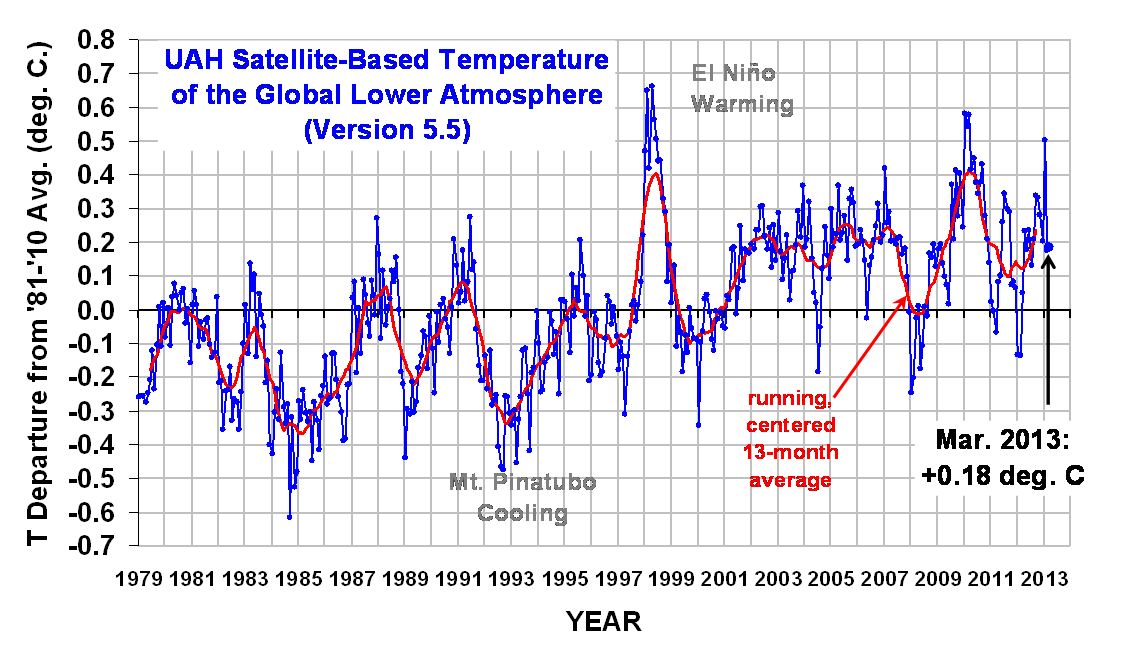
UAH_LT_1979_thru_Mar_2013_v5.5
Later I will post the microwave sea surface temperature update, but it is also unchanged from February.

The global, hemispheric, and tropical LT anomalies from the 30-year (1981-2010) average for the last 15 months are:

YR MON GLOBAL NH SH TROPICS
2012 1 -0.134 -0.065 -0.203 -0.256
2012 2 -0.135 +0.018 -0.289 -0.320
2012 3 +0.051 +0.119 -0.017 -0.238
2012 4 +0.232 +0.351 +0.114 -0.242
2012 5 +0.179 +0.337 +0.021 -0.098
2012 6 +0.235 +0.370 +0.101 -0.019
2012 7 +0.130 +0.256 +0.003 +0.142
2012 8 +0.208 +0.214 +0.202 +0.062
2012 9 +0.339 +0.350 +0.327 +0.153
2012 10 +0.333 +0.306 +0.361 +0.109
2012 11 +0.282 +0.299 +0.265 +0.172
2012 12 +0.206 +0.148 +0.264 +0.138
2013 1 +0.504 +0.555 +0.453 +0.371
2013 2 +0.175 +0.368 -0.018 +0.168
2013 3 +0.184 +0.332 +0.036 +0.221


23 Responses to “UAH Global Temperature Update for March 2013: +0.18 deg. C (again)”

Toggle Trackbacks

  1. Thanks, Dr. Spencer. I have updated your graph in my pages.

  2. Gordon Robertson says:

    Really appreciate your on-going graph, Roy. Use it all the time debating alarmists. I use the temperature contour maps as well to demonstrate visually that global warming is highly regional.

    Appreciate the running average as well.

  3. john parsons says:

    Dr. Roy, “…anomaly for March, 2013 is +0.18 deg. C, essentially unchanged from February.” Is that the same as saying “…continues to rise at the same rate as February”? JP

    • The Ghost Of Big Jim Cooley says:

      But February wasn’t a ‘rate rise’, was it? At 0.175 (with March being 0.184), it was actually down from January which was 0.504. Do you see? So Dr Spencer is correct in stating that it’s essentially unchanged. “…continues to rise at the same rate as February” is a nonsense – as February was DOWN on January. Mr Parsons, you have to be more clever than this if you want to make ‘smart’ comments.

      • john parsons says:

        Jim, The anomoly for March was slightly higher/equal to February. They both were rises in the anomaly. You’re confusing month over month comparison with monthly comparison to the anomaly. JP

        • Ray says:

          Both February and March anomalies were lower than January and the preceding six months anomalies. That is a fall in the anomalies, not a rise.
          The fact that the anomalies are still positive does not mean that they are rising, only that they are higher than the base period of 1981-2010.

  4. Dr. Dietrich Hovestadt says:

    Referring to the extreme cold March 2013 in all of Europe and great parts of Russia I wonder, why the NH average temperature anomaly is as high as +0,332 degree C. I had expected a low value. What is the reason?

    I greatly appreciate your permanent work on the Warming hoax.

    Best regards
    Dr. Dietrich Hpvestadt
    Physicist
    2.Apr.2013

  5. Roy Spencer says:

    testing.

  6. Tim Wells says:

    Since I worked for a Carbon Management company in 2006 and found man made global warming to be a hoax, there hasn’t been a decent summer and winters are going back to the 60’s, 70’s and 80’s. Coldest March in the UK since 1962 and a very long winter.

  7. Norman says:

    Kasuha and David Appell links, What it looks like is the atmospheric blocks in action. It seems a lot of the extreme weather is linked to these blocking patterns but they have not been studied much and so far I have read that Climate models do not model them well (where, when, why, duration etc).

    There is a running hypothesis at this time that a warmer arctic would lead to more atmospheric blocking patterns but so far, in my research, this does not appear a valid hypothesis since most blocking patterns happen in Spring and this is a time of extremes, with a very cold arctic and warmer southern air blowing in. There are less blocks in the summer months (overall). If the current hypothesis on blocks is correct, more should take place in the summer when the temperature extremes are much less, the jet stream slows way down in summer months.

    • Sven says:

      “There is a running hypothesis”. I’ve been wondering a few days now – whose hypothesis and based on what research is it? It’s now all over the news in Europe trying to explain the cold spell but without any reference to where they take it. Just “scientists say”… Do you, Norman, know where it comes from?

      • FundMe says:

        Read Hakkinen 2011 in Science or Jd Haigh 2010 published in Nature or if you can stomach junk science read Francis 2012.

        The 1960s had the worst blocking events on record with record high Arctic sea ice etc…strange old world.

      • Sven says:

        FundMe, thanks. But before I’ll look for them – are these references about the blocking events or about the influence of GW induced Arctic sea ice melt to atmospheric circulation patterns (or blocking)? It’s the latter that is now claimed and I’m interested about

      • Sven says:

        Found them but they do not really seem to be a source for the claim of “scientists say…” meme in the news. Hakkinen is about the blocking events and AMV, Haigh is more about the sun and Francis is about Arctic amplification’s effect to extreme events (and, as you hint, on the junk side)

  8. Dr. Spencer,

    Still February 2013 is showing at http://nsstc.uah.edu/climate/
    The text link points to http://nsstc.uah.edu/climate/2012/august/AUGUST-2012_map.jpg (August 2012).

  9. Ray says:

    Strange, WattsUpWithThat is showing whats looks remarkably like the March anomaly map.
    http://wattsupwiththat.files.wordpress.com/2013/04/march-2013-1.png

  10. Norman says:

    Sven,

    If you look at the two links I sent (above) and then read what is well established in the science of climate, the recent hypothesis is totally opposite of the established science (that based upon observation).

    http://userpages.umbc.edu/~tokay/chapter11new.html

    In this link: “Long waves in the midlatitudes are weaving westerlies that consist of north-south (meridional) and east-west (zonal) component. They are also called Rossby waves that are characterized by a long length (thousand of kilometers) and significant amplitude. Between two and five Rossby waves typically encircle the hemispheres.

    Rossby waves are more vigorous in winter than in summer. They exhibit fewer waves of longer length and greater amplitudes in winter than in summer. This is because of sharp temperature contrast, and therefore strong north-south pressure gradient in winter.”

    Higher temperature contrasts produce greater north/south amplitude of the jetstream. Arctic Amplification would actually lead to less intense blocking not more. Like FundMe stated about the 1960’s. I think some scientists should do a better job of researching their material before sending it all over the Internet and media.

  11. Audrey Sill says:

    An fascinating dialogue is value comment. I think that you need to write more on this topic, it may not be a taboo subject however generally people are not sufficient to talk on such topics. To the next. Cheers

  12. Thank you, I have just been searching for information about this subject for ages and yours is the greatest Ive came upon till now. However, what about the conclusion? Are you positive in regards to the source?

Leave a Reply