Archive for December, 2019

CMIP5 Model Atmospheric Warming 1979-2018: Some Comparisons to Observations

Thursday, December 12th, 2019

I keep getting asked about our charts comparing the CMIP5 models to observations, old versions of which are still circulating, so it could be I have not been proactive enough at providing updates to those. Since I presented some charts at the Heartland conference in D.C. in July summarizing the latest results we had as of that time, I thought I would reproduce those here.

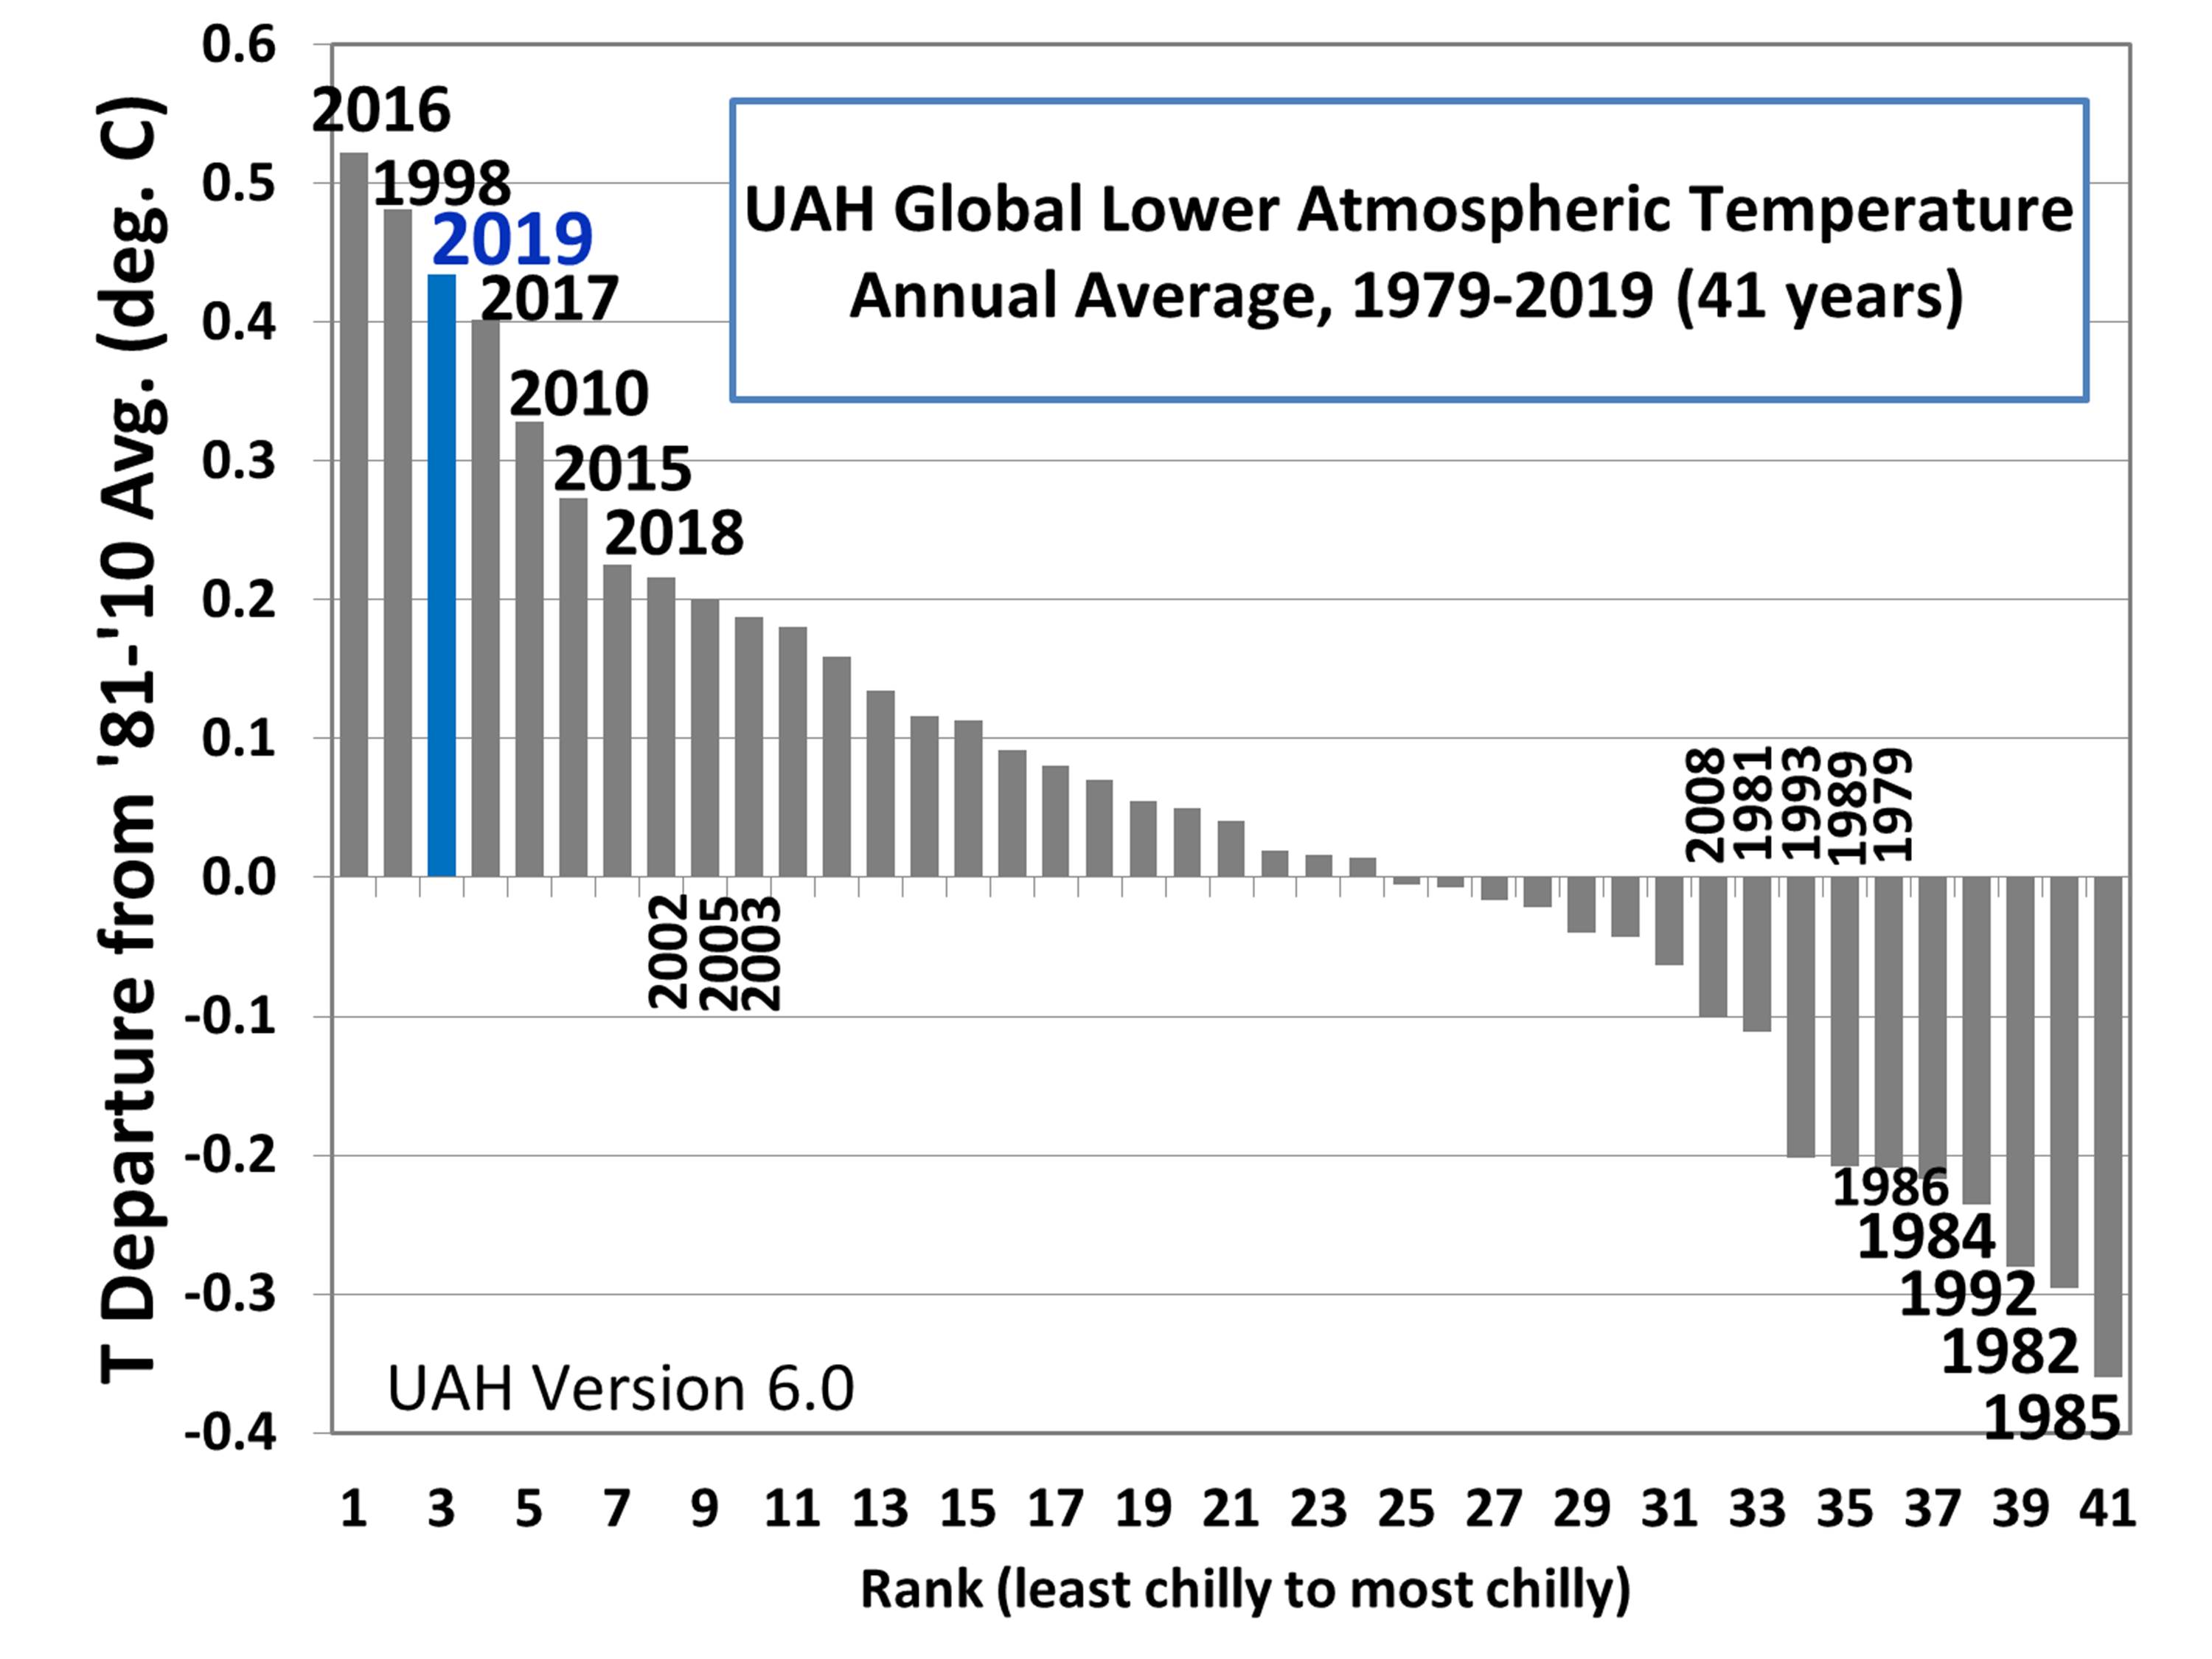
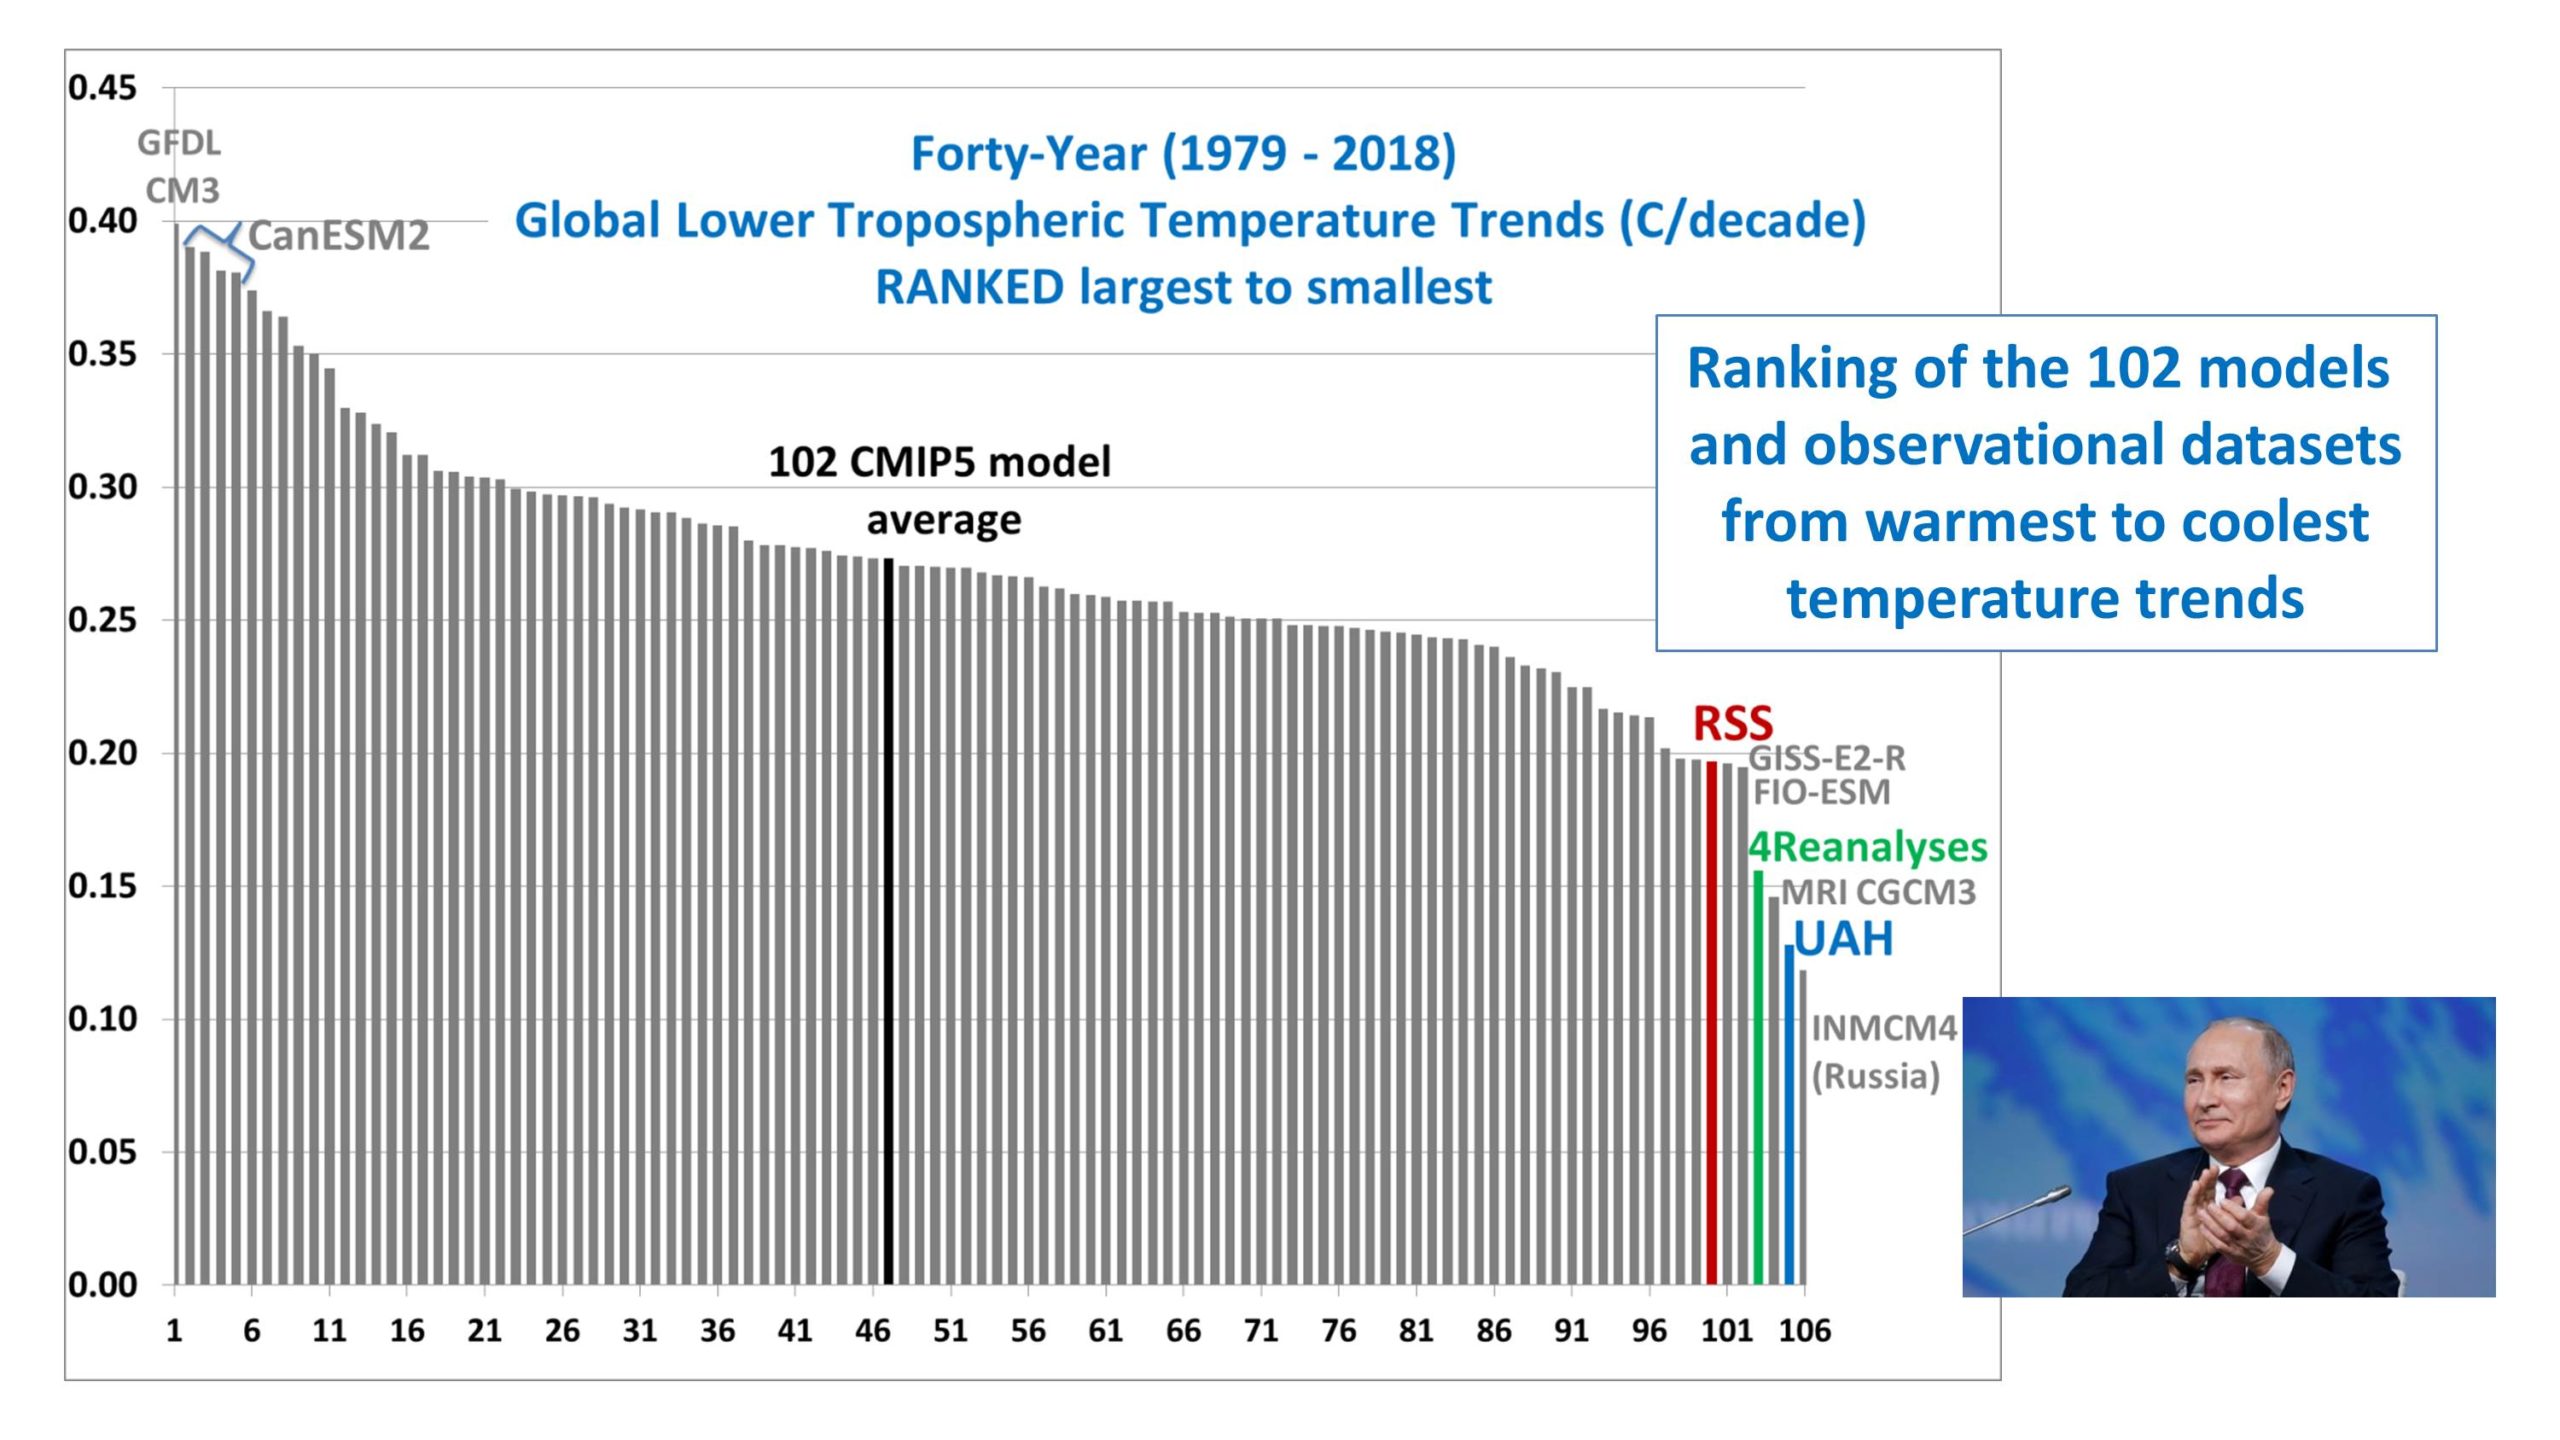
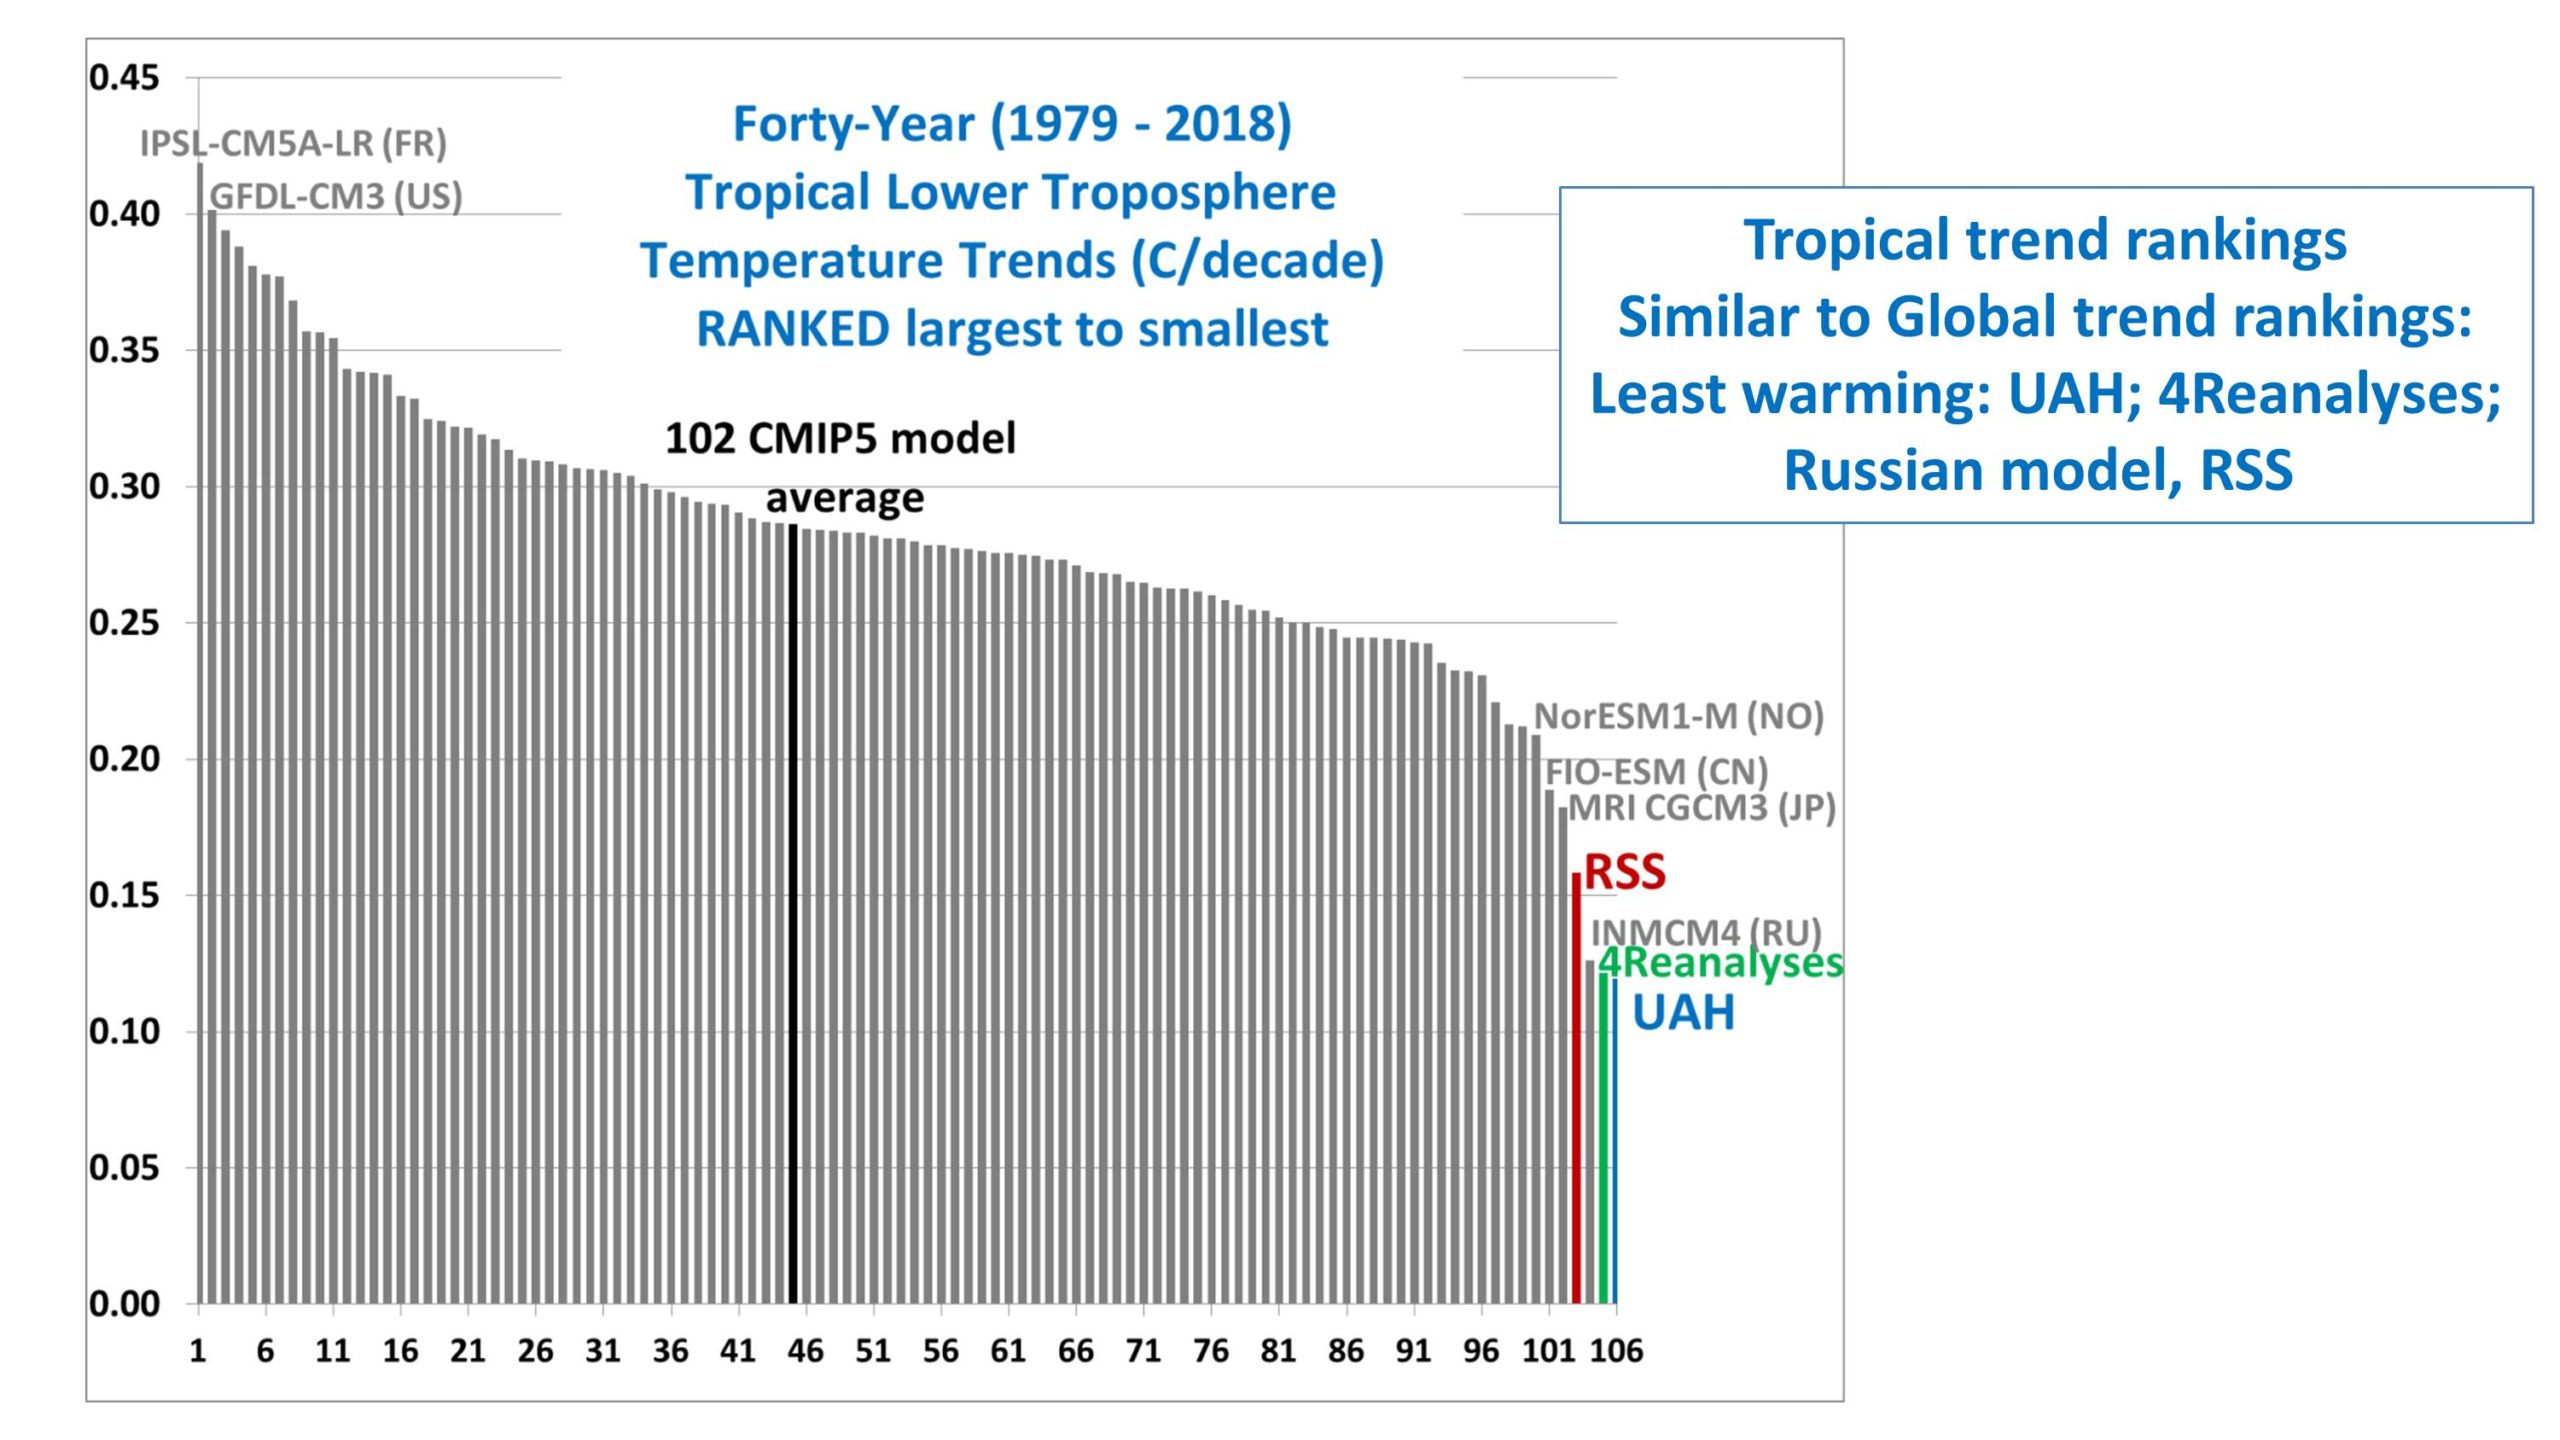
The following comparisons are for the lower tropospheric (LT) temperature product, with separate results for global and tropical (20N-20S). I also provide trend ranking “bar plots” so you can get a better idea of how the warming trends all quantitatively compare to one another (and since it is the trends that, arguably, matter the most when discussing “global warming”).

From what I understand, the new CMIP6 models are exhibiting even more warming than the CMIP5 models, so it sounds like when we have sufficient model comparisons to produce CMIP6 plots, the discrepancies seen below will be increasing.

Global Comparisons

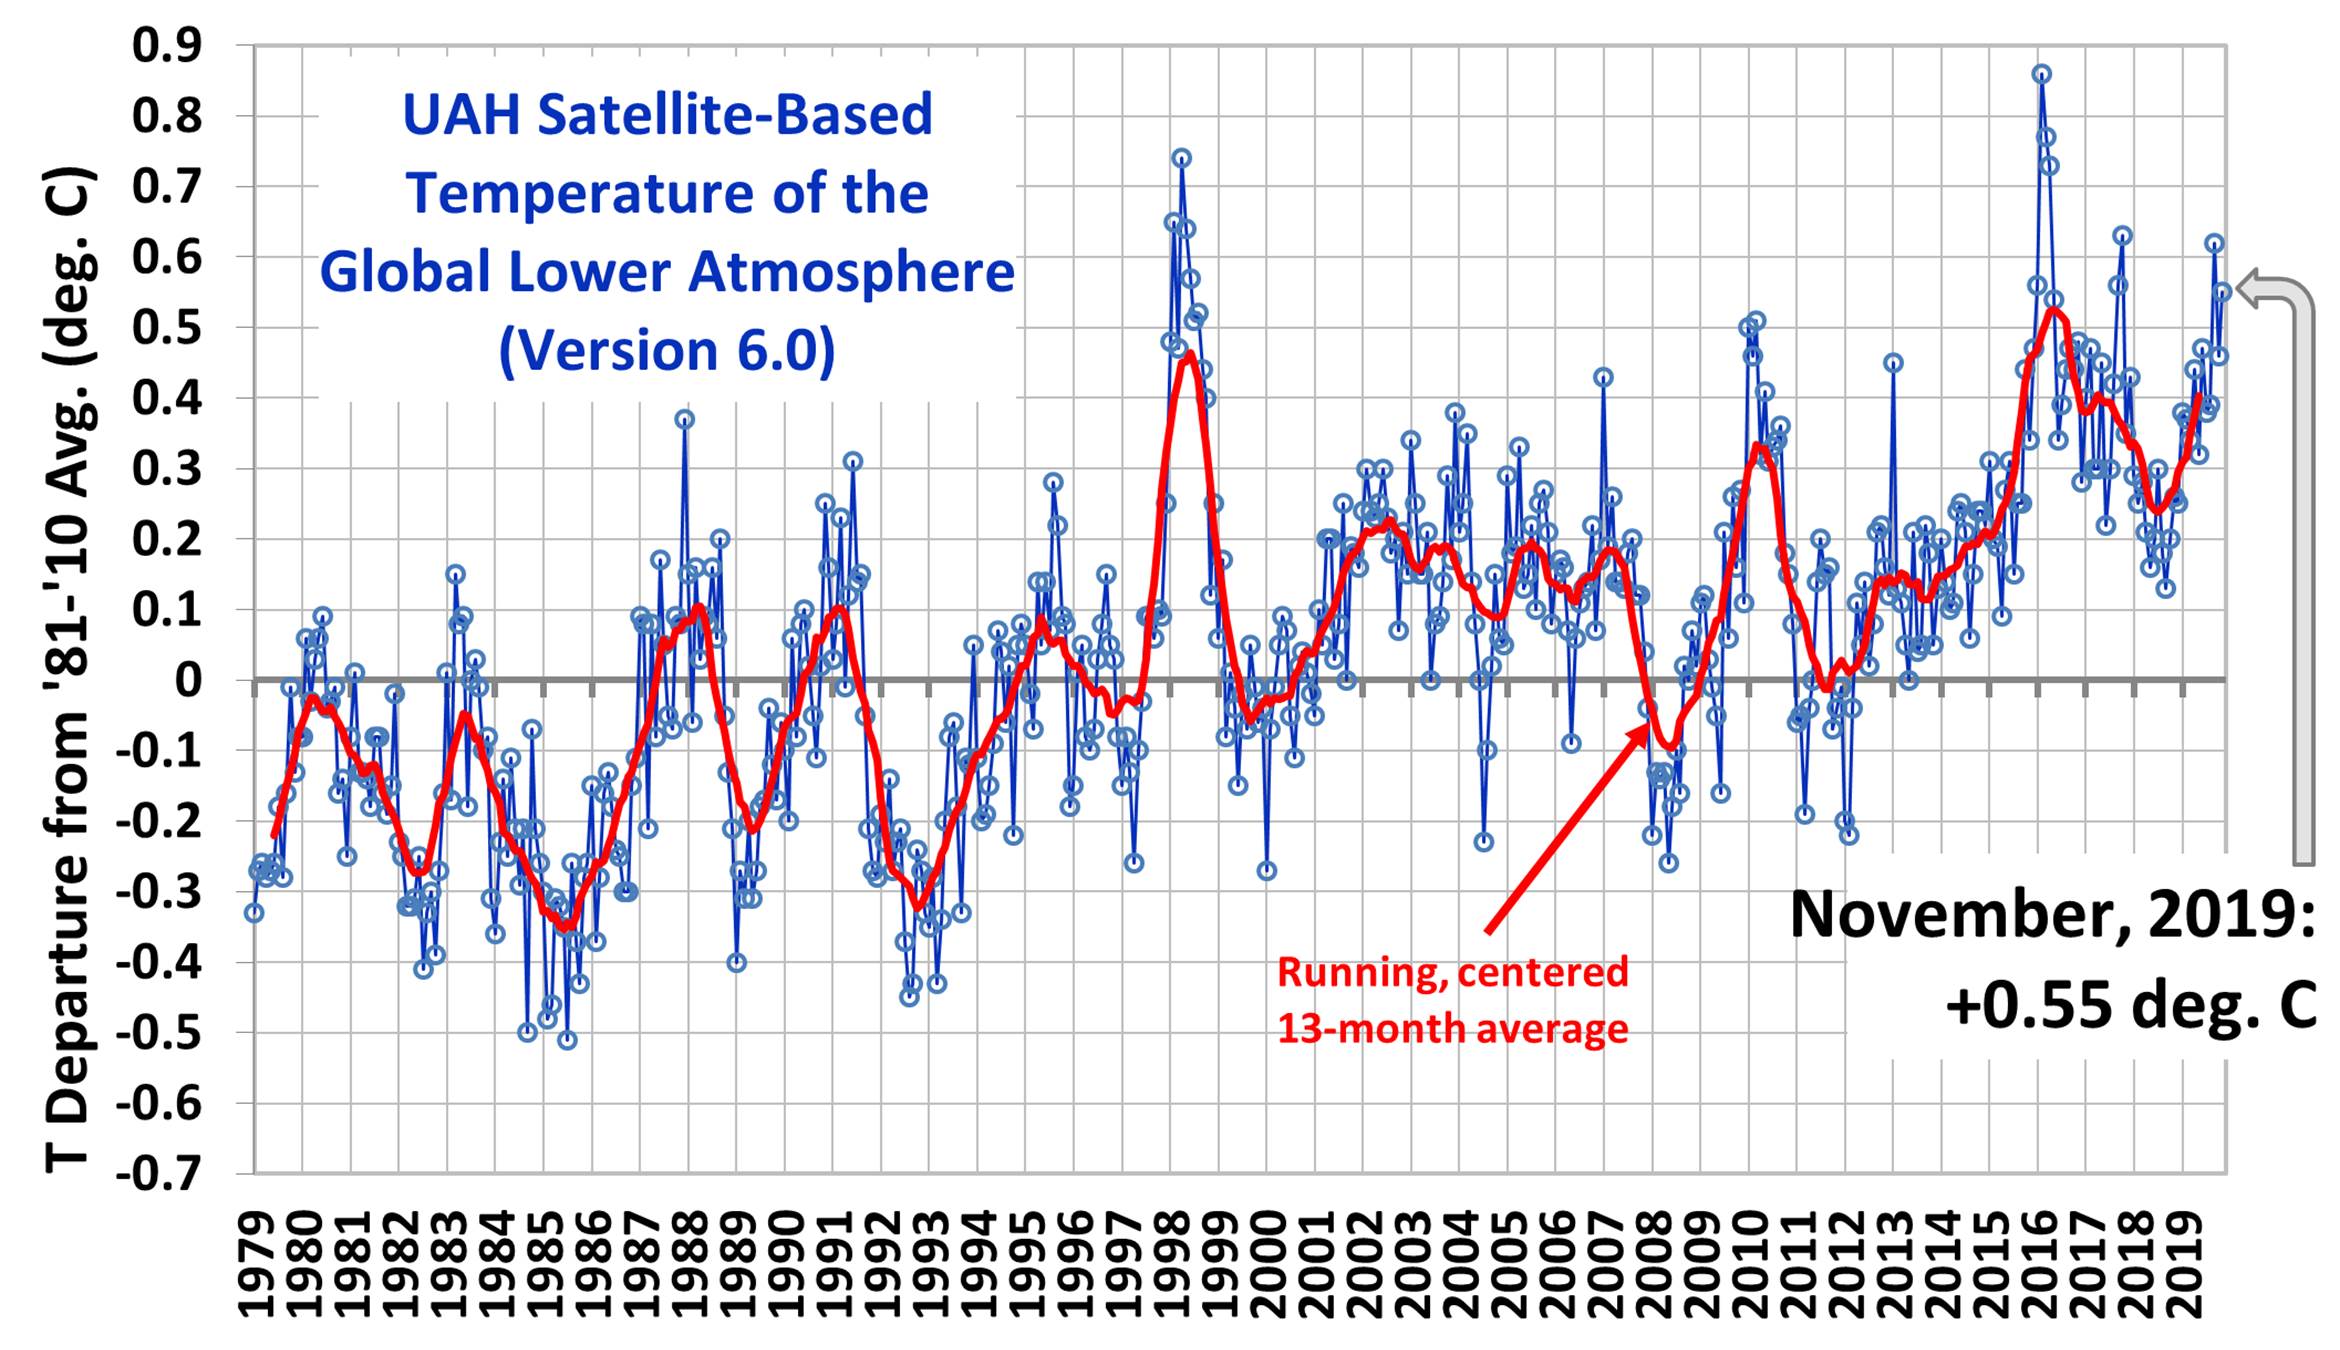
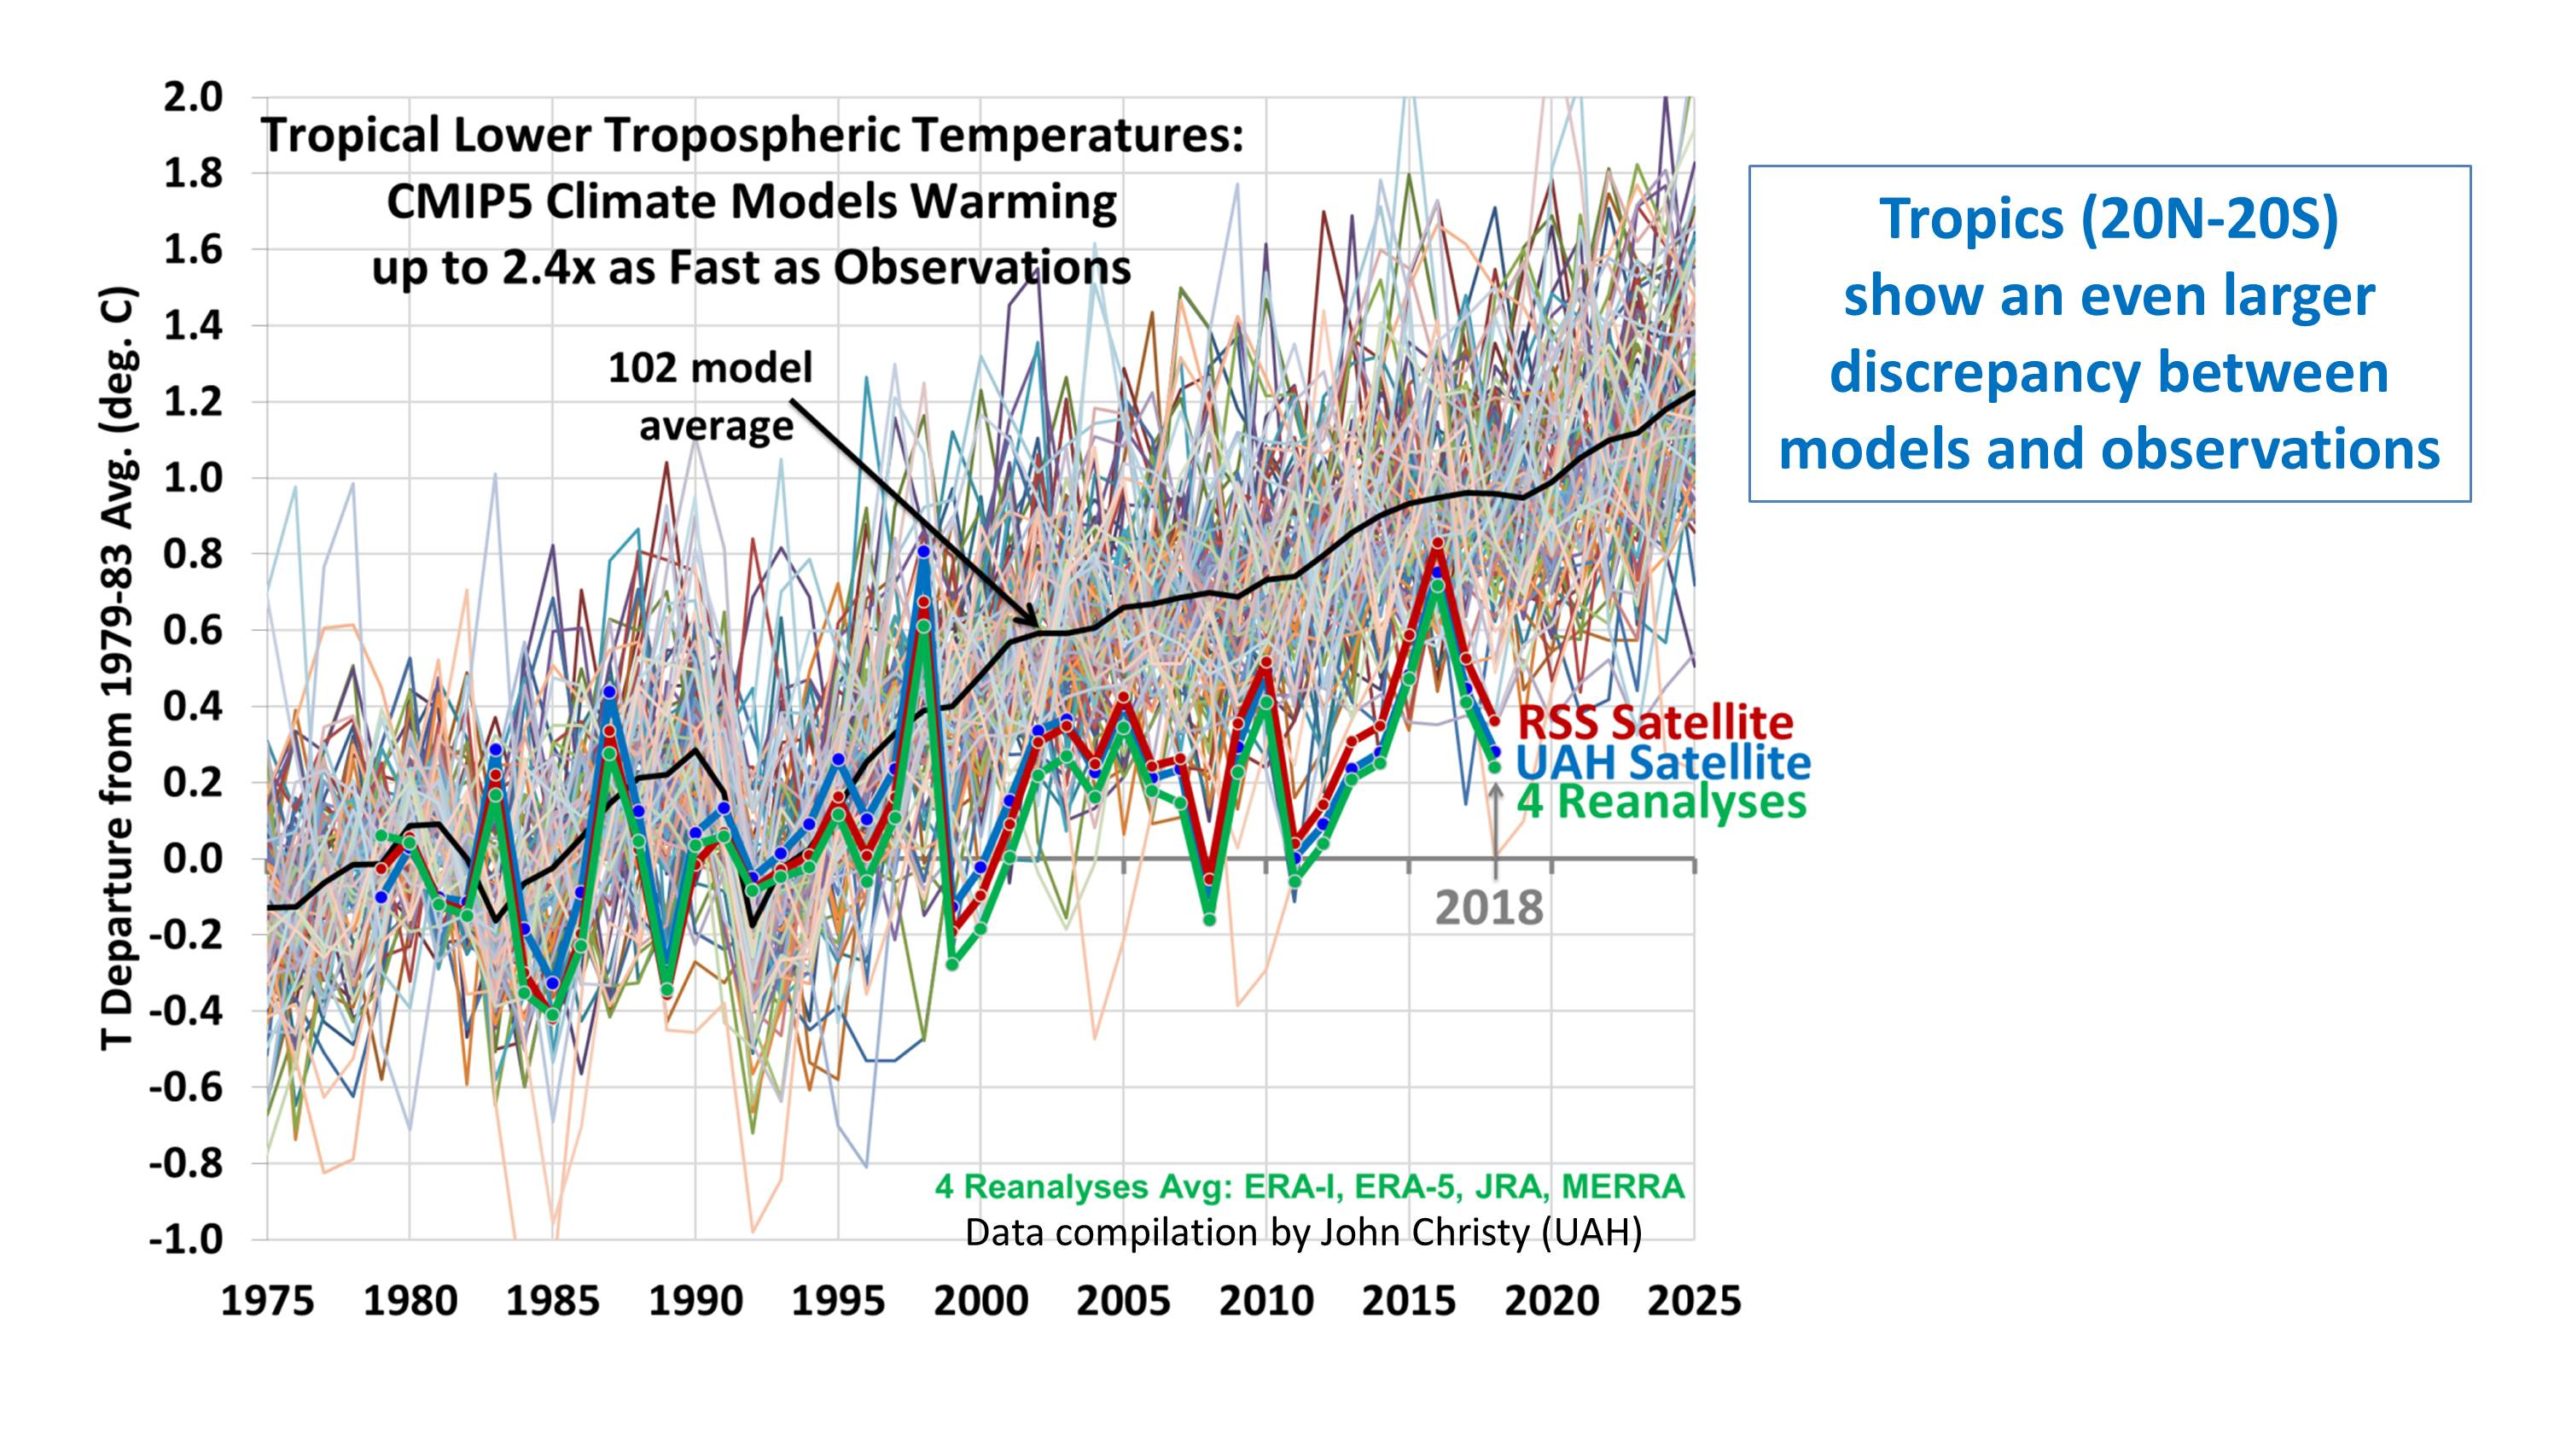
First is the plot of global LT anomaly time series, where I have averaged 4 reanalysis datasets together, but kept the RSS and UAH versions of the satellite-only datasets separate. (Click on images to get full-resolution versions).

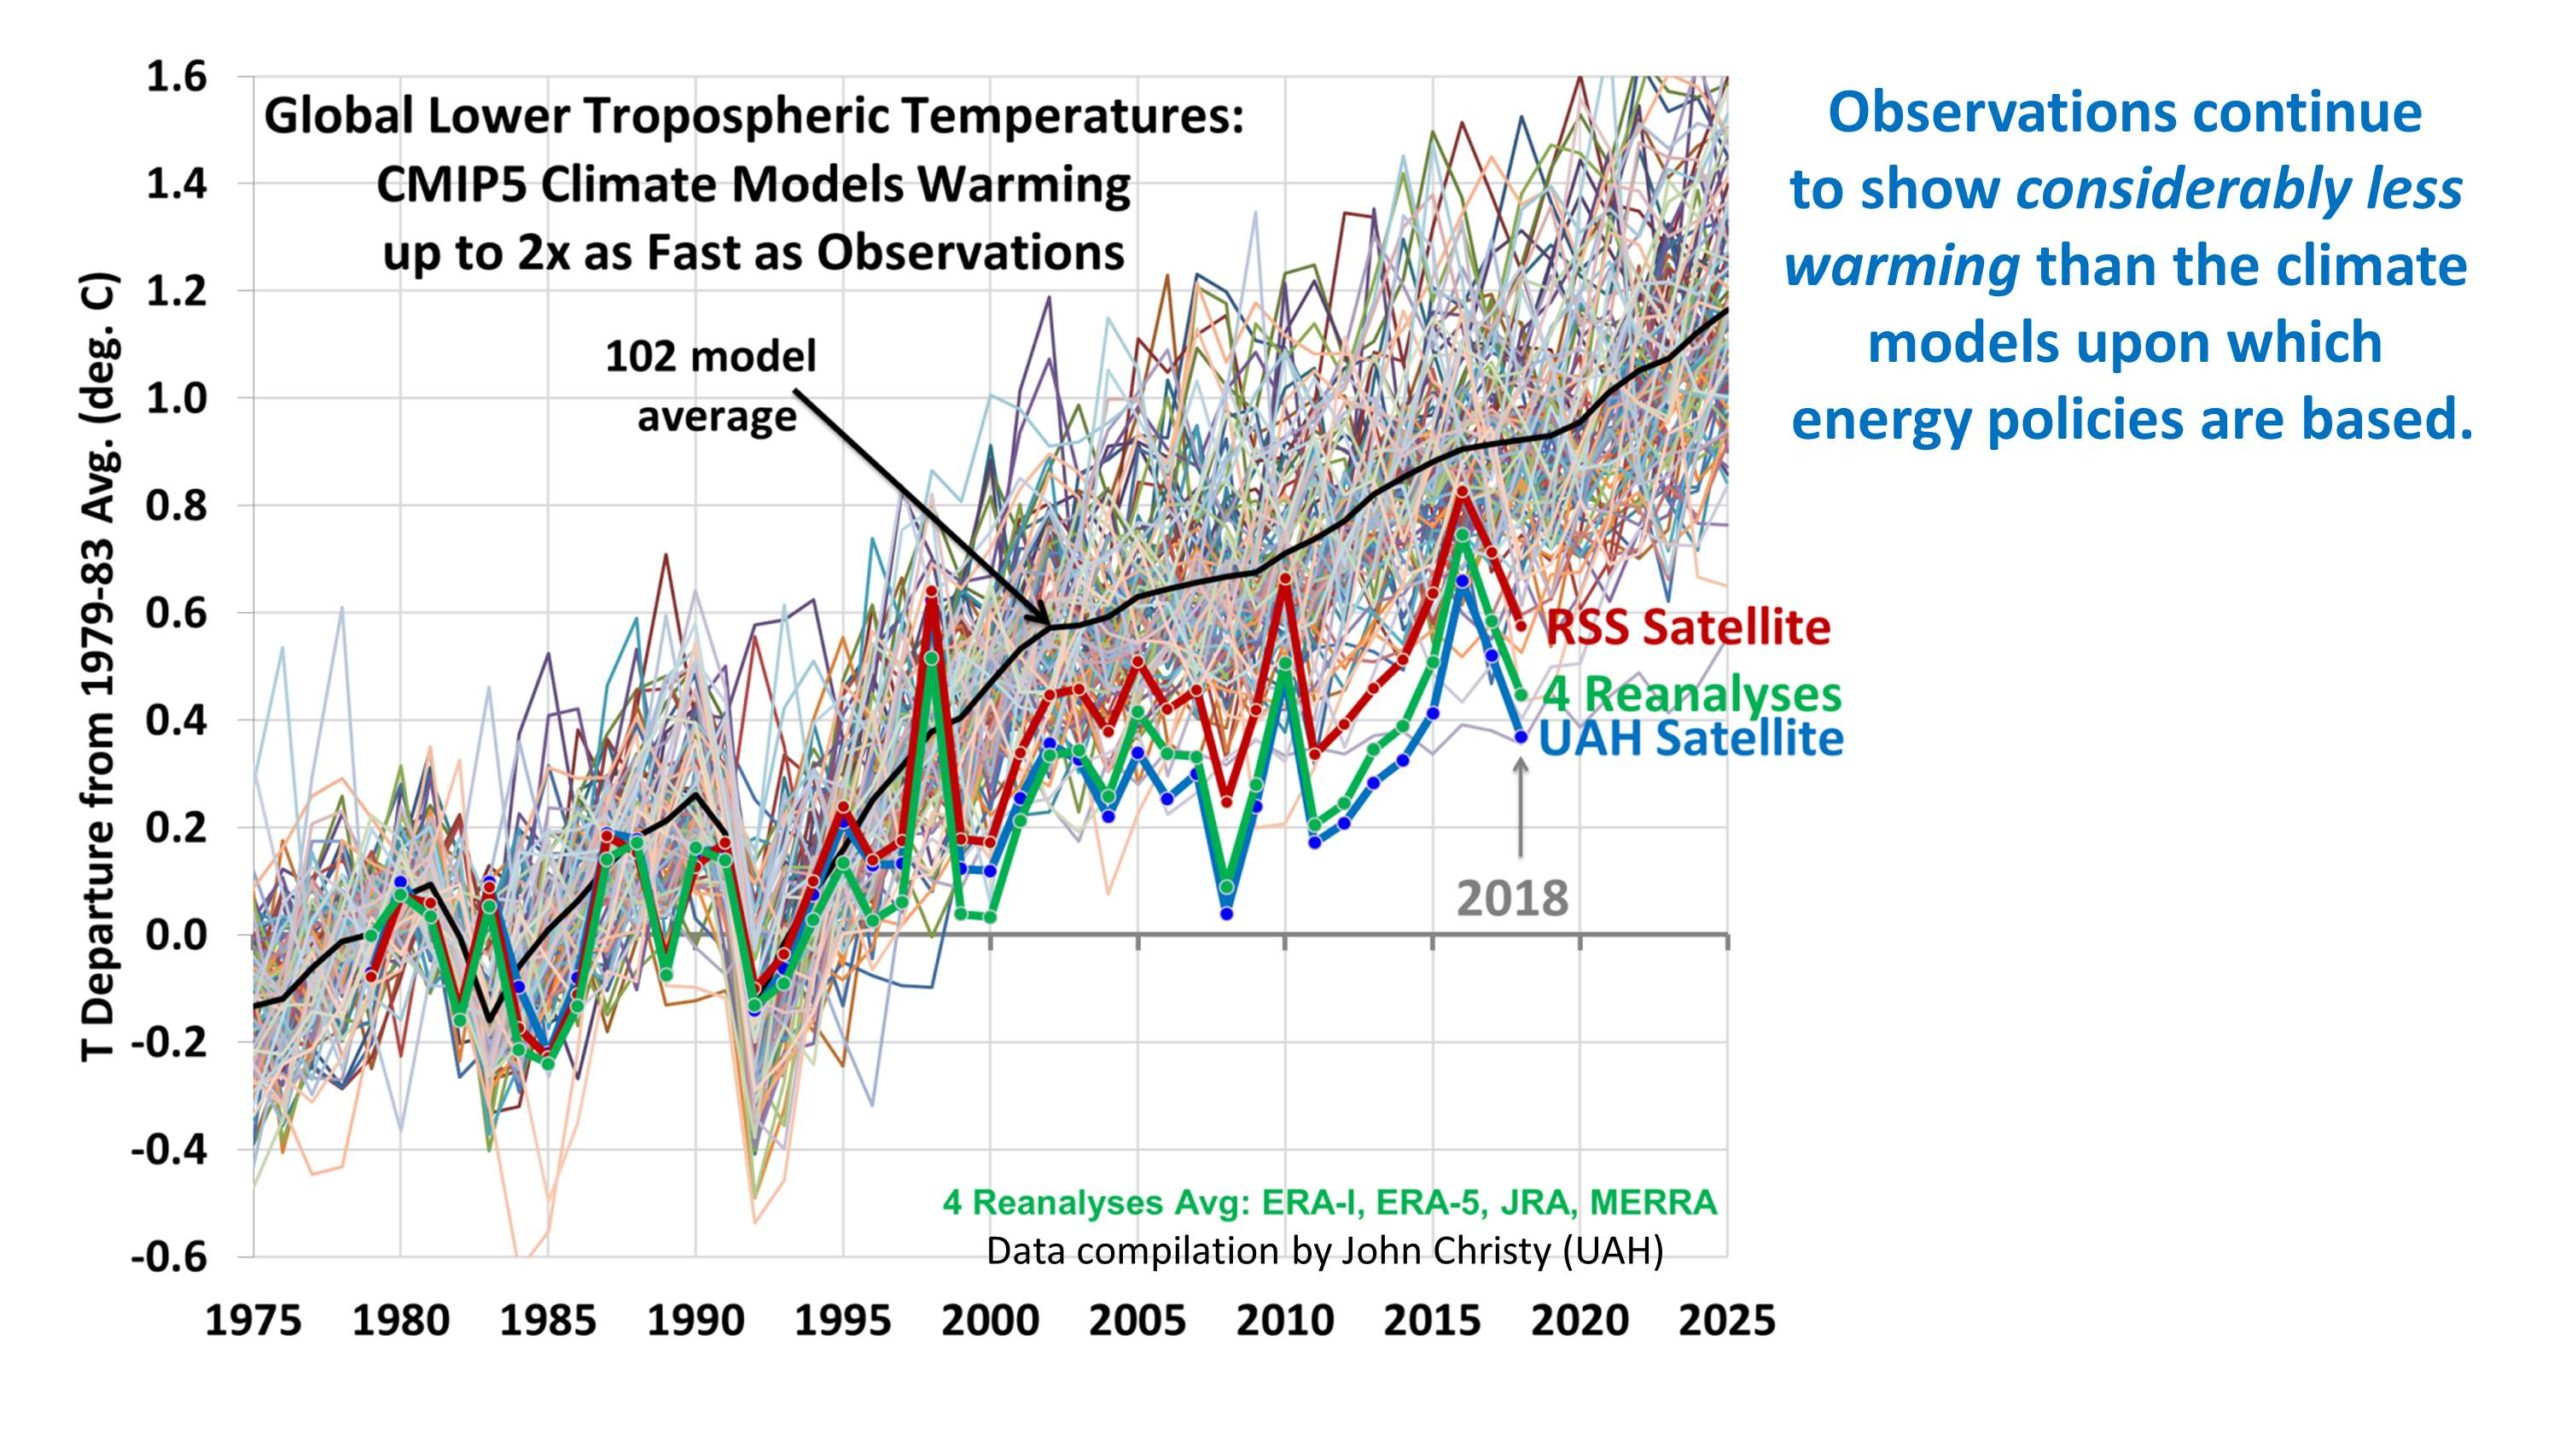
The ranking of the trends in that figure shows that only the Russian model has a lower trend than UAH, with the average of the 4 reanalysis datasets not far behind. I categorically deny any Russian involvement in the resulting agreement between the UAH trend and the Russian model trend, no matter what dossier might come to light.

Tropical Comparisons

Next is the tropical (20N-20S) comparisons, where we now see closer agreement between the UAH and RSS satellite-only datasets, as well as the reanalyses.

I still believe that the primary cause of the discrepancies between models and observations is that the feedbacks in the models are too strongly positive. The biggest problem most likely resides in how the models handle moist convection and precipitation efficiency, which in turn affects how upper tropospheric cloud amounts and water vapor respond to warming. This is related to Richard Lindzen’s “Infrared Iris” effect, which has not been widely accepted by the mainstream climate research community.

Another possibility, which Will Happer and others have been exploring, is that the radiative forcing from CO2 is not as strong as is assumed in the models.

Finally, one should keep in mind that individual climate models still have their warming rates adjusted in a rather ad hoc fashion through their assumed history of anthropogenic aerosol forcing, which is very uncertain and potentially large OR small.

Comment Posting Issues

Wednesday, December 11th, 2019

I continue to have comment posting problems here.

First, I did an update of all the WordPress plugins a couple days ago, and I immediately became locked out of the website. I could not even ftp in to disable the plugins. The web hosting company had to restore my access.

Secondly, some people have noted that their comments are held for moderation for no apparent reason. This has been a continuing problem for a long time. I have a limited number of key words and people I automatically screen out, but there are many more cases where there is no apparent reason for the comment to be rejected.

If you have the latter problem, try posting your comment in parts (Part 1 of 3, Part 2 of 3…). Let me know by email when you have a small section of comment that will not post so I can see what might be tripping the filter. (I see a LOT of actual spam that has as little as one sentence of irrelevant content, and I have no idea how the algorithm flagged it.) Anthony Watts once told me he has similar problems.

Sorry for the difficulties.

2019 the Third Least-Chilly in the Satellite Temperature Record

Friday, December 6th, 2019
People’s Climate March in Denver, CO on April 29, 2017 (CNN).

It’s that time of year again, when we are subjected to exaggerated climate claims such as in this Forbes article, 2019 Wraps Up The Hottest Decade In Recorded Human History. Given that the global average surface temperature is about 60 deg. F, and most of the climate protesters we see in the news are wearing more clothing than the average Key West bar patron, I would think that journalists striving for accuracy would use a more accurate term than “hottest”.

So, I am announcing that in our 41-year record of global satellite measurements of the lower atmosphere, 2019 will come in as 3rd least-chilly.

For the decade 2010-2019, the satellite temperatures averaged only 0.15 C higher than in the previous decade (2000-2009). That’s less than a third of a degree F, which no one would even notice over 10 years.

If you are wondering how your neck of the woods has fared this year, the latest year-to-date plot of 2019 temperature departures from the 30-year average (1981-2010) shows the usual pattern of above- and below-normal, with little visual indication that the global average for 2019 is now running 0.36 deg. C above normal.

Latest 2019 year-to-date average surface temperature departures from the 1981-2010 average from the NCEP CFSv2 global data assimilation system (graphic courtesy of Weatherbell.com).

The use of the term “hottest” to describe recent warming belies the fact that the rate of warming we have experienced in recent decades is minuscule compared to the several tens of degrees of temperature change most people experience throughout the year — and sometimes from one week to the next.

So, how are we supposed to react when the arithmetically-averaged temperature, across all extremes, goes up by only a small fraction of a degree in ten years? With horror? Outrage? Is the term “hottest” in a headline supposed to move us? Seriously?

Should we all get someone to fly across the Atlantic so they can transport us to Europe on a luxury yacht to help Save the Earth™ on our next European vacation?

The click-bait journalism typified by terms like “hottest”, “climate emergency”, and now “climate catastrophe” helps explain why the public is largely indifferent to the global warming issue, at least if we are asked to spend more than a few dollars to fix it.

This is why the alarmist narrative has moved on from temperature, and now focuses on wildfires, droughts, floods, hurricanes, snowstorms, and sea level rise. Yet, none of these have worsened in the last 100 years, with the exception of global sea level rise which has been occurring at a rate of about 1 inch per decade for as long as it has been monitored (since the 1850s, well before humans could be blamed).

And, just in case some new visitors to my blog are reading this, let me clarify that I am not a denier of human-caused climate change. I believe at least some of the warming we have experienced in the last 50 years has been due to increasing carbon dioxide. I just consider the fraction of warming attributable to humans to be uncertain, and probably largely benign.

This is fully consistent with the science, since the global energy imbalance necessary to explain recent warming (about 1 part in 250 of the natural energy flows in and out of the climate system) is much smaller than our knowledge of those flows, either from either theoretical first principles or from observations.

In other words, recent warming might well be mostly natural.

We just don’t know.

UAH Global Temperature Update for November 2019: +0.55 deg. C

Monday, December 2nd, 2019

The Version 6.0 global average lower tropospheric temperature (LT) anomaly for November, 2019 was +0.55 deg. C, up from the October value of +0.46 deg. C.

The linear warming trend since January, 1979 remains at +0.13 C/decade (+0.11 C/decade over the global-averaged oceans, and +0.18 C/decade over global-averaged land).

Various regional LT departures from the 30-year (1981-2010) average for the last 23 months are:

YEAR MO GLOBE NHEM. SHEM. TROPIC USA48 ARCTIC AUST
2018 01 +0.29 +0.52 +0.06 -0.10 +0.70 +1.39 +0.52
2018 02 +0.25 +0.28 +0.21 +0.05 +0.99 +1.22 +0.35
2018 03 +0.28 +0.43 +0.12 +0.08 -0.19 -0.32 +0.76
2018 04 +0.21 +0.32 +0.09 -0.14 +0.06 +1.02 +0.84
2018 05 +0.16 +0.38 -0.05 +0.01 +1.90 +0.14 -0.24
2018 06 +0.20 +0.33 +0.06 +0.12 +1.11 +0.77 -0.41
2018 07 +0.30 +0.38 +0.22 +0.28 +0.41 +0.24 +1.49
2018 08 +0.18 +0.21 +0.16 +0.11 +0.02 +0.11 +0.37
2018 09 +0.13 +0.14 +0.13 +0.22 +0.89 +0.23 +0.27
2018 10 +0.20 +0.27 +0.12 +0.30 +0.20 +1.08 +0.43
2018 11 +0.26 +0.24 +0.28 +0.45 -1.16 +0.68 +0.55
2018 12 +0.25 +0.35 +0.15 +0.30 +0.25 +0.69 +1.20
2019 01 +0.38 +0.35 +0.41 +0.36 +0.53 -0.15 +1.15
2019 02 +0.37 +0.47 +0.28 +0.43 -0.02 +1.04 +0.05
2019 03 +0.35 +0.44 +0.25 +0.41 -0.55 +0.97 +0.59
2019 04 +0.44 +0.38 +0.51 +0.54 +0.50 +0.92 +0.91
2019 05 +0.32 +0.30 +0.35 +0.40 -0.61 +0.98 +0.38
2019 06 +0.47 +0.42 +0.52 +0.64 -0.64 +0.91 +0.35
2019 07 +0.38 +0.33 +0.44 +0.45 +0.11 +0.33 +0.87
2019 08 +0.39 +0.38 +0.39 +0.42 +0.17 +0.44 +0.24
2019 09 +0.62 +0.64 +0.59 +0.60 +1.14 +0.75 +0.57
2019 10 +0.46 +0.64 +0.27 +0.31 -0.03 +0.99 +0.50
2019 11 +0.55 +0.56 +0.54 +0.55 +0.22 +0.56 +0.38

The UAH LT global anomaly image for November, 2019 should be available in the next few days here.

The global and regional monthly anomalies for the various atmospheric layers we monitor should be available in the next few days at the following locations:

Lower Troposphere: http://vortex.nsstc.uah.edu/data/msu/v6.0/tlt/uahncdc_lt_6.0.txt
Mid-Troposphere: http://vortex.nsstc.uah.edu/data/msu/v6.0/tmt/uahncdc_mt_6.0.txt
Tropopause: http://vortex.nsstc.uah.edu/data/msu/v6.0/ttp/uahncdc_tp_6.0.txt
Lower Stratosphere: http://vortex.nsstc.uah.edu/data/msu/v6.0/tls/uahncdc_ls_6.0.txt