I keep getting asked about our charts comparing the CMIP5 models to observations, old versions of which are still circulating, so it could be I have not been proactive enough at providing updates to those. Since I presented some charts at the Heartland conference in D.C. in July summarizing the latest results we had as of that time, I thought I would reproduce those here.
The following comparisons are for the lower tropospheric (LT) temperature product, with separate results for global and tropical (20N-20S). I also provide trend ranking “bar plots” so you can get a better idea of how the warming trends all quantitatively compare to one another (and since it is the trends that, arguably, matter the most when discussing “global warming”).
From what I understand, the new CMIP6 models are exhibiting even more warming than the CMIP5 models, so it sounds like when we have sufficient model comparisons to produce CMIP6 plots, the discrepancies seen below will be increasing.
Global Comparisons
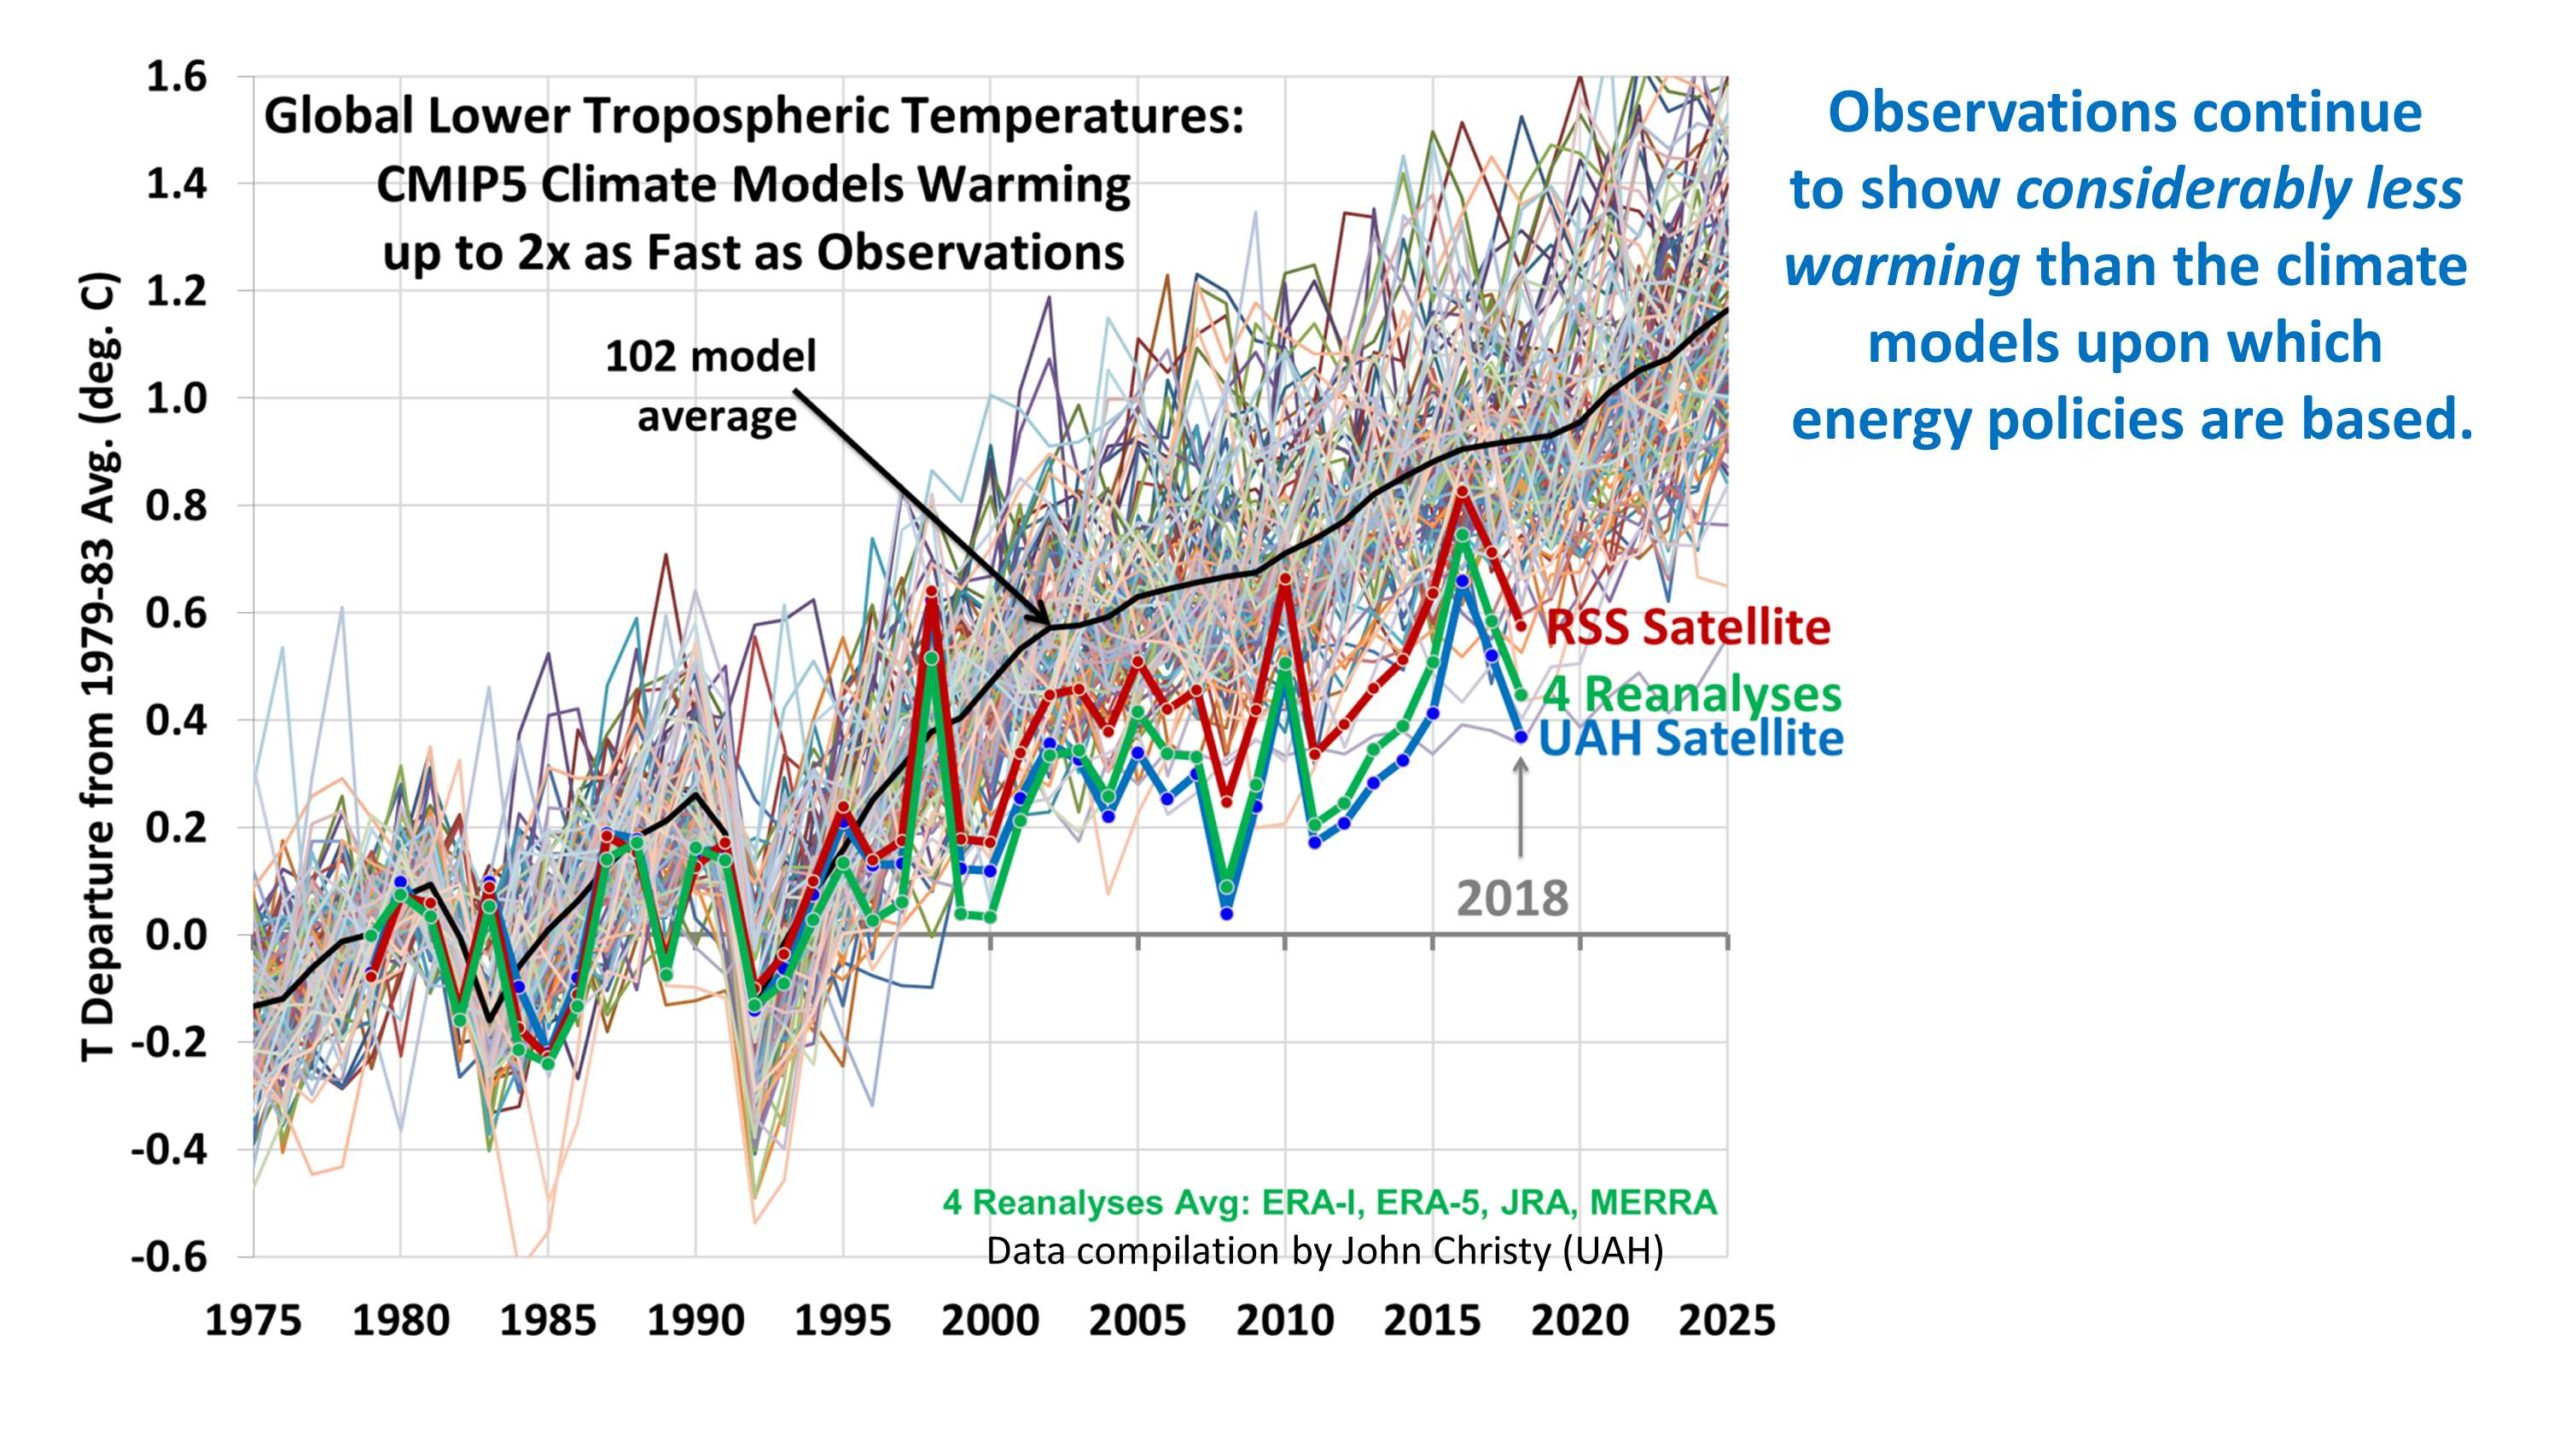
First is the plot of global LT anomaly time series, where I have averaged 4 reanalysis datasets together, but kept the RSS and UAH versions of the satellite-only datasets separate. (Click on images to get full-resolution versions).

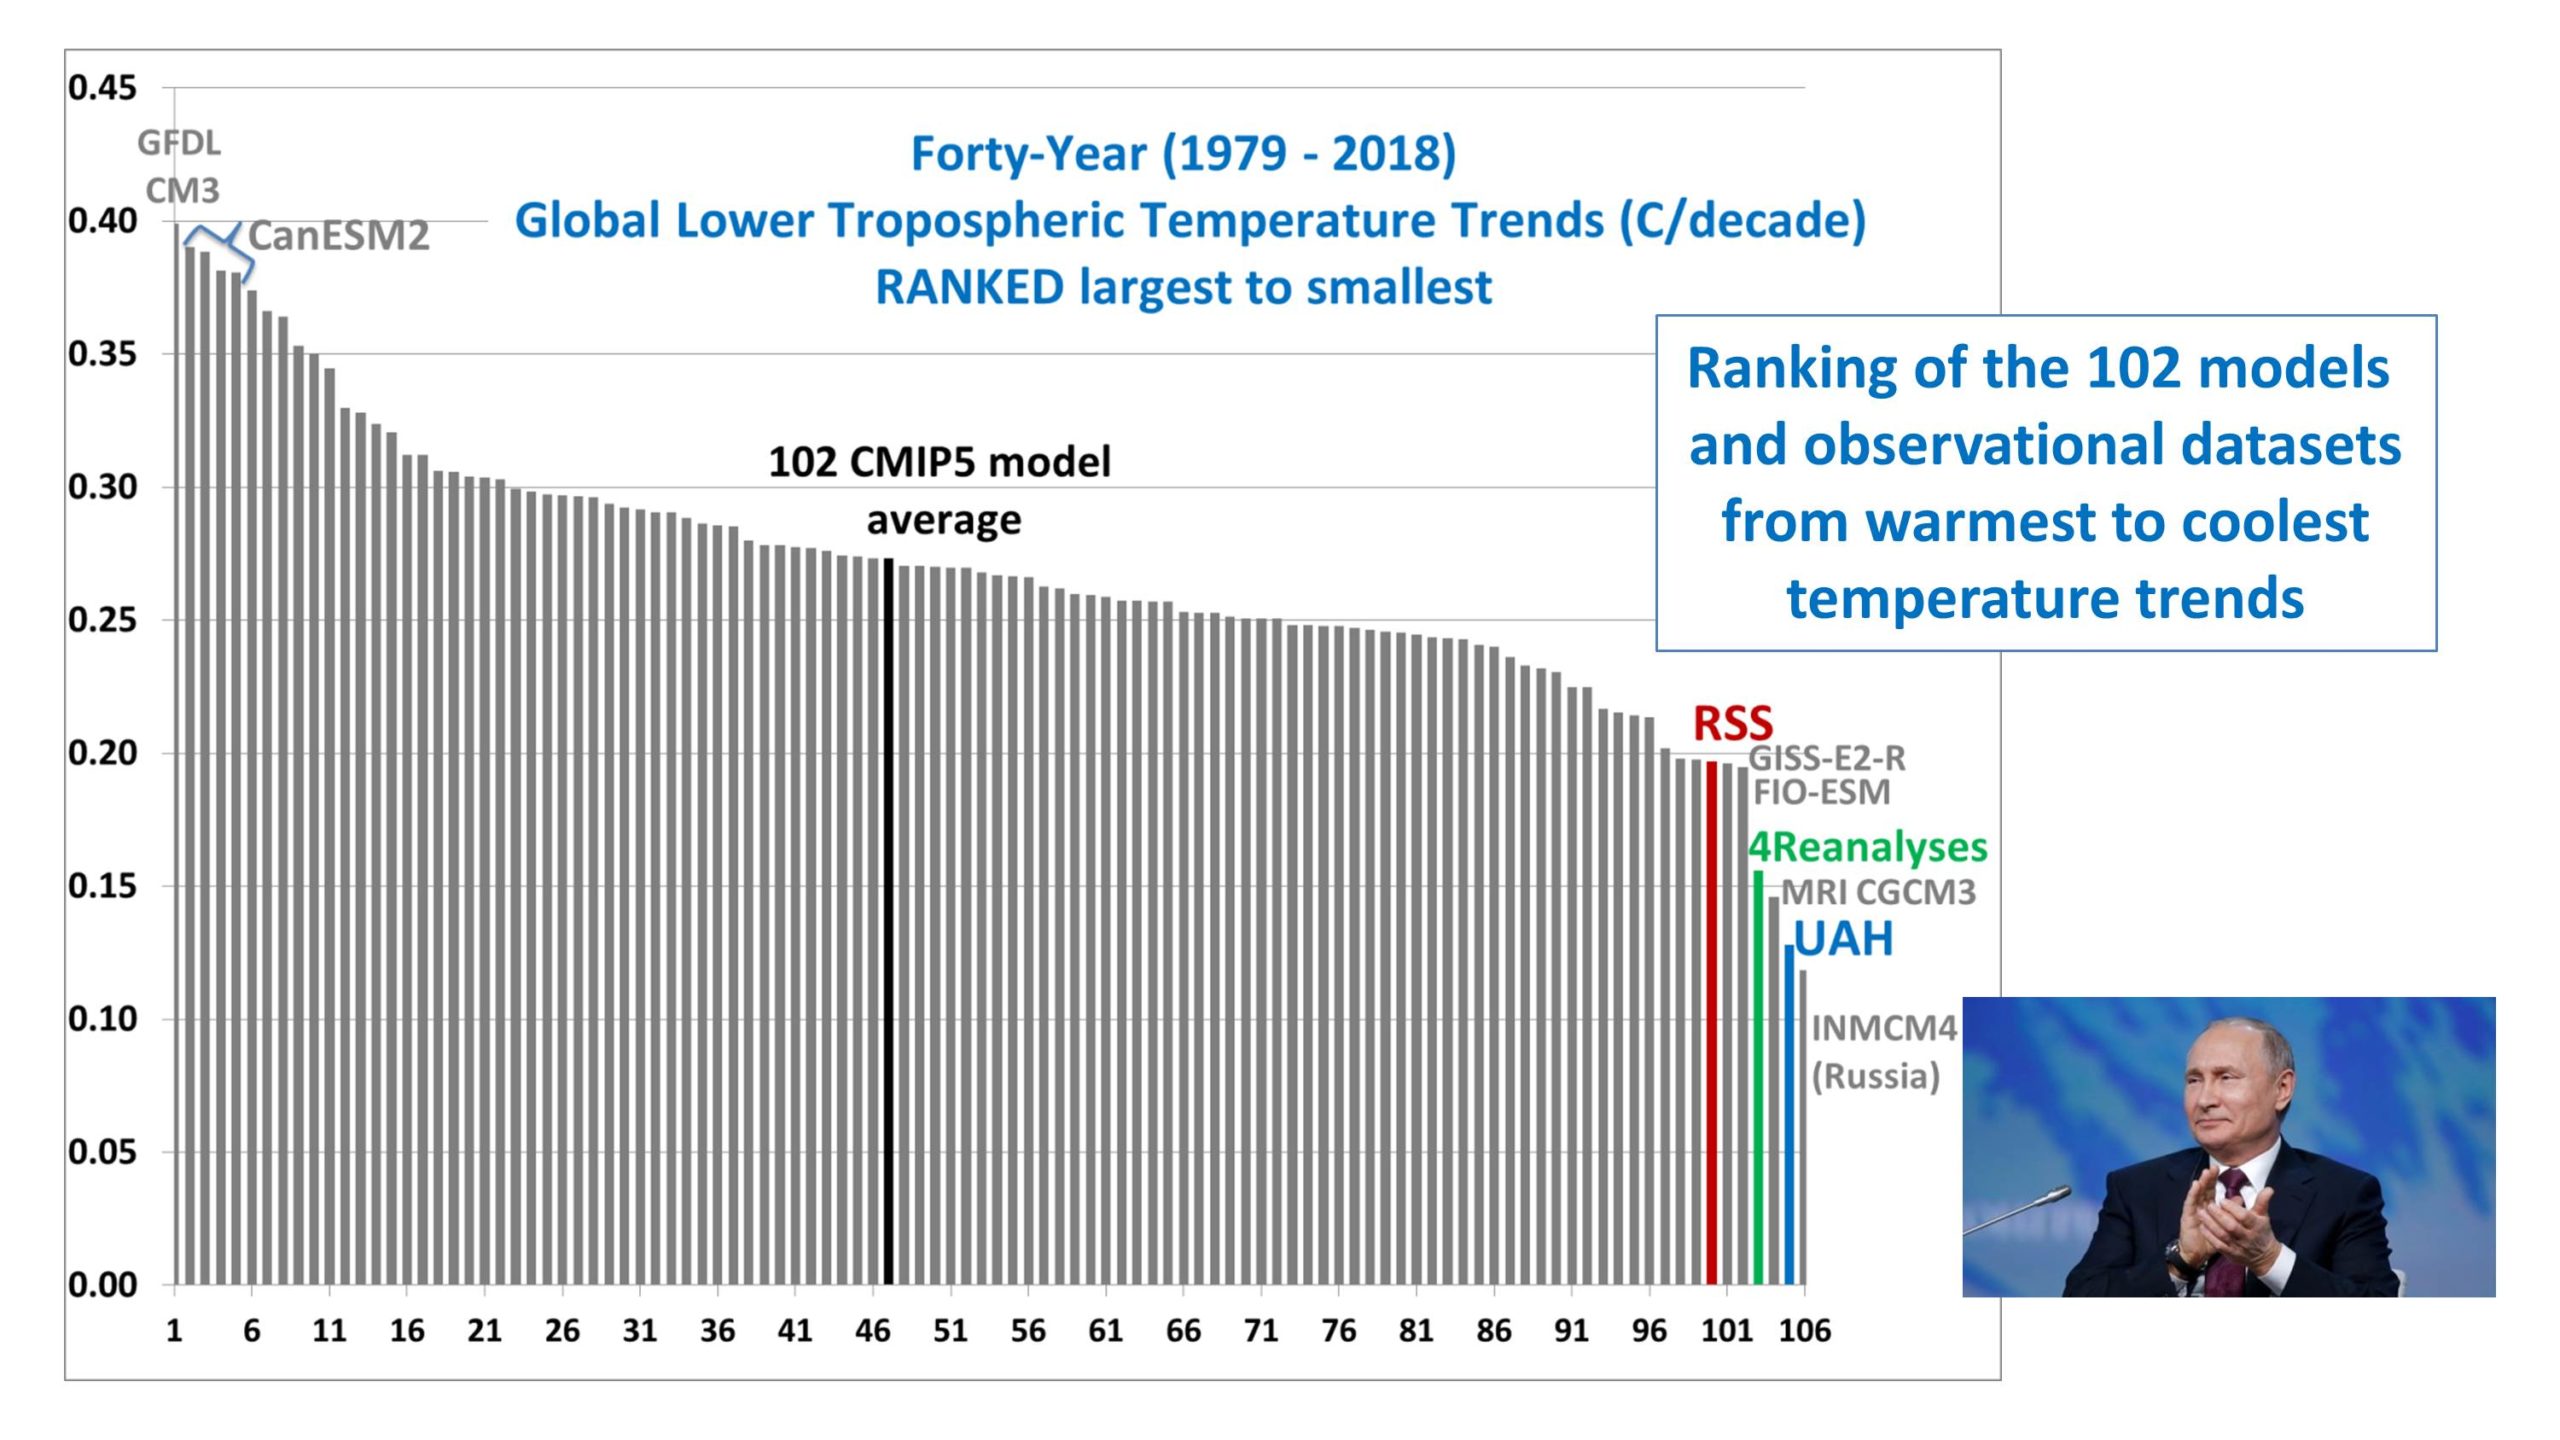
The ranking of the trends in that figure shows that only the Russian model has a lower trend than UAH, with the average of the 4 reanalysis datasets not far behind. I categorically deny any Russian involvement in the resulting agreement between the UAH trend and the Russian model trend, no matter what dossier might come to light.

Tropical Comparisons
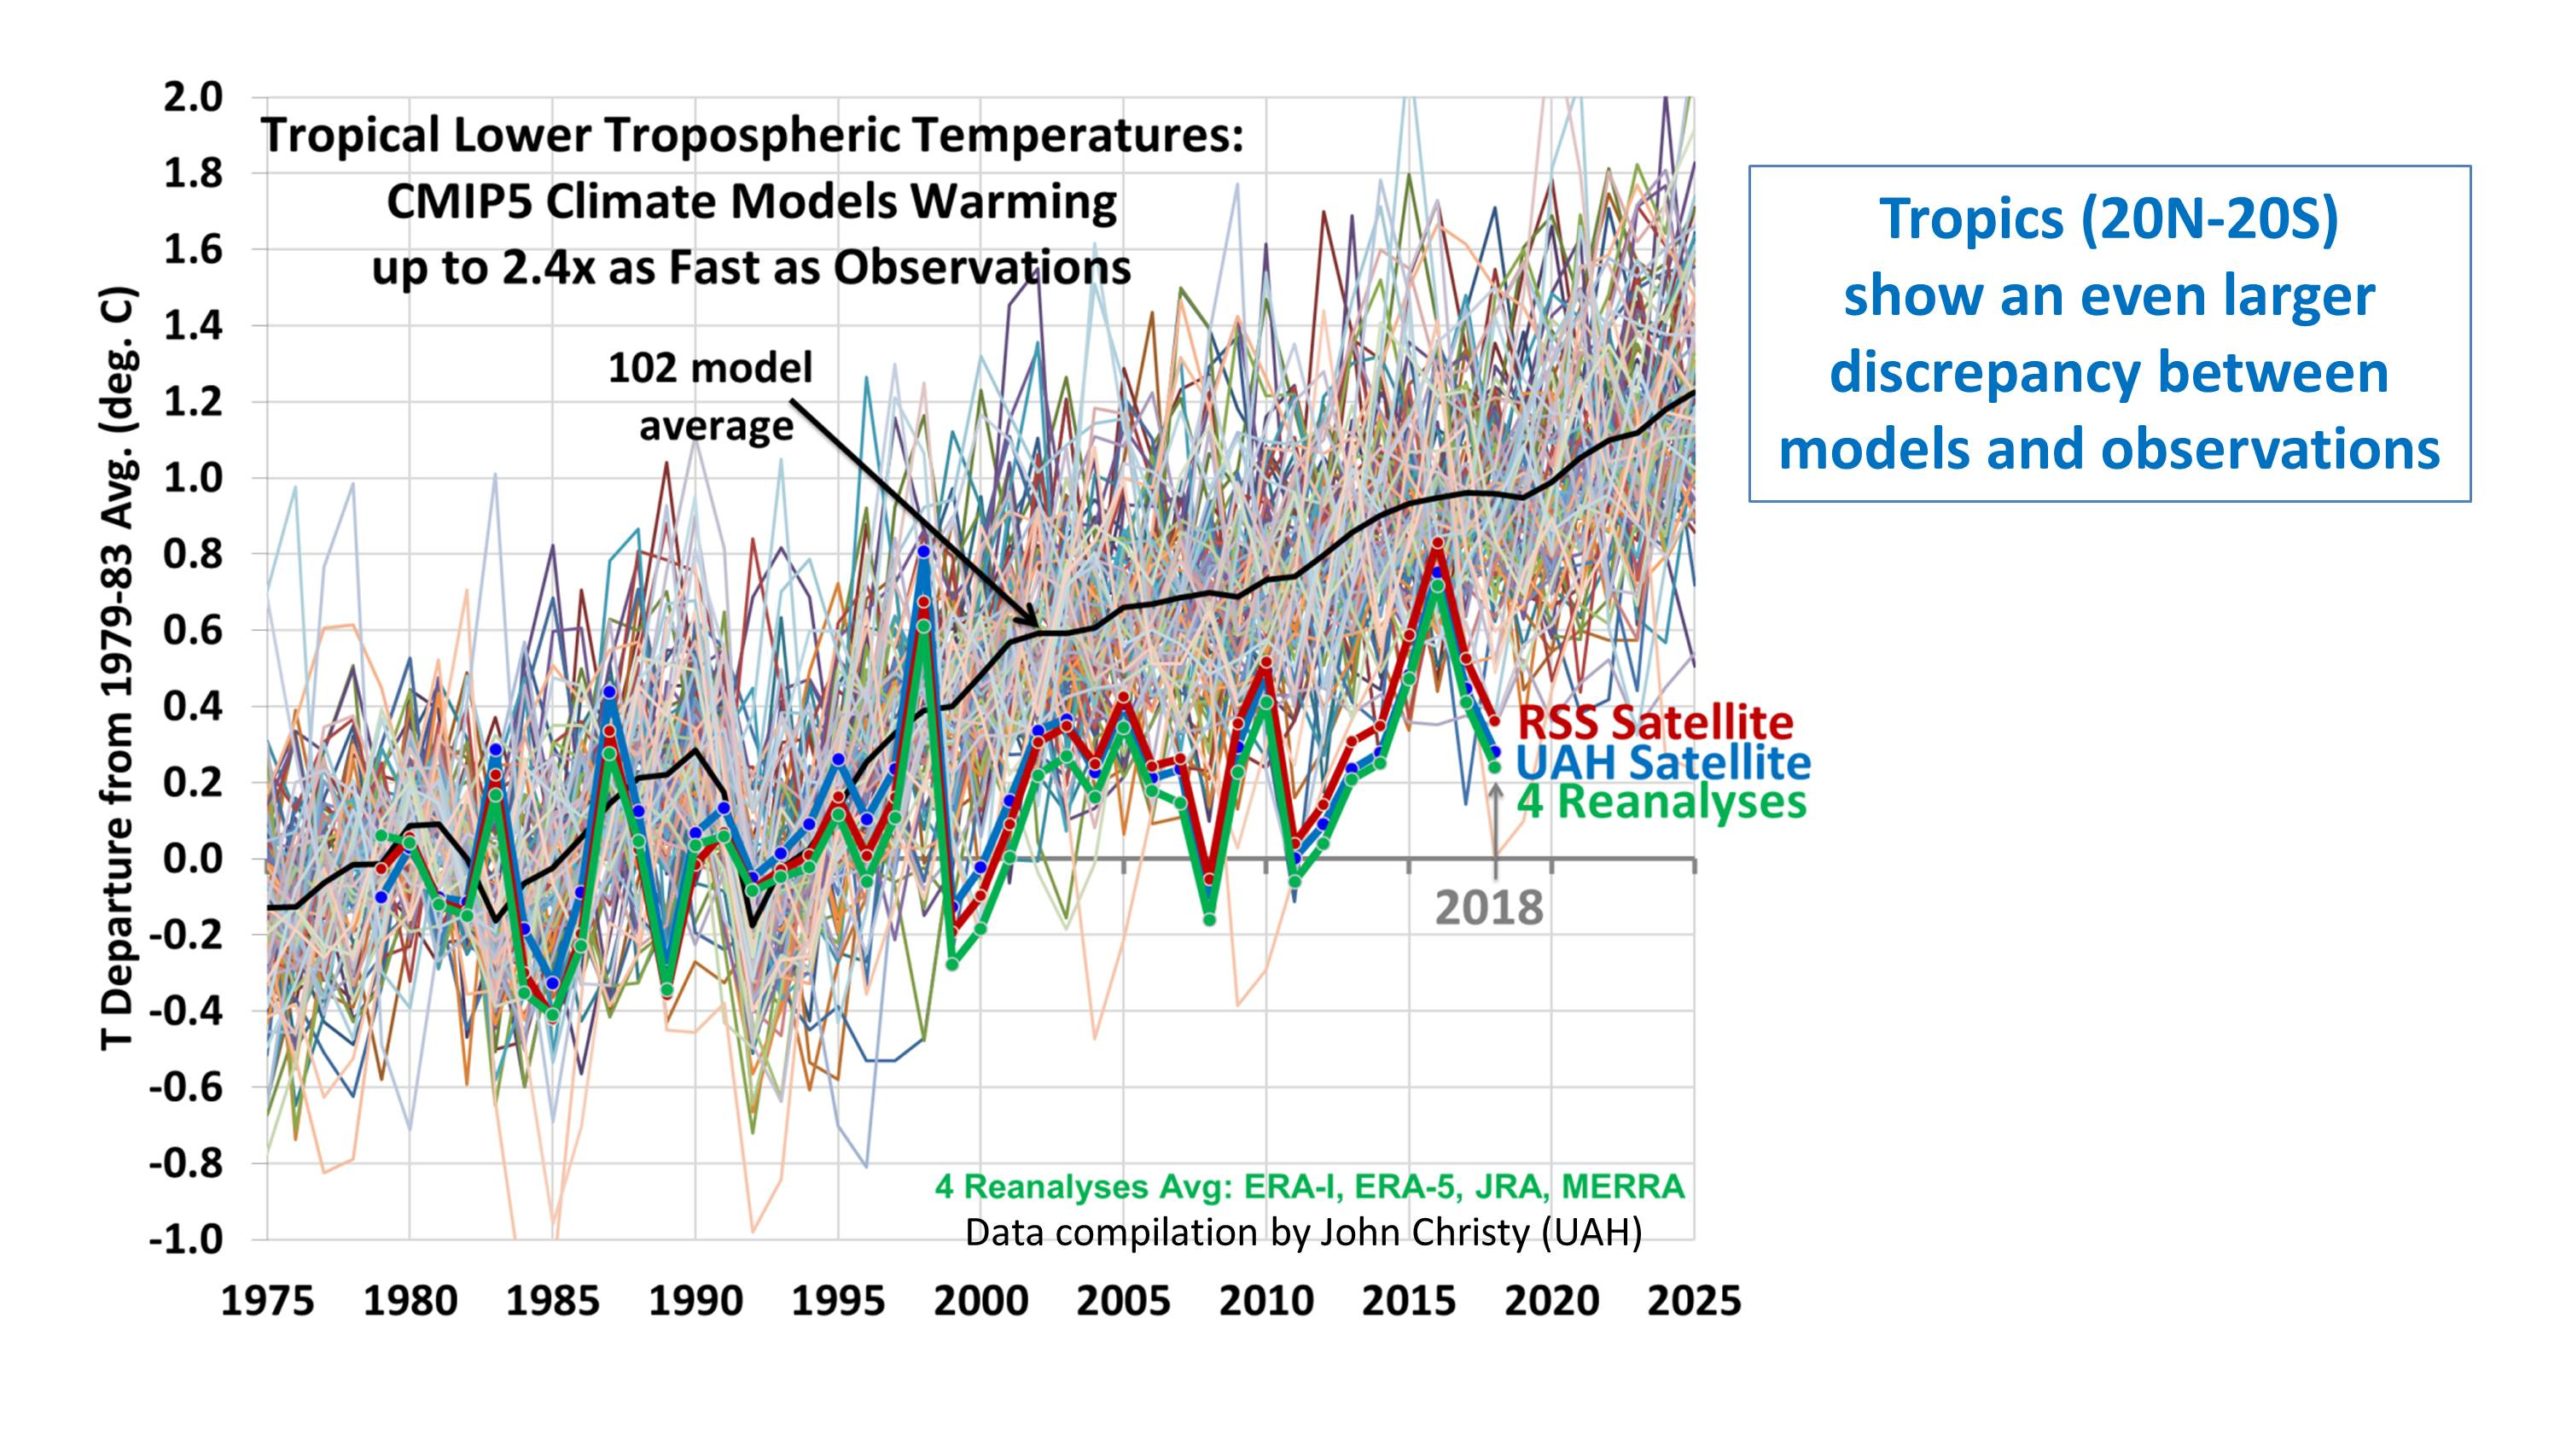
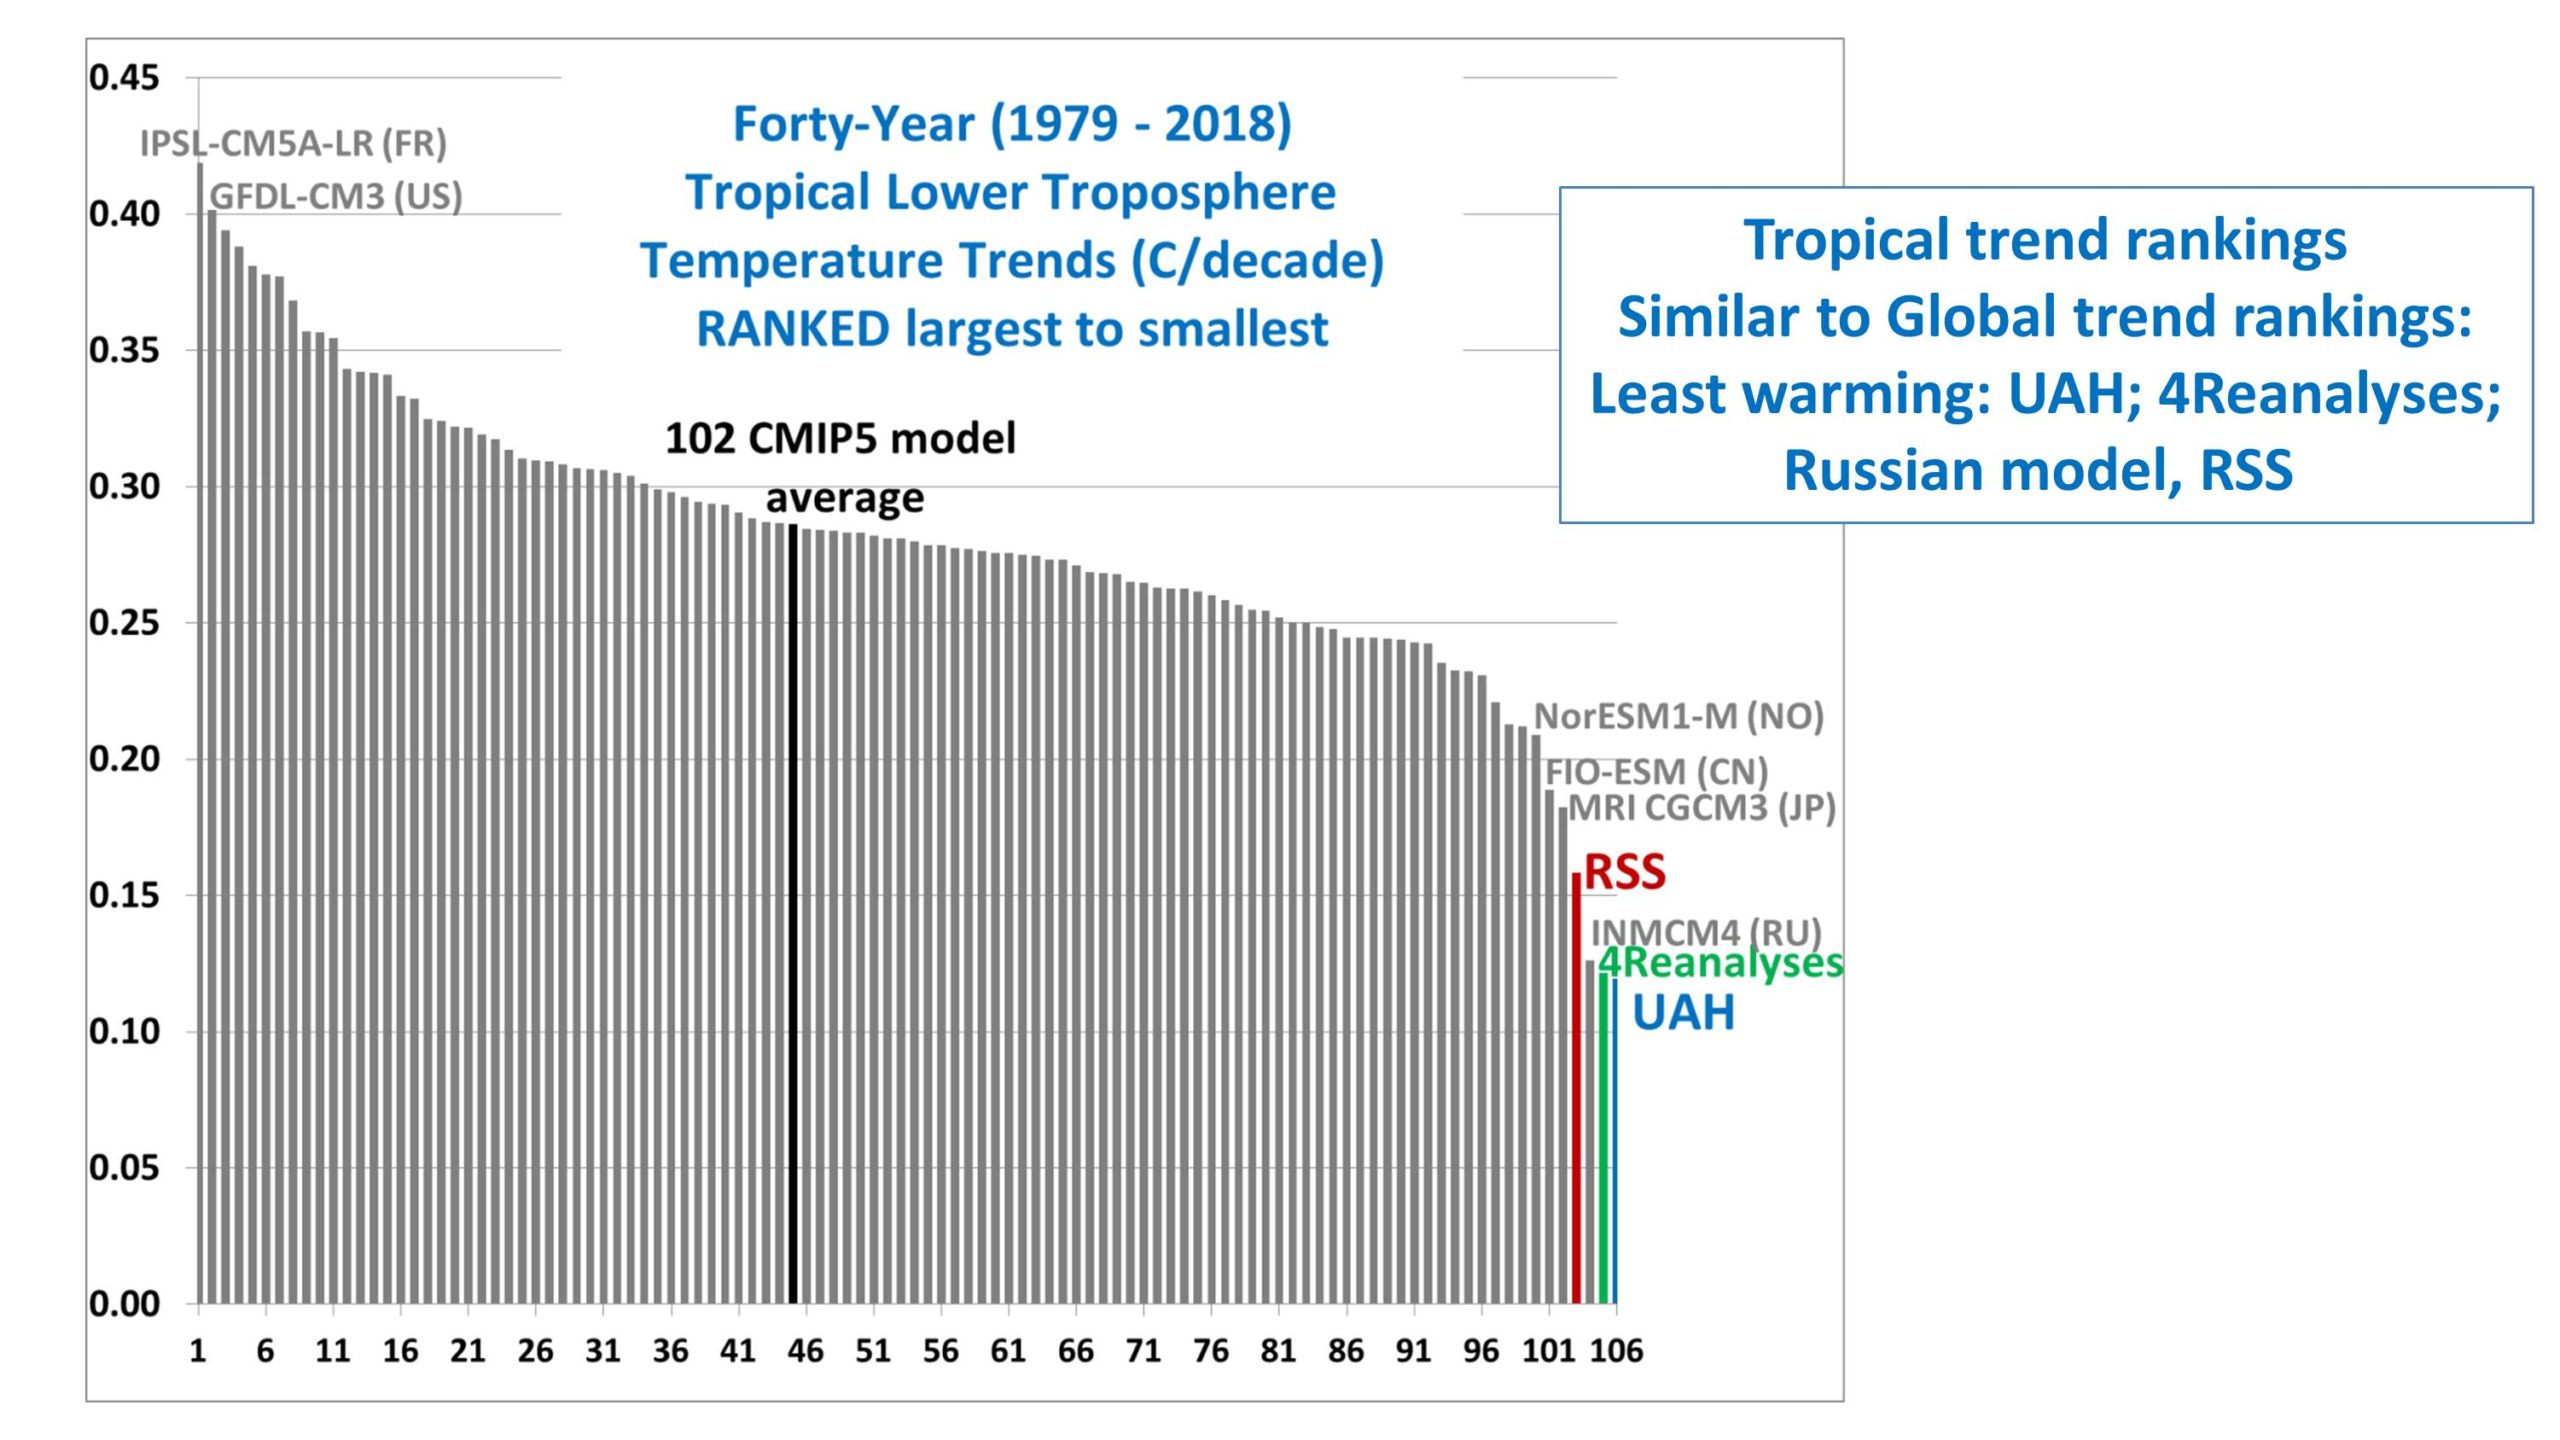
Next is the tropical (20N-20S) comparisons, where we now see closer agreement between the UAH and RSS satellite-only datasets, as well as the reanalyses.


I still believe that the primary cause of the discrepancies between models and observations is that the feedbacks in the models are too strongly positive. The biggest problem most likely resides in how the models handle moist convection and precipitation efficiency, which in turn affects how upper tropospheric cloud amounts and water vapor respond to warming. This is related to Richard Lindzen’s “Infrared Iris” effect, which has not been widely accepted by the mainstream climate research community.
Another possibility, which Will Happer and others have been exploring, is that the radiative forcing from CO2 is not as strong as is assumed in the models.
Finally, one should keep in mind that individual climate models still have their warming rates adjusted in a rather ad hoc fashion through their assumed history of anthropogenic aerosol forcing, which is very uncertain and potentially large OR small.
Testing.
Zeke Hausfather’s update to June/July this year:
https://tinyurl.com/wssrcpu
Hausfather is showing land temperature and here it is troposphere temperature
That’s right.
Svante, please stop trolling.
Svante,
That graph seems to end in 2016.
Try this instead, an apples to apples comparison including 2019 through Nov. ( Final 2019 will likely be a tad higher). Can’t say that models are bad on average
https://pbs.twimg.com/media/EL-YWPzWwAADGZ9?format=png&name=medium
That’s more recent, thanks!
Nice graph, Olof.
Intersting that data higher in 80s-90s. It seems like graphs like Roys force alignment in this period, er start the comparison in this period, then get data below model at present.
1979-1983 was a very warm period, topped by a super el Nino. It is not a very fair base period, because it gives observations a “handicap”, pushing them down by around 0.2 C versus models.
A comparison of tropospheric temps starting earlier, e g 1970 would show better agreement
https://drive.google.com/open?id=0B_dL1shkWewaUzhXR0xmN3pEN0U
Generally, I don’t believe that the disagreement of observed and modelled tropospheric temperature trends has anything to do with flawed representation of clouds etc. Its simpler than that, models and observations agree when el Nino trends agree (eg Nino 3.4 SST or pressure pattern across the tropical Pacific)
Such a period is 2000-2018 when both observations and models have Nino 3.4 SST trends of 0.19 C/decade
https://drive.google.com/open?id=1_S5qIsJVg2OQpLQoT2pq_Fknnjit19X_
I think you’ve put your finger on the issue.
Roy, Sorry to get to the party late. I posted a long comment regarding your Heartland presentation back in August and have yet to receive a reply from you:
http://www.drroyspencer.com/2019/08/uah-global-temperature-update-for-july-2019-0-38-deg-c/#comment-370152
Perhaps my most important point was that your “climate model” curves are actually converted to simulated your LT v6 data. That you don’t mention this conversion process suggests that you don’t really want your readers to understand what you have been doing to these data.
It’s OK, I don’t think he thinks you’re as important as you think you are, so that could explain the lack of response. Maybe not, though.
DRsEMT, One doesn’t need to be important to ask an educated question. One doesn’t even need to be “educated”, as you continually prove. I can’t claim to have a PhD, but I started reading the technical documents more than 30 years ago, which puts me ahead of most people who post around here.
So, how many papers have you written and published after peer review? I’ve done two.
That’s a great way to make yourself seem less pompous.
DRsEMT, Considering my many failures over the years, including an inability to find a stable career, I hope that I have gained some humility. However, I have to say that I really hate BS artists and liars so I might appear strident when I reply to trolls whom I perceive to be distorting the scientific evidence.
You did what you had to do, I guess.
If I take this to the pro-warming crowd, they’ll just dispute the CMIP5 model or point to Hansen’s A, B, C graph. I’m not a climatologist but I do work with numbers. Is this a true apples to apples comparison of the best data available and the data pro-warming want to use for setting policy?
yes, this is an apples-to-apples comparison. The recent claims about Hansen’s old forecasts being correct have 2 problems: (1) Hansen assumed unrealistically large aerosol cooling effects, which masked the too-high climate sensitivity of his model; (2) Hansen’s old model is not the basis for current energy policy changes, the models I have just presented are.
Visit
https://www.researchgate.net/publication/337915619_Cogent_and_irrefutable_reasons_why_carbon_dioxide_cannot_warm_Earth
https://www.researchgate.net/publication/337915638_Understanding_Josef_Loschmidt's_Gravito-_Thermal_Effect_and_thus_Why_the_Radiative_Forcing_Greenhouse_Hypothesis_is_False
Holy seat you people are.
Sorry, the titles are great but your approach is tad useless in here.
I’m sure your work will he greeted with awe afterwards when others finally get a grasp on your irrefutable logic.
That is precisely why Roy’s graph is NOT an apples to apple comparison.
The CMIP5 ensemble is for the surface and NOT the average of a layer in the troposphere and can only be compared with a GMST plot.
I was wondering about that to. So if I understand correctly Roy is comparing atmospheric temperatures to surface temperatures and then pointing out they don’t match. Do I have that right??
Roy is comparing atmospheric temperatures to atmospheric models.
You don’t have it right, Ken.
Ken V, it’s a question. Is the CMIP5 output shown as 2m T, 850mb T, 500mb T, or what? RSS and UAH don’t measure 2m T. They measure higher up and they don’t even measure the same layer so it’s hard to compare RSS to UAH to one another even. And what level in the atmosphere is the reanalysis using? Which scenario from the CMIP5 suite is being shown and when did the forecast begin? What would the result have been if the CMIP5 suite were ran with the volcanic and human emissions that actually happened?
If Christy’s graph can plot the 95% envelope of the CMIP5 ensemble then why can it not plot the structural uncertainty of the observations.
This is a basic scientific procedure.
If it is not possible to do it then how about plotting the full array of tropospheric temp trends as gleaned by the likes of RATPAC A radiosondes and NCEP 850-300mb reanalysis.
UAH6 is an outlier way on the cool side of those (see link below).
Again a basic scientific procedure would be to at least take a mean of them.
Sorry, but smacks of a motivated agenda and NOT apples to apples.
http://postmyimage.com/img2/510_Tropospheretrends.png
The models are basically nothing but a monotonic rise with some noise thrown in as a red scarf trick. If you look at the graphs the only feature they about right is the dip around the time of Mount Pinatubo eruption in 1991. They point to that and say : look we are modelling climate, it even matched the volcanic effects.
But no.
Firstly look at the magnitude. Roughly twice the measured effect in the tropics and about 50% too much in global mean. The means to model is twice as sensitive as it should be the radiative forcing in the tropics, where the vast majority of the Earth’s energy input enters the system. Get that wrong and your model will warm faster than it should and you will be scurrying around looking for “missing heat”.
The scaling of observed aerosol effects: atmospheric optical depth ( AOD ) is one of the biggest frig factors in the whole game. In 1992, using “basic physics” modelling of El Chichon data,it was scaled by Hansen’s team at 30W/m^2, by 2005 it was “tweaked” to 20W/m^2. Measurement and “basic physics” was dropped for arbitrarily frigging the numbers to get the desired result: “catastrophic warming”.
Having under-estimated the true strength of volcanic forcing they could pump up other poorly constrained factors ( positive feedbacks ) and still get a dip in the right place. The added bonus is that the same feedbacks will apply to other “forcings”, like CO2.
And bingo, you an exaggerated warming that you can shout about for about 20 years before it becomes more and more apparent that you warming far too quickly. By that time you hope to have pushed to political agenda far enough to have entrenched the idea the oceans are going boil like they did on Venus !!
So Dr. Spencer is correct, it all starts from frigging the volcanic forcing via AOD scaling.
https://judithcurry.com/2015/02/06/on-determination-of-tropical-feedbacks/
Hansen had three temperature change guesses and three CO2 growth rate guesses that supported them.
One temperature guess was in the ballpark, and one CO2 growth rate guess was in the ballpark, but NOT the CO2 growth rate guess associated with that temperature change guess.
So what ?
Give me three guesses, and I will predict the future direction of the stock market with 100% accuracy (Up, Down and Sideways !), making me a genius ?
“Give me three guesses, and I will predict the future direction of the stock market with 100% accuracy (Up, Down and Sideways”
Well, Hansen used a model not a guess.
All 3 model temps went UP, whereas the prior 40 y Temps were flat.
All 3 went up by an amount > natural variability of previous century.
The rise of the 3 bracketed the actual rise, IOW, within error.
Nasty Nate
Our planet had been warming since the 1690s.
Up at least +1 degree C. from 1690s to 1880
Three models with no detailed understanding of what causes climate change is just three guesses = meaningless = not real science (YOUR kind of “science”)
Richard,
It is one model with 3 different input sets (A, B, and C). None of Hansen’s 3 scenarios actually played in reality. Instead a scenario somewhere between B and C actually happened due in part to the Montreal Protocol among other reasons. When Hausfather et al 2019 input the human emissions that actually happened the forecast was indistinguishable from observations. Hausfather examined other models as well and concluded that model/observation discrepancies had more to do with poor inputs than poor model physics. Scientists had a good enough understanding of the climate system 30 years ago to make skillful forecasts. What they lacked was the ability to predict human behavior which compromised the selection of scenarios being modeled.
Well Richard, you disproved your own argument when you said:
“(Up, Down and Sideways !), making me a genius ?”
Showing that your genius guesses would have been wrong 2 out 3 times.
And that was just direction! You would have had no chance on magnitude.
bdgwx, please stop trolling.
Thanks for the graphs, Roy. When looking at this now regularly Arctic freeze coming to the US i ask myself: It looks like there is far more danger of an upcoming Ice Age.
This graph is relatively new and wow:
https://www.dropbox.com/s/myqqg0kd2rgwlcv/Greenland-climate-swings.jpg?dl=0
Source: https://www.sciencedirect.com/science/article/pii/S0277379118305705
Who ever said this warming today is unprecedented, is certainly more than wrong.
And recently i discovered that huge parts of the US was covered in thick ice (this wasn’t new), but huge parts of Alaska, Kanada and Siberia was practically ice-free during the last Ice Age, even arid and California was hotter 29.000 years ago than now. So average temperatures could be very missleading when looking at the areas where the warming is usually generated. When some regions in the world are like -10° C instead of the usual -20° C, they completely heat up the average temperatures even while the parts where people actually live are getting cooler.
And whatever CO2 does in this climate game, it should act rather as a background ‘noise’ warming all places more or less, but certainly should prevent new cold records around the globe.
CO2 would be noise if it varied the way the El Nino/la Nina cycle does, evening out over a few decades. Instead it constantly rises affecting temperature behind the noise.
If temperature-swings of up to 12° C within decades happend already, the effect of CO2 over 350 ppm should be already a landslide in rising temperatures, but so far nothing seems unusual:
https://www.dropbox.com/s/tbjzn0sj5s8j57m/Greenland-temperature-swings.jpg?dl=0
Antarctica was always far more stable according to the Vostok-icecore-data like it is now. ‘Just’ warm ocean currents around the Peninsula and possibly vulcanic activity under the ice can have an impact on the ice-sheets, since maximum temperatures at the shores are well below the freezing point all year and a new all-time record cold was recorded in 2018.
So basically we don’t know anything yet on the climate impact of CO2 other than the impact as a fertilizer for plants.
“we show that, currently, the dominant tree species Norway spruce and European beech exhibit significantly faster tree growth (+32 to 77%), stand volume growth (+10 to 30%) and standing stock accumulation (+6 to 7%) than in 1960.”
https://www.researchgate.net/publication/265607734_Forest_stand_growth_dynamics_in_Central_Europe_have_accelerated_since_1870
With a still fast growing population we need more CO2 in the atmosphere, since it’s benefits as a fertilizer is still way behind the possibilities that can be measured in any greenhouse:
https://youtu.be/YYsjhz7DT1s?t=205
“population we need more CO2 in the atmosphere, since it’s benefits as a fertilizer is still way behind”
Co2 is not fertilizer. And having actual nitrogen based fertlizer is what has made farms more productive.
Cmon Nate… picking on the specific word ‘fertilizer.’ CO2 is food for our food or food for the food of our food. From the perspective of food picking on CO2 is weak.
The point of the article is the models over-predict warming. Furthermore, since some of the warming is undoubtedly natural (since there was natural warming already occurring before human effects), they doubly-over-predict warming (they get to count the natural warming in the ‘CO2 bucket’).
Finally, warming is not the thing to fear. The next ice age is. If there is anything humans can do to prevent the onset of the next ice age that would be their single most impressive feat!
Barry
You should tell this to NASA:
https://www.nasa.gov/feature/goddard/2016/carbon-dioxide-fertilization-greening-earth
https://www.nasa.gov/feature/ames/human-activity-in-china-and-india-dominates-the-greening-of-earth-nasa-study-shows
Also the spring/autumn-amplitudes of CO2 increased by about 30% since they measure atmospheric CO2. There might be other factors in play, but with opposite season-effect in the Southern Hemisphere and the available satellite data i would estimate the increase in global biomass by at least 30% since 1960.
https://www.dropbox.com/s/3vsymrlg4y18x8x/CO2-concentration-versus-biomass.jpg?dl=0
Nate: here’s a link to a detailed look at commercial plant growing and the effects of CO2 enhancement in greenhouses.
CO2 depletion is also described.
Note the statement that CO2 should be regarded as a plant nutrient:
http://www.omafra.gov.on.ca/english/crops/facts/00-077.htm
Sorry friends. As usual, it is more complicated than you want to portray it.
Plants need water, sunlight, warmth, co2, soil nutrients.
But the right amount of these.
https://www.scientificamerican.com/article/ask-the-experts-does-rising-co2-benefit-plants1/
Nate,
That link is to an opinion article. I wonder what the political/policy leanings of the author are?
No doubt it is complicated. Besides genetics, land use, and actual fertilization/irrigation schemes, there is also the fact that land is not the same as it used to be. Growing crops removes a lot of nutrients, and only some are put back. But the fact remains that CO2 is necessary for plant growth and there has been a correlation between rising CO2 levels and greening. If you want to put a negative political spin on it to suit your purposes fine if you think CO2 is bad, you could always cut your carbon footprint to zero
Barry
“a negative political spin on it to suit your purposes fine if you think CO2 is bad”
Well, I think same goes for you guys. There ARE positives to climate change in some places.
But if you think mostly positive, that is wishful thinking.
Nate,
Excuse me, but it is your side trying to convince us to agree to mandatory lifestyle changes, so the spin standard is higher for you. Our side is demanding nothing from you. Feel free to live however your morals or spin dictate you live as regards to the high standard of living afforded to you by a carbon lifestyle. I fail to see how anything I specifically said in regards to CO2 and food was spin, but certainly pulling out a politically motivated opinion article as your scientific basis for claiming we are wrong about CO2 and food is, well spin…
I do agree that with climate and climate change there will be winners and losers, good and bad. But, with climate the only constant is change and mother nature is going to kick your butt eventually. The thing to truly fear in the next glacial period that is overdue. In the final analysis, if there is any bad we are causing, there is nothing practically that can be done about it short term. Deviating substantially from the status quo long term would require your side convincing everyone in the world and every country in the world to agree to drastic lifestyle changes. Good luck with that!
Barry
barry k says:
“That link is to an opinion article. I wonder what the political/policy leanings of the author are?”
An opinion piece in Scientific American, citing these leftist institutions:
1) Richard Norby, Oak Ridge National Laboratory.
2) Frances Moore, University of California, Davis.
3) Samuel Myers, Harvard University.
Subscribe to the “Unscientific American” to get a balanced view.
“so the spin standard is higher for you”
Uhhh no.
Doing nothing will have consequences. Those will be on you.
Nate,
I assume then you’ve cut your own carbon footprint to zero… good for you; otherwise how could you live with yourself and all those consequences you are responsible for.
You’ll have no luck trying to give your guilt to me…
Barry
Barry, you are misinformed. I dont car whatyou personally do.
I care what govt policy will be.
Nate,
Nice one… by definition, if you intend to change government policy on this issue, you care about what I do. You are intending to force others to live by the morality that you aren’t already living by yourself…
Do you not understand that ‘government policy’ on this issue means nothing unless it’s a world government. I don’t know, maybe you’re intending to invade China, Russia, India?
Thankfully, I currently live in a free country with a lot of people that think as I do…
Barry
Uggh, Strawmen really piling up.
The point seems to elude you.
What you or I do voluntarily does diddly squat.
Do people voluntarily pay taxes? Of course not. Sorry we have to infringe your freedom to not pay, by making it a law .
A modest carbon tax, offset by other reductions is whats needed.
What happened Nate…? There was a time a few years back where you actually engaged on this blog. You seemed intelligent and willing to debate. Now it’s deflecting one-liners and not really addressing the main issues. Are you spread too thin on too many blogs trying to drum up support for you policies to control me?
That’s all right… doesn’t matter. I just took all your supposed straw-men and made a nice bonfire…
Cheers!
Barry
Nate,
Let me see if I can summarize your first post in a while with any points that could even be eluded.
You won’t reduce your own carbon footprint (even though your morality dictates it) because it would do diddly squat.
Your solution to the problem (to ease the guilt you feel) is to mandate a ‘moderate carbon tax’ in the country you live in. The result of that on global CO2 emissions would be small. The impact on global CO2 levels would be imperceptibly small. The impact on global T would be ‘diddly squat’. You don’t have a solution and there would still be ‘consequences.’ But, somehow you would feel good about it?
Barry
The go to tactics for you guys.
1. Ad homs
2. Think you know what people’s feelings, motivations, and actions are.
3. Black and white thinking.
No need for a world govt to get global action. Eg Ozone Hole CFC regulation.
No the growth of renewable energy is not going to ruin your life.
Nate,
I’m still left questioning why you are on this blog? Are you not here to discuss, or are you just here to spout moral superiority?
I’ve made a lot of points. Many of those were meant to be pointed on purpose to invoke discussion. What I got was altruistic moral absolutes like “doing nothing will have consequences. those consequences are on you” or one line deflections calling on the old “strawmen” or vague statements like “I care what govt policy will be” that leave me to surmise what your motivations are.
If you really want to discuss how you think it’s possible to get ‘global action’ on climate change without a world government, please enlighten me. If you want to discuss how renewable energy will impact my life, have at it. That’s actually something I know a lot about. We are already moving toward renewable energy in incremental steps and I’m fine with it. Sometimes and in some places it makes great sense.
You simply cannot brush someone aside when the changes you are proposing will negatively affect them and it is at least perceived nothing will not be solved and expect them to just take it laying down, etc…
Barry
Barry, my interest in discussing seriously with you quickly waned when you said our two sides have different ‘spin standards’.
‘are you just here to spout moral superiority?’
Are you just here to spout nonsense about leftists/globalists/illuminati?
Nate,
Google dictionary definition of spin:
a particular bias, interpretation, or point of view, intended to create a favorable (or sometimes, unfavorable) impression when presented to the public.
Your side would like a carbon tax. Your side would spin things to convince someone to agree to this. If they cannot be won over by logic and reason, this is deceitful. Our side would generally like to be left alone. Our side would spin things to try to make that happen. This is self-preservation… or at worst selfishness if there are indeed consequences from our carbon footprint.
Call, parse, or phrase it however, you want… it is different.
Cheers!
Barry
Nate,
One thing did occur to me and that’s perhaps you think when I say higher standard, I’m referring to the journal article review process and that’s not true. All journals should be a spin-free zone.
It also occurred to me you think I’m implying is justifiable for our side to spin things to you. That’s not true either.
All I’m saying (if I can be more concise) is you spinning things to me to gain something from me is worse than me spinning things to you to keep the status quo.
Cheers!
Barry
Barry,
It is a debate about
a. Is AGW significant.
b. Is it a real problem? Clearly there is a risk of that.
c. What should be the policies?
Both sides have real concerns and policy goals that they think are legitimate. Young people are more likely on my side because, lrtd face it, it will affect them more.
On your side there are vested interests whose profit bottom line will be negatively affected by policy changes, like the coal industry. These interests have funded significant lobbying efforts and propaganda campaigns from eg the Heartland Institute.
Eg see this recent article:
https://www.nytimes.com/2019/12/17/climate/murray-energy-climate-denial-coal.html
The greening effect of CO2 is one of the big propaganda points that Heartland uses to push the narrative that climate change, if real, and if caused by fossil fuels, is BENEFICIAL.
You cannot claim any higher ground from the start for your side. This is hyperbolic victim-hood.
Sigh.
That sigh was for barry k, I agree with Nate.
Nate,
I don’t have any problems with the items to debate. I would probably agree with you some on a), a little on b), probably not on c). I agree with your assertion about the young. I’m sure there will be policies directed toward AGW at some point here (USA), but I think it will be later rather than sooner.
I realize looking back it would be easy to misinterpret but when I referred to spin previously, I was specifically referring to individuals (i.e. like you and me on this blog). I don’t have any issues with the notion that private companies be held to a higher standard; that’s true in many more ways than spin via propaganda. Private companies have much more influence and a bigger pulpit than individuals… however, they don’t have ultimate control over you. If you think their propaganda is bunk you are free to: not buy their products, become a shareholder, start your own competing company and in the end there are legal mechanisms if you are wronged (false advertising or harm) via the courts. Sure coal companies have a large vested interest in the status quo and sure they have spewed propaganda.
On your side, something similar would be government. They stand to benefit in a big way via AGW legislation since they would administer it. And, they also have spewed propaganda. However, in the case of government, they have ultimate control over me. They can tax me, garnish my wages, or throw me in jail. I really have no legal recourse if I’m wronged by them. So, I’d say government should be held to an even higher standard when it comes to spin.
The thing that I would say regarding moral higher ground is… your side can resort to morality (save the children or polar bears, etc). The notion is we must act at all cost or we are morally implicated. And this may be wrong financially but right morally if the ‘we’ is everyone on earth and the ‘act’ means actually solving the problem. But, what I see are situations where the ‘we’ is just our country and the ‘act’ is something that will barely bend the needle in terms of global CO2 levels. That to me is right financially but wrong morally. There is a moral disconnect…
Barry
Barry, fair enough. Some points I agree with. The media and some activists f4om my side misunderstand the science, and exaggerate. I dont agree with some aspects of the Green New Deal. Specifically that we have to get to carbon free in 10 y or so That is completely unrealistic.
There are extremists on both sides.
I am convinced we need let the market pick winners and losers in energy market, with some incentives from govt to move to low carbon.
Nate,
I agree. The likelihood of a Green New Deal even if the next few elections go about as far left as possible is very low. Even if it were passed, it would probably be amended down quickly because of revolt. But, I personally give them kudos from the moral perspective.
One issue I have with a carbon tax (or something like it) is the size of the ‘knob’ you have to push toward renewables, etc is not related to the size of the problem but set by the size of the program (related to disposable income). I think you would get a short term boost as the low hanging fruit renewable projects are done but would run into a wall in regards to moving renewables into the realm of a ‘primary energy source’.
Let me offer a suggestion to stir the pot. How about replacing our income tax system with a revenue neutral carbon tax system. That would both give you a knob of a more reasonable size and directly incentivize citizens to reduce their own footprint.
Barry
Now you sound more reasonable. The tax should match third party costs, but should be ramped up gradually to prevent a shock to the system.
How will you handle the deficit when you replace income tax with something revenue neutral though?
Svante,
I’d be willing to concede some things if in the process we got a Constitutional Amendment to abolish the Income Tax, even addressing the deficit and/or debt with additional taxes. Generally, I think raising taxes to address a deficit results in growth of government because they can’t be trusted to maintain a balanced budget.
I’ve thought about it some…. how about replacing the personal income tax system with a national carbon sales tax system having a sliding sales tax rate depending on the carbon content. I’d probably exempt staple items from the sliding scale. And one probably would need to include the option to submit for a rebate if income is below a certain amount. Might also consider some luxury tax aspects. And I’m sure it would need to be phased in over some period.
It’s possible something like this could build consensus between the two sides because I know there are many people like me that despise the income tax. However, I think many would demand an Amendment, making it harder. But, without it, the Income Tax is so ingrained into our political DNA it’s likely to be re-initiated later and then we’d have both and be worse off.
Barry
It is much too easy to solve the carbon problem, federal income tax is an order of magnitude too great.
The point is to cause CO2 tax evasion, so revenue will drop as time goes by.
Exemptions and rebates are sub optimal and messy. If you think someone needs to emit more carbon it is the same as saying they need more money. If they get more money they may prefer to consume something else, which means that your rebate was not worthwhile.
Abolishing income tax and government mistrust are separate problems that are not best solved by emitting carbon.
‘Generally, I think raising taxes to address a deficit results in growth of government because they can’t be trusted to maintain a balanced budget.’
Weve tried the experiment of lowering taxes several times and it demonstrably has increased the deficit.
Last 2 years is a good example. The deficit has grown to $1T. A good economy is when its supposed to shrink.
What will happen in next recession? Deficit and Debt will balloon.
Good discussion of it here
http://www.crfb.org/blogs/deficit-has-never-been-high-when-economy-was-strong
Svante,
With income tax, avoidance means reduction of work which is bad all around. For this hypothetical system, tax avoidance is a good thing in terms of CO2 emissions. I was assuming with a new system Washington would start engineering it. Part of that would be the amount coming in.
So, maybe not a rebate but rather a credit where the amount is fixed and depends on only income and household size. This would maintain the proper incentive structure for all. I think even in a pure carbon tax (at least the schemes I’ve read about) something like this would be needed to address the regressive nature just to get it passed anyway…
Nate,
I actually wasn’t thinking of cutting taxes as the alternative to my suggestion, but cutting programs. But generally, I’m fed up with engineering of the tax code. It swings back and forth with the political winds and somehow always makes the tax code more complex and convoluted.
In general, I agree on the deficit problem. Folks in both parties recently have used deficits as a stimulus and have been allowed to do so because of low interest rates. There will be a reckoning some day and people from both sides will be blaming it on the other side.
Barry
barry k, I think your proposal has unnecessary complexity, but OK.
And yes, increasing deficit during good times is a terrible risk because it limits your ability to act in the next downturn.
Indeed it can cause it by running the economy too hot.
“Folks in both parties recently have used deficits as a stimulus and have been allowed to do so because of low interest rates.”
Except doing that during a deep recession, like the 2008-09 one, makes economic sense.
What was done in 2017-18 doesnt, and one party was in charge.
Svante,
My hair-brain idea was meant primarily as one example of how thinking of real consensus might look. I’m sure there are better ones. It may be more complex in how it affects businesses or Washington, but it would be much simpler for me, the taxpayer. Every year I’m astounded as I wade through schedules, forms, and calculations that are meant to make winners and losers out of obscure scenarios somehow. It is just too complex.
I agree. We released our full arsenal during the last recession and never reloaded.
Nate,
Every person is likely to think more highly of their side than they should and worse of the other side than they should. That’s the nature of the beast in a polarized system, and I can admit that in my own thinking… Washington as a whole is too focused on short term, next election, and agenda items. Long-term fiscal planning is down the list and is itself a partisan fiasco. As with all highly partisan things, nothing gets done until there is a strong majority one way. Even then, the side that wins doesn’t get exactly what they want, but 1/2 the country is ticked off. Would be nice to have some outside-the-box thinking that can get support from enough people in both parties to push on both sides of Washington…
Barry
Looks like we agree there barry k.
Your comment is correct, but a non-sequitur.
Danyel Jee wrote of the effect across geographical distribution, but you responded about temporal distribution.
As a laymen thats understands very little but has been reading for years, love the Russia jokes haha.
nice graph , just what we needed
….But it doesn’t make Dr, Roy’s point quite as well if you sketch in 2019 from the Novenber UAH numbers instead of stopping at 2018…..
Here is an interesting publication by Hausfather et al. 2019 that suggests discrepancies between model and observation is explained more by poor inputs rather than poor physics.
https://tinyurl.com/sbr37y9
https://tinyurl.com/woutkxf
And then there is the contiguous US Climate Reference System data which shows no warming for the past 15 years. One of these days somebody will start to notice that.
The warming trend shown by USCRN is +0.86F/decade. You can download the data at the following link.
https://tinyurl.com/sw24csc
Also notice that USCRN is consistent with the older and more comprehensive USHCN dataset.
bdgwx says: “The warming trend shown by USCRN is +0.86F/decade.” Using a decadal average on a <14 year data set is ludicrously sensitive to start/stop dates. Most use a monthly or annual average to calculate a trend in something this short.
The +0.86F/decade figure is not a decadal average. It is a trend computed from all annual mean data points in the dataset.
Denis Rushworth
“And then there is the contiguous US Climate Reference System data which shows no warming for the past 15 years.”
Firstly, 15 years mostly aren’t a suffcient period to talk about trends.
Here is a graph showing you raw USCRN data out of the GHCN daily data set, for the period 2004-2019:
https://drive.google.com/file/d/1wFjARkQAmHKdQeazwpc9rEpzuwGLS-fq/view
May I suppose you are more confiden with eye-balling than with real data processing?
The trend line you see above is not as flat as you think.
While the average of all CONUS GHCN daily stations shows a trend of 0.27 +- 0.15 C / decade, that of all CRN stations shows 0.36 +- 0.16 C / decade. (The standard errors are somewhat high due to the short period, but are significant enough.)
Yes: the super pristine, about 200 CRN stations, praised by Watts at WUWT as poor in UHI, show a higher trend than do all CONUS stations together (about 8000).
Source
https://tinyurl.com/mlsy22x
Both global and tropical observation trends for RSS above look a bit lower in relation to the model outputs than they show here:
http://www.remss.com/research/climate/
Roy oh Roy …oh boy what a whopper!
Validate with others and be well fair…………….er!
https://youtu.be/8BnkI5vqr_0
https://www.scientificamerican.com/article/its-a-match-satellite-and-ground-measurements-agree-on-warming/
Nothing to see here.
Mild temps all the way – yes sir.
The only issue is we live on the ground.
Not high up in the atmosphere.
Head in clouds so to speak.
Yes, but we all know that the global warming theory dictates extra CO2 in the ATMOSPHERE will warm the ATMOSPHERE. Well some of us do anyway. We could measure the temperature under rocks, in the ocean, or anywhere else you choose, but it makes the most sense to measure the temperature of the atmosphere where the warming is supposed to take place, not elsewhere, yes?
90% of the heat uptake goes into the ocean. The other 10% is split among the crysopshere, troposphere, land, etc.
Really? We know the sun warms the ocean, but by what mechanism does atmospheric heat get absorbed into the ocean other than a small layer on the ocean surface? How does the atmospheric heat travel to the lower ocean depths without first traveling through the upper ocean?
Also, If the warmer atmosphere transfers heat to the ocean surface only during the day when the ocean is cooler than the atmosphere, does not the ocean return that heat at night when the atmosphere is cooler than the ocean?
The theory that global warming causes the ocean to heat has little credibility, if it did the IPCC would describe the mechanism by which this is possible, but they don’t. Also, if the ocean is supposed to be warming so much due to global warming, why has it’s level not accelerated as a result – isn’t a warming ocean supposed to increase sea level rise?
‘The trend in GMSL [global mean sea level] observed since 1993, however, is not significantly larger than the estimate of 18-year trends in previous decades (e.g., 1920–1950).’
Source: IPCC AR5 report (2013), Working Group I: The Physical Science Basis, Chapter 3, Page 290, 3.7.4 Assessment of Evidence for Accelerations in Sea Level Rise.
Agreed.
The oceans absorb both shortwave and longwave radiation. Water is also has a very high specific heat capacity and the oceans have an enormous amount of mass compared to the atmosphere so they are able to take up a lot of heat. This does cause thermal expansion and contributes to sea level rise. The IPCC does describe how the ocean takes up heat. It’s obviously described in more detail by non-IPCC literature as well. Ocean heat content increases are well known and are broadly accepted by most scientists.
Warm water floats.
bdgwx:
You say ‘The IPCC does describe how the ocean takes up heat’ – great, can you provide a source to this particular description please? Many thanks.
The heat from the atmosphere only warms the top 1mm ‘skin’ or so of the ocean, which then dissipates via evaporation before it can penetrate deeper – how does this heat reach the lower depths of the ocean without being recorded passing through the upper ocean first?
You also say ‘This does cause thermal expansion and contributes to sea level rise.’
If the ocean is absorbing more heat from the atmosphere due to AGW, why is the ocean not expanding at an increasingly faster rate in line with the warming atmosphere? The IPCC agrees the ocean is not expanding at a faster rate so why not?
Empirical experiment shows that surface incident LWIR can neither heat nor slow the cooling rate of water free to evaporatively cool.
Interestingly, I found an unusual effect of LWIR on water hotter than 40C. (A curiosity irrelevant to climate, given normal surface temperature range). Dependant on air speed and humidity, in some circumstances surface incident LWIR can accelerate the cooling of water over 40C.
It seems counterintuitive, but it can be explained by the molecular/kinetic theory of fluid temperature.
AR5 WG1 Ch. 3 contains a summary of oceanic heat content and some commentary on radiation, sensible, and latent heat fluxes that contribute to OHC changes. Ch. 13 contains a summary of components that contribute to sea level rise. Each chapter has an extensive bibliography for a more in depth analysis of the topics.
Shortwave radiation penetrates deeply and of course ocean circulations and haloclines play a role in the vertical mixing of heat.
Thermal expansion is proportional to OHC increases. The heat uptake looks fairly constant since about 1985 or so from what I see.
bdgwx:
I’ve already searched chapter 3 of the AR5 Working Group I previously and there is no explanation of the mechanism by which heat is transferred from the atmosphere to the ocean. The reason you’ve also failed is because it isn’t there, so why don’t you just admit it instead of sending me on a wild goose chase. If I’m wrong then please specify which page, chapter, etc.
Also, you say:
“Shortwave radiation penetrates deeply …”
No it doesn’t, it only penetrates a few milimeters:
https://www.sciencedirect.com/topics/earth-and-planetary-sciences/long-wave-radiation
Also, you say
‘Thermal expansion is proportional to OHC increases. The heat uptake looks fairly constant since about 1985 or so from what I see.’
Sorry the last bit got cut off for some reason.
Also, you say
Thermal expansion is proportional to OHC increases. The heat uptake looks fairly constant since about 1985 or so from what I see.
The ocean heat uptake remains constant yet the atmospheric heat rises, i.e. there is no correlation between the two, yes?
bdgwx:
Sorry, I wa busy and screwed up my last couple of comments, so let me consolidate & correct them here:
I’ve already searched chapter 3 of the AR5 Working Group I previously and there is no explanation of the mechanism by which heat is transferred from the atmosphere to the ocean. The reason you’ve also failed is because it isn’t there, so why don’t you just admit it instead of sending me on a wild goose chase. If I’m wrong then please specify which page, chapter, etc.
Also, you say:
“Shortwave radiation penetrates deeply …”
Yes it does, but short wave radiation is from the sun, long wave radiation is from the atmosphere & it only penetrates a few milimeters into the ocean – the sun warms the ocean, not the atmosphere:
https://www.sciencedirect.com/topics/earth-and-planetary-sciences/long-wave-radiation
Also, you say
‘Thermal expansion is proportional to OHC increases. The heat uptake looks fairly constant since about 1985 or so from what I see.’
The ocean heat uptake remains constant yet the atmospheric heat rises, i.e. there is no correlation between the two, yes?
“long wave radiation is from the atmosphere & it only penetrates a few millimeters into the ocean”
The LW thermal energy absorbed in tap water from the night time atm. though can be detected by thermometer several inches deep in ambient surface water as demonstrated by Dr. Spencer’s testing back in 2015. His setup was able to detect high cirrus clouds passing in view of the water during the night in the thermometer temperature data. He also showed the theory supporting the data.
“he heat from the atmosphere only warms the top 1mm skin or so of the ocean, which then dissipates via evaporation before it can penetrate deeper how does this heat reach the lower ”
Nope, Magoo. How does this muuch debunked myth keep getting recycled?
Complelely false. If true, then my coffee cup could never be warmed in the microwave because it only penetrates 10 mm!
The heat penetrates by conduction and turbulent mixing well before evaporation.
Magoo, it’s not just the atmosphere warming the ocean that contributes to ocean heat content changes. It is the net effect of many fluxes including incoming shortwave radiation, downwelling longwave radiation, upwelling longwave radiation, sensible heat, latent heat, etc. They all have to be considered. The IPCC provides an extensive bibliography in which each of these are estimated. On a planetary scale the average incoming solar flux taken up by the surface is 160 W/m^2, but the DWIR taken up by the surface is 340 W/m^2 so it is a rather large component in the energy budget.
Magoo, the current energy imbalance on the hydrosphere is about +0.6 W/m^2. This rate of uptake appears (to me) to be fairly constant since about 1985. That means the rate at which OHC is increasing is about 10e21 joules per year. And of course this correlates with atmospheric temperature increases. The atmosphere and hydrosphere go through an equilibration process that takes decades to play out. It is part of the reason why there is a lag between the transient climate response and the equilibrium climate response.
bdgwx, Nate, Ball4:
‘The incoming longwave radiation from the atmosphere is absorbed in the top millimeters, unlike incoming shortwave radiation that penetrates much deeper (Section 5.4.3.2).’
source: https://www.sciencedirect.com/topics/earth-and-planetary-sciences/long-wave-radiation
Sorry guys, but maybe you should do a little more research.
Or this one:
‘At the ocean surface, most of the incoming infrared (IR) radiation is absorbed within the top micrometers of the ocean’s surface where the thermal skin layer (TSL) exists. Thus, the incident IR radiation does not directly heat the upper few meters of the ocean.’
source: https://agupubs.onlinelibrary.wiley.com/doi/pdf/10.1002/2017JC013351
I can get you some more if you like, but I’m sure you know how to look up a scientific paper on Google – or do you?
Sorry Magoo, but maybe you should pay more attention to experimental thermometer data.
“the incident IR radiation does not directly heat the upper few meters of the ocean.”
Pay attention also I did not use the word heat.
Surface ambient water thermometer temperatures several inches deep have been demonstrated affected by added/subtracted passing high cirrus clouds LW IR. This backyard testing has been confirmed by theory & in situ for the ocean surface waters using radiometers and controlling for changes in cloud downwelling LW IR.
The climate science is strong in you Ball4, but you just carry on believing what you want to believe if it makes you feel better. 😉
The climate science denial is strong in you Ball4, but you just carry on believing what you want to believe if it makes you feel better.
“Climate Extremism in the Age of Disinformation” is controlled by proper experiments especially observations out in the open on the atm. and ocean.
But do the global warming wars ever change anyone’s mind? Not McGoo’s. Dr. Spencer: “I suppose there are a few people whose minds have been changed…the unfortunate truth is that fewer and fewer people actually care about the truth.”
Magoo,
Your source is NOT saying that absorbed IR causes immediate evaporation and therefore doesn’t warm the ocean.
The energy is indeed abs*rbed in microns, but conducts within a minitue to cm.
Ive done the experiment of using an IR heater (for reptile pets) to heat water from above.
It works. Water in a bowl gets hot. Try it yourself
Magoo,
Your source does NOT support the second half of this statement:
“The heat from the atmosphere only warms the top 1mm ‘skin’ or so of the ocean, which then dissipates via evaporation before it can penetrate deeper”
Where is the evidence that it dissipates via evaporation before penetrating?
The IR is indeed abso*rbed or emitted in a few microns thick skin. But once absor*bed, conduction makes it penetrate mm in seconds, than cm in minutes.
If you go thru the calculation, you will see that evaporation does not prevent this.
The experiment can be easily done at home with a ceramic IR heater, like this one: https://images-na.ssl-images-amazon.com/images/I/71Bs8YmgRlL._AC_SL1499_.jpg.
Reptiles understand they can use IR to get warm.
Ive heated a cup of water from above using the LW IR from this device.
You can try this yourself.
Yes, yes, I’m sure you’re right, I believe you, whatever you say …
Magoo
The GHG back radiation effect opperates at a quantum level. Thermodynamics do not apply. The GHG reduces the rate of surface to space cooling as 50% of photons are re emmited downwards causing the surface to warm up from absorbing 5000k solar photons until it reaches thermal equilibrium.
You really haven’t got the faintest idea what you are talking about, have you?
Dr Roy Sepncer you and Dr Christy you both have a problem and it is this:
https://earthdata.nasa.gov/learn/sensing-our-planet/highs-and-lows-of-temperature
We in Australia are experiencing an apocalyptic record high-temperature Summer. It is indescribable and kind of surreal whilst you attempt to conflate USA PRESENT WINTER conditions with the rest of our planet.
God help our the planet with your policy agendas in Washington.
apocalyptic ha ha ha
Who won the last election in Aussie
Regards
Harry
Baghdad Bob.
People liked his message.
According to the BoM the highest November temperature recorded at Brisbane Regional Office was 41.2C on Nov 18, 1913 i.e. ~12.4C above the average for November — now that is apocalyptic, indescribable and surreal.
Ross, are you this harsh on your own? The time to make an “error”, if you can even call it that, is in the beginning.
“Secondly, in the 25+ years that John Christy and I have pioneered the methods that others now use, we made only one “error” (found by RSS, and which we promptly fixed, having to do with an early diurnal drift adjustment). The additional finding by RSS of the orbit decay effect was not an “error” on our part any more than our finding of the “instrument body temperature effect” [8] was an error on their part. All satellite datasets now include adjustments for both of these effects.”
Chris Hanley & al.
I don’t live in Australia and therefore I do not need to suffer about climate extremes occuring there in whichever direction.
I downloaded GHCN daily data a few days ago, so it includes some 2019 November data for nearly all countries.
No idea what BoM tells to whom. Obtaining data from their site is a bit less simple than some may suppose.
But to NOAA the Bureau has communicated since longer time. And I download NOAA data since longer time.
*
Here is the top10 of the November subset of a descending sort of about 8,000,000 daily TMAX records for Australia, generated 30 minutes ago:
___BIRDSVILLE_POLICE_STATION__ 1990 11 17 48.7
___BIRDSVILLE_AIRPORT_________ 2006 11 30 48.5
___BIRDSVILLE_POLICE_STATION__ 1987 11 19 48.2
___GOLDSWORTHY________________ 1973 11 19 48.0
___TARCOOLA___________________ 1993 11 30 47.9
___DERBY_POST_OFFICE__________ 1968 11 16 47.8
___MARREE_COMPARISON__________ 2009 11 18 47.4
___ROEBOURNE__________________ 1973 11 19 47.4
___PORT_HEDLAND_AIRPORT_______ 1973 11 19 47.4
___CAMBALLIN__________________ 1974 11 26 47.4
*
Sorry for the underscores, they allow for efficient UNIX sorts of station data.
As you can see, Chris Hanley, no 1913 data at the top, though indeed Brisbane correctly appears:
___BRISBANE_REGIONAL_OFFICE___ 1913 11 18 41.2
but this first Brisbane record appears in the November subset at position… 19877. Sorry…
And here is the top10 of the 2019 subset of the November records:
___BROOME_AIRPORT_____________ 2019 11 9 43.7
___PORT_HEDLAND_AIRPORT_______ 2019 11 10 43.6
___PORT_HEDLAND_AIRPORT_______ 2019 11 8 43.3
___BIRDSVILLE_AIRPORT_________ 2019 11 2 42.3
___BROOME_AIRPORT_____________ 2019 11 5 42.0
___RABBIT_FLAT________________ 2019 11 1 41.9
___BROOME_AIRPORT_____________ 2019 11 8 41.9
___BROOME_AIRPORT_____________ 2019 11 7 41.7
___RABBIT_FLAT________________ 2019 11 2 41.6
___GERALDTON_AIRPORT__________ 2019 11 8 41.5
Thus, from my currently supermild Germany (no winter since years), I think I can very well understand Ross Brisbane’s position.
Best regards
J.-P. D.
That’s all very interesting but the records are not long, for instance:
The Birdsville Police Station highest T data goes back to 1954, Birdsville Airport to 2000, Goldsworthy to 1966, Tarcoola to 1921, Derby Post Office 1964, Marree 1939, Roebourne 1957, Port Hedland Airport 1948, Camballin 1965.
Inland Australia can get mighty hot in summer, apocalyptic, indescribable and even surreal:
http://joannenova.com.au/2019/01/forgotten-history-50-degrees-everywhere-right-across-australia-in-the-1800s/
It’s late, but anyway…
This may be appropos; https://realclimatescience.com/2019/12/climate-fraud-could-crush-australias-economy/
This one is for Ren, who always has his finger on the pulse.
Hot off the press, 2019 was the warmest year on record for Australia with an anomaly of +1.5 C easily beating 2013 ( +1. 33 C).
https://tinyurl.com/vhnjj2v
This maybe why the face of Australia currently has so many freckles.
https://postimg.cc/WFZvmSw0 .
Been miserable in Melbourne. The weather was driven by cold oceans surrounding the continent due to strong positive IOD and weak el nino. Then in September the stratospheric warming event led to neg AAO with lots of dry antarctic air and repeated bursts of low level snow. The pattern block the desert heat causing it to build up. That then brings the monsoon. Which with the rappidly warming ocean north of australia should arrive soon.
Finding what is wrong is one thing, fixing it is another. So what is the fix, if any?
Nabil, as the saying goes: if it is not broken, then don’t fix it.
As the saying goes: Ball4, please stop trolling.
Dr. Spencer,
In theory, couldnt the discrepancy in surface and LT trends be explained by a steepening lapse rate? IOW, is it possible the near-surface is warming faster than the air higher up?
Dr. Spencer,
May be the average of the models is not relevant. We should see them one by one. It seems the japanese and russian models are not bad at all. Of course we have to see if they still predict the future correctly.
We shall see.
Kind regards.
Jose
The ensemble is the sum of 250 odd runs by different researchers interested in the effect of different variables.
There was no attempt to bracket a particular value, though there was a hope that the ensemble could identify the likely maximum and minimum limits.
In practice, reality had forcings well below the average model run. It is not therefore surprising that the models whose forcings most accurately matched reality are in the lower part of the range.
Entropic Man, please stop trolling.
Not only in the Tropsphere but also in the air above the oceans were collected data. A new paper written by colleagues of Roy https://rmets.onlinelibrary.wiley.com/doi/full/10.1002/joc.6354 has analysed it. In table 2 of the paper are mentioned some trends for 1979…2018. I compared the given trend slopes with the CMIP5 mean ( the value “tas” makes an apple to apples comparison) globaly and for some zonal belts:
https://pbs.twimg.com/media/ELm2u1_WkAEXzV6?format=jpg&name=small
The result is striking… in the tropics the CMIP5’s have the biggest overestimations of the trend slopes… There is something very wrong with the skill, isn’t it?
I’m not sure why but this blog is loading very slow for
me. Is anyone else having this issue or is it a problem on my end?
I’ll check back later and see if the problem still exists.
England Trja Barn
Well to be honest, we all have lots of problems with this blog, and Roy Spencer is aware of them.
But speed? No.
Maybe it’s the influence of the Three Children…
It is spam. Generic comment, link to a random (phishing) site, name consisting of random words.
I’m new to Dr. Spencer’s blog. I just read his “climate change 101” item and found it very instructive. This isn’t my field but it is important to me- because, I’m a forester and have been for 47 years. Here in Massachusetts, climate “alarmists” have a goal to stop all forest management (meaning, mostly, timber harvests) because they say not cutting the trees will help “save the planet”. Of course, I think good forest management (silvicultural work- timber harvesting done right) is a great thing. Most logging around the world is poorly done and contributes to all sorts of problems. But when done right, it’s very beneficial to the forests, the planet and to our civilization. So, I hope to learn more about the subject. I am a fan of Tony Heller and I realize he’s controversial- but his videos are quite interesting. But no doubt I’ll learn a lot more by catching up with Dr. Spencer’s blog and books. I’m truly hoping climate change is NOT an existential threat to the planet and I certainly resent “alarmists” attempting to terminate all forestry work- especially when they offer no alternative to wood as a low carbon footprint raw material for construction, furniture, paper products, etc.
Let me reassure you on one point. Here is my prediction that you can take to the bank:
“…climate change is NOT an existential threat to the planet.”
It has been suggested by the “Media” that a “Climate Catastrophe” will occur based on a statement made by the IPCC in 2018 that said we only have 12 years to prevent it.
Some say that means the catastrophe will occur in 2030 but most people realize that is absurd. These are the same people who are 0-41 on similar predictions over the last 40 years:
https://www.breitbart.com/environment/2019/09/20/nolte-climate-experts-are-0-41-with-their-doomsday-predictions/
If you had been in charge in California you would have cleared the fire breaks and dead wood in the forests. That would have reduced the wildfires that have caused electrical service to be turned off in many places.
Always do what is right. You will gratify some and astonish the rest. (Mark Twain)
Minimal solar activity disrupts the ENSO cycle. This causes weather anomalies in many parts of the Earth. This particularly affects drought in northern Australia.
https://www.tropicaltidbits.com/analysis/ocean/nino34.png
If I were wearing a loose shirt, I could calculate a lapse rate, so to speak, between my skin temperature and the temperature of the shirt. 1 degree cooler for every millimeter above the skin……. something like that.
Adding inner layers of clothing, my skin would get warmer, the outer shirt would not. The lapse rate has steepened.
So, if GHGs are like layers of insulation, why would we expect the near-surface and layers higher up to warm in unison? Why do we expect a consistent lapse rate?
The lapse rate is reduced by warming because of being reduced by specific humidity. Cold air saturates at low specific humidity and as such tends towards a dry lapse rate of around -9.7K/km. Warm tropical air has a much lower lapse tending towards around -6K/km, because of its higher availabile specific humidity.
Warming the full planet raises the mean atmospheric specific humidity and with that the mean global lapse is reduced as a consequence. This is negative feedback that stabilises surface warming against top of atmosphere flux imbalance forcing.
The lapse rate is reduced by warming because of being reduced by specific humidity. Cold air saturates at low specific humidity and as such tends towards a dry lapse rate of around -9.7K/km. Warm tropical air has a much lower lapse tending towards around -6K/km, because of its higher specific humidity.
Warming the full planet raises the mean atmospheric specific humidity and with that the mean global lapse is reduced as a consequence. This is negative feedback that stabilises surface warming against top of atmosphere flux imbalance forcing.
So you are a Russian Science denying Bot ☺.
Dr Spencer,
I’m happy to see this post, but I still hear no mention of the possibility of the AMO cycle (which is based on the 61 year yoshimura and 84 year gleissberg cycle) being the cause of the trend. We have had a very strong correlation between land temperatures and the AMO in the eastern US, Europe, and the middle east over the last several centuries. Of course any human impacts should be on top of the AMO forcing, not replacing it… it means the recorded temperature changes we’ve seen since 1980 can be split into 3 components… AMO ,ENSO, and human activities.
The graph labels seem to say that the CMIP values correspond to the LT temperatures in those models. Maybe Dr. Spencer can clarify.
If that’s true, it’s an apples-to-apples comparison. The oranges-to-oranges comparison of surface temperatures looks better for the models. But if nearly all models overestimate LT warming, the models are flawed.
Flawed model physics isn’t the only explanation for model/observation discrepancies. The other explanation is flawed inputs. In fact the literature available to date suggests the later (model input) is more responsible for the discrepancy than the former (model physics).
I’d like to Dr. Spencer do the same comparison with the CMIP5 suite ran with the scenario that actually played out as opposed to one of the RCPs. Comparing temperatures at the same layer as RSS and UAH goes with that saying.
BTW…Hausfather et al. 2019 did just that recently for the older models as far back as the 70’s.
An illustration of what I mean might be our consensus model of gravity. We can use it to predict the escape velocity of Earth. But if you plug in the wrong value for the mass of the Earth you’ll a wrong answer. It’s not that the model physics was wrong. It’s just that we used the wrong input.
That’s almost certainly in play with climate models too as well. In fact, Hausfather determined that Hansen’s 1988 model predicted a trajectory of the global mean temperature that is nearly indistinguishable from observations when he fed the model with correct inputs instead of using Hansen’s scenarios. The lesson here is that we need to be better at predicting human behavior and volcanic eruptions if we want to improve forecasts.
bdgwx, please stop trolling.
@Bri
Why do you think asking a question equals science denial?
Snape, please stop trolling.
@Perfecto
[The graph labels seem to say that the CMIP values correspond to the LT temperatures in those models. Maybe Dr. Spencer can clarify]
Yes, I see youre probably right. I wonder how the ensemble differs when simulating near-surface temperatures? More warming, or less?
I note, once again, that some models do track the satellite data. Which ones are they? How do they differ from the failed models?
There seem to be models that work. Shouldn’t we focus on them.
A whine: We average data because we think the differences are due to random errors, which we hope are cancelled out in the averaging. But the differences between the models are systematic, not random, and averaging their predictions is illegitimate.
If you make hundred models spreading prediction from 1 to 10 degrees unless it actually starts cooling you will always have one that is apparently correct . thats for the ignorant public , scientifically the high range spread they show is a proof the models are wortless
You might be right, but I stll want to know why a few models track the data.
Dude you are dense
Excellent way of describing, and nice article to take
facts concerning my presentation focus, which i am
going to present in university.
Juventus Tj
@Eben
[the high range spread they show is a proof the models are worthless]
If a model is spot on when compared to observations, you think its proven to be worthless if it doesnt match the poor performers?
I keep my own score card anyway
https://i.postimg.cc/28Jc0BCN/predictions.png
I agree with Scott R. that the AMO cycle is relevant. Throughout the 20th century it correlated well with global temps. When the AMO went down the temps went down. When the AMO went up, the temps went up. This is not unreasonable. The ocean is a giant heat reservoir, and it makes sense that fluctuations in ocean temp would affect atmospheric temp.
The most recent upturn in the AMO started around 1975 and has only recently topped out. Shouldnt that rise in AMO have biased the UAH temperature trend high? After all, the UAH only started in 1979. It has never seen anything but a rising AMO index. When the index turns negative, wont that change decrease the slope of the UAH trend?
Gregory… thanks. Why so many ignore this cycle is beyond me. I’ve actually looked deep into the AMO data and found the Gleissberg (84 year) and Yoshimura (61 year) cycles. It means the AMO is caused by either the barycenter movement of the solar system directly, or by causing the sun to become more or less active. Either way, we are due for both the -Gleissberg and the -Yoshimura. That will cool things off. Ignoring the AMO in the models is bad science. The models will look even worse down the road because they attribute the warming to man made gases rather than natural forcers. The whole premise that the models were built on is wrong.
https://www.facebook.com/100000276969216/posts/2782656818420190?sfns=mo
Scott, there are many such cycles. The temperature effect of added ppm C02 for example though is monotonic in the lower atm. This monotonic signal is added to the cyclic signals at both top, bottom, and during any cycle & combination of cycles. The magnitude of the monotonic temperature signal from added grey absorbers in our atm. is thus important to understand.
Ball4 I leave room in my theory for human impact, I just think the impact is very small. Please come over to my facebook page and look at the data alignment for my home town between the recorded temperatures and the AMO. The same relationship exists in many places. This is a significant forcer. We therefore must split the 1980-2016 warming into 2 intermediate forcers… the AMO and humans. But once you do that, it can be quickly realized that there is not much room for CO2 based on past temperature swings during AMO+. What we are experiencing now isn’t too far off from what is normal for this part of the AMO cycle. There are only so many slices of pie to go around. Taking it out one step farther, it sure seems like there is a longer period forcer under the AMO. We happen to be in the warming part of the cycle since the little ice age. Most scientists agree, the sun will hibernate for a while now ending that longer period cycle as well. Again, ignoring this cycle will also lead to bad conclusions on the physics of the planet as far as CO2 and failing models.
My bottom line conclusion is that changing the atmosphere of the earth by 0.01% doesn’t do much. If that’s how physics worked, no life on earth would have been possible hundreds of millions of years ago. Something has gone wrong in mainstream climate science. The data does not match the hypothesis.
Scott, the CO2 ppm increase after 1938 to 2013 was estimated back then to raise global median near surface air temperatures monotonically by about 0.7C in the period or about 0.01C/year. That monotonic temperature increase is what was arguably thermometer and radiometer measured so nature agrees with your judgement “impact is very small” or “doesn’t do much” as assessed against daily temperature ranges varying much larger on ranges of ~10C or more.
So you’ve concluded the +2.0 W/m^2 force resulting from increasing CO2 did nothing, but the 0.0 W/m^2 of force resulting from the AMO cycle is the magic bullet?
And speaking of life hundreds of millions of years ago…how do you solve the faint young Sun problem without GHGs?
Ball4,
In order for that to be true, the AMO would just have to stop happening, which it hasn’t. The underlying forcers are still there. You can see the spikes aligning with the 61 and 84 year cycles in the AMO data yourself if you would head over to my charts. CO2 can not do that. You don’t get “events” on repeating cycles from a change in co2 concentration.
bdgwx,
I never agreed to that 2 w/m^2. That conversation ended with an impasse remember?
You are wrong about the 0 w / m^2 for the AMO. Go look at my data and see the spikes. There is an energy transfer happening at regular intervals there. How else can you explain these spikes?
As far as the faint young sun problem… You are talking about 6% CO2 changing to 0.03% vs a change from 0.03% to 0.04%. So the drop in CO2 between the faint sun and pre-industrial levels was 597 times greater than the rise from 100 years ago. Not to over simplify, but 597*.7c (the modeled change for the past 100 years)= 418 deg c warmer 500 million years ago based on the current models. (haha) I understand it is a log function, but I’m just trying to make a point here that something has gone wrong.
Scott,
I agree the AMO is a response to an energy transfer process. But it is not itself a cause for a global scale energy imbalance like what is being observed. In that regard it is not a climatic force and does not directly contribute to the bulk energy imbalance on the planet. It is only the manifestation of heat movements within the climate system. Think about it this way…if it were truly a climate forcing agent then you would need to identify its source of energy. What do you think it’s source of energy would be? Remember, the entire geosphere is warming including the cryosphere, hydrosphere, atmosphere, land, etc. Something is causing the geosphere to accumulate energy in bulk. So what energy reservoir would the AMO be tapping to cause this under your theory?
“In order for that to be true, the AMO would just have to stop happening, which it hasn’t.”
Scott, again, the so-called AMO cycles internal energy with no long term temperature change as bdgwx writes. The CO2 signal occurs monotonically and occurred as earlier predicted when the SSTs were in the neutral zone of all their cycles. If you read the literature, other than ENSO, there is some doubt about the ocean temperature cycles falling within measurement error. (cf. Folland et. al. 1984).
bdgwx,
To be honest, I’m really not sure if the spikes observed in the AMO are actual energy inputs, or if they are simply a product of our limited measurement practices of the ocean as a whole.
What I’m saying is there could be 2 phases in the north Atlantic. In one phase, the cold water pools in areas we measure. In the other phase, the cold water pools in areas we don’t measure.
Going down the road of it being an actual energy input, it could be a geological response for the mid Atlantic ridge… or it could be a symptom of the blocking high strengthening and weakening out in the Atlantic. Perhaps it is solar driven… having to do with the solar wind, magnetic field. Perhaps it is related to just simply being a tipping point in a back and forth cycle that sends the earth to 2 different equilibrium points every 70 years. Why would that be so shocking? Of course the earth is bouncing back and forth between 2 equilibriums. The climate of the earth is never stable. The 2 equilibriums move up and down depending on many different things, but the earth always finds a balance.
Anyways… I don’t know for sure why the AMO is doing what it’s doing, but the data is there, it matches the Yoshimura and Gleissberg cycles which are forcers triggered by the planets and sun. It needs to be studied, not ignored.
“It needs to be studied, not ignored.”
It is not ignored. As the Argo floats accumulate data, the ocean temperature cycles should come within measurable limits.
Dr. Spencer: “Let’s stop removing the average annual cycle from the data. That way, those who believe in global warming can point to the 6 months of the year when temperatures are usually rising. And those who dont believe in global warming can point to the other 6 months when temperatures are usually falling. Everyone will be happy…during their half a year anyway.
If only we climate scientists knew about annual cycles before this was just explained to us.”
Ball4,
It IS being ignored when the linear trend since 1980 is being presented to the public as if there is only 1 forcer that could have contributed to that.
As for the rest of your comment, that is awfully facetious of you. Of course I realize the UAH is a departure from average which includes the seasonal changes.
The equivalent to the UAH linear trend logic on a smaller time frame would be recording the raw daily data in the NH from March-July, drawing a trend line, and predicting the earth will boil over in a year.
Scott, the investment in Argo floats demonstrates the ocean SSTs are not being ignored. The AMO et. al. cycle data is being gathered & improved with precision thermometers.
Sure, there are some presenting to the public less than the full story & even untruths, this has long been the case in more than just the field of meteorology.
Scott,
The geosphere has accumulated 250e21 joules of energy since 1980. Everything has warmed. The cryosphere, the hydrosphere, the troposphere, the land, etc. Everything. Heat isn’t just being moved around by the AMO. It is being accumulated in bulk. The AMO can’t do that.
Also, consider how AMO is measured. It is computed from SSTs in the North Atlantic. But the AMO index is detrended to produce the cycle signal and remove the linear signal. When you look at raw NA SSTs you see a clear linear upward trend that correlates well with global SST increases. This is consistent with the observation that the hydrosphere is taking up heat and warming as a whole.
Finally, consider that there are other regions in the hydrosphere besides the AMO. There is also the PMO for example that has also been implicated as an interval variability mechanism for troposphere temperatures. But again these are only drivers of internal variability since they are incapable of producing (at least directly) global scale energy budget perturbations.
bdgwx,
I am very aware that there is a un-de-trended version of the AMO. I’ve even looked at the unsmoothed version that leaves seasonal changes in. In my opinion, the north Pacific and north Atlantic don’t look that different once you detrend everything.
The energy you are seeing that is accumulating, is a higher time frame change than the AMO. It is a ~ 365 year GSM cycle caused by movement of the planets around the barycenter of the solar system, and solar activity linked to changing planetary positions. There is also a ~2000 year cycle related to that. Basically, 5 unique GSM cycles make 1 super GSM cycle. Both cycles aligned in the positive phase as we came out of the little ice age. This created a massive warming event at the time. Please read Zharkovas paper.
https://www.nature.com/articles/s41598-019-45584-3
It is also possible that there is a cycle around 120-210 years (based on what others have said) and I’m intentionally being that vague because I’m still struggling to nail it down myself across multiple data sets each with their own set of delays. It might be impossible to nail it down as there are too many harmonics and delays clouding the picture.
Yes. I’m familiar with the Zharkova paper. The paper is rooted in her erroneous claim that the Earth/Sun distance changes due to solar inertial motion and that causes solar irradiation to change over the course of centuries. But the reality is that the Earth/Sun distance does NOT change due to the SIM. You can see below that multiple expert reviewers are trying to explain the error to her and she’s just not getting it. The journal is said to be investigating the error. There are other problems with the paper as well.
https://pubpeer.com/publications/3418816F1BA55AFB7A2E6A44847C24
At any rate a 2.0 W/m^2 force, of which maybe 1.4 W/m^2 has already done a fast equilibriation leaving 0.6 W/m^2 as the current imbalance, would require a TSI change of (2.0 / 0.7) * 4 = 11 W/m^2 to produce a similar force. Surely that would have been noticeable don’t you think? None of the TSI reconstructions even come close to this magnitude of change. Nevermind that solar activity and TSI peaked 60 years ago and have remained flat even declined some since and during a period in which the current planetary energy imbalance actually increased. And we haven’t even gotten into the problem of the cooling stratosphere yet.
bdgwx,
Of course the earth sun distance is changing. The sun is paired with Jupiter, the most massive body in the solar system. This means that relative to the earth, the sun’s location can move up to 1 solar diameter between max and min. Significant enough to make a difference. Also, that doesn’t begin to address the fact that these movements contribute to the activity on the sun as well.
The last solar cycle was one of the 6th strongest in the last 400 years, and the 7 strongest cycles have just occurred. There were arguably 27 solar cycles since the little ice age. Being that we are in the 6th strongest cycle, that puts us in approximately the 22nd percentile for solar activity. An example of a calendar day of the year in the 22nd percentile for NH seasonal irradiance would be July 31st. So as you can see, based on percentile, we are still in the dog days of summer on the 400 year time frame.
Sure. The Earth-Sun distance is changing, but not because of the SIM. It is because of the eccentricity of Earth’s orbit which has periods of 95k, 125k, and 400k years. The Sun’s wobble about the solar system barycenter is just that…a wobble. The Sun’s orbit around the SS barycenter has a period approximated by the orbital period of Jupiter which is about 12 years. It’s important to understand that the Earth-Sun system still has a constant semimajor axis distance throughout the wobble cycle because the Earth is locked onto the Sun via it’s gravitational pull which is also constant. That means the Earth is pulled along with the wobble. This is similar to the Earth-Moon barycenter wobble. Note that like the Earth with respect to the Sun the Moon also has a constant distance with respect to the Earth in the context of their barycenter motions. An even more dramatic visualization plays out with Jupiter and its moons.
Now I think you could make an argument that solar activity is linked with the SIM given the similar periods. But solar irradiation due to internal cycles of the Sun is a completely different topic from the solar irradiation due to the Earth-Sun distance.
Sorry…meant to say an even more dramatic visualization of this plays out with Pluto and its moons. This is because the barycenter lies outside of Pluto’s radius. Charon and the other moons still have constant distances despite the extreme wobble.
bdgwx,
The 11 year solar cycles is likely caused by Jupiter. The way Saturn, Uranus and Neptune balance that system probably determines if we are in a solar min, solar max, and also the longer time frame cycles like Yoshimura and Gleissberg. I’m still trying to determine if it is the way the these offset 61, 84 year cycles combine makes the longer cycles such as 190~206, 365-420, depending on cancelling or combining or if they are completely separate things. The 11 year cycle might have 2 forcers – solar activity and the distance. I haven’t done the TSI calculations myself to compare that. Actually, my gut tells me that TSI isn’t the most important factor here, more likely just a proxy we can use to determine what else might be going on and when. I THINK that during periods of high solar activity, the sun probably outputs high energy particles, gamma radiation, and that is what is actually important. You can see that in 1998, we had a sun quake.
https://sci.esa.int/web/soho/-/37379-sun-quake
Was SOHO errors 1 month later really caused by human error or was there a gamma ray burst?
https://umbra.nascom.nasa.gov/soho/SOHO_final_report.html
This energy surge shows up on the AMO, ENSO, UAH. The super enso of all ensos.
I’m certainly open to arguments that advocate for a link between Jupiter and solar cycles. I mean if orbital cycles can modulate glacial cycles on Earth then it seems plausible that orbital cycles can modulate the solar dynamo as well. I’m not saying it works that way, but I’m not dismissing it either.
bdgwx, please stop trolling.
I notice Skeptics “end with” a La Nina trough and Alarmists “end with” an El Nino peak.
2019 was a ENSO neutral year. It would probably be a good comparison.
Aaron S,
2019 was a very solid +ENSO year, and also contained the strongest SSW event for the south pole since 1980, and also a SSW for the north pole at the start of the year. The only month so far that didnt see the 3.4 region over 0.5 was September. (using HADSST3)
I’d hardly call that neutral.
I am trying to understand what you mean? ENSO was neutral in that the Nino 3.4 data set was not El Nino or La Nino, and since there is a clear lag between El Nino ocean and El Nino U troposphere then it has to be neutral for 6 months or a yr prior. I have never seen 0.5 considered the threshold for defining El Nino and that heat will lag in trop reading.
But I am interested in understanding what you mean. Especially about SSW? Does it correlate with L Trop global temp data?
https://climatedataguide.ucar.edu/climate-data/nino-sst-indices-nino-12-3-34-4-oni-and-tni
Aaron S,
You can read about what officially defines El Nino conditions here:
https://origin.cpc.ncep.noaa.gov/products/analysis_monitoring/ensostuff/ONI_v5.php
With that dataset, they use 0.5 for 3 months.
ERSST.v5 is not the same as HADSTT3, even though the same exact region is used for ENSO 3.4. Taking the 3 month average of HADSTT3 does not equal ERSST.v5 3 month average. I know NOAA constantly updates the base period (every 5 years) which could explain some of the difference, but I still see issues.
I believe the HADSTT3 data for the 3.4 region corresponds better with global temperatures than ERSST.v5 + adjustments that NOAA uses. Here is a link to a study I made:
https://www.facebook.com/100000276969216/posts/2722223564463516?sfns=mo
I encourage you to run the numbers yourself.
As for the SSW events, this does impact the troposphere in particular at the poles. The heat moves from the lower atmosphere in the tropics, into the stratosphere above the polar regions, and then into the lower troposphere of the polar regions. You can read about it more here:
https://www.facebook.com/100000276969216/posts/2843052185713986?sfns=mo
Scott,
I have ONI readily available so I used that. I get a linear trend of -0.04/decade. With UAH I get +0.13/decade. It would appear that the ONI has little skill in predicting the long term UAH trend. However, I do agree that the ONI has satisfactory skill in predicting UAH variations. You are certainly free to use an alternate ENSO metric, but I suspect you’ll get a similar result.
bdgwx, please stop trolling.
Is there anywhere to access the CMIP5 lower troposphere model data?
Thanks.
TFN
Please have a look here:
https://tinyurl.com/u47uemb
… and here:
https://esgf-node.llnl.gov/projects/cmip5/
Roy,
Why is reference always made to the average of all the model curves as a method of quantifying official future temperatures? Why not use the models with the best correlation to past and present reality? Wouldnt that be more realistic?
Taking it a step further, why not publish and discuss the logic distinctions of the models with the best correlations compared to all the ones that just predict more and more deviant behaviour from the actual trend? That might get us closer to a reliable model and the truth of the matter. Mmmmmm. Maybe thats the problem?
Russ
“Maybe that’s the problem?”
Probably it is.
Roy Spencer and John Christy manifestly can’t manage to evoluate concerning this issue.
Some do it better, and choose for a fairer comparison, e.g. Grant Foster:
https://tamino.files.wordpress.com/2019/11/nasa.jpg
Source:
https://tamino.wordpress.com/2019/11/25/climate-models/
I still miss a credible explanation for this departure from many other time series between 2000 and 2005:
https://tinyurl.com/w2qn6dg
Averaging a bunch of models makes no sense at all.
All you need is one model that is consistent with past data. Sadly none of those models can explain past temperatures if you go back over the 80,000 years covered by GISP/GRIP or the 850,000 years covered by Vostok/EPICA.
Do you mean models cannot explain past temperatures within your expectations or do you literally mean models do not even out temperature as a predictive quantity? Be precise in what you mean here. If it is the former provide a quantity or at least some kind of rigid standard by which we can adjudicate if your expectations are met.
I like models but only if they are consistent with reality.
There have been dozens of CMIP models over the years but not one of them is consistent with reality.
Averaging a bunch of models that are all wrong does not improve the situation.
Define “wrong” and “consistent”. Under what specific conditions do you consider a prediction to be wrong or inconsistent?
Also, decide whether you want to adjudicate model performance based on the model’s physics, the model’s assumptions (input scenarios), or a combination of both.
Studies show that taking the mean of an ensemble of model runs that vary by initialization, time evolving assumption, stochastic perturbations, parameterization schemes, numerical core, model type, etc. yields higher skill than any one individual model run according to objective skill scores. So yes, averaging model outputs definitively improves skill. This principal is true of ensembling techniques in general and across all disciplines of science. Climate scientists didn’t invent it nor do they have a monopoly on its use.
BTW…one related area where ensembling improves skill is with short range weather forecasting. Single deterministic model runs exhibit about 7-8 days of useful skill at predicting 500mb heights according to objective anomaly correlation coefficient scores. But averaging many different model runs together improves useful skill by 1-2 days. Note that “useful” is defined as an ACC score of > 0.6.
I think the underlying principle is a model is not verified until it re-creates observed data. There is an over-emphasis on projections using the models and very little work attempting to re-create the past with the models.
I would say there are 2 tests. One would be using a model, with some set of reasonable assumptions, to generate something that looks like the temperature for the last few ~100k yrs (i.e. the MAX and MIN and the ramps in the general sense). This after all is the ‘climate’ we are in right now. The other (I would say the absolute minimum requirement to validate a model) is to re-create the last ~100yrs, where we had rising T from ~1900 to ~1940 with low CO2, then ~flat T from ~1940 to ~1970 with higher and rising T, then rising T from ~1970 to today (with a rate similar to the 1900-1940 rise) with much higher and much faster accumulating CO2.
Another issue which I really haven’t seen discussed is the notion of the stability of the system and the fact that we are currently close to the MAX for the ~500k yr record and some of the projections have us going well beyond the MAX from the single forcer (CO2). Normally, in a system as one approaches ‘the rail’ there is a natural restoring force making it harder to progress in that direction. Not saying that this is absolutely the case for the earth system, but I think it certainly could be…
Barry
This model looks good for the last few centuries:
https://tinyurl.com/y2xtsvtz
This model explains three million years of ice ages:
https://advances.sciencemag.org/content/5/4/eaav7337
Thanks Svante, hadnt seen those articles. I will give them a good read later.
The first one uses many measurables/knowns (volcanoes, aerosols, sunspots, etc) to adequately recreate (doesnt mean its correct) the last 150yrs. It cant be used to predict the future since these factors are not known yet. For example, what happens if the sunspots stop for a long period as some theorize? What would happen if we have cataclysmic volcanic activity as Ive read some think we are overdue for? What we have are models that will only predict warming because CO2 is a small positive forcer and it is assumed all else stays the same (which of course it doesnt). And, as I mentioned ~2-3C warming would move us out of the stable regime we have been in for ~500k yrs, which to me seems unlikely at best.
The second one is to me the best argument Ive seen yet as to why we should not reduce CO2 emissions, since it appears this would cause greater tendency for the next glaciation to begin. Ive read other articles too that seem to indicate we are entering the lower region of global CO2 levels needed to prevent glaciation but need ~80-100yrs more of status quo to reach the upper bound and make sure glaciation doesnt commence. Regardless of how accurate it is, just look at the overall trending of Fig 2, panel F. The overall trend of average temperature is down for ~2,000k yrs, with only very brief interludes of inter-glacials up to where we are now (reasonably comfortable earth). Do we really want to decimate world economies to reduce CO2, which may result in glaciation and heading back to the deep freeze?
Barry
I could be wrong about this, but the interesting thing about the publication in Svante’s second post is that it predicts both temperature and atmospheric CO2 concentration. Even more interesting is that it predicts the transition from 40k to 100k glacial cycles.
Your point is well taken barry. We don’t really know the upper limit for the point at which a glacial advance could still activate. And, though this might be a stretch, the current warming cycle may have activated a tripwire of sorts that unlocks a negative feedback that raises this upper limit. Again…that’s probably a stretch. But clearly we want enough CO2 in the atmosphere to avoid the next glacial cycle indefinitely as that would likely be worse than modest warming. Of course we don’t want the warming to get too far out of control either though. I’m just not convinced that 2C of warming is all that bad. I am open to arguments either way on that last point though.
Svante and bdgwx,
I had a little better read of the second article. To me this seems like a directed Monte Carlo approach using correlations and known dynamics to try to re-create the recent T, CO2 records, etc. Seems reasonable and rigorous. But, my take home conclusion is different than theirs. There seems to be an emphasis here (and elsewhere) that we want to keep mother nature just as she is, pristine, etc. However, looking at the last ~500k yrs for T, I strongly disagree. Furthermore, CO2 is just one of the ways we have bumped mother nature. There are many other ways (deforestation, pollution, other GHGs, etc) we have fouled up things…
Perhaps we do want to monitor and control CO2 emissions to keep the CO2 level at just that necessary to prevent glaciation for as long as we can. But, eventually carbon-based sources would run out and a while after that CO2 levels would decrease back to normal. But, perhaps 100yrs from now we’ll have better handles for engineering climate in our favor…
Barry
I agree, we should never have allowed another ice age.
30 ppm might have been just right.
https://tinyurl.com/v26vfyw
The last glaciation still commenced at around 300ppm so there is at least a bit of head room above preindustrial concentrations. However, I will say that 400ppm would likely put a very substantial resistive pressure to the next glaciation. I just wonder at what level an untimely hyperactive volcanic era simultaneous with a cool phase of the Milankovitch cycle would still resist a glaciation. It wouldn’t be surprising if 400ppm could still be overcome at least in theory. Much above that and I suspect it becomes unlikely quickly.
Svante, bdgwx, please stop trolling.
La Nina is expected only on strong solar wind.
https://www.ospo.noaa.gov/Products/ocean/sst/anomaly/anim_full.html
Superb, what a web site it is! This website gives helpful facts to us, keep it up.
Frankrike Trja
Roy, another spam from Trja.
More than 100 papers for the usual suspects to ignore, denigrate, or misrepresent:
https://notrickszone.com/2019/12/12/the-list-grows-now-100-scientific-papers-assert-co2-has-a-minuscule-effect-on-the-climate/
Well the first paper right away makes the erroneous and much debunked assertion that 5% of added co2 is from FF burning..
Not very encouraging..
Hurrah, that’s what I was searching for, what a information! existing here at this web site, thanks admin of this web site.
PSG Tj
@Geoff Wood
My comments always appear at bottom of the thread. I dont have time for a proper reply at the moment, but when I do this is where youll find me.
Ok Snape, so I will add this as food for thought. On both Earth and Venus the lapse rate measured is independent of opacity and as such making it sensitive to opacity is a mistake as it is not shown by these observations. By saying that warming (due to increases in GHG’s = increased opacity) increases the lapse rate you are not considering the measured vertical profiles and zonal changes we can easily measure. The lapse is reduced from the dry profile on Earth by latent heat transfer which is the major cooling function for the surface of a wet planet and the major source of atmospheric energy.
Geoff, your 1:56am comment is an example of disinformation that Dr. Spencer discussed back on Nov. 18.
In July of 1964, a paper by Manabe and Strickler showed that Earth’s vertical temperature lapse rate profile IS dependent on atm. opacity contrary to your assertion. Reading and understanding that paper should be food for your own thoughts.
Many recent energy balance papers show latent heat transfer FROM the surface of earth is observed balanced (95% significance level) by latent heat transfer TO the surface over certain 4-15 annual periods for nil net effect on global median near surface temperature in the periods observed.
Ball4, please stop trolling.
Thank you.
Weather is not just an academic or stock picking activity.
U.S. corn and soybean crops were planted late and due to colder days, both crops matured late. Three states have a few farmers leaving crops in the field over the winter.
Potato harvest may affect fast food french fries. Brazil is already seeing a bad corn harvest. African swine flu is marching east toward Germany.
Just a heads up on what Thomas Jefferson wrote “the ground froze as hard as concrete two feet down” Very bad for water feed lines.
Thank you for all you do. I look forward to your articles.
Dr. Roy,
Thank you for the excellent post on the CMIP5 models. As you likely know, Hausfather, et al, recently published an article entitled “Evaluating the Performance of Past Climate Model Projections.” I’ll put a link to the paper at the bottom of this post.
It concludes “that climate models published over the last 5 decades were generally quite accurate . . . .” Given that this finding appears to be in contradiction to this post, I would love it if you could opine on Hausfather’s paper.
I’m not a scientists, but I would note the following:
I believe Hausfather’s paper examined 17 models. However, I believe your “spaghetti” graph is the 106 models that were considered in the IPCC3 report. Is Hausfather’s use of a small subset of models appropriate?
The findings seem to be qualified, stating that the models examined are generally accurate, “particularly when accounting for differences between modeled and actual changes in actual atmospheric CO2 and other climate drivers.” If his findings of accuracy are based upon adjustments because forcings anticipated by the models didn’t actually materialize, can you really call the models accurate? Perhaps if the argument was “CO2 increases were lower than anticipated,” but he includes “other climate drivers” in this qualification.
I’ve only skimmed the paper, but I don’t see actual numbers discussed anywhere in it. For example, “Here is what the 17 models projected for warming,” and “here is the actual warming that was observed.”
Care to comment on “thermal inertia?” I am seeing that more and more when the over-warming of models is discussed. If the concept is that “the models were too aggressive because things don’t warm up really quickly,” shouldn’t that phenomenon have been accounted for in the models?
Link to paper: https://agupubs.onlinelibrary.wiley.com/doi/epdf/10.1029/2019GL085378?referrer_access_token=_QxQe6Njtj-obgRu-pRUn8OuACxIJX3yJRZRu4P4erveSGydNoNbpSTNSZ5Z1aDAU1Xs2rIU3Le9v9UWpLY537Rl4_4NUuN3NIo1jJM3ut_fnDt270Q0hYXiXODmoFSc0vMHHBhlCSdZWUF5GwkbbQ%3D%3D
Kolg8 said: If his findings of accuracy are based upon adjustments because forcings anticipated by the models didn’t actually materialize, can you really call the models accurate?
Models do not predict human or volcanic emissions. In this context they do not anticipate forcings. These are inputs. What Hausfather is saying is that when you use the correct inputs the models produce outputs that match reality quite well. This tells us that model/observation discrepancies have more to do with poor inputs rather than poor model physics.
I presented this analogy above. We have a pretty good model of gravity. You can use it to predict the escape velocity for Earth. But to get the correct answer you must give the model the correct value for the mass of Earth. If you give the model an incorrect value for the mass you are not going to get a very good answer. Would you say the model is still accurate?
bdgwx, please stop trolling.
That’s OK. I didn’t think he was trolling. But I have been thinking about his comment a bit.
I’m not sure the analogy you use provides a proper comparison. I say that because we know that the model of gravity of gravity is functional. We know because we can test it and validate the model over and over again. Yes, Einstein’s theory proved to be better. But Newton’s is still a functional model that can be used to make predictions about how objects will behave with great precision.
Unless you are suggesting that all 102 climate models use the same formulas but use different data inputs (which I don’t think you are), isn’t the mere fact that there are 102 divergent climate models being used in the IPCC3 report is a tacit admission that we cannot agree on the degree of influence various factors have on temperature? So there is not consistent model.
But putting that aside, let’s use your analogy. Would we say that the Newtonian model of gravity is not a good model if we did not know the mass of the earth and could not use it to calculate escape velocity? No, it’s still a good model. But if we didn’t know the mass of the earth, and we couldn’t calculate escape velocity, would we have put Alan Shepard in a rocket and tried to send him into space? I sure hope not.
So if we don’t know future atmospheric CO2, volcanic eruptions, and whatever “other climate drivers” should be put into the models, why are we using it to set policy?
“That’s OK. I didn’t think he was trolling.”
You’ll learn. None of these people are genuine.
The point is well taken Kolg8. If we cannot satisfactorily predict the required inputs in models then their utility is going to be compromised…no question.
But…we can at least model hypothetical scenarios and make if-then decision trees that might help assist with setting policy. And don’t get me wrong…we still need to improve the model physics too…no question there either.
Regarding the model suites…no they don’t all use the same initialization, time evolving inputs, parameterization schems, numerical cores, model types, etc. There is no one model that best matches reality right now like there is with gravity.
My main point was really that a large part of the model/discrepancy is our inability to also model human behavior, volcanic activity, grand solar cycles, and other required inputs for climate modeling. I fear both will be out of reach for decades and may just be intractable entirely.
#2
More than 100 papers for the usual suspects to ignore, denigrate, or misrepresent:
https://notrickszone.com/2019/12/12/the-list-grows-now-100-scientific-papers-assert-co2-has-a-minuscule-effect-on-the-climate/
Hi Geoff
Your original reply was very helpful, thanks. Definitely worth reading twice!
It begs a question, though. How come the near surface has been observed to warm faster than the lower troposphere product? The altitude where the LT measurements come from would need to be significantly higher – otherwise the result would a steeper lapse rate rather than reduced.
*******
[By saying that warming (due to increases in GHG’s = increased opacity) increases the lapse rate you are not considering the measured vertical profiles and zonal changes we can easily measure.]
The lapse rate increased in the example I gave, so I wondered why the same idea wouldnt apply to the atmosphere. A question, not an assertion. Again, thanks for the explanation.
“How come the near surface has been observed to warm faster than the lower troposphere product?”
Answer:
Night time minima over land.
Taking place beneath a shallow surface inversion.
This can never be captured by a tropospheric product.
The greatest warming with AGW is taking place there.
Look at any region and you will see that average minima are warming faster than day maxima…… because even tho staring out warmer on average at dawn, the extra heat is dispersed aloft due convection.
Anthony,
[This can never be captured by a tropospheric product.]
I cant tell, do you agree the surface is warming faster than higher up in the lower troposphere?
Or, do you think the LT has actually been warming faster than reported?
Define warming faster.
Surface? Near surface? Higher up? Day? Night? Antarctica? Sahara? Summer? Winter?
The driver is still geomag shifts at thje core mantle bounmdary, from molten metal crrent flow shifts, tidally induced. The modelling is geophysics gibberish, and junk, ditto the minor variations.
Matched mag and NOAA ssta maps showing the pattern mimincing wont post here, as this takeas no attachments Barycentre goes top to bottom of the mantle each lunar month. We all missed the gravity field of the sun, about half that of the moon, at this distance, And all sides are still stone deaf. 4k page report, 30 years work, always free on usb, but it offends the new religion, both sides.
Care to be different, Spencer? Or anyone?
Peter Ravenscroft, geologist doing a lot of magnetometry/social anthropologistobserving new religions – 45 years. Ravenswood Wildlife Sanctuary. Send your donations anywhere but here. Maybe to St Greta?
[email protected] Phone Australia 617 3289 4470.
Minus some typos. Apologies, all. Delete previous, ta.
The driver is still geomag shifts at the core mantle boundary, from molten metal current flow shifts, tidally induced. The modelling is geophysics gibberish, and junk, ditto the minor variations.
Matched CMB radial mag and NOAA ssta maps clearly showing the pattern mimicking wont post here, as this takes no attachments. Barycentre goes top to bottom of the mantle each lunar month. We all missed the gravity field of the sun, about half that of the moon at this distance, And all sides are still stone deaf. 4k page report, 30 years work, always free on usb, but it offends the new religion, both sides.
Care to be different, Spencer? Or anyone?
Peter Ravenscroft, geologist doing a lot of magnetometry/social anthropologist observing new religions – 45 years. Ravenswood Wildlife Sanctuary. Send your donations anywhere but here. Maybe to St Greta?
[email protected] Phone Australia 617 3289 4470.
[Define warming faster]:
If the rate of temperature increase attributed to a particular person, place or thing is greater than that of another, the former can be said to be WARMING FASTER.
Hope that helps.
As for the place and time of the trends in question, I was referring to daily averages for the whole year.
a) global, near-surface
b) the UAH global LT product.
Not really. Vague generalisations don’t help. Rate based on percentages, absolute, energy content or density?
Daily averages are completely pointless. Causes for increased maxima may be completely different to those for minima, both resulting in changes to the average! A year is nothing. Even climate is weather averaged over 30 years.
Think about it.
I was trying to clarify: daily averages for the whole year, as opposed to a particular month or season.
A 40 year trend – the length of the satellite record – should go without saying if you were familiar with the subject.
Regardless, its clear you would not be interested in trying to answer the question, no matter how exacting it was stated, or how carefully it was explained to you.
Is the word troll too vague?
You’re still trying to be evasive. Won’t work. Daily averages are meaningless. Around the globe, over periods of up to millions of years, some places have become colder, some hotter.
Vague terms referring to “higher up in the lower troposphere” are pretty meaningless, wouldn’t you agree? Trying to dismiss anyone who disagrees, as a troll, just shows you depend on bullying rather than fact.
Roy could I ask how the models compare with all the other temperature readings. i.e ground stations, sea measurements.
I am old enough to remember the 70’s and to be honest it doesn’t feel much warmer in rural Yorkshire.Even this year when we had a good summer it was not exceptionally warm.
But we are all told this is how the models predict the rise, but it doesn’t look correct when compared to the experimental data.
Manabe and Strickler started with an isothermal column which they pulled super adiabatic with radiative forcing and truncated to the observed lapse by convection.
You have yourself in previous discussions brought to the table the fact that the isothermal column is of lower entropy than the adiabatic profile as shown by Bohren and Aldbrecht 1998 and that this, adiabatic profile is the correct start profile for a non-radiative atmosphere, negating M&S input to this matter.
Whether you feel that latent heat transfer affects surface temperature is inconsistent with a discussion about the lapse rate as phase change as a chemical potential energy adds to the available energy storage states for the atmosphere. The energy is shared between gravitational potential energy, thermal states and chemical potential energy where available. The presence of chemical phase change of surface water on Earth takes energy from the thermal pool at the surface and adds to both thermal energy and gravitational potential energy aloft. The result of this is a reduction of the lapse from the steep dry lapse rate to the lower moist rate where surface specific humidity is high.
No consideration of opacity was required to derive the lapse rate from fundamental principles and none to correct the dry lapse to the observed moist lapse rate.
“Manabe and Strickler started with an isothermal column”
The initial column start conditions are not relevant; the final thermal equilibrium solution for the column though has to be equilibrated at each altitude slice for the various grey absorber combinations. With less O3 and CO2 there is no isothermal lower atm., see fig. 6c. With the natural CO2 and O3, the same altitudes are derived as observed isothermal at thermal equilibrium.
Thus Manabe and Strickler 1964 demonstrate consideration of atm. opacity was required to derive the observed lapse rate from fundamental principles of thermal equilibrium. Atm. opacity is then required to correct the temperature lapse with increasing altitude to the observed lapse rate profile contrary to your simple assertion.
Ball4, please stop trolling.
@Cynical
Sorry, I thought you were trolling.
As far as I know, Tmax/Tmin are not part of Dr. Spencers reports, which means for an apples to apples comparison, we need to use daily averages from the surface based records as well.
Snape, please stop trolling.
testing
sorry if my question is not new or answered already:
what is the “lower atmosphere” in the models (p levels, meters) compared to the sat. data?
A simple assessment that shows that CO2 has nothing to do with climate is at https://watervaporandwarming.blogspot.com
The link’s simple assessment does not write “nothing” Dan, it does write: “no significant net contribution from CO2.” How significant is of course a bit controversial.
Dan is right. There is no evidence to support the idea that CO2 drives temperature other than the apparent correlation between [CO2] and temperature from 1850 to 1998.
There is abundant evidence that [CO2] has no measurable effect on temperature.
Now gc adds “no measurable” to “no significant” and “nothing”.
There is also abundant evidence (from theory and observation) that CO2 grey absorber added ppm has more than “no measurable” effect on temperature or these climate debates would cease. The added ppm CO2 effect on temperature has been consistently measured in the lab and out in the wild & reported in the literature; the real inconsistent problem evidence seems to be in the words used to describe that effect.
Ball,
For you to be correct, some or all of Hitran, vapor pressure vs temperature for water, TPW measurements, tropopause temperature and TOA observations would have to be wrong. The only valid lab measurements on CO2 show it to be a ghg which is not in doubt. Climate measurements at best show only a rough (and meaningless) correlation. Take the blinders off and look again.
Dan, anyone taking the blinders off finds HITRAN shows there is evidence (from theory and observation) that CO2 grey absorber added ppm has more than “no measurable” effect on temperature as the CO2 parameters that exist in the database are from measurable atm. experimental results.
TPW data from satellite radiometers SSM/I F08 through F15, SSMIS F16 and F17, AMSR-E, WindSat, and AMSR2 measured results have only been available starting roughly 1990. Blinders off show this is too short a period to challenge for better or worse the CO2 ppm record predictions of global median temperature vs. the predictions made in 1938 & measured thru 2013.
Tropopause height observations available since roughly 1979 show there is also abundant evidence (from theory and observation) consistent with CO2 grey absorber added ppm having more than “no measurable” effect on temperature.
TOA observations of OLR and incident/reflected SW also from roughly 1979 are also too short to draw conclusions for or against added ppm CO2 grey absorber having no measurable effect since 1938; the observations in the period do support ENSO and arctic sea ice coverage as having a measurable effect.
If you want more detail as to atm. H2O, CO2, O2 effects on analytical and observed atm. temperture profiles I would suggest starting with Manabe and Strickler 1964 read without blinders & including Robinson/Catling Dec. 2013 again no blinders.
Should be O3 (ozone) effects not O2 (molecular oxygen).
Ball,
Apparently you are too stubborn to look. If you had, you should have noticed that the demonstration that CO2 has nothing [perhaps I should have said nothing significant to avoid the nitpickers] to do with average global temperature did not use anything about TPW, Tropopause, the 30 year time period or anything that anyone else did.
Previous work by ‘climate scientists’ led to the poor performance disclosed by Dr Roy above.
Dan, yes, your “nothing significant” statement is more correct per lab and in the wild observational added CO2 ppm effect on global air temperature than your earlier “nothing to do with”. I could not have quoted directly from the demonstration if I hadn’t looked at it. The meaning of your word “significant” then is a debatable issue.
If by “poor performance disclosed by Dr Roy above” you mean the CMIP model ensembles, I will note the GCMs are not the subject of the demonstration nor lab/in situ observations I mention.
You claim you don’t use the word “heat” because it is “confusing”. Please explain how you think air temperatures rise without involving “heat”? Try understanding the effects of “heat”. M&S use the term frequently. Their paper obviously confuses you. Have you tried studying physics? You will find “heat” is involved. Too “confusing”?
Manabe and Strickler can’t even decide whether cirrus clouds result in surface warming or cooling. It’s hardly rocket science, is it? The end result is that attempts to explain differences between modelled behaviour and observation fail. As usual.
Cynical should then read M&S 1964 4c.: “Influence of Cloudiness” where M&S decide whether high cirrus clouds result in surface warming or cooling & why.
“Therefore it is rather difficult to determine whether actual cirrus has a heating or cooling effect on the surface climate.” Actual cirrus clouds. Not the model sort, which is supposedly heated from the ground, and makes the ground hotter in response! Real cirrus is around -40 C. Not much warming ability there.
Still impressed with M&S? Maybe you didn’t get as far as p.379. Read harder.
That quote is on page 380.
After actually quoting M&S words now it is “rather difficult to determine”; Cynical is forced to change away from M&S “can’t decide”. Of course, it’s difficult but M&S do decide.
Again, Cynical should read harder M&S 1964 4c.: “Influence of Cloudiness” where M&S find it “rather difficult to determine” but do decide whether high cirrus clouds result in surface warming or cooling & why. Consistent with Dr. Spencer’s night time atm. test involving ambient surface water and high cirrus clouds moving into view of the water.
Yes. I didn’t think you got as far as p. 380, obviously. That’s why I suggested you read harder. You should also note that M&S distinguish between real cirrus and the modelled stuff! The real cirrus doesn’t warm anything above about -40 C. As I said, hardly rocket science.
The real nighttime icy high cirrus clouds increased the thermometer measured temperature of Dr. Spencer’s ambient surface water over control water not in view of their LW IR. This experimental evidence is consistent with what M&S decided, reported by calculation in 1964, & what Dr. Spencer also reported by calculation in 2015. Perhaps it is Cynical that hasn’t read hard enough.
No, you are confused. The thermometer did not rise, if this occurred at night. Cirrus with a temperature of -40 C is not capable of making anything hotter than -40 C. M&S failed to figure out why the models did not reflect observation. As usual.
Cynical, pay closer attention to my verbiage; it is you that is confused.
Dr. Spencer’s summer 2015 nighttime data logger showed the thermometer temperature of the water in view of the added cirrus incident LW IR increased over the thermometer temperature of the control water NOT in view of the cirrus.
M&S did figure out why at thermal equilibrium their models did reflect standard observation, as you can learn from reading sec. 4c: “Influence of Cloudiness” a little harder.
Vague waffling and diversion isn’t helping you. Read M&S conclusions about reality versus computations. Cirrus at -40 C heats nothing hotter than itself. If reality differs from modelling, the modelling is wrong. Figuring out why, as Dr Spencer points out, is not possible so far.
Correct, commonly cirrus at -40 C heats nothing hotter than itself. But I was careful not to use the confusing word heat. Consider, for example, surface energy balances when the LW IR from cirrus replace the LW IR down welling from cooler clear night sky.
Perhaps you should search the site and read/learn from Dr. Spencer’s atm. experiment summer 2015.
Evasion and diversion are not your friends, are they? If you find the word “heat” too confusing, don’t read the M&S paper. It contains the word “heat” in dozens of places.
“Cirrus with a temperature of -40 C is not capable of making anything hotter than -40 C.”
Looking up and seeing -40C rather than -270 C, I feel warmer.
Stupidity. There are no “cold rays”. Cirrus at -40 C won’t make you feel any warmer than -40 C.
Enough incident nighttime cirrus at -40C will make you feel warmer than clear sky instead at night. Demonstrated by Dr. Spencer’s summer 2015 experiment.
And yes, the term heat is too confusing. Useless riots are incited around here regularly with the heat term’s abuse.
For example, consider the physics of insulated, sealed container adiabatic combustion of hydrogen in oxygen. Two possible descriptions are: 1) the temperature is higher following combustion; 2) heat is generated.
1) is a statement about a physical measurement than can be made directly with a thermometer.
2) is abstract unphysical word jazz, invoking a hypothetical quantity that can at best be inferred indirectly only from temperature measurements and can mean whatever the author feels like defining heat to mean.
Going with 2) means a blog confused comment string can be well into the 1000s, I’ll prefer go with 1) since from the 1LOT the total energy of the container contents is constant, rearrangements of molecules in combustion result in a decrease of PE compensated for by increase of KE & manifested macro by a temperature increase.
Just go ahead and read M&S 1964 substituting “energy” whenever “heat” is written to better understand their same unit meaning & discover if/when they abuse the heat term.
For an example of that (mild) abuse see p. 362: “convective adjustment will transfer heat energy” translates to “convective adjustment will transfer energy energy”. See the issue? There are worse, now you know.
“Cirrus at -40 C won’t make you feel any warmer than -40 C.”
Well they certainly make my IR thermometer feel warmer. And I think its fairly objective.
Similarly you can do the experiment with any thermometer, as I have.
You can try this experiment yourself with a digital meat thermometer.
1. Put black electrical tape on sensor part of thermometer to make it a ‘black body’.
2. Put sensor part in zip-lock bag to reduce influence of air temp.
3. On a clear night expose sensor to sky. Let equilibrate.
4. Same on a cloudy night.
You should notice on a clear night the thermometer will read well ~ 10 F below ambient temp. While on a cloudy night it will read higher, closer to ambient temp.
What’s happening?
The thermometer cools below ambient temperature if exposed to a very cold clear sky with low back radiation.
But doesnt if exposed to cool clouds which are still much warmer than the clear sky.
Ball4, please stop trolling.
Faint young son paradox is solved by increased atmospheric thickness. Good ol pv=nrt
Atmospheric thickness is a proxy for the mean temperature of a layer. Refer to the hypsometric equation (derived in part by the IGL by the way). So this is like saying the faint young Sun paradox is solved by higher temperatures. See the problem?
But there are still more problems with invoking the IGL alone. Specifically it is a state or diagnostic equation. It is not prognostic. All it tells you is that the properties of the gas are constrained in a specific way. For example for a constant mass gas T must increase if PV increases like would be the case with mechanical compression. But the reverse is also true. PV must increase if T increases like would be the case if heat is applied to the gas. See the problem?
bdgwx, please stop trolling.
Models assume positive feedback to make CO2 dangerous. Its a classic case of the tail wagging the dog. Being a thermodynamic system the climate must conforn to the thermodynamic equilibrium law that mandates negative feedback. Energy in a system is always minimised. You can get positive feedback the internal cannibalisation of other energy sources. You see this in enso where a reduction in kinetic energy (wind) leeds to an increase in thermal energy. Enhanced GHG theory violates this law as the increase in thermal energy is supposed to causes a coresponding increase in latent heat energy. Minimization is violated. The only possible exception is albedo, as the law applies to energy within the system and sunlight first has to be absorbed
What an insightful comment.
Here is a link to a paper by Hansen et al. (2013):
https://royalsocietypublishing.org/doi/10.1098/rsta.2012.0294
Take a look at Figure 7(b). Hansen wants us to believe that CO2 drove temperature over glacial cycles over the last 850,000 years.
He realizes that the IPCC’s AR5 “Climate Sensitivity” of 3 +/- 1.5 K/doubling is inadequate so he imagines “Feedbacks” that will multiply the sensitivity by a factor of ten!
Figure 7(b) says that one halving of [CO2] will reduce the global temperature by 28 degrees Centigrade.
Hansen is claiming that reducing the [CO2] from 78 ppm to 39 ppm will cool our planet by 28 degrees.
The Royal Society is the world’s oldest scientific institution (founded 1660). The integrity of that revered institution needs to be questioned when they publish such nonsense.
OK GC, you show us a paper. You dont like the result.
You can’t criticize the science in it, you cannot tell us what these guys have done wrong, but you still don’t like it.
What is that opinion worth?
The CMIP model assumes there is a causal relationship between the concentration of CO2 in the atmosphere and the average global temperature.
That assumption is false so the CMIP models are useless for predicting anything. They can’t “Predict” the past and that should be enough for them to be abandoned.
Most “Climate Scientists” take their work seriously and report their findings as scientists should. They are like the case officers in the FBI who work diligently and honestly. Like the FBI case officers they are subservient to management by politicians.
The mis-management starts at national level (e.g. the EPA) but the head of the snake is at the IPCC in Geneva. When a political agenda dominates, facts and reason don’t matter.
There is a casual relationship between CO2 (and other GHGs) and global mean temperatures. Just because you say there isn’t doesn’t make it true especially in light of the mountain of evidence that is contradictory to your position.
Also, define “useless” in the context of model skill objectively so that we can form a mutual agreement upon which we can adjudicate which models are better. This will help later down the road when we compare the CMIP5, CMIP6, etc. model suites with whatever model you feel is best. You are prepared to present a model for review right?
You wilfully ignore real science while continually evoking in the name of science. That is leftist propaganda.
“The CMIP model assumes there is a causal relationship between the concentration of CO2 in the atmosphere and the average global temperature.”
False. Where do you get that one?
The models are simply applying physics to model the atmosphere, oceans, and land.
It is precisely the same physics that goes into weather models. And we know, empirically, they work.
The models are based on magic, not physics. That’s why they don’t work. Look at what Dr Spencer wrote.
Models are based on physics. The question is are model/observation discrepancies based on bad model physics or bad model inputs. The literature suggests the later is at least as significant as the former and probably even the dominant explanation. For example, Hansen’s famouse 1988 model produced a result that was essentially indistinguishable from observations when it was given the correct inputs. Dr. Spencer doesn’t talk about that though and thus his audience is led to believe the problem is entirely with the model physics. Don’t hear what I didn’t say. I’m not saying the model physics is perfect. It isn’t and never will be.
The models don’t work. Useless. Either the modellers don’t know what they are doing, or they don’t know what they are doing! I prefer to believe they believe in magic. Or do you really claim they don’t have a clue? Do you have proof?
Cynical (aka Eh Mike), your style seems eerily familiar,
You need to cover your tracks better.
http://www.drroyspencer.com/2019/12/uah-global-temperature-update-for-november-2019-0-55-deg-c/#comment-412363 .
You haven’t got any smarter, have you? The models are just as useless as ever.
Then magic is giving you your weather forecast, so you can dismiss it too.
Nonsense. Compare your magic to persistence forecasts. Show your magic is superior. Provide records in support. You need to improve your diversion skills.
Hey if the weather report says 4′ of snow tomorrow, I’m making sure the snow blower is ready today. Even if they use magic, then it must be good mumbo jumbo.
So you can’t show your magic works better than a simple persistence forecast? Thought so.
It’s not my magic Cynical. I take action on the weather report for tomorrow; going to rain, I’m not getting a car wash today.
For weather forecasts the objective skill scores are available at many sites. Here is but one.
https://www.emc.ncep.noaa.gov/gmb/STATS_vsdb/
Another example is that the NHC keeps track of Atlantic basin hurricane forecasting skill. Persistence and climatology forecasting is quite terrible here as well compared to dynamical and statistical modeling forecasting techniques. The following is the 2018 verification.
https://www.nhc.noaa.gov/verification/pdfs/Verification_2018.pdf
Maybe you should read the part where overlapping circles on the forecast track are based on previous averages. It’s called persistence forecasting. Not a lot of skill there, and both your links admit it.
Sounds like everyone is on the same page then. Namely that the “magic” of physics-based dynamical and statistical forecasting is superior to persistence and climatological forecasting. In other words, applying the laws of physics yields better forecasts than applying persistence or climatology. And yes both of my links make that abundantly clear.
And no. The overlapping circles on hurricane track forecasts are formed such that the probability that 2/3 of actual tracks will fall within the circle. The size of the circle is based on the error of official forecasts from previous years. It has nothing to do with persistence forecasting because the official forecasts from previous years do not use persistence forecasting since physics based or “magic” techniques are demonstrably better.
Ok Cynical. A persistence forecast would be related to the autocorrelation of the historical data i.e How well does tomorrow’s data and the day after that …etc. correlate with todays value.
Do you have such numbers to back up your assertions? Call me extremely cynical but I suspect you don’t.
Why don’t you want to accept the definition of persistence from the WMO? As to assertions, I just asked someone to show that their models based on magic provided better results than persistence forecasts. And yes, I do have numbers.
Ok Cynical. Show me your data. I am a bit of a data nerd so I would love to see your numbers.
Too lazy to do your own calculations? It’s pretty simple. Look it up on Google if you don’t know how. I’ll check your results if you want.
At 11:00 pm, you said you had the numbers to back up an assertion.
I called your bluff at 11:26 pm and got the predicted result at 11:57pm.
See forecasting can be quick and easy and I didn’t have to persist.
You are a silly billy, aren’t you? I asked a question, you demand I provide an answer! You’re terrified, because you have found out I’m right. Keep believing in models that don’t work.
It’s been stinking hot down here but you must be suffering in your jocks up your way with the added burden of humidity. By the way, earlier this month, Darwin had its hottest December day on record. They are also predicting even hotter temperatures in the run up to Xmas but it’s just a prediction.
Mike, stay cool and hydrated.
Don’t be silly. Look at the BOM records. You can count higher than 37?
You may call me what you like, if it makes you happy. Cynical, Mike, Master, it’s all the same to me. Still won’t make the models any better.
“Nonsense. Compare your magic to persistence forecasts.”
Ha! Mike is stuck in the 1950s.
Ignore those cyclone tracks…just relax on your porch.
Yes Nate ,
MikeF is definitely stuck in the Fifties.
MikeR is hoping to arrive in the Roaring 2020’s if he can survive the effn heat for another week or two.
Science proves the obvious (to anyone except Mike).
Trends in the skill of weather prediction at lead times of 1–14 days
Harvey Stern Noel E. Davidson
First published: 30 March 2015 https://doi.org/10.1002/qj.2559
Quarterly Journal of the Royal Meteorological Society
Abstract
Unique, multi‐year datasets of weather observations and official and experimental predictions are used to document trends in weather forecast accuracy and the current level of forecast skill specifically for Melbourne, Australia. The data are applied to quantify prediction skill out to Day‐14 for maximum and minimum temperature, and for precipitation amount and probability. An innovative statistical analysis is applied to the data. This analysis clearly demonstrates the need for long time series of forecasts in order to reliably assess long‐term trends. The accuracy of the current official Day 5–7 forecasts is found to be similar to that of Day‐1 forecasts from 50 years ago.
last sentence should read:
The accuracy of the current official Day 5-7 forecasts is found to be similar to that of Day 1 forecasts from 50 years ago.
You miss the point. How do the finest professional forecasts compare with persistence forecasts? Too difficult? I thought so.
How do the finest professional forecasts compare with persistence forecasts?
I posted this information above.
For example, the 2018 hurricane track errors at 120 hours was 663nm for persistence+climatology but only 186nm for the official forecast which is almost entirely based on dynamical models.
In other words, no comparison between models and persistence. Persistence is not “persistence + climatology”, and an official forecast which is “almost entirely” based on something, includes non-modelled output. You may have noticed that hurricane track forecasts are subject to frequent revision based on reality. So, if the track is revised/updated every 6 hours, that is the maximum level of confidence that is assigned to the model.
And of course, if the track is revised, the model output to that point is acknowledged to be worthless.
OCD5 is the standard baseline. It is based on both persistence and climatological principals. This a nod in your favor since this configuration results in better skill than than just persistence alone.
Your point about forecast revisions makes no sense. Later revisions have no impact on the verification of the current revision. Each forecast is scored independently.
BTW…as a fun exercise see if you can reason through why adding climatological information to persistence would result in higher skill for hurricane track and intensity forecasts.
How do “climatological principles” apply to 6 hour forecasts? What is your understanding of “climatological principles”? If you believe it to be the belief that the future will follow past trends, then that is actually just persistence forecasting. No skill needed.
I attempted to replicate a paper by Hansen (cited above) using the Robinson & Catling model.
Hansen claimed that 12 doublings of CO2 would raise the surface temperature to 69 Centigrade. My replication says 65 Centigrade.
This is a short demonstration of what it takes and how much effort goes in to produce a totally wrong climate prediction
https://youtu.be/WdRiYPJLt4o
Wow!
Thanks for that. What a slick presentation. They almost had me believing the BS.
As I have said before…….when politicians rule facts and reason don’t matter.
The suggestion that LWIR from CO2 has any negligible impact to ocean temp is the most unsupported assertion in climate science.
A cursory understanding of ocean skin layer shows that it is impossible to impact temps at even the first cm of depth from a trivial change in CO2 concentration above the surface.
Increased LWIR measurements at ocean surface is characterized as literally beyond our technology to measure
Such small changes in the average atmospheric infrared (IR) emission incident at the sea surface occurring over decades are not feasible to measure with currently available instruments.
Any suggestion that man is causing the oceans to warm doesnt even rise to the quality of conjecture.
The ocean cools primarily through wind driven evaporation. Wind speed has a discernible impact on the effectiveness of this cooling process. A 1MPH increase in average wind speed over the course of a year has a greater cooling effect than the supposed warming from the entire CO2 forcing over the Industrial Age.
CO2 ocean warming is witchcraft and thus 90% of AGW claims are falsified.
https://agupubs.onlinelibrary.wiley.com/doi/full/10.1002/2017JC013351
Ft,
LWIR doesnt penetrate land either so wrt LWIR ocean and land should be treated the same.
As you allude and as shown at https://watervaporandwarming.blogspot.co CO2 increase has not caused the planet to warm.
Again, Dan’s link’s simple assessment does not write “CO2 has not caused the planet to warm”; it does write: “no significant net contribution from CO2.” How significant added CO2 ppm on global temperature is, of course, remains a bit controversial.
Waffling is no substitute for clarity. What do you understand “a bit controversial” to mean? How do you think a scientific controversy should be settled?
this is how you debunk the nonsense predictions, skip to 5:00
https://youtu.be/8JffiHyjmLA
You had me goin, Mike.
Snape, please stop trolling.
A wave of extremely cold air from Canada is moving towards the Great Lakes.
Ren,
Last time I inadvertently came across one of your posts, you were perched on top of a mountain at Falls Creek in Australia talking about the snow fall. I think it was about 2 weeks ago. I assume you got back alive.
You should have hung around a bit rather than fleeing back to the freezing conditions where ever you are . Today’s temperature at Falls Creek has broken the record for the warmest day for December (25.5 C at this very moment, the old record was 25.1 C, 27C is predicted for tomorrow).
MikeR
You waste your time.
Regardless where he writes (here, at WUWT, Climate Etc, or anywhere else), Ireneusz Palmowski ONLY reports about cooling.
Yes Binnie,
Maybe I should change my pseudonym to Stimpy and provide the opposite perspective. Ren’s Ying is out of control and he needs a bit of Yang for balance.
Perhaps Bindidon could change his pseudonym back to his feminine alter-ego, La Pangolina. What do you think, Michael Reich?
DREMT,
It’s Wilhelm here. In desperation I have managed to hack my young brothers Email account. I have been languishing and held involuntarily in a mental institution since 1957. Don’t believe the rubbish about my death. Just rumours spread by the FBI and my detractors.
I have a request for you. You have made it clear that you have connections to a Geraint Hughes. He sounds ideal . I need someone with great technical expertise to test my climatogical device which I have constructed. This device can be used to change the climate by controlling cloud cover.
https://en.m.wikipedia.org/wiki/Cloudbuster .
No more worries about carbon dioxide and such nonsense.
I also need the services of a brilliant theorist like your Joseph Postma to confirm my theories some of which are almost identical to his.
https://www.thoughtco.com/wilhelm-reich-and-orgone-accumulator-1992351
You yourself could also calculate theoretical orgone energy fluxes for my orgone box (also known as the accumulator) . Orgone is extracted from the atmosphere and enters a centre plate. This energy can be extracted via an anatomical connection. There are separate connections for males and females.
Here is some more information about my device.
https://dangerousminds.net/comments/my_life_in_orgone_boxes_william_burroughs_on_his_sexual_science_experiments
I guarantee Mr Hughes will achieve great satisfaction building this device and there is enough room for 3 people so it could accommodate both yourself and Mr Postma simultaneously.
Please also send details about the web sites climatesophistry and Principia. All my attempts to publish work have been rejected so far by ignorant skeptics. From examining the material on these sites they seem ideal venues to publish my theories. Where do i send my manuscripts?
Waiting expectantly,
WilhelmR
Oh.
Current temperature anomalies in the US.
https://www.tropicaltidbits.com/analysis/models/gfs/2019121812/gfs_T2ma_us_1.png
#3
More than 100 papers for the usual suspects to ignore, denigrate, or misrepresent:
https://notrickszone.com/2019/12/12/the-list-grows-now-100-scientific-papers-assert-co2-has-a-minuscule-effect-on-the-climate/
…
Or for deniers to not read or comprehend but believe.
And 10s of thousands of others for deniers to not read or comprehend but dismiss.
And debate the meaning of “minuscule” (or insert any similar adjective) uselessly & endlessly. Many 10s of 1000s of blog hits depend on it. Cue the advertisers.
More diversion. Do you deny that the climate has always changed? It’s the average of weather. Weather is endlessly changing.
The question is not whether the climate changes, it is why it changes.
In the past, climate changed due to natural variations in sunlight, geology and Earth’s orbit.
Since 1880 the natural variations should have produced slow cooling, yet we are warming fast.
This is not a natural change as we have seen in the past.
This is new, novel and artificial.
You obviously consider the presence of humans unnatural. Typical reaction from a Gaia worshipper. Remove all CO2 from the environment. Exterminate the majority of plant and animal life. Whoopee!
DREMT
The papers argue for a low climate sensitivity for CO2 doubling. But they support the GHE. The first paper claims total removal of all CO2 would cool the surface of Earth by 4 K. This would fit in well with GHE theory. The surface is warmed around 33 K by GHE. CO2 contributes about 10% of the overall effect. The number is close.
Maybe you should switch gears and consider the GHE is quite a real phenomena based upon all valid heat transfer science (I know you will never understand the simple physics of the Green plate idea, oh well).
Wrong, Norman, the “no GHE” papers are in there too.
DREMT
I fail to see how you state I am wrong. The vast majority of the papers I scrolled past indicated some warming from the doubling of CO2. Where are the anti-GHE papers among them. I have seen a few crackpot papers against it. I fail to see that in these. Most of the papers seem to believe added CO2 does increase surface temperature. So you may have a few outsiders but the vast majority accept some warming. Too bad for you. Maybe you should not present such links in your posts.
Did I actually say anywhere, “more than 100 papers that dispute the GHE”?
Maybe in your imagination, Norman.
There are papers there that do dispute it. Look a little harder.
Too bad for you. I will present whatever links I choose.
This year, sea ice in the Eastern Arctic grows faster.
Huffy, please stop trolling.
OK, Snape.
In case anyone here is interested, I’ve just released my climate change technical analysis. I would very much appreciate your constructive criticism if you have time to read it.
https://drive.google.com/file/d/1ITZRICj-nACgTQ8Gfzi1l-EovYnhRMNh/view
If you would prefer to respond on facebook:
https://www.facebook.com/100000276969216/posts/2853228168029721?sfns=mo
Scott R
The charts by Tony Heller are based on unadjusted data. The adjusted versions look very different. The question, then, is were those adjustments are valid, or were they contrived to show a warming trend?
Here is a short overview I found:
https://climatecenter.fsu.edu/does-noaa-adjust-historical-climate-data
It doesnt give an answer, but at least links to NOAAs explanation
Snape,
I actually prefer the unadjusted data. How arrogant are we to assume that we know the temperature that it was 100 years ago better than the recorder at the time more familiar with the equipment? Heller has posted some very interesting videos comparing the adjusted and unadjusted data and not coincidently, the adjustments align very well to the underlying warming trend, which is very suspicious. I’m not sure if it was intentional or not, but that is the result.
Siting, systematic instrument or measurement bias, time of day when observation was taken, station moves, urban heat island, etc. are examples of adjustments that most scientists agree are necessary. For the conventional surface station datasets the net effect of these adjustments is to reduce the warming trend over the length of the dataset so the adjustments are typically welcomed by skeptics.
Heller has a history of misrepresenting scientific literature and data and misinforming his audience on the topics of climate change. It’s in your best interest to follow up on Heller’s claims since so many of them have turn out to be deceptive. If getting your information from a youtuber is your schtick then you might considered the perspective of potholer54 who, unlike Heller, cites all of his sources and provides explanations backed by evidence instead of invoking claims of fraud and conspiracy.
bdgwx,
The adjustments are never welcomed by skeptics. At least not this skeptic. The adjustments always add a degree of subjectivity to the dataset biased towards the adjusters opinion, and come with the assumption that the scientist taking the measurement at the time was incompetent, and the method flawed.
If you read my paper, Heller’s datasets are obviously not the only place I’m looking at for data. You my visit my facebook and see that I run my own data. I’m not a link poster. Most of the charts I made based on datasets that I downloaded myself.
Heller posts actual historical articles proving the mid century cool down has been erased by main stream climatologists. Why does every data set start in 1980 the end of the mid century cooling? hmm Taking local NOAA data sets as proxy, clearly the mid century cooling was an actual thing that happened while CO2 went to record highs for that time. 1980 was not record warm as shown on the NASA temperature data set. Quite the opposite. He is exposing the fraud and conspiracy of the AGW alarmists.
Roy – where does the data for the 12 model temperatures come from? And specifically from what year? Presumably CO2 and volcanic forcing prior to that date for the models is well known. What CO2 emission scenario (RCP) do the models assume after that date- critically important of course.
typo – 102 models
All I have to say is if you are talking about 1 to 2 degree Celsius warming, and CMIP5 models generated in 2010 are off up to 0.6 degrees or more on historical data from 1980 to the time of CMIP5’s inception, then those models should never have been published. BECAUSE they are obviously completely wrong. Whoever was paid to generate those models should be fired for publishing them and thinking they did a good job. They weren’t even close on temperatures of the past that were already known. They should be embarrassed and not be surprised that they set themselves up for more embarrassment.
@Norman,
“Most of the papers seem to believe added CO2 does increase surface temperature.”
Yes! Hansen et al (2013) says that 12 doublings of CO2 raises the average global temperature to 69 degrees Centigrade…….a “Delta T” of 54 degrees.
My analysis says 65 degrees Centigrade or ~4 degrees lower.
Hansen and I differ most on the issue of “Halvings”.
According to Hansen and his modeler (Gary Russell) halvings of CO2 concentrations are more potent than doublings. My model does not agree. Here is a table comparing the global average temperature:
Halvings….Hansen…….Camel
Zero……….288……..288 K
First………282……..288 K
Second……..273……..288 K
Third………245……..288 K
So what do y’all think?
Do you believe that reducing [CO2] from 78 ppm to 39 ppm will cause 28 K of global cooling? That is what a paper published in the journal of the Royal Society (founded in 1660) says.
Removing all CO2 from the air, or replacing air with 100% CO2 seems to make absolutely no difference at all to the temperature. As to doublings or halvings, submarine CO2 levels vary by 5 or 6. 300 – 11000 ppm or so. No need for GHE temperature compensation to my knowledge. Maybe the GHE only works in sunlight or hot weather? Joking, of course.
You are right to be “Cynical”.
By the way, I noticed that “research” shows that increased CO2 levels makes you stupid or something. Does the US Navy go out of its way to make its nuclear submarine crews stupid on purpose? Seems a bit dangerous. What, me Cynical?
gallopingcamel
I do not know how you or Hansen got their answers.
If you use the average DWIR as 340 W/m^2 and the UWIR as 390 W/m^2 and you remove all the CO2 from the atmosphere but leave the rest this is what I get. The CO2 contribution is stated at being 20% of the GHE. I will go with that for this post.
20% of 340 is 68 W/m^2. So if all the CO2 is removed you have 68 W/m^2 less than before (if nothing else changes which it could, albedo could change, clouds could change, water vapor amounts could change…too complex to simply calculate only a complex model would get answers with all those variables).
So if you remove 68 W/m^2 from the balance the surface emission would have to reduce by the same amount to maintain balance (again all the other mechanisms are the same for a simple calculation, evaporation and convection energy removal is the same, solar input is the same).
390-68=322 W/m^2.
The surface that emits at this rate would be around 274.5 k from the previous 288 K so removing all the CO2 with no other changes would lower the surface temperature by 13.5 K. So I do not know how either of you arrived at your end temps. I do not know how you show no change and I do not know how Hansen shows a large change for just one reduction of CO2.
As mentioned earlier Gary Russell is Hansen’s modeler. He takes the IPCC estimate (3 K/doubling) and then enhances it by assuming positive feedbacks that increase the “Sensitivity” by factors as much as 9:1.
[By the way, I noticed that research shows that increased CO2 levels makes you stupid or something.]
Oh dear. How long have you been living in that cave, Mike?
Start with “Fossil fuel combustion is driving indoor CO2 toward levels harmful to human cognition”. Then look up the test for yourself. Thanks for calling me Mike. Is that the name of your personal deity?
I am not doubting the study, just wondering if your cave has been getting enough fresh air. If not, you might end up like Mike Flynn. Heard of him?
Heard of “Snape, please stop trolling”?
Persistence forecasts work well only in places that have persistent weather patterns, like tropical regions that get afternoon rains every day.
Perhaps Mike lives in one of these places, and can’t imagine why anywhere else matters.
Everywhere else, like my home in New England, with changing weather hour to hour, day to day, week to week, numerical modeling is the only option.
We care about snow-ice-rain amounts right now, and predictions for amounts and types are made town to town. Predictions are often quite good on that score.
No persistence model can possibly do any of that.
To claim otherwise is to be a anti-science, which clearly Mike must be.
Wrong place, meant for up thread, oh well…
Curious then, that not one of the GHE true believers here uses model outputs. Without exception, all project a trend, based on adjusted records ,into the future. It’s called persistence forecasting. Given that model outputs don’t reflect reality, who is more incompetent, the model programmers, or the models’ users?
Nice dodge and change of subject from your erroneous arguments.
Nate,
Where Im at, persistence forecasts have been working very well, at least lately. Blas weather for the past two months when this is usually our stormy season.
Right now we are getting clipped by an atmospheric river, maybe an inch or two of rain then back to boring.
@bdgwx
[For the conventional surface station datasets the net effect of these adjustments is to reduce the warming trend over the length of the dataset so the adjustments are typically welcomed by skeptics.]
Not according to the article I linked to upthread:
https://climatecenter.fsu.edu/images/news/20140701-noaa-data-big.png
This is not a graph of the global mean temperature or even CONUS mean temperature. For NOAA’s global mean temperature bias corrected vs raw graph refer to Karl 2015 figure 2B. Other conventional surface station datasets like GISTEMP the skeptical leaning BEST group have similar results. BEST agreed in large part to the adjustments that had been made in other datasets.
Also, the article seems to take issue with using ClimDiv instead of USHCN. I downloaded the data. The warming trends for ClimDiv and USHCN are 0.136C/decade and 0.129C/decade respectively. And from 1979 they are 0.547C/decade and 0.543C/decade respectively. So yes, ClimDiv shows slightly higher warming trends than USHCN though the differences are not statistically significant. There is also the USCRN dataset as well which has been well received by skeptics in the past. Although there isn’t enough data to make definitive conclusions yet it does suggest that ClimDiv even with it’s slightly higher warming rate may still be underestimating the warming trend.
That should F and not C.
The blue represents the early CONUS data that was adjusted downwards The only upward adjustments are for the most recent time period.
So raw figures aren’t suitable for creating a naive persistence forecast? If raw figures are unreliable, any forecast based on them would be unreliable too, wouldn’t it?
You make some interesting points. Nice job. A few comments though:
1. Although its true that the snowfall in Greenland exceeds the melt rate, that does not take into account the breaking off of icebergs into the sea (which then melt). Including this effect sends the total ice trend negative.
2. Colder temps at night is supposedly a signature of the greenhouse effect. Thermal heat tries to escape at night and is trapped by the CO2 heat blanket.
3. You used the Coddington TSI curve, but this is now outdated. The new TSI curve looks different…not so much temp increase since 1700s.
Icebergs don’t break off unless enough precipitation falls to make a glacier flow, like a frozen river. Mind you, ice can build up more than 4km thick without flowing, Heat trapping by CO2 causes lower night time temperatures? That’s a new one. A Greenhouse Cooling Effect, or did you misspeak?
That response was for Scott Rs presentation. A few corrections to my response….I meant warmer temps at night not colder. Also, I did not mean to call TSI temperature.
No problem. I guessed as much. All good fun.
News anchor: So, Mike, what can our viewers expect for weather this weekend?
MIke Flynn, Chief persistence forecaster: More of the same!
News anchor: More snow? When do you think it will let up?
MF: I predict it will keep keep on snowing.
News anchor: Forever?
MF: Im afraid so.
No, that would be climatologists predicting never ending drought in California, or Tim Flannery predicting a waterless Sydney. And so on. So, who is to blame for useless models? The incompetent designers or the incompetent users?
https://climateofsophistry.com/2013/05/27/the-fraud-of-the-aghe-part-12-how-to-lie-with-math/
That’s one that Svante, in particular, should enjoy.
Svante?
Oh, I expect he’s gone into some vague and evasive loop whilst displaying multiple misunderstandings.
“The only way this simple algebraic rearrangement makes sense is if you were giving a problem to a student, in which you knew the temperature of the cold object and you also knew the current rate of heat transfer between the hot object and cold object, and were thus asked to determine the temperature of the hot object. ”
“To say that you want to hold Q constant in Equation 2, actually makes Q an independent source of input energy and heat”
Hmmm, sounds just like the setup of the original 3 plate problem. There IS an independent source of input energy and heat, 400 W to the Blue plate.
We know the Green plates temp are Tc = 244 K. We know the heat transfer must be 400 W/m^2 to the Green plates, 200 W/m^2 each.
So the ‘simple algebraic arrangement’ Eq 2 should work. (Except he is mistaken: AREA does not cancel out) Lets try it:
Th = (Q/A/sigma + Tc^4)^1/4
= (200/5.67e-8 +244^4)^1/4
= 290 K.
Thanks for that confirmation, DREMT.
Thanks for that confirmation Nate.
“Oh, I expect he’s gone into some vague and evasive loop whilst displaying multiple misunderstandings.”
Seems I was right.
Nothing vague about it.
Its quite straightforward.
Your source confirms our solution for the 3 plates problem, and even provides an explanation for it.
I guess you will have to find some reason to dismiss your source.
“Let us look at the equation for radiant heat flow between a hot object and a cold object. In the equation below, the scenario could be for two walls facing each other which have unit emissivities and ab.sorp.tivities, so that these factors, and the areas, can all be cancelled out of the equation. The equation is thus:
Q = σ[ (Thot)4 (Tcold)4 ] Eq.{1}
and it couldn’t be any more simple. It simply says that “Q”, which is the rate of heat transfer between a hot object and cold object, in Joules per second per square meter, is equal to a constant σ (sigma) times the difference of the fourth powers of the temperatures of the two objects. This makes sense: the greater the difference in temperature, the more heating power the hotter object will have on the cooler object because it will be that much warmer than the cooler object.
In Equation 1, Thot and Tcold are called independent parameters meaning that they’re determined independently of the equation itself, by measurement, say. On the other hand, Q, the heat transfer rate, is a dependent parameter because it obviously depends on the values on the right hand side of the equation. For example, if you increase Tcold (or decrease Thot), then you decrease Q because you made the difference between the hot temperature and cold temperature smaller. Conversely, if you increase Thot (or decrease Tcold), then you increase Q because you made the difference between the hot temperature and cold temperature larger. The equation is for telling you what the value of Q is given two temperatures, and so Q is not a fixed independent parameter but is rather dependent upon the two temperatures.
Greenhouse effect believers who apparently do not understand physics, although they can do some simple math, have stated that if you fix Q in that equation, and then increase Tcold, then Thot has to increase “in order to keep Q constant”, and “therefore cold heats up hot”. This claim is made because they have this faith belief system that cold things make hotter things hotter still, rather than um, you know, hot things making cold things hotter still (lol).”
Whoops, there is a minus sign missing in that equation, between the “Thot” and “Tcold”. terms. Must be a WordPress thing.
For the GPE, your “Q” is an independent variable because we know it must be 400 W/m^2 when temperatures are stable.
“if you fix Q in that equation, and then increase Tcold..”
then you have added a thermal energy source. Where is this new source in the GPE? Please explain.
“Q” is not an independent parameter. I linked to this article as obviously it supports the correct solution to the GPE problem. “Fixing” Q to be 400 W/m^2 is incorrect. Heat flow goes to zero wherever possible, and in the idealized scenario of the GPE thought experiments, it is possible.
Dr Roys Emergency Moderation Team says:
Yes, if you turn off your 400 W/m^2 input.
Otherwise you have input but no output.
You realize net energy surplus means increasing temperature, do you?
“Yes, if you turn off your 400 W/m^2 input…”
…then the temperatures of all three objects go to zero. This appears to be the only condition in which you accept equilibrium, disturbingly.
Dr Roys Emergency Moderation Team says:
Is there something unclear about the article?
Exactly, Svante. When there is a continuous heat source turned on, like here, 400 W, then, shockingly, there is a continuous flow of heat. 400W in fact.
Its baffling that anyone with half a brain could think otherwise..
And the article confirms this.
The article is wrong when it says you can’t keep Q (the rate) fixed.
A (400 W) heater can do that.
“No, heat flow from a 400 W heater does not go to zero. Heat flow from a 400 W heater is 400 W.”
I agree. The 400 W heater outputs 400 W.
There’s no contradiction, because I said heat flow goes to zero wherever possible.
Like, between the plates (which is so obviously what I meant, and which I have made clear so many times before, that it is not possible to assume this is an honest mistake on your part, Svante).
The blue plate is a 400 W heater.
You say 0 W is going to the green plate (Eq. {1}).
Energy can not be destroyed, where is it going?
0 W is only going to the green plate if the heater (blue plate) is turned off.
Your problem is in trying to apply Eq. {1} to the inputs and outputs of each individual plate, rather than realizing that it applies between the plates, as is made clear in the article.
Dr Roys Emergency Moderation Team says:
I see, you felt you would mention something irrelevant.
Since our examples have power on.
I see, the laws of physics do not apply between plates.
Vague. Ok so DREMT has half a brain, and apparently admits for the first time that Q > 0 between the plates in the 3 plate problem, where the 400 W has never been turned off.
Now can he suggest a couple of temperature values that will give us a non-zero Q?
Or does the laws of physics not apply between the plates?
“The person (a sophist) even went out of their way to rearrange the equation so that Q was no longer a dependent parameter on the left hand side of the equation, in order to make it look like this:
Thot = 4√[Q/σ + (Tcold)4] Eq.{2}
All this is, is a simple algebraic rearrangement of Equation 1; doing such a thing does not change what the actual original physical equation represents in the first place. The only way this simple algebraic rearrangement makes sense is if you were giving a problem to a student, in which you knew the temperature of the cold object and you also knew the current rate of heat transfer between the hot object and cold object, and were thus asked to determine the temperature of the hot object. Problems like this are done simply for the training of mathematical competency and relating it to theoretical physical problems; the Q parameter in Equation 2 still depends on the difference between Thot and Tcold and can not in any way be independently fixed.
If you understood Equation 1, then it is clear that is impossible to “hold Q constant” if you increase Tcold. To say that you want to hold Q constant in Equation 2, actually makes Q an independent source of input energy and heat that no longer has any relation whatsoever to the difference between Thot and Tcold and the heat transfer equation, and so that is a completely different problem and set of physical principles you’re dealing with. Pretending that you can hold Q constant in that equation, in order to further pretend that cold heats hot and thus there is a greenhouse effect, is pure sophistry – albeit advanced sophistry. It is outright lying with (or should I say, about) mathematics, in no uncertain terms.”
Eq.{1} says what is true.
Your values yield 400 W = 0 W which is false.
Svante 9:10am, correct.
There is a missing term if the Tc is changing (missing since DREMT/Joe shows incompetence in this field); the term is its mass * Cp * dTc/dt. That term should have been added to DREMT/Joes eqn. 2 when he asserted “if you increase Tcold” but DREMT/Joe forgot the term basically because of his incompetence. Or maybe forgot deliberately due his sophistry. When done correctly to energy balance the GPE system transiently then find 400W = 400W.
“actually makes Q an independent source of input energy and heat that no longer has any relation whatsoever to the diffe”
Exactly what we have, an independent source of heat, 400 W!
Exactly what the article author states is needed to have a constant heat flow.
A steady source of heat produces a steady flow of heat. Just not that complicated.
“The person (a sophist) even went out of their way to rearrange the equation so that Q was no longer a dependent parameter on the left hand side of the equation, in order to make it look like this:
Thot = 4√[Q/σ + (Tcold)4] Eq.{2}
All this is, is a simple algebraic rearrangement of Equation 1; doing such a thing does not change what the actual original physical equation represents in the first place. The only way this simple algebraic rearrangement makes sense is if you were giving a problem to a student, in which you knew the temperature of the cold object and you also knew the current rate of heat transfer between the hot object and cold object, and were thus asked to determine the temperature of the hot object. Problems like this are done simply for the training of mathematical competency and relating it to theoretical physical problems; the Q parameter in Equation 2 still depends on the difference between Thot and Tcold and can not in any way be independently fixed.
If you understood Equation 1, then it is clear that is impossible to “hold Q constant” if you increase Tcold. To say that you want to hold Q constant in Equation 2, actually makes Q an independent source of input energy and heat that no longer has any relation whatsoever to the difference between Thot and Tcold and the heat transfer equation, and so that is a completely different problem and set of physical principles you’re dealing with. Pretending that you can hold Q constant in that equation, in order to further pretend that cold heats hot and thus there is a greenhouse effect, is pure sophistry – albeit advanced sophistry. It is outright lying with (or should I say, about) mathematics, in no uncertain terms.”
Let me explain what the equal sign means.
It means that the left side is the same as the right side.
Your solution is yields 400 W = 0 W.
If you look closely you will see that you don’t have the same value on both sides.
That means your solution is false.
Svante reads an article that explains why you can’t hold Q constant in Equation 1 or 2, and concludes that Q should be held constant.
Yeah, that article is BS.
Q will be constant if your heater has constant output.
Temperatures will change accordingly.
That is why we use heaters.
‘ if you were giving a problem to a student, in which you knew the temperature of the cold object and you also knew the current rate of heat transfer between the hot object and cold object, and were thus asked to determine the temperature of the hot object. ‘
Yep exactly what we have. Common sense says with a constant heat source one has a constant heat flow.
DREMT resorts to math when common sense isnt working for him. Or the reverse when math isnt working for him.
But each new day brings a new way for DREMT to deny facts.
“Yeah, that article is BS.
Is the article BS, or does it support your answer to the GPE problem? You people don’t get to argue both at the same time (unless of course you are prepared to accept that your answer to the GPE problem is BS)!
The formulas are good.
Saying Q can not be fixed is false.
It can be fixed by a heater.
For example at 400 W.
Exactly. That is called a fixed heat flux boundary condition. Another type is fixed temperature.
To claim that it is not possible to have a fixed heat flux is simply BS.
And does not agree with common sense. Still not sure DREMT has any.
The guy is saying that in THE CASE where we are ‘given two temperatures’, then “Q is not a fixed independent parameter but is rather dependent upon the two temperatures.”
Fixed-temp boundary conditions. He knows that a fixed Q BC is another possibility:
“If you want a physical equation that denotes temperature as function dependent on external independent parameters, such as an independent fixed heat source ‘Q’, then you have to go through the development for such a thing..”
Svante: does the article end where my last quote got to?
No, it goes on forever, but my BS filter is full right there.
You have been spouting BS constantly and we only got up to Equation 2! It’s funny how much you people seem to rely on others not actually reading links. Here’s the link again.
https://climateofsophistry.com/2013/05/27/the-fraud-of-the-aghe-part-12-how-to-lie-with-math/
All people have to do is read it.
Eq. {5} and {6} here:
http://tinyurl.com/tn2jp93
It’s funny how much you DREMT misses in his own links that cuts his legs out from under him.
Oh well, another day, more limbs lost.
The black body knight has had his limbs lopped off and this pinata is swinging by his single appendage. Fun for all and sundry.
Maybe we need to rename him ‘stumpy’.
Yes Nate, the name Stumpy works at least two levels.
Not only for the remnants of his appendage but also because he is always stumped for an answer.
“If you understood Equation 1, then it is clear that is impossible to “hold Q constant” if you increase Tcold. To say that you want to hold Q constant in Equation 2, actually makes Q an independent source of input energy and heat that no longer has any relation whatsoever to the difference between Thot and Tcold and the heat transfer equation, and so that is a completely different problem and set of physical principles you’re dealing with. Pretending that you can hold Q constant in that equation, in order to further pretend that cold heats hot and thus there is a greenhouse effect, is pure sophistry – albeit advanced sophistry. It is outright lying with (or should I say, about) mathematics, in no uncertain terms.
How to actually do it
If you want a physical equation that denotes temperature as function dependent on external independent parameters, such as an independent fixed heat source “Q”, then you have to go through the development for such a thing as I showed in last year’s paper where we proved that there is no GHE in operation in the atmosphere. I’ll quickly show this here…”
“where we proved”
See? It’s always about the “we”…
DREMT/Joe’s “we” would have had to prove both thermometer measured planetary near surface air brightness temperature ~288K AND satellite radiometer measured planetary brightness temperature ~255K are inaccurate for no GHE. This particular “we” proved no such thing.
‘is no GHE in operation in the atmosphere.’
Not relevant to your plates fiasco is it.
Good try at distraction though.
‘To say that you want to hold Q constant in Equation 2, actually makes Q an independent source of input energy and heat that no longer has any relation whatsoever to the difference between Thot and Tcold’
Yep and DREMT STILL fails to understand that the CONTEXT of this statement matters.
The context is stated that we are ‘given two temperatures’.
Then of course, if given the two temperatures then you cannot hold the heat flow constant. Duh.
But in the 3 plates case we only know that the Green plates temp is 244 k (SB law and known flux 200 W/m^2)). We are not ‘given two temperatures’ of GREEN and BLUE.
We are given the heat flow, is 400 W from a ‘independent fixed heat source’.
Then the temperature of the BLUE plate plate will now become “dependent on external independent parameters, such as an independent fixed heat source ‘Q’,”
Thus the Blue plate’s temperature must be whatever it NEEDS to be to cause a heat flow output of 400 W to be rid of the heat supplied by the ‘independent fixed heat source’.
Will DREMT understand the differences between fixed temperatures and fixed heat flow?
Probably not, it is simply beyond his level of comprehension.
“…When the temperature of the cold wall increases, then all that happens is that the rate of increase of temperature of the cold wall decreases, because the difference in temperature between the hot wall and cold wall becomes smaller. It is basically in this way that the condition of thermal equilibrium is achieved in nature. And note that an increasing temperature of the cold wall does not affect the temperature of the independent hot wall! Cold does not heat hot in real physics.”
Ugggh. This makes no sense..
https://climateofsophistry.com/2013/05/27/the-fraud-of-the-aghe-part-12-how-to-lie-with-math/
Yeah. You need to read that article carefully. It doesnt help you.
“And note that an increasing temperature of the cold wall does not affect the temperature of the independent hot wall!”
All the math he shows simply boils down to: if the hot wall’s temperature is held fixed, then it is FIXED!
Hes a genius at conning ignorant people with math. And i agree with Svante that his eq 5, 6 are not relevant to plates, since AGAIN, hot plate temp is not fixed.
Thank you. Team GPE has put on a great dishonesty display here.
@bdgwx
The Southeast, not CONUS. How did I miss that?
Still, the author starts off by making some general comments about raw versus adjusted, and then near the end of the article uses the Southeast as a local example. Maybe a cherry pick, but my guess is not.
I don’t think it’s just the southeast. If I remember correctly the net effect of adjustments increases the warming trend for the CONUS as a whole as well.
FWIW, I once submitted a comment on Tony Hellers blog, mentioning very politely that the long drought during the dust bowl years at least partly explains the high temperatures. Very little cooling from evaporation.
The comment went into moderation, then never appeared. I have no doubt the guy is a fraud.
Snape, please stop trolling.
@ScottR
[The adjustments always add a degree of subjectivity to the dataset biased towards the adjusters opinion, and come with the assumption that the scientist taking the measurement at the time was incompetent.]
Youre grasping at straws. Station changes, changes in time of measurement, instrument bias….. none of those reflect on the competence of the scientist.
******
Do you realize that here at UAH, almost all of the data that was reported prior to 2015 has since been altered, with the net result being a reduced trend? You trust Spencer and Christy, you dont trust the others. A matter of opinion not science.
Exactly, Snape!
And I just made at WUWT one more time the experience that this holds for sea levels as well.
Most Pseudoskeptics solely trust in those whose message fits into their own narrative.
Joyeux Noël…
J.-P. D.
Another source of error in models is the carbon cycle.
The following graph compares the variations of CO2 emissions (source BP) with the variations of CO2 concentrations (source Mauna Loa). The coorelation is ppor : 0,14.
Human emissions don’t explain correctly carbon dioxide variations.
https://www.cjoint.com/doc/19_12/ILvkEhSnD0e_VariationsEmissionCO2vsMaunaLoa.png
Blue line : emissions, millions of tons
Red line : concentrations ppm
On your graph the rate of annual industrial emissions has only a weak trend, while the annual increase in CO2 is increasing.
Clearly something extra is happening.
Prime candidates:-
1) The sinks currently absorbing about half of our emissions are absorbing less over time.
2) Existing carbon reservoirs such as permafrost and dissolved oceanic CO2 are releasing more CO2 over time.
There is a trend (R=0,47) : variations from one year to the next are becoming greater. Maybe it can be connected with the increased leaf activity index. The more carbon dioxide there is, the more vegetation absorbs.
Yet, there is the correlation between human carbon emissions variations and observed atmospheric variations is very weak meaning there is a weak causation.
Paul the graph is comparing the wrong things.
It is showing annual rate of change of concentration (ppm).
That needs to be compared directly to emissions.
The data shown are not emissions, which have a strong increasing trend, while that data does not.
Why would this be a source of error for the CMIP5 suite of models?
Maybe you could list all the sources of error you can think of. Is an incomplete understanding of the carbon cycle in your list or not? Do you think it should be?
If you want a complete understanding of the carbon cycle go to Ed Berry’s new paper. He essentially has obliterated the IPCC carbon cycle.
‘He essentially has obliterated the IPCC carbon cycle.’
No not really. He is just another crank on the internet who has no credibility.
But there are buyers for all kinds of nonsense on the internet.
Paul Aubrin
“Another source of error in models is the carbon cycle.”
“Human emissions don’t explain correctly carbon dioxide variations.”
No the error is on your side.
Like so many people, you forget / ignore the fact that like heat, most CO2 is absorbed by the oceans.
Maybe one day they will tell us: “Enough of that stuff!”.
Merry Xmas
J.-P. D.
Paul
[…the correlation between human carbon emissions variations and observed atmospheric variations is very weak meaning there is a weak causation.]
If human carbon emissions variations was the only forcer of atmospheric variations, we would expect to see a strong correlation. That is not the case.
Like, if the Dow Jones consisted of just one stock, there would be a perfect correlation between the ups and downs of each. But when multiple stocks are added to the index, this correlation is no longer observed.
It doesn’t really matter, does it? The models don’t reflect reality. Either the designers or the users or both are incompetent. What’s your pleasure?
Measured water vapor trend has increased faster than possible from feedback. https://watervaporandwarming.blogspot.com
Dan,
Is this your blog? Also, do you believe most of the water vapor increase has been caused by increased irrigation?
Stephen P Anderson
Germans love to say: ‘Jedem sein Steckenpferd!’
Clearly, Pangburn’s is irrigation, against all odds.
Frohe Weihnachten
J.-P. D.
No doubt Germans love to say all sorts of things. What is the German for “Climate models are completely worthless, as they do not reflect reality.”? Or does it sound better in French or Swahili?
The link provides an objective assessment that shows that about 96% of water vapor added by humans comes from irrigation. Links to all the source data are provided for anyone who is willing to challenge the finding. Current land area under irrigation amounts to more than 4 times the area of France and it is mostly in areas that were previously arid.
I would like to see the CMIP6 models run with the solar components that were removed.
Gregory J,
Thank you for reading my paper. Here are my replies to your questions:
1. Basically, I’ve confirmed from the temperature record on the Greenland ice sheet that the temperature rarely if ever breaks above 0 deg c. The record is 2 deg c. This allows us to ignore the melt at the ocean. Basically, the amount of ice melting as it hits ocean waters has nothing to do with the health of the ice sheet, and is mostly determined by the amount of snow fall pushing the ice downhill (far in the past), and short term ocean temperature fluctuations. Anyways, the system will always find equilibrium and the ice will never disappear. Less snow will slow the glaciers down and less ice will make it to the ocean. Warmer oceans will melt more ice at the coast, but as long as we don’t see any major changes in temperature on the sheet itself we won’t have any risk there. Arguably, a warmer ocean will increase snow fall.
2. For the day night split… if CO2 causes moderation (warming nights and cooling days) it will be harder to melt ice at the poles which is opposite of what we’ve seen for the last 40 years in the arctic. Anyways, I think the warmer oceans are causing the warmer nights, and the colder day time highs are due to declining solar activity. This could also be caused by increased cloud cover. Clouds have a moderating effect. It makes sense that cloud cover should be increasing since we’ve crossed over peak solar irradiance of the modern maximum. There also may be a relationship to the meridional jet stream flows and the magnetic field. A more simple cause could be the AMO / 61 / 84 year cycles as outlined in my paper. Really, the AMO explains everything. The ice in the arctic… temperatures in the eastern USA and Europe, middle east.
3. If you have an updated reconstructed TSI, I would love to see it. Please post a link. As to the temperatures, if you are referring to my model, the central England dataset is actual temperatures, not reconstructed. Therefore, we know the majority of the warming came right after we emerged from the little ice age.
Snape, Bindidon
I have already explained why UAH is correct, and RSS is not correct for the TREND since 1980. RSS is my go to for month to month deltas.
https://www.facebook.com/100000276969216/posts/2817727044913167?sfns=mo
If UAH is so useless, why do you continue to come to this page? Perhaps the information here is a threat to your agenda and you feel the need to disprove it. Have you guys read my paper? Honestly, I need feedback from people that disagree with me. It helps solidify my foundation even more. My opinion does change as I learn. When was the last time you opened your mind up to change?
People like Snape think this blog is their personal soap box
He has 25 posts in this thread alone, why does he not make his own blog instead screwing up this one.
Where is ren? I want him to tell us how cold mainland Europe has been this month.
Yes, that would be good, Des.
Yes it would – if it were true.
If what were true?
Here you go being deliberately obtuse again. At least I hope for your sake it is deliberate.
Have you ever said anything true?
Given that my comment gave you two possibilities to choose from, true/false was not a consideration. Was it deliberate, or are you habitually obtuse?
True or false is always the ultimate consideration.
@ScottR
From Polarportal:
[the total mass balance has two main components, that dealing with surface processes of precipitation, melt and runoff and the dynamic component related to the flow of glaciers, including calving processes.]
http://polarportal.dk/en/news/news/surface-mass-balance-of-the-greenland-ice-sheet/
The graphic shown in your paper refers to the surface component (SMB), not the total mass balance. Calving is not included in SMB.
******
Surface mass balance (SMB) is defined here:
[SMB = Precipitation Evaporation Sublimation Runoff (2)
Where RUNOFF = Melt + Rainfall – Refreezing]
Snape, same replay as above,
I’ve confirmed from the temperature record on the Greenland ice sheet that the temperature rarely if ever breaks above 0 deg c. The record is 2 deg c. This allows us to ignore the melt at the ocean. Basically, the amount of ice melting as it hits ocean waters has nothing to do with the health of the ice sheet, and is mostly determined by the amount of snow fall pushing the ice downhill (far in the past), and short term ocean temperature fluctuations. Anyways, the system will always find equilibrium and the ice will never disappear. Less snow will slow the glaciers down and less ice will make it to the ocean. Warmer oceans will melt more ice at the coast, but as long as we don’t see any major changes in temperature on the sheet itself we won’t have any risk there. Arguably, a warmer ocean will increase snow fall.
Scott,
There are several things wrong with the comment above. Most egregious:
[Anyways, the system will always find equilibrium…….]
The ice sheet has been growing and shrinking for millennium. Are you not aware?
Back to the point. Given that models don’t agree with reality, who is most to blame? The model programmers, the users, or both? Trying to madly divert in every direction won’t disguise the fact that the models do not appear fit for purpose.
To the point, your given is not given, you can’t assume the models don’t agree with reality, you have to make some kind of measurement.
The models don’t appear to be fit for purpose? According to your MKI eyeball, or have you upgraded to MK III?
Dr Spencer compares the results of 102 models to reality. They all give different results. None accord with reality. Which one do you think is fit for purpose? Why are the other 101 models wrong?
No, actually Dr Spenser compares the results of 102 models to modeled reality, it’s models all the way down.
Compare a wrong thing to a wrong thing, maybe you can learn something, but since you are a sock puppet, maybe not.
Scott
The TOTAL mass of the Greenland ice sheet is measured by satellite, and has found to be declining. Here is an explanation of how the satellites determine changes to mass:
[GRACE-FO, like GRACE, is designed to measure monthly changes in gravitational pull that result from changes in the mass on Earth below the orbiting satellites. More than 99 percent of Earth’s mean gravitational pull does not change from one month to the next, because it is due to the solid Earth itselfits surface and interior. Water, however, moves continuously nearly everywhere: rain falls, ocean currents flow, ice melts and so on. As the twin GRACE-FO satellites orbit Earth, one closely following the other, these moving masses alter the gravitational pull below the two satellites, changing the distance between them very slightly. The record of these changes is analyzed to create monthly maps of the variations and redistribution of Earth’s mass near the surface.]
https://phys.org/news/2018-05-grace-fo-cold-case.amp
Don’t want to address the failure of models to provide anything useful at all? Why is that?
@Cynical
Yes, Mike, models are far from perfect:
[We analyzed 40 climate models from modeling centers around the world, said Eisenman, a professor of climate, atmospheric science, and physical oceanography at Scripps. Not a single one of the models simulated as much Arctic sea ice retreat per degree of global warming as has been observed during recent decades.]
https://scripps.ucsd.edu/news/research-highlight-loss-arctics-reflective-sea-ice-will-advance-global-warming-25-years?fbclid=IwAR0u8l81KrNAmnUaDvkVInPWPPpH4pGiNxygcLu0rpqQeMnE2EEzQtEns
Why do you think anybody pretends they are useful, then? None of them do any better than just assuming that past tends will continue. The sort of thing a twelve year old can do. Have you actually read Dr Spencer’s post?
Hi Mike. You clearly have no respect for Mr Spencer, given that he has made it clear that you are not wanted here, and you keep ignoring his wishes.
So who do you think is more incompetent? The authors of the models, or the users? As Dr Spencer has pointed out, the models don’t reflect reality. He is not certain why. Do you think you can help?
Nothing to do with my point.
Cheers
Des, perhaps you could show your respect for Dr Spencer by not referring to him as “Mr Spencer”?
DREMT
Do you have an issue with the fact that Gordon stated explicitly that he would never refer to a non-medical doctor as Dr., and as such would never refer to Mr. Spencer as Dr. Spencer? Or do you have a bias that is related to a person’s stance on climate change?
Who’s Gordon?
Oh FFS …. https://www.drroyspencer.com/2019/10/uah-global-temperature-update-for-september-2019-0-61-deg-c/#comment-393483
Oh, Gordon Robertson! Yeah, I think he might have just stopped commenting due to his disgust.
So back to my question ….
Heres the answer. Gordon Robertson is a good person.
You are a disgusting, depraved, abomination. You willingly encourage a human being to commit suicide. You are filth.
So someone who you deem to be a “good person” is permitted to show disrespect towards someone without attracting a response from you. Exactly the point I was trying to make – thank you.
I am pleased you would never show disrespect to me without expecting someone to leap to my defence. Irrational, but laudable. I am assuming you consider yourself to be a good person, rather than a dimwitted fool.
Someone thinks he is Mr. Spencer.
Maybe he is.
Mike,
I have never argued that climate models have been better than a persistence forecast would have been. This is new science and they are a work in progress.
So all the policy advice to governments from the IPCC, and the 97% consensus, is based on a work in progress that can’t actually outperform a 12 year old? Brilliant?
The first automobiles may have been no more useful than a horse and buggy. Would you call the designers incompetent?
Brilliant, more likely.
Stay focussed. Climate models don’t reflect reality. Bad programming or user gullibility? What do you think?
Earlier you butted in and completely changed the subject. Now you tell me to stay focused.
Cheers
Indeed. Climate models don’t reflect reality. Why is this?
gallopingcamel
I believe this is the article you comment on with the very high climate sensitivity numbers.
https://royalsocietypublishing.org/doi/10.1098/rsta.2012.0294
I would like to read through it sometime (rather long) to see if it seems valid science. At this time I think they have extreme overestimation. Now I know where Greta gets her ideas from.
With the water vapor sensitivity increase they seem to make the same wrong conclusion. They only use the change in energy balance from increased water vapor levels. They neglect that in order to get the water vapor there you have to have much more evaporative cooling of the surface. Seems you would have two opposing mechanisms. Increased WV will warm the surface but to get the increase in WV and sustain it then you must also have a higher loss of energy via evaporation which cools the surface. Kind of like the complexity of clouds. They can send more IR to the surface but they also reflect away a large amount of potential solar input from reaching the surface so there are competing processes going on.
Norman
Think in terms of fluxes.
What triggers the increased evaporation is increased downwelling radiation reaching the surface.
This increases the surface temperature, the rate of evaporation and the rate of evaporation cooling.
The increased incoming radiation and the increased evaporative cooling balance at the new equilibrium temperature.
The Holocene warming was 5C, induced by about 20W of orbitally induced forcing and feebacks.
The original forcing was about 5W, giving a sensitivity of 20/5=4.
The historical record gives 1.1C warming since 1880, about 4W of forcing and feedback. This has come from about 2W of CO2 forcing ( all the other potential forcing add up to zero).
Sensitivity from observation is 4/2=2.
Since that 2 takes no account of lag, you can treat it as a minimum.
Entropic man
You are not giving enough information to evaluate your claims.
I was looking at this:
https://skepticalscience.com/LIG2-1906.html
To try to understand your points. Can you provide more information?
Also it is not a simple thing as you believe. The amount of water vapor is a very complex process. You can have very high temperature and fairly low amount of water vapor in a region (desert).
I will stick to the known reality.
You take two locations in the US that are approximately the same latitude. The wetter one has an average temperature much below the drier one.
Here: Phoenix, Arizona and Birmingham, Alabama
https://www.usclimatedata.com/climate/phoenix/arizona/united-states/usaz0166
https://www.usclimatedata.com/climate/birmingham/alabama/united-states/usal0054
If you notice the yearly average temperature of each…
Phoenix is 75.05 F with 3832 hours of sunshine
Birmingham is 63.3 F with 2662 hours of sunshine.
I am not convinced by your posts that it a simple flux variable.
The obvious empirical facts are that the wetter area is considerably cooler than the drier area. So I do not see evidence that the world must warm from increased water vapor. The evidence suggests it could go the other way. A wetter world will lead to a cooler world.
Norman,
Not sure what you are trying to say with this comparison?
The wetter locations have much higher latent heat content in their air and soil, and often higher enthalpy content than the dry places.
Much of the heat-trapping effects of GHG goes into evaporating water in these wetter locations.
@Norman,
That is the paper! Take a look at Figure 7a that shows huge changes in our planet’s surface temperature related to 12 doublings of [CO2] and four halvings.
Take a look at Figure 7b that shows the “Sensitivity” that is much higher than the IPCC’s 3 K/doubling. There are things about these charts that don’t make sense. For example:
Is it reasonable to suppose that three halvings of the tiny (400 ppm) trace of CO2 in our atmosphere will cause the global temperature to drop by 41 K?
Figure 7a shows the onset of the tropopause occuring at pressures ranging from 0.003 to 0.3 bar. All seven bodies in our solar system with significant atmospheres have tropopauses that start around 0.1 bar.
Figure 7 shows 12 doublings which corresponds to multiplying Hansen’s 310 ppm (1950 CO2 level) by 4096. That would raise the surface pressure to 3 bar. So why does Figure 7 not extend to 3 bar (3,000 hPa)?
Will someone please remove bonehead Mike Flynn from this board. His useless posts add nothing to the conversation.
Interesting that Mike Flynn (and Gordon Robertson) get through the keyword filter.
E*? doesnt get through. Maybe if you go back two generations then you can squeeze through.
Alternatively perhaps they got a cease and desist p.m. from the boss?
You call for censorship of the truth because you are a vile, disgusting piece of shit.
He calls for censorship of vile, disgusting pieces of shit.
Naturally as he is responsible for the team that moderates foul language. Particularly in an emergency.
I have never called for censorship. “Please stop trolling” is a request, a joke, and a potential remedy.
You should have your say, absolutely.
Dr Spencer, and WUWT, should just admit there is no GHE. They have an enormous platform. It is time.
DREMT,
I am glad that you clarified your comment below at 7:51pm on Christmas Eve.
“F***king wake up. There is no greenhouse effect. There is simply a relentless, malevolent force acting against humanity in every way that it can. You are letting it happen.”
I thought for a moment from the concluding sentence of this unhinged whining complaint, that you were advocating censoring those that disagree with your views.
Glad you cleared that one up.
Yes, I clarified; though I had hoped it was pretty clear to begin with. Dr Spencer is “letting it happen” by not speaking out. They have such a big platform, such a big audience. The problem isn’t “silencing” you creatures. You entities should have your right to utter your relentless, churning shod. However, Dr Spencer could use his blog, and connections to WUWT, to even greater good.
I think Dr Roy spoke out forcibly and covered the relevant material here,
http://www.drroyspencer.com/2019/06/on-the-flat-earth-rants-of-joe-postma/
Maybe you should re-read this to refresh your memory.
There are also numerous other occasions where Dr Roy has explicitly stated his belief in the existence of the GHE. I can link to them but a simple Google search will find them for you.
However, if you want Dr Roy to renounce his previous views on the GHE, I wish you the best of luck in that endeavour.
From Dr Spencer – “Another possibility, which Will Happer and others have been exploring, is that the radiative forcing from CO2 is not as strong as is assumed in the models.” Currently, models use values which give a TCR of about 1 to 3. What do you consider would be less strong than 1? 0? -1?
Cynical,
A bit off the topic of this little sub-thread which is DREMT’s dream. To quote-
“Dr Spencer, and WUWT, should just admit there is no GHE”
I gather you have an opinion on this matter which may have led to you being banned in your previous incarnations.
Would you like to repeat your opinion?
I have many opinions. So do others. All the opinions in the world plus a few dollars will probably buy you a cup of coffee. How much are you offering for mine?
Cynical, I am glad you have stepped in to cover DREMT’s absence, while he is off licking his wounds.
It may take time for DREMT to reappear as his Elizabethan Collar would be expected to impede his vision and also access to his keyboard.
In the meantime, in his hour of need, he is in your very capable hands. What could go wrong?
With respect to your opinion, my opening bid is 1? 0? -1? Venezuelan Bolivars. That should cover it. Let it rip.
So do you agree with Dr Spencer’s opinion or not? Why do you bother seeking mine? Just trolling?
Cynical,
After reading both sides of the debate represented by Spencer and Hausfather, I don’t have a strong opinion on the matter. I don’t think either versions can be ruled out so I will stick with the most likely value for the ECS, is between one and three. However this is just a lay opinion.
Cynical, what’s your take on the matter? You normally have very strong opinions and appear to reject GHE entirely. The implication is that you strongly disagree with Dr Roy and you believe the sensitvities are zero or even negative. Do you have a specific number in mind for the ECS?
So do you agree with Dr Spencer or not? He seems to measure things, and revise his views if necessary. So do I. What do you do?
Cynical. I have already given my opinion which is somewhat equivocal directly above i.e.
“I dont have a strong opinion on the matter. I dont think either versions can be ruled out so I will stick with the most likely value for the ECS, is between one and three. However this is just a lay opinion”
I have shown you mine. You are normally very forthright in your opinions, so why don’t you show us yours or are you ashamed?
What is your preferred value for the ECS? Don’t be shy, Size isn’t everything.
So do you agree with Dr Spencer or not? Man up. Don’t be shy. Maybe someone cares what you think.
As I said, I am a layman on this topic. I prefer to seek the advice of people with more expertise than myself. So I would say somewhere between 1 and 3 and if pushed 2 +/-1.
I believe that Dr Roy is more of a below 1.5 person. Has he put upper and lower limits on his estimate? Even if not, his 1.5 is inside my guesstimate of the value including the uncertainty, so I guess we agree.
Cynical, do you disagree with Dr Roy and are going with GHE free value of zero for the climate sensitivity?
Over to you Cynical. Time to lay your cards on the table.
It’s time for me to do whatever I want. Don’t you agree? You may continue to act the fool if you wish.
Whatever. Just another miserable failure to add to your collection.
MikeR, just keep ranting at the mirror.
DREMT, I would suggest you also look in a mirror. Maybe use it to reflect on your appalling behaviour, then
1. you would then not be absorbing so much ridicule and
2. your temperature would not rise to boiling point and
3. you would not explode periodically emitting noxious emissions in all directions.
Win, win for all of us.
MikeR, JKRATM.
@Entropic man
I think Norman is right, in principle at least. If surface cooling from an increase in evaporation is underestimated, the calculated rate of warming will be too high.
” If surface cooling from an increase in evaporation is underestimated, the calculated rate of warming will be too high. ”
This is one of the best understood and most easily measured climate variables. It does not strike my as the sort of variable likely to be underestimated, or for that matter overstimated.
The amount of water vapour the atmosphere can hold is well defined by the Arden Buck equation.
https://en.m.wikipedia.org/wiki/Arden_Buck_equation
It predicts an increase of 7% absolute humidity per C.
The latent heat of vaporization is also well defined, 2.7MJ/kg.
There’s also the problem that the water cycle has to be modelled on weather models as well as climate models, using the same physics.
If surface cooling were being underestimated we would see the weather models overestimating temperatures, which they do not do.
Perversion of science
https://youtu.be/dOxXz4KjI4Q
Dear Dr Spencer: please be aware that your blog, among many others, is under relentless manipulation by some of the most inhuman, sociopathic, soulless and utterly incomprehensibly depraved “people” that have ever existed, or ever will.
Fucking wake up. There is no “greenhouse effect”. There is simply a relentless, malevolent force acting against humanity in every way that it can. You are letting it happen.
DREMT
Are you actually the goofy cult leader Joseph Postma that is highly irrational in thought and word and very closed minded? You talk just like that demented human that leads a couple people down the path of delusional science.
I thought you were an independent thinker but your last post sounds very near to the extreme fanatic Joseph Postma. I would not be surprised if you were him.
DREMT
The GHE is based upon valid heat transfer physics. It was not created by deranged climate alarmists. Only goofy and blind followers of the goofy Postma can read actual textbook science and not understand what it is saying.
If you have a heated object (earth’s surface) that receives a continuous supply of new energy from and outside source it will get hotter if some of the energy that would leave is now redirected back to the surface. You are just wrong and now go fanatic because you have nothing to back up your crazy claims. You are not a scientific person.
So why do the models not reflect reality? Surely the modellers have read the textbooks. I find it interesting that not one of the 102 models produces the same outputs as another. I presume you know the answers, as you are very definite in your criticism of those who point out the models appear no more useful than the naive persistence predictions of a 12 year old. Do you know more than all the modellers combined?
Why do you think they should be the same?
Look into how the modelers do what they do, there might be some thing you could learn by doing that, or you can remain an ignorant sock-puppet.
Your choice.
Your assertions on weather modeling vs persistence forecasts have been proven ludicrous. Why should your similar declarations on climate modeling and persistence forecasts be taken seriously?
Proven? You jest, of course. You do understand that projecting a trend into the future is a naive persistence forecast? Maybe not.
There are people including over 90% of “Climate Scientists” who claim that the GHE is 33 K.
This is a case of 90% of “Climate Scientists” being 100% wrong.
My understanding of the GHE (Green House Effect) is the temperature difference between Earth without its atmosphere compared to Earth “As Is”.
The GHE is therefore 91 K if you use the Moon’s average temperature as proxy for an airless Earth. Or it could be 79 K if you take the rate of rotation into account.
gc, if you google the def. of GHE you should find generally accepted that Earthen 33K comes from increasing IR active atm. gases to current ppm levels. This means with total air atm. in place. GHE power of an atm. is reasonably & typically measured in literature by comparing a planet’s (or a moon’s) median surface atm. temperature Ts with its planetary effective brightness temperature Te.
For a good discsussion see Haberle 2013 in Icarus 223 pp. 619-620.
N&Z, for example, defined their unique GHE term as a planet’s or moon’s “temperature above an airless environment”. One just has to be careful to note which def. of GHE is in use when discussing any particular paper as one def. is not wrong and the other right.
The idea that the GHE may be widely believed yet it is false because the assumed temperature of an airless Earth (255 K) is much lower.
An airless Earth would have an average temperature in the range 197 to 209 K depending on whether you take the rate of rotation into account.
“the assumed temperature of an airless Earth (255 K) is much lower.”
Your meaning is not clear here gc.
Yes, the planetary global brightness temperature of an airless earth would be lower than 255K as the ~30% land bolometric bond albedo would approach that of the moon (~0.12) & the ~70% frozen ocean albedo that of Enceladus (~0.18).
The surface brightness temperature though of 1bar O2,N2 global near surface air would be 1K to 2K above the planetary brightness temperature 255K as only the emissivity of those gases would contribute to OLR reduction.
You are using the moon global brightness temperature (monthly rotator) when you should be using the airless earthen planetary brightness (daily rotator). I’ve not read anyone publishing an estimate earthen airless brightness temperature, though doesn’t mean there is one.
Also, you are using a non-equilibrium brightness temperature for the moon, the equilibrium thermometer temperature would be closer to 250-255K based on Apollo data if that were globally measured; at present it is unknown as there is no moon global thermometer field (GHCN level).
Make that frozen ocean albedo that of Enceladus (at least ~0.81). Or higher according to some reports.
@Ball4,
I built a model for the lunar surface temperature that agrees with five other models and the measurements made by the Diviner LRE.
Imagine that! Models that agree with observations. Here is a link to a post that explains.
https://tallbloke.wordpress.com/2014/04/18/a-new-lunar-thermal-model-based-on-finite-element-analysis-of-regolith-physical-properties/
The truth is the truth. It may even be unpleasant at first…but you’ll get there. You can do it, Norman.
DREMT,
Get some help. And quickly.
How quickly they pop up.
Hi Norman and Merry Christmas!
[The obvious empirical facts are that the wetter area is considerably cooler than the drier area. So I do not see evidence that the world must warm from increased water vapor. The evidence suggests it could go the other way. A wetter world will lead to a cooler world.]
I spent a lot of time on this thanks to arguments with Kristian, with not much to show for it! The whole issue is bewildering. Nothing is straightforward at all.
Did you know that on a yearly average, the atmospheric column above the Sahara radiates much more to space than it receives from the sun? A negative imbalance. Same is true at the poles.
On the flip side, the atmospheric column above Birmingham may very likely receive MORE radiation from the sun than it radiates to space. A positive imbalance. This is true for a wide band of latitude along the equator, where its also humid.
My point being, the temperature/water vapor differences between Birmingham and Phoenix can be very misleading WRT global temperature.
Fairly obviously, if 102 models provide different outcomes, at least 101 are wrong. Why not just ignore the wrong ones? Bewildering indeed!
CMIP models are like politicians……they are all lying. You can safely assume that 102 out of 102 are wrong.
The problem with “Climate Scientists” is that although they cannot explain the past or predict the future they expect us to trust them.
Given that 102 models all produce different results, you are not the only one bewildered.
Of course 102 models all produce different results.
They use the same physics,several different emission scenarios and randomly varied ENSO and volcanic activity.
What would be the point of repeating the same model run 102 times? The purpose is to generate an ensemble from which you can deduce the likely outcome of different policy decisions.
Models are run again and again, tweaking inputs as required. An ensemble of incorrect answers provides no more assurance than a single incorrect answer.
Cynical
Can’t have you bewildered. Read this.
https://www.carbonbrief.org/qa-how-do-climate-models-work
And?
Snape
I too debated with Kristian on the very issue.
I can show you with more direct measured values. Not abstract.
Here:
https://www.esrl.noaa.gov/gmd/webdata/tmp/surfrad_5e03c107a89d6.png
This is an image of NET energy (all the inputs) and air temperature for Nevada desert location.
https://www.esrl.noaa.gov/gmd/webdata/tmp/surfrad_5e03c241858e3.png
This is and image of the NET energy and air temperature from the same day in a very wet area of Mississippi.
If you look at the the NET energy (I looked for one that was fairly clean, clouds really mess up the solar input) you will see that the Mississippi location has much more NET energy input per m^2 than the desert. Yet the desert location is considerably warmer. The difference would be in the evaporative heat loss in the wet location. The desert would have much less energy lost via this route so even with less input radiant energy, it ends up being about 10 C warmer. This is why the issue is very complex.
Even the energy CO2 supplies via DWIR is not simple as it overlaps with water vapor and clouds. The whole thing is quite complex and difficult to arrive at any easy conclusion. Even though the energy lost by evaporation may be well known how much water actually can evaporate is very complex. If there is wind much more evaporation is possible with same radiant energy input. As the air saturates less water can evaporate. Clouds are very complex. High thin clouds provide a slight warming. Low thick clouds end up cooling. Overall clouds cause a negative feedback if you believe the CERES data. Cloudy days have less NET energy than clear ones. But clouds are complex as if clouds form at night and clear during day they will have a positive warming effect.
@Norman
[In general, the absorbed solar radiation exceeds the outgoing longwave radiation in the tropical and subtropical regions, resulting in a net radiative heating of the planet, while in the middle to polar latitudes there is a net cooling. This equator-to-pole difference, or gradient, in radiative heating is the primary mechanism that drives the atmospheric and oceanic circulations.]
http://profhorn.meteor.wisc.edu/wxwise/museum/a2/a2net.html
https://earthobservatory.nasa.gov/global-maps/CERES_NETFLUX_M
Merry Christmas!!!
And Thank you every body for your coments!!
I’m very Happy to have found this forum and to discover the discusion about the magnitudes and origin of climate change is open and this forum is the proof of that…
Unfortunatly, I was very busy while COP And I couldn’t follow It nor this forum!… But I’m very interesed in every comment here and outside, and I’ll try to share my opinion soon
Thank you a lot Dr. Spencer for your work!!!! And my best regards from Spain!!! And for everybody of course!!
Merry Christmas 2u2, Adelaida.
(The blog software rejected the Spanish translation!)
Snape, Norman
You might find this interesting. Note the last sentences in the abstract.
https://ui.adsabs.harvard.edu/abs/2012NatGe…5..691S/abstract
The last link didn’t take.
Try here.
https://www.nature.com/articles/ngeo1580
Entropic man
Thanks for the link. They are including the increase in evaporation in the calculation. Good to know.
DRsEMT, Your post is rather like Joe Post-man’s usual rants when he is challenged with factual data. Name calling and foul language is his trademark. He/you apparently can’t accept the facts of thermal IR EM radiation heat transfer, is a subject well researched and widely presented in text books. Furthermore, You appear to be ignorant of the fact that Spencer & Christy’s work with MSU/AMSU data if based on the same fundamental physics as that of the CO2/Greenhouse Effect, so you rejection of the GHE would require that you also reject the UAH results as well.
But, you never let facts stand in the way of a good rant.
Insulation keeps something warmer, it doesn’t make something warmer. Insulation is not “cold” heating hot. An object can not make itself warmer by its own temperature, or by its own radiation.
There is no GHE. The beautiful sun is more than plenty to keep us warm, and alive.
Be thankful for reality.
DRsEMT wrote:
Total gibberish. You are again displaying a complete lack of understanding of heat transfer.
Adding some insulating material between a body and it’s surroundings reduces the rate of energy flow (aka: heat loss) from said body to the surrounding environment. For the case that we’ve been discussing for many months where there is a constant flow of energy supplied (a fixed power input), the temperature of the body must increase enough to cause the energy flowing out thru the now thicker insulation to equal the input power.
Basic physics and engineering.
What I said is the truth.
No. Ever heard of Dunning-Kruger? Maybe you should take a remedial high school physics course for a start.
Insulate a cooling corpse. Temperature does not increase. Basic physics. You were saying?
For the case that we’ve been discussing for many months where there is a constant flow of energy supplied (a fixed power input)…
Try that on your insulated turkey. Enjoy.
We are talking about insulating something that is also being heated.
Do try to keep up and leave the corpses in the ground.
So you want to use earth as the insulator? Suits me. Now what?
The detection and tracking of water vapor via space based instruments also exploits the same fundamental physics that drives the GHE.
No DREMT that wasn’t the orginal question of course.
You chose to answer your own version of (c) which predictably was wrong* .
So to avoid running around in circles continuously **, can you answer the question that was originally posed as
In your view are the two idiots are (a) in thermal equilibrium and at the same temperature or (b) the idiot in the shade is warmer than the idiot in the sun or (c). The idiot in the shade is cooler than the idiot in the sun?
* for a brief discussion see every discussion between JoeP/g*/h*ff/DREMT and almost everyone else since the latter part of 2017.
** see *.
An object can not make itself warmer by its own temperature, or by its own radiation.
DRsEMT the troll, repeat this red herring:
Which has nothing to do with the GE, the GPE or any of the other examples discussed in which the body is being continuously supplied with energy at a constant rate.
Did DRsEMT ever read my Ice Plate experimental demonstration?
https://app.box.com/s/75x6grubursu06sq6kvenfiwu0axx59h
“Which has nothing to do with the GE, the GPE or any of the other examples discussed in which the body is being continuously supplied with energy at a constant rate…”
Of course it has everything to do with it. The funny thing is, you “people” have redefined “equilibrium” such that it only applies in a situation where there is no heat source present (you have decided that in any situation with a heat source, it’s always a steady state problem)! However, in any situation without a heat source (that continuous energy supply you refer to), any object or group of objects would drop in temperature to absolute zero. I guess you could call that “equilibrium”, but it’s a bit of a dumb way to look at it. Well, worse than dumb.
In most problems there is more than one heat source. With the GPE, there’s only the one. Which is why the answer is so clear and simple. 244 K…244 K, or 244 K…244 K…244 K, depending on which version of it you’re discussing.
Equilibrium has nothing to do with the problems being discussed at great length.
That’s one of the reasons you keep getting the wrong answers.
…because you’ve all been busy trying to redefine what it means, ever since the original GPE came out. You try to pretend that their should be a thermal gradient between the objects! You try to pretend that hot won’t heat cold until that gradient is gone.
DRsEMT, Of course, without a source of energy, the insulated body would eventually cool to the temperature of it’s surroundings, though not 0 K, since even deep space has cosmic background radiation.
But, your red herring has never been the focus of our discussions of the GHE or the GPE model(s), all of which experience an energy input. Your quibble about transient vs. steady state is reminiscent of Joe P’s graphic with a rotating Earth in which one side is heated by sunlight while the other is cooling, for which there’s never a “steady state”. That model has nothing to do with the physics of the GPE models where there’s assumed to be little or no thermal mass and no variation in input power, thus steady state is achieved.
Further more, your continued refusal to understand what happens to a single body with and without insulation when it’s heated at a constant rate just shows that you are either totally ignorant or so wedded to an ideological construct that you can’t accept reality. Sort of like those who insist that the Good Book is absolute truth written by the Big Dog in the Sky, in spite of all evidence to the contrary.
We also see that you have also failed to understand/comment on the fact that the UAH product relies on the same physics as the CO2 GHE. You are a total hypocrite for accepting the satellite data while denying the physics of the GHE.
“DRsEMT, Of course, without a source of energy, the insulated body would eventually cool to the temperature of it’s surroundings, though not 0 K, since even deep space has cosmic background radiation.”
Fine, nitpick and call it 3 K if you wish.
“But, your red herring has never been the focus of our discussions of the GHE or the GPE model(s), all of which experience an energy input.”
“Equilibrium” still applies with discussions involving an energy input. Obviously! The rest of your second paragraph is an attempt to change the subject.
Your third paragraph is just empty trash talk.
Your fourth and final paragraph continues the same sort of fallacious logic as bdgwx’s comment.
How long can DREMT continue with this nonsense? That is the question see –
https://i.kym-cdn.com/photos/images/original/000/540/685/b1d.png
I mean really. Steady rate does not mean thermal equilibrium!
DREMT write it on the blackboard ad-infinitum or until it is understood,
When there is energy continually entering a system thermal equilibrium is only going to happen under some limited conditions i .e. each object is identical and receives the same energy input and therefore reaches the same temperature.
This was discussed here for the simplest possible case of 2 identical plates.
http://www.drroyspencer.com/2019/12/uah-global-temperature-update-for-november-2019-0-55-deg-c/#comment-416799
This is in distinction to all the cases looked at here previously where only 1 plate has received the energy and the others have not.
Previously you chose to ignore my comment as it was clearly too hard . Are you going to address this now or just ignore or divert, as per usual?
Maybe the dead horse is going to resurrect itself and go on a Gish Gallop.
“When there is energy continually entering a system…”
When is there not?
You tell me. In all the cases discussed here, there is energy entering the system. Therefore, without all the objects being identical and receiving the same energy they are not in thermal equilibrium and not at the same temperature. QED.
Yes, we have already established that you lot have tried to redefine “equilibrium” such that it only applies when there is no heat source present.
No, I repeat, this time with feeling. There are some cases (see above) where there js energy entering the system and where there is a possibility of thermal equilibrium.
This just happens not be one of those cases.
OK, Mike.
I am glad we eventually got there but as usual it’s been excruciating.
Oh, I was just acknowledging receipt of your comment. It appears you think equilibrium is only possible with no heat source, or if every object involved is a heat source of the same magnitude.
My mistake for not mentioning that your silly redefinition of “equilibrium” has been updated. I do apologize for my error.
Or each object is receiving the same amount of energy (such as zero). Then we can obtain thermal equilibrium between two objects without redefining the term.
To finally put this to bed, I think we need to put this in simple enough terms for DREMT to understand.
Let’s take for argument same two identical idiots, for simplicity labelled g* and h*ff. They are both feeling blue after being banned and decide to stand out in the sun togethor absorbing the same amount of radiation ( say 400 W). They are dressed identically . They are at the same temperature and therefore are in thermal equilibrium with each other.
H*ff then decides he cannot stand the heat and walks into the shade of g* and no longer receives radiation directly and turns green.
The ultimate question for DREMT is the following.
Are g*, who is standing in the sun, and h*ff,who is standing in the shade, at the same temperature?
Disregard the complications of homeostasis or, if you can’t disregard this, make the idiots simply the representations of inanimate objects.
DREMT your services may be required for the 3 idiot problem.
Unfortunately, for the idiot who wrote this silliness, he has now realised that shielding an object from a source of heat results in a lower, not higher, temperature. More work needed?
DrsEMT, let’s get back to your previous comment:
And later, you wrote:
In a vacuum, there’s only one way for the energy supplied to the heated plate to exit, that’s thermal radiation. In the case of three plates, each being ideal black bodies, the middle Blue one is heated with 400 watts, thus the two outside Green ones must radiate 200 watts toward the outside. But, the two Green plates also will radiate 200 watts toward the Blue plate.
So, do try to tell us what happens to that 200 watts radiating toward the Blue plate. The First Law says that energy is conserved, which is to say, that thermal radiation must be absorbed by the Blue plate. Thus, eventually, the Blue plate will receive 400 + 2 * 200 = 800 watts of power. As a consequence, the Blue plate will then be radiating 400 watts toward each Green plate, which matches the rate of energy leaving both sides of each Green plate.
You have refused to provide an explanation to counter this mathematical calculation, except to assert that the temperatures of the plates will be identical, which is impossible, given the required radiation power.
And then you could use the Seebeck effect to generate electricity from the temperature difference? Perpetual motion? I don’t think so. Try again.
Sorry, I forgot the full extent of the silliness of their redefinition of “equilibrium”.
They think equilibrium is only possible if there is no heat source, or if every there are two heat sources. One, three, or any other number, and “equilibrium” is not possible, according to their “logic”.
DREMT. The definition of thermal equilibrium at an appropriate level for you can be found here
https://www.grc.nasa.gov/www/k-12/airplane/thermo0.html
Without redefining the term we can obtain thermal equilibrium by
1. having no external temperature entering the system and waiting until the objects equilibrate
or
2. For cases where energy is entering the system we would require the system to consist of two identical objects receiving the same amount of energy . Both objects would consequently be at the same temperature.
Again, DREMT can rest easy, for either of these two cases there is no change in the definition that “two objects are in thermal equilibrium when they have the same temperature” and vice versa.
Interestingly for more than two identical objects (and less than an infinite number of identical objects) then they cannot be in thermal equilibrium while they are receiving exactly the same amount of radiation. If an explanation is required then I can elaborate further but that might be an intellectual bridge too far for Cynical and DREMT.
Cynical got very confused above, For the two idiot problem with one idiot g* exposed to the sun and the other identical idiot h*ff in the full shade of g*.
What would result?
Would they (a) be in thermal equilibrium with each other and idiot h*ff would have the same temperature as idiot g*
or alternatively
(b) h*ff would be warmer than g*
or
(c) h*ff would be cooler than g* ?
Assume steady state and either no homeostasis for the idiots or alternatively the idiot labels represent inanimate objects.
So Cynical have another go and give us your a,b or c answer to the riddle.
Similarly DREMT should have a go and demonstrate the courage of his convictions. However, I expect DREMT to go into full evasion mode, but you never know.
See? That genuinely is their redefinition!
☺️
Cynical suggests that it would be possible to produce enough power from the Blue plate in the 3 plate model to create a perpetual motion device via the Seebeck effect, commonly known as a thermo electric generator. That would require a generator with efficiency greater than 100%, whereas such devices operate at much lower efficiencies, typically less 10%, and that’s with large temperature differences.
In addition, any energy transfer between the Blue plate to the Green plate(s) would reduce that available from the generator, increasing the temperature of the “cold” junction. It’s obvious that the maximum power from the generator would be achieved without the Green plates and even then, there’s not enough power produced to replace that originally supplied to the Blue plate.
“So, do try to tell us what happens to that 200 watts radiating toward the Blue plate.”
The simplest answer is: “whatever you need to think in order to understand that it doesn’t raise the temperature of the blue”. As you know perfectly well, a more detailed explanation has been given at varying levels of complexity already, by various commenters.
“whatever you need to think in order to understand that it doesn’t raise the temperature of the blue”
Fails 2LOT then as blue plate dQ/T is not positive thus no blue plate entropy increase in any real process described. DREMT remains and will remain incompetent in this field.
https://www.drroyspencer.com/2019/03/uah-global-temperature-update-for-february-2019-0-36-deg-c/#comment-345722
One thing you can always be sure of is that DREMT will always fail to rise to a challenge. Likewise for Cynical.
When directly confronted with a choice, as predicted DREMT went the evasion route and ran away as fast as his little legs could carry him.
As I am so kindly disposed to both DREMT and Cynical, I am offering them both another opportunity.
Is it a,b or c with respect to the above two idiot problem?
MikeR has regressed way back to the original 2-plate GPE problem, and the hilarious “shade” arguments. He’s so 2017.
DREMT, I didn’t know that the statute of limitations on logic expired in 2017. Thank you for that information.
I also note that you did not comment referring to the 2 plates back in 2017, unless you were using a previous persona.
So this is your fin de decade chance (never to be repeated more than 1000 times) to demonstrate your superior intellect and put us all in our places.
So is it a,b or c?
p.s. which evasive maneuver will he try? Will it just be one of the his 7 ( he gets two extra because of the of the extent of his pathetic failures) stages of grief outlined here.
http://www.drroyspencer.com/2019/12/uah-global-temperature-update-for-november-2019-0-55-deg-c/#comment-416829.
I wasn’t commenting back in 2013, either, but it’s easy to go back and read. It’s all still there.
Which response would you prefer?
a) How come the green plate is no longer in the “shade” of the heat source if you press it directly against the blue?
b) Is a thin, perfectly-conducting BB plate placed near another identical object, with no radiative losses past the edges, in a vacuum, any way analogous to the sort of objects that provide us “shade” in real life?
c) Why would putting an object in the “shade” of another object make the latter object warmer?
Warning, warning , Will Robinson. The human pinata has gone on a Gish Gallop and introduced his own questions of marginal relevance. He, of course, refuses to answer my a, b or c questions.
Stumpy wants me to follow him down his rabbit hole with his own list, which I will be happy to do, once he stops evading.
So on this occasion, he has gone no 1 on his standard list below . Thank the Lord he has not gone straight to number 7.
“DREMT when he cannot cope with a science based argument enters the 7 stages of grief below. None of them includes acceptance.
1. evasions
2. Recursive links
3. simple repetition
4. see 1.
5. see 2.
6. see 3
7. finally goes full Troll mode with a barrage of PSTs.”
Poor Mike.
☹️
The human pinata is still swinging in the breeze. Unable to answer the simple two idiot problem.
Perhaps too difficult.
It’s rude to refer to Snape that way.
No DREMT you are mistaken. There is only one pinata hanging on by his appendage. Snape has a full set of limbs and a functioning cerebral cortex.
Anyway, rather then avoiding, why don’t you at least try and answer the two idiot problem. I am sure you can do it if you think hard enough.
Is it a,b or c?
Oh, you must be referring to yourself again.
So Mike, a), b) or c)?
Stop evading.
DREMT,
A single Pinata are usually surrounded by hordes of tormentors. You are on your lonesome since Toto has fled, and you are just a torso hanging in the wind, then the reference was definitely to you.
But with reference to the two idiot problem, I would go for (c). The idiot in the shade is cooler than the idiot in the sun.
Do you agree ,or is your view that the two idiots are (a) in thermal equilibrium or (b) the idiot in the shade is warmer than the idiot in the sun?
DREMT, it’s now over to you for your answer to the two idiot problem. You have run out of excuses.
So you went for:
c) Why would putting an object in the “shade” of another object make the latter object warmer?
DREMT,
I made it clear above that I would be extremely happy to answer your question once you have indicated a preference for a,b or c to the two idiot problem.
I know you are struggling with this problem. Maybe Joe can help you out.
It’s OK, I’ll answer for you:
c) Why would putting an object in the “shade” of another object make the latter object warmer?
Answer: it wouldn’t.
DREMT, You chose to answer your own version of (c) which predictably was wrong* .
So in order to avoid running around in circles continuously **, can you attempt an answer to the actual question that was originally posed as,
In your view are the two idiots with one in the sun and the other big the shade
(a) in thermal equilibrium and therefore at the same temperature or
(b) the idiot in the shade is warmer than the idiot in the sun or
(c). The idiot in the shade is cooler than the idiot in the sun?
It is easy as abc.
* for a prolonged discussion, see every exchange between g*/h*ff/DREMT/Joe and almost everyone else since October 2017.
** see *.
“DREMT, You chose to answer your own version of (c) which predictably was wrong*”
☺️
All sorts of things wont work with DREMT’s bizarre idea of ‘equilibrium’.
No point for anyone to own ovens, toasters, toaster-ovens, crock-pots, coffee pots…
How can any of these maintain a temperature gradient with the kitchen?
Warm blooded animals cannot exist because they cannot stay above ambient temperature.
The skiing industry should fail because winter coats cannot keep people warm enough for a day of skiing.
Now we’ve got things in the sun no warmer than things in the shade?
His brainwashing on ‘equilibrium’ has clearly burned out his common-sense circuits.
On the positive side, they invented a heater that is not hot.
I guess making stuff up is easier for you guys than arguing against what’s actually being said.
Dr Roys Emergency Moderation Team says:
Your green plates are losing 400 W/m^2, but are heated by the blue plate of the same temperature.
So you have a heater that is not hot.
The perfect home appliance.
I guess making stuff up about heat transfer is easier if it doesn’t need to work in the real world.
Feel free to amend your theory of ‘equilibrium’ to allow the real world to work as we all know it does.
The following diagrams should help DREMT to understand the difference between Thermal Equilibrium and Steady State Solutions in particular for the idiots/plates example.
https://i.postimg.cc/dVMKvSyW/Diference-Thermal-Equilibrium-and-Steady-State-single-plate.jpg
https://i.postimg.cc/GpdwT8zG/Difference-Thermal-Equilibrium-and-Steady-State-Two-Plates.jpg
Again, I have made it sufficiently clear that even the average idiot would understand. As Snape rightly pointed out this assumption does not cover a brain dead troll who will invariably repeat the same garbage via such gems as,
1.A cold object cannot heat a warmer body by either insulation and/or back radiation .
2.I/We are redefining thermal equilibrium. He is the only one who understands it.
3.Joe told me it aint so.
I have never stated that there can be no thermal gradients in nature. All I said was that heat flows from hot to cold to remove thermal gradients wherever possible. There are plenty of situations in real life where that is not possible. A radiator can’t heat the air in the room to be the same temperature as the metal of the radiator’s surface, for example.
In the idealized scenario of the GPE thought experiment, the blue plate can heat the green plates until they’re the same temperature.
“wherever possible” is meaningless.
Not applicable to any discussed cases.
Not with a coat.
Not for a goat.
Not with the plates.
Not sun v shade.
Not for ANY case with a steady source of heat.
DREMT, taking you back one step.
After viewing this depiction,
https://i.postimg.cc/GpdwT8zG/Difference-Thermal-Equilibrium-and-Steady-State-Two-Plates.jpg
How do you possibly justify your statement,
“In the idealized scenario of the GPE thought experiment, the blue plate can heat the green plates until theyre the same temperature.” ?
For once DREMT, why don’t you gain some respect and answer directly instead of running away?
☺️
DREMT, so you chose to run, instead of replying. Was showing some courage one of your New Year’s resolutions?
Epic fail. Maybe next year?
Huh?
Playing dumb is the new tactic for DREMT. He is very convincing at that role.
Grinning idiot emoji also suits him very well.
DREMT always has something to say.
If he had an answer that made any sense and could support his case he would give it.
Instead he evades.
He has no sensible answer and he knows it.
“Grinning idiot emoji…”
It’s the sun, stupid!
🤩
Dr Evil’s Mutant Troll’s only intellectual responses now are via argumentum ad emoji.
Ok to try and get the grinning idiot to respond, I have made it very, very,very easy.
IQ test for grinning idiots.
Firstly for two identical objects (idiots, plates, whatever) , in the same environment, receiving identical amounts of radiation for the same duration. Are they at the same temperature?
If you can answer that, then proceed to the advanced question below.
If one object has a different amount of radiation incident than the other. Are they still at the same temperature.?
Possible answer are, yes, no or I have no idea.
DREMT make a choice. Go on, dare you to.
To assist you here is some light reading.
https://www.patheos.com/blogs/crossexamined/2015/02/the-dunning-kruger-effect-are-the-stupid-too-stupid-to-realize-theyre-stupid/
“My best guess uses the Green Plate Effect as an example. Every additional layer of insulation should make the outermost layer, the one facing the sun, a little hotter.”
☺️
DREMT,
So your marginally relevant response is is a reference to multilayer insulation and not a direct answer to the question posed which is.
Part 1. For two identical objects (idiots, plates, whatever) , in the same environment, receiving identical amounts of radiation for the same duration. Are they at the same temperature?
If I can get a response such as a simple yes or no, from DREMT then we can move on to Part 2.
How will DREMT evade directly answering?
Let me count the ways (currently 15 evasions for the abc question and 5 for the two idiot problem),
You were bettered, and will be eternally silent.
DREMT, a belated Happy New Year and welcome back.
By the way, after having 3 weeks to consider, do you have an answer to the question I posed? i.e. the one directly above your latest response.
He actually responded.
Who is this third person “he”, you speaketh of?
She’s still responding.
I am glad the entire team including Cousin Itt, is working on the solution.
Let me know when you get there.
It must be very bored and bitter.
I defer to your expertise in these matters.
To return to the topic, how are you and the rest of the team doing with the challenging question I posed?
Do you need another month?
Poor old Third. So very bored and bitter.
Yes, Dick deterred was very bitter. Donald may not be as boring but is definitely deturd.
Another one went over his head.
@Adelaida
Thanks for the kind words!
This blog is like a large, dysfunctional family. Comment at your own risk.
Snape says:
“This blog is like a large, dysfunctional family.”
That’s right, and please do not trust any blog, read their scientific sources, or as Norman would say: text book science.
Trust reality, friends, family, our human experience, justice, truth, integrity and honesty.
DREMT,
I know of a good counsellor you should see.
Well, you’ve seen them all, so I don’t doubt it.
@EM, Norman
[This additional precipitation is sustained by more energy leaving the surface by evaporation that is, in the form of latent heat flux and thereby offsets much of the increase in longwave flux to the surface.]
Worth noting that the increase in longwave flux to the surface could not have been offset by an increase in upwelling IR.
The latter is determined by temperature, so they would have had to claim the global mean is higher than observed.
I can’t get a more complex answer accepted.
Look at the numbers in Figure 1b and you can see that the extra evaporation is matched by increased downward radiation, leaving the overall balance unchanged.
Ok. I only read the abstract so I probably shouldnt have said anything.
But you did, anyway.
Shape
To the contrary, you and Norman were right. CMIP5 used a low value for evaporation which underestimated the amount of energy flowing round what one might call the latent heat loop.
They got the amount of surface LW emission, and hence the surface temperature spot on.
Here is more info from Hausfather regarding model skill from 1880 to 2019. Clearly models have excellent skill in simulating the global mean surface temperature over the 140 year period of record.
https://tinyurl.com/ulcn6tt
“CMIP6 models do not do a particularly good job simulating more-modest early 20th century warming observed from 1900-1940, . . .” This is your definition of excellent? Can’t even get the past right!
It seems that there are two parallel universes: the natural universe which is also that of common people and the universe of yuppies. The models reasonably reproduce these two universes. You just have to adapt the settings.
https://zupimages.net/up/19/52/a9ex.png
What does tree ring proxy data have to do with CMIP model performance?
What a strange question!
Do you think there is no connection between the models and the real world?
Of course there are connections between models and the real world. That is not relevant to what I’m asking though. What am I asking is…what do you think is the connection between Briffa 1998 and CMIP model skill? And what is your point in posting that image?
The Briffa 1998 MXDs is a very good temperature proxy not biased by anthropogenic disturbances. In addition, this proxy is consistent with the rate of sea level rise and with glacier melt data (consistency which does not exist with station temperatures).
The graph shows that models reproduce the surface temperature reasonably well when they ignore the increase in CO2 level.
There is therefore a problem with the quantitative theory of the greenhouse effect.
I happen to agree that tree ring analysis does make for a good temperature proxy. That doesn’t mean it should be preferred over the instrumental temperature record for model comparisons. Also, I’m not sure this graph is showing what you think it does anyway. Can you post a link to the publication or blog where it originated?
For the background: IPCC TAR
Briffa 1998 : http://www.burtonsys.com/FOIA/0939154709.txt
Forests as glaciers and oceans are relatively unaffected by anthropogenic biases.
Is it this article that they are talking about?
“Reduced sensitivity of recent tree-growth to temperature at high northern latitudes”
https://www.nature.com/articles/35596
From the summary:
“The cause of this increasing insensitivity of wood density to temperature changes is not known…”
The title :
“Reduced sensitivity of recent tree-growth to temperature at high northern latitudes”
is therefore at best hypothetical.
And in fact wrong:
https://zupimages.net/up/19/48/soa3.png
Yes, tree growth has been unable to keep up with the temperature increase.
Well, no. That is just your unsubstantiated opinion and it is false as I have shown you. Look at reality and not at your decaying ideology.
phi,
Briffa’s data isn’t in question here.
What I’m challenging is the assertion that tree ring derived temperatures should be preferred over instrumental derived temperatures for objective skill metrics of CMIP model performance. There are two primary reasons why I challenge this. First, the former is not as accurate. Second, the divergence problem renders the data useless after WWII.
I’d also like more background on the image itself. Specifically, what is “model” in the image? I ask because it doesn’t look anything like the CMIP model outputs.
My detailed answer does not pass moderation.
It does not matter. I believe I have already answered above.
For the graph, it is IPCC TAR, natural forcings only.
You will find similar graphics in AR4 and AR5.
Don’t believe in unproven things like “the divergence problem renders the data useless after WWII”
Let me get this straight. You don’t believe there is a divergence between tree ring derived temperatures and actual temperatures after WWII?
Furthermore, models ran without anthroprogenic forcing also diverge from observed temperatures. In other words, models that ignore CO2 forcing (plus other forcing) are the opposite of “reasonably well” in terms of their skill according to your graph.
Do you believe your graph or not?
“You don’t believe there is a divergence between tree ring derived temperatures and actual temperatures after WWII?”
Exactly.
What do you know about actual temperatures?
You may not be aware that temperature indices are not averages of measured temperatures but are constructed on the basis of short-term trends, that these indices diverge strongly from the averages measured températures in cases where comparison are possible.
And I repeat : Briffa 1998 is consistent with the rate of sea level rise and with glacier melt data. Global temperature indices are not consistent with any independent observations.
“models ran without anthroprogenic forcing also diverge from observed temperatures”
No ! Not with observed temperatures !!!
Your graph labels the red line as “observation”.
Even Briffa acknowledges that the divergence problem is real and even warns against drawing conclusions during the divergence period.
We have multiple datasets that all confirm that the planet warmed from 1850 to present. This includes the hydrosphere, troposphere, cryosphere, land, etc. By hanging your hat on tree ring analysis and only that you are ignoring the divergence problem, cryosphere declines, a mountain of instrumental temperature data, and even Briffa, Mann, and other tree proxy pioneers themselves.
“Your graph labels the red line as observation.”
Is not an argument.
“Even Briffa acknowledge…”
So what ? Briffa demonstrated something? No !!!
He has a purely ideological discourse.
“We have multiple datasets that all confirm that the planet warmed from 1850 to present.”
Yes, of course, so what? This is not the issue.
Briffa 1998 also shows a warming since 1850 and a warming consistent with all the other observations:
https://zupimages.net/up/19/47/ilvv.png
What I challenge you to find is observation data compatible with station indices.
Using Briffa 98 the warming trend from 1850 is -0.002C/decade and from 1945 is -0.061C/decade.
Because Briffa 1998 ends in a particularly cold period but you can see a steady warming trend, in fact since the XVIIth (about +0.15 ° C per century):
https://zupimages.net/up/19/51/xr18.png
That’s not a cool period. That’s an manifestation of the divergence problem.
Repeating nonsense doesn’t make it smarter.
Your problem is that you invent, or take up unfounded speeches.
Your statement is completely unsupported.
The years 1960 to 1990 were generally cold, very cold.
Fear of a new glaciation haunted the media.
A large number of glaciers began to advance again.
The rate of sea level rise returned to the values of the beginning of the 20th century.
None of this can be explained with the fraudulent temperature indices.
Nothing can force you to be rational either.
The warming trend from 1960 to 1990 is +0.10C/decade according to BEST and supported by a half dozen other surface station temperature indices and many reanalysis datasets and which is consistent with the partially overlapping satellite datasets as well.
A new glaciation may have been on the minds of the media but not so much for scientists. https://tinyurl.com/t3u7s3a
I base my position on the abundance of evidence. I do not myopically focus on a single cherry-picked source and draw conclusions from it despite the sources cautionary warning about doing so or invoke unsubstantiated claims of fraud or conspiracy against lines of evidence that are contradictory to my position.
You refuse to face reality.
…
1. From 1979 to 2019 BEST is at 0.2 C per decade and UAH 6 at 0.15 C per decade which, taking into account the tropospheric amplification visible at high frequency, should correspond to a surface trend of approximately 0.1 C per decade. There is therefore an inconsistency between the two.
…
…
2. BEST, GHCN, Had C R U T, etc. all use methods based on the conservation of short-term trends. These methods are invalid and are already criticized in Hansen et al. 2001.
“I base my position on the abundance of evidence.”
No, you are not putting forward any evidence, you are just blindly trusting indices constructed using invalid methods.
You did not find any observations compatible with these indices. Considering the supposed exceptional warming, this should however be of disconcerting ease.
Can you link to that Hansen publication? I want to review it before I comment on that point.
Yes. We know there are differences between UAH and BEST. There are differences between all datasets. Notice how much difference there is between Briffa and everything else especially during the divergence period.
It sounds like we differ on one main point. You think the planet has been cooling since WWII. I think the planet has been warming. Your position is based entirely on a single line of evidence of which the source even disagrees with you. I base my position on at least a dozen lines of evidence. My lines of evidence are instrumental global temperature indices. Yours is a tree ring density proxy temperature only for the NH. It isn’t even a global index. And I’m the one who isn’t facing reality?
bdgwx, google string: Hansen 2001
The paper comes up third on the list when I googled. The paper does not do what phi claims “These methods are invalid and are already criticized in Hansen et al. 2001.” Even when phi claims to have read something, confirmation bias doesn’t allow for phi’s comprehension.
A closer look at United States and global surface temperature, Hansen et al. 2001.
“Notice how much difference there is between Briffa and everything else especially during the divergence period.”
No, precisely and as I have already told you, there is no divergence between Briffa 1998 and glaciers melting, no divergence with the rate of sea level rise, no known divergence with any physical quantity responding to temperature.
“You think the planet has been cooling since WWII.”
There was a cold period followed by rapid warming. We are now probably at a level close to that of the 1930s and 1940s. At least that is what says the observations I have cited.
“Your position is based entirely on a single line of evidence…”
So no !
“I base my position on at least a dozen lines of evidence.”
No. You only have the argument of temperature indices which are not independent because they are constructed according to similar and invalid methodologies.
“And Im the one who isnt facing reality?”
Yes, very clearly.
Ball4,
It follows that a necessary concomitant of discontinuity adjustments is an adequate correction for urban
warming. Otherwise, if the discontinuities in the temperature record have a predominance of downward jumps over
upward jumps, the adjustments may introduce a false warming, as in Figure 1.
Ball4 says:
“The paper comes up third on the list when I googled.”
Google tries to give people what they want, so for phi it will be a long list of conspiracy theories.
Hansen is not saying that global temperature indices are invalid. He is just pointing out one possible source of error that needs to be considered. And it’s a good thing our instrumental temperature indices are valid because dendrochronology is dependent upon it for the calibration and verification steps.
Furthermore, sea level rise and cyrosphere mass trends are not consistent with Briffa 98 during the divergence period anyway. Remember, sea level has been rising and global cryosphere mass has been declining. And if anything both of these may have even accelerated in recent decades. If the planet had a negative energy imbalance and was cooling you would expect at least flat trends and more likely even opposite trends than what is actually observed.
bdgwx,
You are far too vague in your argumentation.
I did not say that Hansen invalidated anything but that he had already criticized a particular method. This particular method (conservation of short-term trends) is today the only method used for the construction of indices. In addition, the cooling jumps predominate overwhelmingly in raw series and their correction is not compensated. So these methods are invalid and seriously overestimate the warming trend.
“dendrochronology is dependent upon it for the calibration and verification steps.”
No, if the calibration is done correctly, only the detrended series are used.
“Furthermore, sea level rise and cyrosphere mass trends are not consistent with Briffa 98 during the divergence period anyway.”
False, very false.
“Remember, sea level has been rising and global cryosphere mass has been declining.”
So what ? During the cold period, the rate of sea level rise was low and a large number of glaciers advanced.
“And if anything both of these may have even accelerated in recent decades.”
Yes, since the 1990s with rising temperatures. I don’t see what you’re looking for here.
Be more specific.
Svante,
Try to be a good Downshifter and don’t pollute to say nothing.
phi’s 11:12am “methods are invalid” confirmation bias is confirmed & exposed leaving out Hansen 2001 context “we find evidence for an urban warming effect. However, the effect is rather small…We discuss this issue after presenting the data.”
Ball4,
We are talking about a method and its validity. Do you have something to say about it?
The methods used to gather and analyze GHCN, UAH temperature series are valid, can be improved, and are useful as explained in Hansen 2001 & more recent papers.
Ball4,
So you have nothing to say. I suspected it.
There is 140 years in the record. You’d expect 7 excursions outside the 95% confidence envelop. There were 6 so that’s pretty good. It is interesting that all of them occurred prior to 1930. Was this due to poor model physics or poor model inputs? Also, CMIP6 predicted a warming trend of 0.07C/decade and 0.07C/decade was observed. However, from 1970 CMIP6 predicted 0.23C/decade but only 0.19C/decade was observed.
“Was this due to poor model physics or poor model inputs?” I asked this before. You still have no answer, do you? Just more evasive nonsense.
[To finally put this to bed, I think we need to put this in simple enough terms for DREMT to understand.]
******
I cant decide who is more delusional – Huffy, with his nutty idea, or MikeR for thinking this will finally be put to bed. The eternal optimist!
Yes Snape, I am an incurable optimist and I know DREMT is never going to admit defeat. That’s a given, as it’s not in the nature of the beast.
I know the best we can do is regard DREMT as a chronic condition which needs periodic treatment. A bit like a bad case of hemorrhoids but without the attendent charm.
DREMT has a very powerful Morton’s Demon.
http://www.talkorigins.org/origins/postmonth/feb02.html
When somebody like DREMT resorts to this plea to Dr Roy, you know they are in need of help:
“Fucking wake up. There is no “greenhouse effect”. There is simply a relentless, malevolent force acting against humanity in every way that it can. You are letting it happen.”
We must take pity on them and urge them to seek help.
Meaningless trolling psychobabble, anyone?
Some simple logic shows this for what it is:
1) If they genuinely thought I had psychological problems, the team effort to ridicule me for having them would suggest a quite malevolent group of personalities at work.
2) If they don’t think I have psychological problems, then the team effort to try to suggest I have in order to distract from the arguments being made, would suggest a quite malevolent group of personalities at work.
DREMT,
I can only speak for myself. Rather than name calling your opponents malevolent, perhaps you could consider your own role in this. Your foul mouthed abuse didn’t exactly endear you to myself and I suspect others.
You have been given many, many opportunities to avoid ridicule (exit ramps etc.) but you have continued on in the same vein. Perhaps you have some masochistic tendencies.
I have suggested mindfulness and the Calm App to assist you with your anger management but your other issues probably require some “one to one” management. Try it and you will never look back . Your relationships with others can only improve.
☺️
I tell you what, Mike: you stop displaying malevolence, and I will stop accurately describing you as “malevolent”. Deal?
DREMT, I would be terribly disappointed to be called malevolent by someone whose opinion I respect.
In your case please go right ahead.
However, if you now actually want to make a deal, which is a contrast to your previous rejectionist stance, then some further behaviour modifications may be needed.
I have many suggestions, but let’s try and get the deal done and worry about the details later.
No deal.
Even dumber than I thought.
Don’t be so hard on yourself.
Yes I can be hard on myself. You should try it.
A little bit of introspection might make you think twice about the stupidity of rejecting the deal of the decade (so far).
Silence, child.
DREMT, you finally have come up for some air.
Welcome back. Lately things have been remarkably pleasant around here so let’s try and start the new year on a better note than the last one finished.
No GPE, no GHE.
While you are at it, no collusion and no quid pro quo.
Words.
As per usual, words fail you.
Spoken.
Words spoken in haste. Not much chance of that happening at the moment.
Softly
Ucciderti lentamente.
Can.
We don’t think you are insane, DREMT.
We do think that you have a personality trait which makes you unpersuadable.
There is a very vocal, yet specific, group of you who won’t let this lie.
You blame that on me. The fact is, it would be much easier for all of you to ignore me, than it would be for me to ignore all of you. Again, simple logic.
You constantly try to use weight of numbers to your advantage. It’s all about that groupthink. “Come on, everybody reading”, you seem to say, “this guy’s on his own, or maybe one or two people agree, vs. all of us! We must be right that 2+2=5! You wouldn’t want to get treated the same way we treat him, would you!? Of course not! Think the same as us. Join us…join us…”
The personality trait I referred to was Morton’s Demon, the tendency to reject anything which disagrees with your beliefs.
We don’t expect to persuade you, but there will be lurkers out there with more flexibility.
Your personality type is remarkably common in Northern Ireland. Many Free Presbyterians are young Earth creationists who believe that the universe is 6023 years old and who reject any evidence to the contrary. One of them once told me “My mind is made up. Do not confuse me with facts”.
See? It’s always about the “we”…
Wee?
Now you’re taking the piss.
It’s about how you get a net energy flow of 400 W from blue to green without any temperature difference.
See, JD was right. Clowns can be funny.
Of course, this “numbers game” that you clowns like to play all falls apart when people read through the comments at a blog where the numbers of people arguing on each “side” are more similar.
https://climateofsophistry.com/2013/03/08/the-fraud-of-the-aghe-part-11-quantum-mechanics-the-sheer-stupidity-of-ghe-science-on-wuwt/
I see that you have a kindred spirit in Joe Postma. He has a similar problem with rejection of reality.
Yes, he is also amused that you clowns reject it. As are many, many people in the comments under that article. Which discuss at great length something very similar to the GPE, nearly seven years ago now.
Yes very “more” similar; commenters do have to play the fool to all similarly get thru moderation at a sophistry blog.
https://en.wikipedia.org/wiki/Grandiose_delusions#/media/File:Cat_and_lion_in_mirror_illustration.svg
https://climateofsophistry.com/2013/05/27/the-fraud-of-the-aghe-part-12-how-to-lie-with-math/
That link doesn’t address our case.
Eq. {5} has only one object, so it’s the case without green plates.
dTobj/dt = 1/τ * (Qin – σ(Tobj)^4)
We only discuss the zero derivative, so we get Tobj = 244 K, that’s fine.
The substitution in Eq. {6} is bogus because Qin is heat, net energy, but Thot^4 is gross output energy.
Comments anyone?
☺️
Yep, the quote-bot quotes an equation, is unaware of the context it applies to, thinks it applies to plates, and it doesnt.
“Tobj = q / (m*Cp) Eq. {3}
where “q” (different from big Q; but see ahead) is just the internally held total thermal energy content of an object of mass m, with thermal capacity “Cp“, at temperature “Tobj“.
To know how the temperature changes as a function of a change in the internal energy, we take the differential with respect to time:
dTobj/dt = 1/τ * dq/dt Eq. {4}
where τ = m*Cp for convenience. Now, in terms of energy input and output and the first law of thermodynamics, the temperature will change when the time-derivative of q, dq/dt, which is the total rate at which energy is entering or leaving the system, is non-zero. To follow the unit convention above from Equations 1 & 2, where big “Q” is a rate of heat transfer, then dq/dt = Q. Q now represents the sum of independent and dependent energy inputs and outputs, and so can actually be composed of multiple terms – two terms if there is an input and output.
In terms of radiation, the energy output from the surface of the object is σ(Tobj)4, and so that is the output term of Q which is dependent on the object’s current temperature. That leaves an input term for Q which can be an independent parameter which doesn’t depend on any other terms in the equation. Changing the notation a little bit, Q can now just represent the independent input, while σ(Tobj)4 represents the dependent output. So this gives us
dTobj/dt = 1/τ * (Qin – σ(Tobj)4) Eq. {5}
which is a non-linear differential equation. The input term is positive because it will serve to increase the temperature, while the output term is negative because output provides cooling. This is the only way in which you can speak of fixing an independent variable labelled “Q”; it works here because Q is a true independent variable which does not actually depend on the other terms in the equation.
To make this loook similar to our initial setup, if Tobj refers to a passive cold wall (Tcold), then Qin can refer to a hot wall with constant temperature, and then Qin = σ(Thot)4 leaving
dTcold/dt = σ/τ * ((Thot)4 – (Tcold)4) Eq. {6}
When the temperature of the cold wall increases, then all that happens is that the rate of increase of temperature of the cold wall decreases, because the difference in temperature between the hot wall and cold wall becomes smaller. It is basically in this way that the condition of thermal equilibrium is achieved in nature. And note that an increasing temperature of the cold wall does not affect the temperature of the independent hot wall! Cold does not heat hot in real physics.”
“And note that an increasing temperature of the cold wall does not affect the temperature of the independent hot wall!”
An impossible process because there is no entropy production. This sentence alone demonstrates the incompetence of the author in this field.
What about the sentence in full context?
Doesn’t matter at all whatever is in the full context since the quoted sentence 10:19am demonstrates no entropy production in the “independent hot wall” in view thus is an impossible process.
Running an actual experiment will prove that out but I doubt a practicing sophist such as DREMT/Joe would ever want to do an actual proper experiment with reported replicable data.
Is this experiment not replicable?
https://principia-scientific.org/greenplate-effect-it-doesnt-happen/
As written in the link, that experiment shows there is no mechanism at play which would enable higher peak temperatures and the data shows that an increasing temperature of the cold wall does affect the temperature of the independent hot wall producing entropy in the real world.
Try again DREMT/Joe. Your struggling with the art of sophistry is apparent.
Show an experiment where increasing temperature of the cold wall does NOT affect the temperature of the independent hot wall, this one does not do so. All you can do is use sophist techniques but even then you struggle practicing the art of sophistry.
?
“increasing temperature of the cold wall does not affect the temperature of the independent hot wall!”
The context here is that ‘independent hot wall’ means its temperature is fixed.
If you understood this context, DREMT, you will understand that this not applicable to the blue plate.
But you dont.
Svante says:
DREMT, that quote doesn’t address our case.
Eq. {5} has only one object, so it’s the case without green plates.
Eq. {6} is equivalent, it is for a hot object that doesn’t see the cold object.
At the same time, the cold object sees all of the hot object because there is no view factor.
That’s a contradiction.
“group of you who won’t let this lie.”
Who posted a provocative link on the 20th, and getting no response, baited and goaded Svante for the next 4 days? You. Then when you finally got a response, you zestfully engaged.
Your dishonesty about this is glaring.
Wrong, Svante, but never mind.
Let’s break it down then, do you agree on the first point?
“Eq. {5} has only one object, so it’s the case without green plates.”
The plates are in full view of each other.
Then you can’t substitute Qin with Thot^4, because Qin is the T^4 difference of Thot and Tcold:
σ (Th^4 – Tc^4)
http://www.drroyspencer.com/2019/12/cmip5-model-atmospheric-warming-1979-2018-some-comparisons-to-observations/#comment-419648
☺️
Sorry, I thought you understood what you quoted.
You can use the RHTE to calculate net energy transfer.
Eq.{5} and {6} give you dT/dt.
So you can use the RHTE for the case with a fixed heat input plate. Great news!
Yes, you missed the point.
You can not do the substitution in {5} to {6} if the plates are, as you say, in full view of each other.
Svante…you can’t both use and not use the RHTE.
You missed the point again.
If you look carefully, eq. {5} and {6} are different to the RHTE. They produce results of different units for a start, K/s vs. W.
That’s right. He went step by step through a whole process for you. There were six steps in total.
Yeah, and it was pretty irrelevant for the GPE, since eq. {5} had only one object, and eq. {6} did not include input from the cold side.
Steps 1 – 6, altogether.
Dr Spencer “Finally, one should keep in mind that individual climate models still have their warming rates adjusted in a rather ad hoc fashion . . . ”
Who disagrees that the models are adjusted to achieve a desired outcome? Seems like fanatics trying to impose their opinions on reality. Does not work, according to Dr Spencer’s measurements.
Huffy asks:
c) Why would putting an object in the shade of another object make the latter object warmer?
[The principle behind MLI is radiation balance. To see why it works, start with a concrete example – imagine a square meter of a surface in outer space, held at a fixed temperature of 300 K, with an emissivity of 1, facing away from the sun or other heat sources. From the StefanBoltzmann law, this surface will radiate 460 W. Now imagine placing a thin (but opaque) layer 1 cm away from the plate, also with an emissivity of 1. This new layer will cool until it is radiating 230 W from each side, at which point everything is in balance. The new layer receives 460 W from the original plate. 230 W is radiated back to the original plate, and 230 W to space. The original surface still radiates 460 W, but gets 230 W back from the new layers, for a net loss of 230 W. So overall, the radiation losses from the surface have been reduced by half by adding the additional layer.]
https://en.wikipedia.org/wiki/Multi-layer_insulation
If MLI used black-body surfaces, or anything closer to black-body surfaces, it would still be marginally effective insulation in that it would take time for the heat from the sun to warm through each layer, protecting the inside of the spacecraft from the direct heat of the sun up to a certain amount of time, at least. Kind of like, in the inverse, how wearing your coat on a freezing cold winters day keeps you warmer, initially, but eventually you’re still going to get cold, until you go somewhere warmer or perhaps build a fire.
In practice, you will note that MLI actually uses reflective surfaces. As far away from black-body surfaces as they can get.
If DRsEMT had actually read Snape’s post cut from the WIKI article, it would be clear that the link initially referred to a material with emissivity equal to 1 using the same math as the GPE, but later moved on to the use of reflective layers.
In addition, the goal is often to keep the satellite from losing too much energy to the near zero effective temperature environment of deep space. To limit the solar gain, simply coating the satellite surface with a reflective layer would do the trick and a reflective MLI does that as well. And time is irrelevant, as the energy flows reach steady state rather quickly.
I have read it many times, and missed nothing.
DRsEMT appears to have a reading and math comprehension problem.
The equations given start with the basic 2 surface S-B physics, identical to that of the GPE model which DRsEMT continues to ignore. As described in those equations, the back radiation from the cooler body causes the insulation effect, reducing the energy loss from the warmer body.
I have read it many times, and missed nothing.
DRsEMT, Since you’ve studied the equations in the WIKI link on MLI, I presume that you have noticed the error(s) in the equations.
…almost as if he thinks the problem with the GPE has never been discussed before.
DRsEMT, You are arguing against NASA on this one, not just me. Are you claiming that the equations in the link are correct or trolling for fun and profit?
“My best guess uses the Green Plate Effect as an example. Every additional layer of insulation should make the outermost layer, the one facing the sun, a little hotter“
They won’t be making a lot of profit out of that.
But your heater that isn’t hot will be a real bestseller.
Just keep bashing those straw men.
Dr Roys Emergency Moderation Team says:
Your green plates are losing 400 W/m^2, but are heated by the blue plate of the same temperature.
So you have a heater that is not hot.
The perfect home appliance.
If it wasn’t for the blue plate heating the green plates, they wouldn’t be emitting anything.
There we agree on something.
Which formula gives you the net energy from blue to green?
Give it a rest, clown.
Well it’s the RHTE, isn’t it?
q = ε σ (Tblue^4 – Tgreen^4) A
For our blue/green plates, the area A is the same at:
a) the blue surface.
b) the green surface.
c) between the plates.
So how much net energy do you calculate at a/b/c?
I thought you were arguing upthread that you couldn’t use the RHTE for the plates.
http://www.drroyspencer.com/2019/12/cmip5-model-atmospheric-warming-1979-2018-some-comparisons-to-observations/#comment-419649
☺️
No, eq. {5} and {6} are for dT/dt.
See the place you linked.
So you can use the RHTE for the case with a fixed heat input plate. Great news!
Yes, so tell me:
For our blue/green plates, the area A is the same at:
a) the blue surface.
b) the green surface.
c) between the plates.
So how much net energy do you calculate at a/b/c?
I refer you to the previous 40,000 comment discussion.
I see, you will evade that one.
That’s right. I shall carefully avoid going through it with you for the 7000th time.
We know that DRsEMT, Joe-Postman, Huffingman, et al. have repeatedly refused to understand/accept the well proven facts and theoretical physics of MLI. I doubt that they will change their minds any time soon, since it would sink their basic
argument, which is that the GPE (and thus, the GHE) is a violation of the 2nd Law. Don’t forget that this denial started at least 12 years ago with the first of G&T’s “papers”…
And yet, as ever, DREMT has no answer for this demo of it working with a Black Body.
He simply throws out chaff.
Hilariously he thinks coats will not keep you warmer in winter!
I answered my own question, he has no common sense.
Not sure how skiing industry keeps going..
“If MLI used black-body surfaces, or anything closer to black-body surfaces, it would still be marginally effective insulation in that it would take time for the heat from the sun to warm through each layer, protecting the inside of the spacecraft from the direct heat of the sun up to a certain amount of time, at least. Kind of like, in the inverse, how wearing your coat on a freezing cold winters day keeps you warmer, initially, but eventually you’re still going to get cold, until you go somewhere warmer or perhaps build a fire.
In practice, you will note that MLI actually uses reflective surfaces. As far away from black-body surfaces as they can get.”
“but eventually youre still going to get cold”
Yes, when you are a corpse.
Your confusion is always entertaining.
After all this time, he still cannot wrap hus mind around how insulation works.
I can only imagine its the mesmerizing effects of the Postma cult.
https://simple.m.wikipedia.org/wiki/Hypothermia
https://images.app.goo.gl/wFubZm4owfPH8ghb7
Arctic animals rarely get cold. I wonder why?
Point is simple. Any mammal has an internal heat source. Insulate the mammal with fur or a coat, and it is possible to remain at a steady higher temp than the air.
With a steady output heat flux through the insulation, maintained by a steady temperature gradient.
Disagree? How?
How does MLI keep the sunny side of a spacecraft cooler?
My best guess uses the Green Plate Effect as an example. Every additional layer of insulation should make the outermost layer, the one facing the sun, a little hotter.
This means the innermost layer must get cooler and cooler in order for the solar input to be conserved.
*****
Using Postma logic, every inner layer, including the spacecraft wall itself, would be the same temperature as the outermost layer (again, refer to his take on the GPE). This would render the MLI useless. The sunny side of the spacecraft would overheat and the equipment inside would fail.
“My best guess uses the Green Plate Effect as an example. Every additional layer of insulation should make the outermost layer, the one facing the sun, a little hotter.”
☺️
Cynical
“Who disagrees that the models are adjusted to achieve a desired outcome? ”
You and I approach science from opposite directions.
As an old scientist I would adjust the models to bring them closer to reality.
As a ? you would adjust the models to match your opinions.
The difference between us is that if the evidence is coherent, consistent and consilient, my training will lead me to change my opinion to match the evidence.
You, on the other hand, will reject any evidence if it contradicts your opinion.
No gotcha intended, but I was merely paraphrasing Dr Spencer’s observation. You may disagree with my expression, of course.
As a ?, I was invited to give series of lectures to some undergrads. A small anecdote. I wrote on the board ASSUME, and pointed out that the word can make an ASS out of U and ME. Old joke, I know.
Until confirmed by experiment, speculation remains just that. No amount of consensus, coherence, or consilience will change my mind. You don’t have any experiments to back you up, you cannot even state a testable hypothesis. Appeals to your own authority are unconvincing.
Cynical, I don’t want to sound too cynical and skeptical but I never assume anything. What was that series of lectures to undergraduates about? Which University?
Should I look in Google Scholar for academic treatises by Michael Flynn? I haven’t found any yet. Can you suggest a keyword to help with the search? Australia as a keyword doesn’t help,
Sorry Cynical but my b.s. detector is easily activated.
MF is confused. He thinks he was lecturing to undergrads when, in reality, he was talking to a group of inmates here about his peculiar views. When they complained, we took him away and gave him some more electro-therapy. That calmed him down.
You are one sick piece of garbage.
E. Swanson,
[To limit the solar gain, simply coating the satellite surface with a reflective layer would do the trick and a reflective MLI does that as well. And time is irrelevant, as the energy flows reach steady state rather quickly.]
Thanks for setting me straight. I has assumed that a mirrored coating would not be enough, hence the need for multiple layers.
After a quick google search, though, I found that even a household mirror reflects around 99.9% of incident light. Moral to myself: dont trust assumptions!
Still, it was fun to work through how the insulating layers would keep the satellite cooler, even without a reflective outer coating.
So, Snape, you no longer go along with what the GPE teaches you, namely:
“My best guess uses the Green Plate Effect as an example. Every additional layer of insulation should make the outermost layer, the one facing the sun, a little hotter.”
?
Please get some help.
Better still, get yourself a useful hobby other than messing up this site.
professor P, please stop trolling.
The blue plate faces the sun and represents the outermost layer. The green plate represents an inner, shaded layer, sandwiched between the blue plate to its left and the satellite shell to its right.
So, Snape, you no longer go along with what the GPE teaches you, namely:
“My best guess uses the Green Plate Effect as an example. Every additional layer of insulation should make the outermost layer, the one facing the sun, a little hotter.”
?
Huffy
We obviously disagree on what the GPE teaches us. So whats your point?
My point was to ask you the question I asked, and wait for you to answer.
I pictured the satellite shell as a third plate. Lets call it the silver. This is not quite right, though, because the satellite has its own, much smaller, internal heat source. My guess is this can be ignored without changing the outcome too much.
Starting with the blue and silver, we have the same setup as in the Green Plate Experiment. Blue is warmer, silver is cooler. Now, if we place the green plate in between, the blue warms even more, the silver plate cools.
*****
If someone besides Huffy thinks this is not right, please dont hesitate to speak up! My feelings wont be hurt.
So, just to be absolutely clear, this:
“My best guess uses the Green Plate Effect as an example. Every additional layer of insulation should make the outermost layer, the one facing the sun, a little hotter.”
Is still your best guess.
Everything gets messed up if the blue plate is mirrored. I blew it there.
If not then yeah, still my best guess.
Blew what? You told the truth. The GPE is ridiculous.
Huffy,
You are not following! If the outer layer of insulation is an effective mirror, as is actually the case, then the only heat source comes from within the satellite. The heat flow is reversed, with the MLI insulation acting only to warm the satellite
This is a big problem for NASA engineers…..how to keep the inside of the satellite from overheating! The better the surrounding insulation, the bigger the problem.
Does the insulation cause the sun to heat up?
A little bit
☺️
No worries. Dealing with an insulation denier, who thinks it cant prevent humans or polar bears or penguins from getting hypothermia.
CO2 has nothing to do with the temperature variations
https://bit.ly/2EYBfPP
https://youtu.be/H_vpIVABNQI
No there there. Speculative at best, nothing concrete to account for warming of last century, nor to refute co2 effect.
DREMT
I was looking at your Postma link. The man is not a rational or logical thinker. He converts people by insulting and denigrating scientific people and his follower that have very limited science knowledge (like you) blindly accept his ideas (wrong as they are…they are not even logical).
Here is one from your link: Postma “However, what he actually did was just say that the shell emits twice as much energy as it receives, i.e. a full 235 W/m2 either way, so that the interior shell now has double the energy output. So, Willis just arbitrarily doubled the amount of energy available, so that he could add half of it back to the original 235 W/m2 in order to double it. Just arbitrarily doubled out of nowhere. Just made up bullshit.”
Postma is just illogical and a small-brained human. The energy is coming from the radiant core. It is a continuous amount. He is a true idiot in all respects. That he has people like you mindless peddling his junk science only amazes me how our science education has degraded.
If you wrap this radiant core with an insulating mantle you can raise the temperature up considerably like 10,800 F. I am unsure how to deal with someone that thinks Postma is a rational source of science.
Ask yourself, DREMT, why do you think the Earth’s core is so hot?
No one can break the spell of Postma on you or any of his deluded followers. Postma is a lunatic with bad logic, terrible science and a demented personality disorder.
Funny coincidence that he works in Calgary, recognized leader in the Canadian oil and gas industry.
“Ask yourself, DREMT, why do you think the Earth’s core is so hot?”
https://www.earthobservatory.sg/faq-on-earth-sciences/why-interior-earth-hot
So now you know, Norman.
DREMT
The link you provided does not give a complete story. It explains the primary sources of energy input but it does fail to explain why it is so hot. If you would dig deeper you would find that insulation to this energy provided by the mantle is what keeps the core so hot.
Here read some more and get a real education.
https://www.scientificamerican.com/article/why-is-the-earths-core-so/
“In sum, there was no shortage of heat in the early earth, and the planet’s inability to cool off quickly results in the continued high temperatures of the Earth’s interior. In effect, not only do the earth’s plates act as a blanket on the interior, but not even convective heat transport in the solid mantle provides a particularly efficient mechanism for heat loss.”
Created molten. Interior kept molten by radioactive decay. Cooling slowly. Thanks, DREMPT and Norman.
Mike F.lynn
Your often repeated point of the Earth cooling does not apply to the surface. The surface temperature has been within a range of temperature that keeps water liquid for billions of years but not hot enough to kill off life. The surface remains at some cyclic steady state temperature because of the combination of incoming solar energy and a restriction to the out flowing energy because of GHG in the atmosphere. Science you seem unwilling or unable to comprehend.
That’s right, Norman, insulation keeps things warmer for longer. It doesn’t make things warmer. You’ll get there.
DREMT
Sorry I do not believe I will be able to “get there” your delusional made up physics. From your posts it also seems that it is impossible for you to figure out real physics.
Your post is right only in some cases. YOU: “That’s right, Norman, insulation keeps things warmer for longer. It doesn’t make things warmer.”
CASE 1) Hot object cooling to much colder surroundings. Yes in this case insulation will keep the object warmer longer.
CASE 2) Hot object has energy input without insulation. The object will reach some steady state temperature with the surroundings and remain at that temperature until some conditions change.
Case 3) Same hot object with same energy input with insulation. The temperture of the hot object will increase over CASE 2 every time.
It is the Law of Physics you ignore. It is called the 1st Law of thermodynamics. It is the law that states energy can neither be created nor destroyed. It is considered a Law at this time as no experiment has been done to refute this. One day you may discover this Law and not ignore it. Meanwhile, put a thermometer on a heat lamp and get the surface temperature of the surface. Now wrap the same lamp in some good insulation and tell me what happens to the surface temperature. Please do this before posting again on this blog. I think you will find you are totally wrong. It will transform you.
DREMT, an increase in the effectiveness of a thermal barrier such as by adding more of an insulating material in the presence of an energy input will result in an increase of the equilibrium temperature.
“My best guess uses the Green Plate Effect as an example. Every additional layer of insulation should make the outermost layer, the one facing the sun, a little hotter.”
☺️
Man made global warming is not a bad science it is an outright fraud
https://bit.ly/2QblBHf
https://youtu.be/xVbeTmOEhLo
Eben, Ive got some ‘Free energy from water’ videos that you may find compelling. Also some ‘Earth is Flat’ videos that are just as credible. Interested?
While employed at the University of Calgary, I had the pleasure of meeting the young Joseph Postma. He was the brightest student in his class, reminding me of a trio of earlier, equally gifted scholars – Gordon Robertson, JD. Huffman and Michael Phlynn. It often felt like Joe was the teacher, and I the student.
The four prodigies have since made important contributions to climate science, and are deserving of our respect and admiration, not the insults so often seen on this otherwise outstanding blog.
I thought it was going to end badly for the son of Joe.
+1 for the dragons.
Ah, Snape again.
Those people you name are clearly brilliant. The problem with Joe Postma is that you have to agree with him 100% of the time.
If you disagree with him on anything he can’t handle it. It is a real shame. If Joe would play a little nicer with people like me who occasionally disagree he might have a much greater impact.
Postma needs to read Dale Carnegie’s “How to Make Friends and Influence People”.
In sharp contrast I occasionally disagree with Dr. Roy but he still tolerates me.
I agree, Postma can be his own worst enemy sometimes.
Yes GC, he is his own worst enemy. Joe should additionally read the entire canon of scientific literature or any book regarding thermal physics. That would be a good start. Same goes for the brilliant disciples.
Great work Dr. Spencer . . .
Snape?
Very hurtful. After defending our mutual friend, I am rewarded with an insult!
OK, Snape.
In an effort to bring things back “On Topic”, this post contains a gem of enormous significance:
“I still believe that the primary cause of the discrepancies between models and observations is that the feedbacks in the models are too strongly positive. The biggest problem most likely resides in how the models handle moist convection and precipitation efficiency, which in turn affects how upper tropospheric cloud amounts and water vapor respond to warming.”
In 1991 a paper was published saying this:
….about 98% of the natural greenhouse effect is due to water vapour and stratiform clouds with CO2 contributing less than 2%
This was only three years after James Hansen made “Global Warming” a political issue.
Here is a paper that tries to refute that statement:
https://pubs.giss.nasa.gov/docs/2010/2010_Lacis_la09300d.pdf
So who do you believe….NASA/GISS or MIT?
That 1991 paper had 240 out of 340 global downwelling LW power per unit area being due to water vapor. Author also wrote “it is water vapor in the upper troposphere (above 6km) that is of primary importance…Unfortunately, current measures of water vapor between 6 and 9 km are considered totally unreliable…measurements above 9km are essentially non-existent.”
So the 1991 paper rules itself out as “totally unreliable” on wv, the only paper left for “you” to believe then is Lacis 2010. However, there are now satellites providing more global specific humidity information so I suggest gc needs to find the latest info. to better get back on topic.
Ball4
The paper he was referring to does use 290 W/m^2 for WV contribution. It could have been a typo.
Here is the paper.
http://eaps.mit.edu/faculty/lindzen/150unc~1.pdf
I would agree with you that it should be 240 this makes more sense with actual measured values of DWIR spectra.
https://scienceofdoom.files.wordpress.com/2010/07/dlr-spectrum-wisconsin-ellingson-1996.png
Yes, good catch Norman, 290 “due to water vapor” out of 340 “downward flux of infrared radiation at the Earth’s surface.”
Ball4
Based upon actual empirically derived data for both CO2 and Water Vapor I would be more certain the 290 is typo.
http://fchart.com/ees/gas%20emittance.pdf
290/340 is 85% which is way above what WV can emit even when at high levels of concentration. It gets to around 70% which would be correct for your 240 value (240/340=70.6%)
EES: “in a mixture with non radiating gases”
I wonder where they found some non radiating gases. Anyway, Norman the tables are for path lengths at 1bar of at most 1-3m so aren’t applicable to an atm. of .GT. 20km path length. The lowest emissivity for Earth zenith atm. is about 0.7 and goes up from there as humidity (wv) increases pole to equator. These charts start at 0.7 “emittance” and go down from there. Temperatures start at around 250K and quickly go up to temperatures not found in the lower atm.
The 1991 paper gives no provenance for the 290 and is 3 decades old not worth the time to investigate especially since the paper states based on “unreliable” atm. wv measurement.
GC, Spencer’s concluding remark relies on the UAH analysis of both the satellite data and the CMIP5 model results. Both may be wrong. We know that the UAH results show the least warming trend compared with work by other groups and there are reasons to think that’s a result of their analysis. One example is the fact that the MSU/AMSU data is impacted by high altitude surfaces, such as the Antarctic and several mountain ranges, both of which are in regions excluded by RSS. Another is the effects of strong storms, which appear colder to the MSU/AMSU due to the effects of precipitable ice.
On the other side of the comparison, the CMIP5 curves from Christy’s group are actually simulations of the MSU/AMSU data, not the model results archived in the KNMI data sets. Those data are monthly mean values of temperature vs. pressure height, which must be converted to a single monthly value for each model run. There’s no way to capture the effects of intense storms, ocean and sea-ice, snow cover, etc. from the model runs using this approach. Lastly, Christy has not given a detailed description of the method used for the UAH conversion of these model results.
One of the problems with models that attempt to predict average global temperature is the issue of complexity.
For example Gary Russell, the modeler for Hansen et al. (2013) models the planet at all latitudes, includes the oceans to a depth of 100 m, gridded cloud maps and much more in his “Model E”.
While this involves an impressive amount of computation that people like me cannot match, the results are not impressive as I have been arguing on this thread.
As has been posted a few times already comparisons of CMIP model output straight from KNMI is consistent with the global mean surface temperature trend from multiple sources. In fact, actual observations stayed within the 95% model envelope > 95% of the time for both CMIP5 and CMIP6 since 1880. And this is from multiple sources. We really need an explanation from Spencer and Christy as to why their graphs look so different.
bdgwx, Yeah, I do recall such mentions, though I can’t point to any one example. Christy at UAH has been presenting similar comparisons for a couple of years now, so It would seem that they would have published their results and methods by now. Maybe they don’t want to risk spoiling their game, which might make their fans unhappy.
Seems that Joe shares many characteristics with DREMT. Uncanny.
Stop changing the subject all the time. GC was trying to get things back on topic. Why don’t you people get a useful hobby rather than messing up this site.
The Bot calling the kettle black.
+1. It is amusing being admonished by the PST troll for “messing up this site”!
Now now Mike, ‘please stop trolling’. 🙂
Sorry – no more time for this thread. I have to get busy ruining 50 more threads by posting this same inane, brainless comment. While I am doing that, I will try to convince myself that:
(1) I am representing DR ROY
(2) there is an EMERGENCY which is in dire need of my attention
(3) what I am doing somehow qualifies as “MODERATION”
(4) I am working with a TEAM of fellow “emergency moderators”
And when I’m done, I will try to convince myself that what I am doing is right by taking the Trump approach – telling everyone else that it is they who are guilty of my crimes.
Des, please stop trolling.
Yes Des and DREMT, please stop trolling.
Hush, Des.
DREMT (aka G.I.)
Please stop messing up this site.
I can’t hear him. He must have listened to you.
“taking the Trump approach telling everyone else that it is they who are guilty of my crimes.”
+1
Hughes has done further GPE experiments, for you to ignore or denigrate. Still no GPE!
As you have provided no link, it seems the only option is to ignore.
test
Midas
This is the link you are looking for.
https://principia-scientific.org/greenplate-effect-it-does-not-happen-proof-no-2/
Thanks Norman. Now you will have to denigrate, Des. Pick those nits.
Again, another very amateurish experiment by someone with STRONG confirmation bias, cannot overturn tens of thousands of previous experimental tests.
Sorry that dog don’t hunt.
Sydney: 2019 was the second warmest year on record, beaten only by 2016.
The average of the daily highs was a record, but the average of the daily lows only came 6th.
Sydney now has an unbroken streak of 96 consecutive months that are above the 161-year average (based on daily averages).
@Norman, Ball4
Lindzen, in the 1990 paper, tells us that if the atmosphere had no greenhouse gasses, the surface temperature would be 33 K lower than observed. He goes on to say (referencing another paper) that without water vapor, the surface would be 62 K higher than observed.
The takeaway: CO2, methane, etc, has a 95 K warming effect, and the net role of water vapor is to keep the surface cool.
Ok, maybe so. But later he says the C02/methane portion of radiative forcing to the surface is only 10 w/m2.
Which begs the question, is10 w/m2 enough to produce the 95 K warming asserted earlier?
******
What am I missing?
Did he really mean clouds and just said water vapor?
Uncondensed/unnucleated WV causes warming via the GHE. It’s just that more WV all other things being equal including temperature leads to more clouds which may more than offset that warming…maybe.
One thing we can all likely agree with Lindzen on is that cloud microphysics and macrophysics is really complicated. Some arrangements of clouds have a net warming effect while others have a net cooling effect so not only is it difficult to quantify this feedback but it is even difficult just determining which direction the feedback works. Some of the more recent studies suggest the cloud feedback is positive and leads to net warming which is obviously contradictory to Lindzen’s iris effect hypothesis. Clearly there is much we still need to learn about clouds.
Snape: “What am I missing?”
I can’t find where Lindzen in 1990 writes about a 62K warming effect so can’t comment. You certainly miss shouldn’t add 62K to 33K to discuss a takeaway 95K as temperature is an intensive property.
bdgwx: Lindzen writing in 1990, 1991 on clouds doesn’t render an opinion on whether clouds are plus or minus on surface temperature: “the (stratiform cloud) heating and cooling effects almost balance.” Lindzen then tries to clarify his “almost” on stratiform clouds cites: Ramanathan 1989 “the cooling effect slightly exceeds the warming effect”.
His studied indifference on clouds leads Lindzen to write: “The increasing concentration of CO2 in the atmosphere is unquestionably the most substantial aspect of the warming scenario.”
Latest results from CERES Team 2018 seems to agree with Lindzen in that after detail observing clouds with satellites since about 1980, and now calibrated with Argo results, that changes in clouds aren’t meaningful plus or minus on OLR or reflected SW as measured. They cite arctic sea ice coverage changes and ENSO changes as being the most statistically meaningful in their data.
Ball4, Interesting…so are you thinking the bulk of evidence points to clouds having a net neutral radiative forcing currently? What about going forward? Will it be positive or negative?
Lindzen was writing that back 30 years ago, I have no studied opinion. I will go with the CERES team publications. If there is a statistically measurable cloud change found in future OLR, reflected SW as the satellite observation period lengthens then those dudes will pick it up.
Depends of course on future funding for follow-on CERES instruments being carried into orbit.
Ball4 said:
“So the 1991 paper rules itself out as “totally unreliable” on wv, the only paper left for “you” to believe then is Lacis 2010. However, there are now satellites providing more global specific humidity information so I suggest gc needs to find the latest info. to better get back on topic.”
In 1991 Richard Lindzen said:
“It is hard to realize from this report that about 98% of the natural greenhouse effect is due to water vapour and stratiform clouds—C02 contributing less than 2 % . (Although Chapter 3 of the report presents correct numbers on this matter, the unwary reader might infer from p. 48 that CO2 accounts for 25% of the effect!).”
Lindzen was criticizing the IPCC’s AR1 “Full Report” and if his comment is true he demolishes the rationale for “Carbon Mitigation” in a single sentence.
Lacis et al. (2010) is an attempt to rebut Lindzen’s comment.
IMHO MIT (Lindzen) was right all along and NASA/GISS (Lacis) was trying to muddy the waters.
The “latest info.” supports Lindzen’s assertions. Water vapour (sic) is the primary GHG on Earth by a huge margin.
https://www.liebertpub.com/doi/pdfplus/10.1089/ast.2016.1589
Figure in the paper linked above compares a “Dessicated” Proxima b with the same world with oceans made of water.
The water version of Proxima b is warmer by 62 K. The models used in this paper are “state of the art” (e.g. SMART). The list of models can be found in Table 1 of Meadows et al.
Like Dr. Roy in this post I appreciate the wit and wisdom of Richard Lindzen and lament the fact that politicians listened to his advice (e.g. UK Parliament) yet acted irrationally.
I call it the “Madness of Crowds” but Lindzen says it better:
https://www.jpands.org/vol18no3/lindzen.pdf
@bdgwx
[Did he really mean clouds and just said water vapor?]
Doesnt sound like it to me. From the paper:
[What one sees from this figure is that with pure radiative cooling, the surface would have an average temperature of about 350 K; only with transport included is the temperature reduced to the observed 288 K.]
*********
I think I get what he is trying to say. The surface absorbs over 500 w/m2 from the sum of solar and LWIR:
https://en.wikipedia.org/wiki/Earth%27s_energy_budget
It only radiates about 400 w/m2 (pure radiative cooling). This roughly 100 w/m2 imbalance between downwelling and upwelling might cause the temperature to reach 350 K.
Only by including the roughly 100 w/m2 cooling from convective transport (thermals/evaporation) is the temperature held to 288 K.
*******
A quick look at the energy budget diagram makes his idea very obvious, but maybe it wasnt so obvious 30 years ago.
Snape, it was obvious over 50 years ago as Lindzen quotes Manabe several times. Lindzen lifts the 350K surface temperature for “pure radiative equilibrium” no convection enabled vs. observed avg. 6.6C/km lapse with natural convection from Fig. 4 here:
https://climate-dynamics.org/wp-content/uploads/2016/06/manabe64a.pdf
Ah…gotcha. So he’s talking about the latent and sensible heat transport. Yeah, that does show up as being close to 100 W/m^2 from many energy budget analysis.
Snape
I cannot see how adding 100 W/m^2 to the surface will raise it from 288 K to 350 K. If the Surface would only get rid of energy via IR than it would have to reach a temp where it radiates away the 503.6 W/m^2 it receives. This would cause it to reach a temperature of 307 K. I do not know how they calculate the 350 K. To reach a surface steady state temperature the atmosphere only has to radiate away 240 W/m^2. With no other changes in the atmosphere I do not see it having to go to 350 K to shed 240 at TOA. Also without water vapor the surface would be much cooler as the DWIR would be considerably less than 340 W/m^2. I did not read through Ball4’s linked article but at this time that idea does not seem a valid one.
@Ball4
Thanks. You are very thorough! I tend to browse through a paper like this, reading the parts here and there that look interesting, ignoring the rest.
*******
Maybe you could explain why he says, [the surface cools mostly by evaporation] when the energy budget diagram I linked tells a very different story?
Snape,
Better to use expressions compatible with thermodynamics if you don’t want to miss (or mess) anything. The surface only absorbs 160 W / m2. Irradiance of the atmosphere does not add a thermal flux, it only reduces the radiative colling flux to 60 W / m2.
Snape, Lindzen 199o writes: “The surface of the earth does not cool primarily by infrared radiation. It cools mainly through evaporation.”
By this statement, Lindzen means the ~390 upward LW energy budget figure “suggests” the surface cools mainly by IR emission because 390 “greatly” exceeds the upward LH flux of about 81. Lindzen then writes what really cools the surface is the net IR 49 which is 390 net of the 341 downwelling IR. This is a decent way to look at it too, one just has to be careful about what basis is being used in any comment, as in many things.
phi erroneously writes the atm. does not add a thermal flux which would only be true if some objects do not radiate (like an atm.) but an atm. (every object in fact) does radiate (at every frequency) since spectrometers looking at an atm. register all frequencies for nonzero broadband irradiation from the atm. incident on the instrument. If phi’s 160 was in fact natural, then surface air thermometers would not measure global 288K.
NB: if you want your phone (or other device) to thread your comments, go to the drop-down box in the browser and click on “use desktop site” then the times will appear and the site will properly nest your comments.
If Lindzen were more accurate thinking this thru, then he would have also used net zero from the upward cooling LH 81 less the downward LH condensational heating. So on comparable bases find the surface cools mainly by IR.
“…less the downward LH condensational heating.”
Oh ???
Water vapor condenses on the surface? No rain then?