One Upside of More CO2: Beautiful Upper Atmospheric Clouds

January 1st, 2020 by Roy W. Spencer, Ph. D.
Polar Stratospheric Cloud display (smartphone photo posted by Reddit user Breuuan on Dec. 31, 2019.)

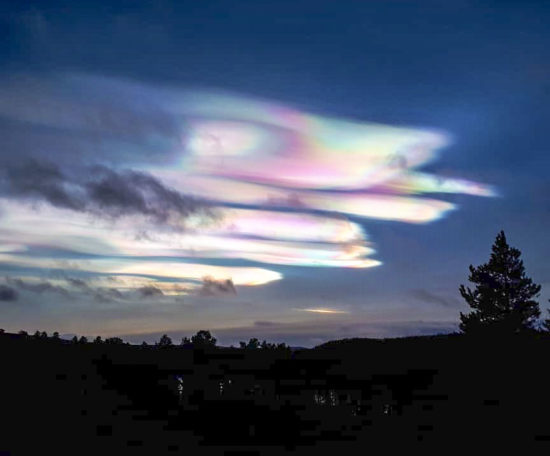
Increasing carbon dioxide in the atmosphere will continue to cause upper atmospheric cooling in the 2020s, which will lead to some of the most beautiful cloud displays ever witnessed by human eyes.

Along with the warming in the lower atmosphere that more CO2 is theoretically expected to produce, the upper atmosphere is supposed to cool even more strongly. For example, in our satellite observations since 1979, we have observed about 3-4 times as much cooling in the middle stratosphere as warming in the troposphere over the last four decades. This cooling is expected to exist even higher up, into the upper mesosphere and beyond, which is at the edge of outer space and where meteors burn up. The current record solar minimum conditions are probably also contributing to this cooling.

Polar Stratospheric Clouds and Noctilucent Clouds are Increasing

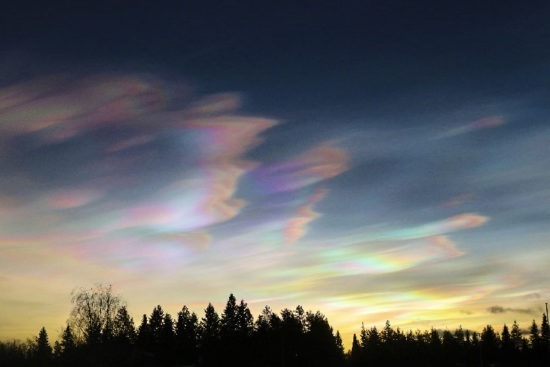
As 2019 came to a close, reports of some of the most vivid opalescent displays of wintertime polar stratospheric clouds (PSCs) in memory have been coming in from Northern Europe. These clouds require very cold temperatures in the stratosphere (-80 deg. C or colder). They show up shortly after sunset or before sunrise when the sun is still shining at that high altitude (15-25 km), while the usual weather-related clouds in the troposphere are no longer illuminated by the sun.

Wintertime polar stratospheric clouds in Sweden, Dec 30, 2019 (by Patricia Cowern Israelsson).

In the summertime in the polar regions, electric-blue noctilucent clouds (NLCs) are sometimes seen in the upper mesosphere (80-85 km) where temperatures plunge to the coldest anywhere on Earth, -100 deg. C. Like PSCs, they are seen after sunset or before sunrise, but due to their great altitude occur when the sun is well below the horizon and some brighter stars are beginning to shine. These clouds exist at literally the edge of space, above 99.999% of the mass of the atmosphere, and are believed to be seeded by meteoric dust.

Summertime noctilucent clouds (Nando Harmsen, FStoppers.com).

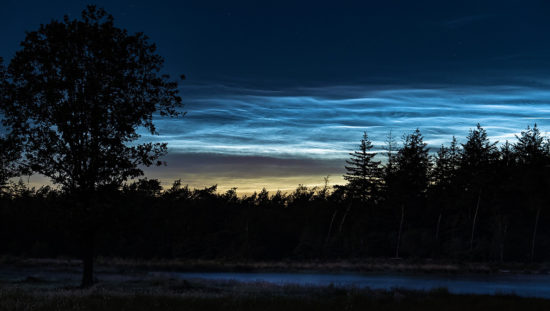
These clouds have a rippled appearance, and time lapse photography has revealed an amazing variety of undulations, like waves from multiple pebbles thrown in a pond interacting. The following 4K time lapse video shows cloud behavior unlike any you have seen before, and is well worth the 2 minutes it takes to watch (go full-screen):

2017 NOCTILUCENT CLOUD CHASING SEASON TEASER – 4K (UHD) from Night Lights Films on Vimeo.

Last year (2019) NLCs were observed well outside the polar regions for the first time in recorded history, as far south as southern California and Nevada. This is due to some combination of colder temperatures and higher water vapor amounts (methane is converted to water vapor at these altitudes, and increasing atmospheric methane could be causing higher humidity up there).


47 Responses to “One Upside of More CO2: Beautiful Upper Atmospheric Clouds”

Toggle Trackbacks

  1. ren says:

    In periods of low solar activity, ionization of the lower stratosphere increases, which leads to an increase in the temperature of the lower stratosphere in high latitudes and cooling of the surface in winter at medium latitudes.
    “Carbon-14 is produced in the upper layers of the troposphere and the stratosphere by thermal neutrons absorbed by nitrogen atoms. When cosmic rays enter the atmosphere, they undergo various transformations, including the production of neutrons.
    The highest rate of carbon-14 production takes place at altitudes of 9 to 15 km (30,000 to 49,000 ft) and at high geomagnetic latitudes.
    Production rates vary because of changes to the cosmic ray flux caused by the heliospheric modulation (solar wind and solar magnetic field), and due to variations in the Earth’s magnetic field.
    The atmospheric half-life for removal of 14CO2 has been estimated to be roughly 12 to 16 years in the northern hemisphere. ”
    https://en.wikipedia.org/wiki/Carbon-14
    https://www.cpc.ncep.noaa.gov/products/stratosphere/strat-trop/gif_files/time_pres_TEMP_ANOM_OND_SH_2019.png

  2. ren says:

    Current ozone distribution in the central stratosphere in the northern hemisphere.
    https://www.netweather.tv/charts-and-data/stratosphere

  3. Curious George says:

    Happy New Year. Just curious, do we measure an atmospheric composition at these altitudes? Are these clouds really snow? What an unimaginably light powder – better than Utah.

  4. ren says:

    Can climate change “accelerate” with a gradual increase in CO2? My answer – no.
    Can climate change accelerate with a strong decline in solar activity? My answer is yes.

  5. ren says:

    A strong gravitational wave from the mesosphere in mid-January will already be operating in the troposphere within the polar vortex.
    https://www.cpc.ncep.noaa.gov/products/stratosphere/strat-trop/gif_files/time_pres_WAVE1_MEAN_OND_NH_2019.png

  6. ren says:

    Noctilucent Clouds
    The southern hemisphere season for noctilucent clouds began on Nov. 15th–the earliest start in recorded history. Check here for daily images from NASA’s AIM spacecraft.
    https://www.spaceweather.com/DAISY_PICS/current_daisy.png
    https://www.spaceweather.com/

  7. ren says:

    As 2018 comes to an end, the Thermosphere Climate Index is on the verge of setting a Space Age record for Cold. “We’re not there quite yet,” says Mlynczak, “but it could happen in a matter of months.”
    https://spaceweatherarchive.com/2018/09/27/the-chill-of-solar-minimum/

  8. Curious says:

    Ren. What will happen next?

    • ren says:

      I do not know. The 26 solar cycle is likely to be groundbreaking.
      “The resulting summary curve reveals a remarkable resemblance to the sunspot and terrestrial activity reported in the past millennia including the significant grand solar minima: Maunder Minimum (16451715), Wolf minimum (1200), Oort minimum (10101050), Homer minimum (800900 BC) combined with the grand solar maxima: the medieval warm period (9001200), the Roman warm period (40010BC) etc. It also predicts the upcoming grand solar minimum, similar to Maunder Minimum, which starts in 2020 and will last until 2055.”
      https://www.nature.com/articles/s41598-019-45584-3

      • bdgwx says:

        That’s the infamous SIM paper in which Zharkova erroneously claims that the distance between the Sun and Earth changes as a result of the solar inertial movement around the barycenter and that this causes a large change in solar irradiance.

        • Scott R says:

          bdgwx,

          You need to please re-read that paper. The earth and sun distance is most certainly changing in particular as a result of Jupiter’s movement, but that is not the reason for the change in the solar irradiance. There are 2 competing wave forms within the sun that either combine constructively, or interfere. These wave forms are linked to the orbits of the planets. That is what creates the 11 year solar cycle on the sun.

          Now for a few of my own comments… as long as we continue on the normal cycle of 11 years, everything is chugging along, getting warmer and happy. When we have a rare formation, the 2 waves cancel, that the amplitude of the 11 year cycle decreases drastically. That is what drops the temperature on the earth. My opinion, the 2 component waves are from Jupiter moving between it’s perihelion and aphelion every 12 years. That’s 1. And Jupiter alignment or opposed to Saturn every 10 years. That’s 2. The way these slightly offset waves combine or cancel determines the amplitude of the solar cycle. My 2 cents.

        • bdgwx says:

          We’ve already gone over this. The distance of the semimajor/semiminor axis of astronomical bodies does not change as result of the their mutual orbit around the barycenter. If it did then we’d certainly be able to detect the change in the Earth/Moon, Earth/Sun, Pluto/Charon, etc. systems but we don’t. Nevermind that such a claim, if true (it isn’t), would upend centuries of planetary gravitational models and introduce a quite perplexing puzzle of how astronomers accidently got the right answers to orbital mechanics problems using a defect model. In addition, Zharkova says her claim actually originates from Shirley et al. 1987 yet that publication appears to have no such claim in it. And yes, she most certainly does claim that solar irradiance changes due to the SIM itself.

  9. Julian Flood says:

    In 1969 I saw a nacreous cloud well out i the Atlantic from the UK — we were on our way to 18W I think, northings a bit south of UK I think. Next night we did the same trip and there was a noctilucent cloud at more or less the same location. I’ve wondered if theee might be some mechanism for getting very high ice cloud particles up to noctilucent levels.

    JF

    • Joseph Zorzin says:

      In 1969 I saw some fantastic clouds- every color of the rainbow, extremely energetic, with very complex shapes, which seemed low enough that I kept jumping up to touch them- or, maybe it was the LSD. 🙂

  10. Alick says:

    Colder above, warmer below? Gee, I wouldn’t expect the increasing gap between the rich and the poor to lead to more problems.

  11. Nate says:

    Dr. Roy,

    I wonder how you know that the stratospheric cooling is not affecting the measurement of troposphere warming?

  12. David Vanegas says:

    Stunningly beautiful. Thanks for this Dr. Roy.

    Happy New Year to you and yours.

  13. ren says:

    Anomalies in the stratosphere in the south have a major impact on drought in southern Australia.
    https://www.cpc.ncep.noaa.gov/products/stratosphere/strat-trop/gif_files/time_pres_HGT_ANOM_ALL_SH_2019.png

  14. Bri says:

    So you’re saying a bigass fan in the stratosphere blowing down will end climate change 🤣

  15. Stephen P Anderson says:

    Abstract from Berry’s new paper:

    The whole scientific argument about the effect of human carbon dioxide on atmospheric carbon dioxide and climate change rests upon correctly calculating the human carbon cycle. This may be the first correct mathematical derivation and calculation of the human carbon cycle.

    The calculations use United Nations Intergovernmental Panel on Climate Change (IPCC) carbon-cycle data and focus on the physics. The calculations show IPCC’s natural carbon cycle data is internally inconsistent. So, the calculations keep the levels and update the flows for IPCC’s natural carbon cycle to make it internally consistent.

    Then the calculations simply apply the same IPCC rules for its consistent natural carbon cycle to the human carbon cycle, which IPCC has not done. IPCC’s human carbon cycle contains blatant, significant errors that prove IPCC’s fundamental conclusions are invalid.

    IPCC’s own data prove all human carbon emissions since 1750 have increased atmospheric carbon dioxide by only 32 ppm, from IPCC’s 280 ppm in 1750 to 312 ppm in 2019. In the same period, natural emissions have increased atmospheric carbon dioxide by 100 ppm to produce the 2019 level of about 412 ppm.

    If human emissions were to stop in 2020, then by 2100 only 4% of human carbon would remain in the atmosphere, or enough to increase atmospheric carbon dioxide by a negligible 8 ppm. IPCC’s data proves human carbon emissions cause no significant long-term change to atmospheric carbon dioxide and are not the cause of climate change.

    • bdgwx says:

      Has he figured out which reservoir sourced the 100 ppm or 210 GtC and how the 600+ GtC from the fossil reservoir got dispatched into the geosphere?

      • Svante says:

        Robert Rohde has, just watch the red squares here:
        https://tinyurl.com/tq2h8az

        • bdgwx says:

          That is very cool. Notice how red-tagged fossil reservoir units represent about 3-4% of the atmosphere, but were the dominating cause of the increase. This a perfect illustration of how Berry, Harde, Salby, etc. mistakenly conflate the residence time and adjustment time for a pulse of CO2 and why they cannot provide a satisfactory answer to the carbon budget questions like those I posed above and why their models have limited skill over narrow temporal domains with ad hoc tuning required.

          • Stephen P Anderson says:

            How would you know he’s conflated anything? I don’t see you asking him. I’m sure he’d welcome your constructive criticism.

          • Stephen P Anderson says:

            By the way his numbers come from the IPCC.

      • Nate says:

        pretty cool!

  16. Nate says:

    Yes Stephen, that is soo last decade.

    Let’s try to make the new decade fact- based.

  17. ren says:

    The blocking of circulation in the south has ended and the lows will reach the south of Australia.
    https://www.cpc.ncep.noaa.gov/products/precip/CWlink/blocking/real_time_sh/500gz_anomalies_sh.gif

  18. Dixon says:

    Thanks for the post (and Dec temp update). I’m curious about that ‘meteoritic dust’ seeding the noctilucent clouds. Given we now know there’s ‘lots’ of water in space and cometary tails are spewing it out as they orbit the sun, has anyone made any effort to quantify the input of water from OUTSIDE of Earth to Earth’s upper atmosphere?

    As I recall, it’s very dry up there so small fluctuations in input rates could have quite significant impacts. You can’t really monitor ice particles entering the atmosphere (airline pilots would probably be the best people to speak about hitting (or not)larger ice crystals/fragmetns) but most of the input would sublime I expect long before hitting anything, let alone ground.

    Do we have any data about the chemical composition of annual meteorite showers?

    Has anyone put a chemical analyser in orbit – able to catch and sample any material up there? Obviously, it’s almost all empty space, but there are notable exceptions, and injection of even a snowball sized comet would be undetectable and likely to form a noctiluscent cloud or many.

    Quick back of the envelope calculation: how much water vapour would a space object like 67P/Churyumov-Gerasimenko inject into the mesosphere if it entered: Based on it being 1 billion tons, and assuming an object half that size was just 10% water (conservative) and mesospheric mass as being 0.1% of atmospheric mass, I get something like 9ppm (by weight), which given 4ppm was the first measured value I could find is I would think, significant.

    Or perhaps I missed some zeros somewhere?!

    Lastly,in googling data on 67P/Churyumov-Gerasimenko I saw something that suggested the isotopic ratio of water from it was very different to that of water on Earth, so ruling out comets as a source of terrestrial water vapour. I know I should track down the paper because hopefully they aren’t idiots, but it’s not like life ever changes isotopic ratios is it? /sarc

  19. Hunter Paalman says:

    These pretty clouds immediately put me in mind of liesegang banding in the arena of chemistry within very viscous systems. Where reactants are diffusing about to find one another to react, nucleate and precipitate into visible bands or rings. Here’s a descriptive link of the phenomenon and two links to chemical and cloud pictures.

    https://becomingborealis.com/in-silico-a-short-history-of-liesegang-rings/

    https://becomingborealis.com/wp-content/uploads/2018/03/patt.jpg

    https://www.spaceweather.com/nlcs/images2009/12jul09/Jan-Koeman1.jpg

  20. Hi guy. Great website and nice topic.
    Thank you for sharing it.
    Best Regards.

  21. Great website and nice topic.
    Thank you for sharing it.
    Best Regards.

  22. This season is described by Nicolas Ghesquire as “aesthetics through time and space.” The collision of classic and modern has always been Nicolas’s specialty. This dream escape across time and space in the museum is no exception for high-end players in the world. A new reference.In the eyes of Nicolas, the art of the classical period is the undisputed peak of aesthetics. The highlight of this season is the classic hand-painted pattern jointly with Fornasetti Studio. The joint design of the autumn and winter series is based on Fornasetti’s 13,000 collections in Milan, carefully selected by Nicolas and Fornasetti Studio Art Director Barnaba Fornasetti and his team to appear on the show.

  23. I had a great time reading this informative article, it is full of insights and ideas, a lot of thanks for sharing this information. Great work!
    https://electricianglenbrook.com.au/

Leave a Reply