Who Dares to Deny Arctic Warming?

June 17th, 2013 by Roy W. Spencer, Ph. D.

polar-bear-heat
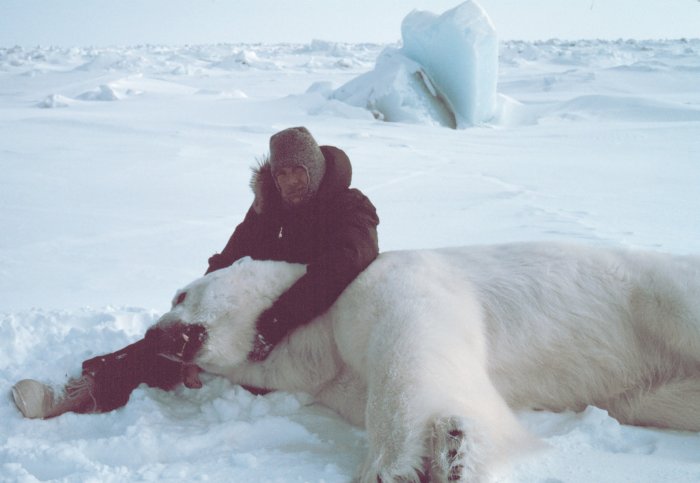
A polar bear which collapsed from heat exhaustion before it could be shot.

I have in my possession a copy of one of the most authoritative books ever written on Arctic sea ice, including a section on the warming of the Arctic. It is written by one of the pioneering researchers in Arctic sea ice, N.N Zubov, a Russian, who spent his career studying the Arctic region.

His observations of warming in the Arctic, which he described as not localized, but universal, are taken from his book entitled Arctic Ice. I have excerpted several pertinent passages, which I’m sure will convince you that warming of the Arctic can scarcely be denied:

Along with the fluctuations in ice abundance in each individual sea from year to year, in late years a most interesting phenomenon has been observed – a warming of the Arctic, as evidence by a gradual and universal decrease in ice abundance. The main evidence of this general warming of the Arctic are:

1. Receding of glaciers and “melting away” of islands….all the Greenland glaciers which descend into Northeast Bay and Disko Bay have been receding since approximately the beginning of the century. On Franz Joseph Land during recent years several islands have appeared as if broken in two. It turned out they had been connected up to that time by ice bridges. …I noted a great decrease in the size of (Jan Mayan and Spitzbergen) glaciers. Ahlman terms the rapid receding of the Spitzbergen glaciers “catastrophic”.

2. Rise of air temperature. (Over the last 20 years) the average temperature of the winter months has steadily increased…(in the last 10 years) in the whole Arctic sector from Greenland to Cape Chelyuskin there has not been a single (negative) anomaly of average annual and monthly winter temperatures, while the positive anomalies have been very high….

3. Rise in temperature of Atlantic water which enters the Arctic Basin…the temperature of surface water and of Gulf Stream water has steadily risen…

4. Decrease in ice abundance….15% to 20% (over 20 years)….In earlier times, polar ice often approached the shores of Iceland and interfered with fishing and navigation. For the past 25 years ice has not appeared in significant quantities.

5. Increase in speed of drift ice.

6. Change in cyclone routes. There is no doubt that the increase in air temperatures, increase in Atlantic water temperatures, intensification of ice drift, etc., are closely connected with an intensification of atmospheric circulation, and in particular with a change in cyclonic activity at high latitudes. Vize shows that Atlantic cyclones are now shifting considerably north, by several hundred km, from their courses in the period before the warming of the Arctic.

7. Biological signs of warming of the Arctic. …fish have ranged further and further to the north…cod in large quantities have appeared along the shores of Spitzbergen and Novaya Zemlya…also mackerel, dolphin where formerly were not found…during recent years fishing has gradually shifted into the Arctic waters, and this unquestionably must be ascribed in considerable degree to the warming of these waters….many heat-loving bottom organisms are now found in regions these organisms were not found (30 years ago). Knipovich says: “ In a matter of fifteen years…there occurred a change…such as is usually associated with long geological intervals”.

8. Ship navigation. …a number of ship voyages (were made) which could hardly have been accomplished in the preceding cold period.

Still more remarkable is the fact that the warming of the Arctic is not confined to any particular region.

I find these observations to be quite compelling evidence that warming of the Arctic is indeed unprecedented. Who would dare deny it? Clearly, we must do something about our carbon dioxide emissions!!

NOTE: Oh, silly me. This book was written in the late 1930’s. Nevermind.


119 Responses to “Who Dares to Deny Arctic Warming?”

Toggle Trackbacks

  1. Jim Cripwell says:

    Did you forget to mention that Zubov died in 1960?

    • DOH! Silly me! My bad. I’ve added a note to the post. 😉

      • Hops says:

        Temperatures used to go up and down. Lately, we’ve gone up, and we’ve gone flat.

        Would anyone care to assure me that we will soon see a prolonged and significant cooling? — enough, say, to starting bringing down a 20-year moving average that is currently going up…?

        I think the natural forcings are in a negative phase but we haven’t gone down because the CO2 forcing up.

        Hops

        • Steve says:

          Yes, a .07 C anomaly is quite terrifying. Not only is a tiny trace of CO2 the cause of every single note worthy weather event on the planet, but now something far worse: boring weather- flat temps with record low tornado and hurricane activity !

          if we allow this to continue, we will soon reach a tipping point, beyond which the climate will go into an irreversible tailspin of mind numbing monotony.

  2. lemiere jacques says:

    yes but recent warming is unprecedent, not ancient warming.

    • Fred from Canuckistan says:

      yes it is . . . unprecedented eco-greenie fear mongering and hysteria.

      Same old “the sky is falling” crap from the Eco Chicken Little crew.

      Glowball Warmers . . . credibility lower than a snake’s belly in a wheel rut

    • mark says:

      100 years ago isn’t ancient, and the fact that this guy observed it actually negates the “it’s unprecedented” argument. Why? By the very definition of “unprecedented”, which means it hasn’t happened before. Clearly, this guy’s observations demonstrate it has happened before, long before people drove SUVs and thus has a precedent.

      • Whit says:

        Please keep in mind that we have a lot less sea ice than in the late 30’s.

        You might also want to check Kinnard et. al 2011:

        http://www.nature.com/nature/journal/v479/n7374/full/nature10581.html

        Seems pretty unprecedented for the last 1450 years at least.

        • Ben says:

          RE: Whit – “Seems pretty unprecedented for the last 1450 years at least.”

          Really? In the late 1700s and early 1800s, we managed cubic kilometers of melt in Glacier Bay. It is rare to observe a few meters per year now at the terminus.

          http://soundwaves.usgs.gov/2001/07/fieldwork2.html

        • Robert Austin says:

          “Here we use a network of high-resolution terrestrial proxies from the circum-Arctic region to reconstruct past extents of summer sea ice”

          It depends on whether their “high-resolution” proxies are akin to reading chicken entrails or actually tell a semblance of the truth. The story of climate proxy reconstructions has not been pretty. And then there is the anecdotal evidence which does not always support the proxy reconstructions. As I see it, nobody really has accurate knowledge of Arctic ice coverage before the satellite era.

        • Bill says:

          Did we have satellites in the 1930’s to monitor sea ice? Apples and Oranges makes it hard to compare.

  3. Old Hoya says:

    I suspect this is anticipatory warming — as more and more heat has to be secretly stored in the deep ocean layers to vindicate the models, the quantity of stored energy eventually causes a space-time breach and warms the past. Could help explain Medieval Warming.

  4. AnonyMoose says:

    To be more precise, it has been dated to 7 BP (calibrated based on deposits on flat sheet #2 of processed wood).

  5. Tim Folkerts says:

    Are there any comparisons available of the conditions that Zubov found, compared to recent conditions?

    For example, he wrote “ On Franz Joseph Land during recent years several islands have appeared as if broken in two. It turned out they had been connected up to that time by ice bridges. …I noted a great decrease in the size of (Jan Mayan and Spitzbergen) glaciers. Ahlman terms the rapid receding of the Spitzbergen glaciers “catastrophic”.

    Was there are recovery between ~1930 and ~ 1970?
    Are current sea ice extents larger or smaller than he observed?
    How have those glaciers fared since their decreases ~100 years ago?

    Basically, the question is “are current ‘catastrophic’ decreases merely returning to conditions seen a century ago, or are they even greater than the earlier declines?”

    • Whit says:

      We’re way below 1938. See my post further down. This particular canard has been around the blog-science circuit so many times it gets really dull. It’s Dr. Inferno-material to be honest.

      Unfortunately it doesn’t make it true.

    • John K says:

      Hi Tim and Roy,

      Tim, you asked good questions. Roy, since you show familiarity with Dr. N N Zubov’s work, do you have in your possession any photos, video, graphic aids, drawings etc. that Dr. Zubov may have used for reference during his productive period of arctic ice sheet exploration and measurement? Or do you know where such information can be obtained without having to trek to Russia? It seems hard to believe such data does not exist.

  6. Richard LH says:

    Is it just me or do the graphs of sea ice not look to have different frequency characteristics before and after 2006/7?

    http://arctic.atmos.uiuc.edu/cryosphere/IMAGES/global.daily.ice.area.withtrend.jpg

    It almost like two different series joined at that point.

      • Richard LH says:

        I wonder if there is any information about data collection methods and what, if anything changed around that time period.

        If you were to split the graph vertically along a line around 2006/7 and present them seperately then I do not believe anyone would say they come from the same source, or at least that the signal characteritics have changed around that point.

        • Levi Pearson says:

          I apologize for not having links. But I recall that the satellite camera was upgraded at this time. The way the NSIDC measures sea ice is they measure which pixels in the photographs are of a color to denote 15% ice coverage or more. They then weight the result for the area covered by each pixel (if the camera were directly above the pole, the more southerly the pixel, the greater the area).

          If the upgrade were to say double the number of pixels, it seems to me that it will change the results (because of the 15% threshold; I don’t think there would be a change if 50% were the threshold). I have never read that the two cameras were run simultaneously to calibrate the results. I don’t have the math skills to calculate the effect.

          Sorry to go on like this, but I have wondered about this for years and am intrigued that somebody has noticed it.

  7. John K says:

    Hi Roy,

    Thank you for a very clever and informative post! Jim claims Zubov died in 1960. Prescient as Zubov apparently proved to be, did the Russians freeze his remains Ted Williams style for posterity? Could he be thawing with the Mastadons, Mammoths, Saber-tooth Tigers and Dyer wolves etc., in Russia’s permafrost? Perhaps modern science can revive the apparent corpsecycle before it melts, take him on a 21st century trek through the home country for an up-to-date arctic ice-sheat comparison with the previous century. Or better yet, if we still have the DNA we could clone him for a running Zubov climate commentary that can be aired on TV, U-tube, whatever til the end of time.

    Then again, we could just allow a brave new generation of climate pioneers, alarmists, what have you to investigate arctic ice sheets with fresh eyes unstained by past arctic sea ice/ice sheet experience to arrive at whatever conclusions they will hopefully based on something resembling empirical data. How long do you think we’d have to wait for that to happen?

  8. OssQss says:

    The more I read, the higher my pulse count. Then the note and boom,,,,,,,,,,,, beer on tablet anomaly.

    Ya got me Doc √

    🙂

  9. jjs says:

    Just had an argument/discussion about Artic sea ice with a friend…thought I was going to have to eat crow there for a minute….

  10. James Cook says:

    You really had me going for a few moments there. That picture, and the caption… Nice one!

  11. Kieth Sweat says:

    Any ice from the 1930’s can be tested for certain chemical/ozone elements that were present at that time??!!
    Someone should bore for some 1930’s ice and do some testing.

  12. Mack says:

    Quick Roy, rush that picture of the polar bear dying of heat exhaustion off to David Attenborough and the BBC. I can’t see a tranquillizer dart so it should be OK. On second thoughts…no..

  13. TinyCO2 says:

    Interesting that winter warming was highlighted.

  14. Joseph says:

    Here is a Monthly Weather Report from the NOAA website archives about the artic conditions from 1923.

    http://docs.lib.noaa.gov/rescue/mwr/050/mwr-050-11-0589a.pdf

  15. coturnix19 says:

    Russian pomor people sailed along the arctic coast of east europe and all the way to taimyr and on few occasions even beyond it all the way into 17th century, while the world was supposely lapsing rapidly into the LIA. After that, only in late 19 th century could people sail there. Apparently, arctic warming may be out of phase (lagging) the earth or europe average.

  16. Manfred says:

    Entertaining post, thank you Dr Spencer.

    Edmund Burke (1729-1797)
    “Those who don’t know history are destined to repeat it.”

    The eco-theocratic fanatics, the toxic greenies rely on the slumbering, TV engrossed masses to remain as narcotized mushrooms.

    Where the model huggers dropped the ball so to speak, more aptly, where they defeated themselves was in their own greed. Look at Al Gourdo for example. They greed insatiably for power and plunder. And reaching deeply into the pockets of the well washed masses is the fastest way to bring them to their focussed senses.

  17. Whit says:

    Dr. Spencer.

    If you would be so kind as to take a look at this DMI map of ice extent from 1938:

    http://neven1.typepad.com/.a/6a0133f03a1e37970b01774465724b970d-pi

    And then compare it to this NSIDC map from august 2012:

    http://neven1.typepad.com/.a/6a0133f03a1e37970b0177446573b6970d-pi

    What do they tell you Dr. Spencer? I always had the impression that you were a rational skeptic. Please prove me right.

    I find it interesting that Zhubov found the changes in the Arctic to dramatic. What do you think he would have said today, when the changes are much more profound?

    • Gras Albert says:

      What a shame, Whit, that you didn’t continue to show DMI ice maps just a few years after your example, as in say 1952

      Well blow me down, arctic sea ice extent recovers in just 15 years to pre 1920s levels! Naturally!

      Might one suggest that people who live in glass houses shouldn’t throw cherry picking stones?

      • Whit says:

        I haven’t said a thing about whether a recovery is realistic or not. I have documented that todays situation is one with far less sea-ice than in 1938, and comparing the two without being perfectly clear about the fact that sea ice is a far more precarious state today, then it was in 38.

        Come back to us when this recovery you speak of has happened. Until then it is nothing but conjecture. Perhaps you see a recovery in this trend. I don’t:

        https://14adebb0-a-62cb3a1a-s-sites.googlegroups.com/site/arctischepinguin/home/piomas/grf/piomas-trnd1.png?attachauth=ANoY7cpzuJZLY_rarsvhCMcsdrl0RxYPXRLzL94eeHFx3Nh5M5NGsHow3LF6zPHEJ7eXI5-n1lt3Qj6El3YVR_1rLKSgst0pPd–ArK7svhYGdktlX-j1-YxXnmqJJNj4d4_LcHo6Y8sRdMiZVro5MVeCIG8U0Dr2H6I3_VxP5DX6VYGs2xbknPBwXnQkv6CKK6rPG4-rxeE1ivPxUYnjDvB9p5VL80OVZGSat5cLFaK-6TCU2yLLHjyMXdo9W-LxQhOcEn-_0-7&attredirects=0

        • Ben says:

          Whit,

          NSIDC states the Arctic has been ice free on multiple occasions during the past 4,000 years.

          So the recovery has already happened, multiple times.

          Wax on, wax off.

          • Tim Folkerts says:

            I have heard that the Arctic was possibly ice-free ~ 9,000-10,000 years ago. But this was at a time when the earth’s orbit was such that the North Pole received significantly more sunlight during the summer than it does now (something like 10% more sunlight if I recall correctly).

            1) Do you have references to NSIDC saying that “the Arctic has been ice free on multiple occasions during the past 4,000 years”?
            2) It would not be surprising for the arctic to be ice-free with more sunlight coming in. But how do *you* explain that at the current time — with less sunlight — the melting is getting more pronounced?

      • Gras Albert says:

        Apologies, reposted as the first time I used the wrong link

        What a shame, Whit, that you didn’t continue to show DMI ice maps just a few years after your example, as in say 1952

        Well blow me down, arctic sea ice extent recovers in just 15 years to pre 1920s levels! Naturally!

        Might one suggest that people who live in glass houses shouldn’t throw cherry picking stones?

        • Gras Albert says:

          Whit

          It requires a ‘special’ kind of scientist to have faith in a hypothesis even when observational validation fails

          Each and every one of the CMIP5 model projections understated the 2012 Arctic sea ice extent minima, equally, each and every one projected negative Antarctic sea ice extent anomalies which were then and remain now at record positive values. Net sea ice anomaly was positive for 5 months from Feb through Jun 2013.

          Why is it do difficult to accept that, to paraphrase Goldwyn, the projections of CMIP5 models are not worth the electrons they were computed with?

          Here’s a plot of decadal trends starting in 1987 (i.e the first decade is 1987-1996) and finishing in 2003 (2003-2012) for 5 air temperature, 1 sea surface temperature and CO2 datasets.

          Please tell me you see the decadal trend of trends declining year on year from 1993-2002 through 2003-2012 until all but Dr Spencer’s UAH show cooling, all while CO2 continues to show an increasing trend? 20 years of data do not lie!

          Don’t throw away your winter coat, you’re going to need it for at least the next decade or two

          • Whit says:

            What on earth are your goalposts doing in the next county all of a sudden?

            We were discussing the extent of Arctic sea ice were we not? In particular Arctic sea ice extent in august 1938 compared to 2012. And you completely evaded the fact that they are not comparable.

            I understand that you predict a recovery due to cooling. That’s your prerogative. But it doesn’t change the fact that sea ice extent in 1938 was about double what it is today. This means that volume is possibly around one quarter of what it was in 1938 today.

            Yes, most of the models have failed miserably:

            http://neven1.typepad.com/.a/6a0133f03a1e37970b017744cf5360970d-pi

            When it comes to comparing mostly perennial Antarctic sea ice that is formed around a 3km high continent of ice, to seasonal Arctic sea ice that is surrounded and thus constrained in extent, it seems highly unskeptical to me. They are in fact polar opposites in more ways then one. One is a donut, the other is not.

            By the way, have you given any thought as to why the two bodies of sea ice behave so differently? Have you given any consideration as to what factors control the formation of sea ice on the opposite poles?

            And did you know that Manabe predicted an increase in Antarctic sea ice 20 years ago?

            Freshwater influx and changing winds seems to do it’s thing down there. Wonder where all that extra freshwater comes from. Got any ideas?

            Or do you want to get back to the Arctic? Personally I could about Pine Island and Thwaites glaciers all day. Or how about that peninsula. Larsen A+B were quite old before they suddenly collapsed, in a period when we should be sliding slowly into an ice-age …

        • Well blow me down, arctic sea ice extent recovers in just 15 years to pre 1920s levels! Naturally!
          If you think WWII is natural…

    • The 1938 DMI map was for August without any specific date that I can see, and the 2012 NSIDC map was for August 28th. Maybe a better date for comparison would be August 14th,when ice cover is close to the monthly average.

    • AnInquirer says:

      You would be wise to read up on the methodologies used to estimate ice extent from 1900 to 1978. The last timed I read the documentation, the analysts warned that the estimates were unreliable, and it seemed that the estimates matched the bias of the analyst.

  18. Chuck Teal says:

    What is it that people can’t seem to understand about the word “cycle”? Earth is acclimated to a heat/thaw repetition; it slowly shifts land masses and material, it allows animal and plant populations to refresh their territories, their populations, and incidentally, their interactions with other species. I tend to believe this all helps to keep the overall dynamic of life on Earth…well…dynamic.

    • Whit says:

      Cycles have causes.

      Even Dr. Curry thinks the major factor behind the reduction of Arctic sea ice is anthropogenic.

      • Joe Wooten says:

        Thinking it is anthropogenic and proving it is are two entirely separate things.

        • Whit says:

          Oh silly me. I thought proof was for mathematics, while evidence for and against a particular hypothesis was what scientists looked at when they reached a professional opinion about a subject.

          Anyway, do you think Dr. Curry looks at available evidence before she reaches a conclusion in her field of expertise?

          Or du you think she just decides what she thinks about it, based on her own preconceptions, and forms her professional opinion that way?

  19. C’mon, folks, no one really knows how extensive the summer ice melt was before reliable satellite measurements (starting in 1979 with Nimbus-7). Look at the old maps (e.g. for August 1938: http://brunnur.vedur.is/pub/trausti/Iskort/Jpg/1938/1938_08.jpg ) …the only actual observations they had were in red. Virtually all of the sea ice area was simply assumed. The interior of the Arctic basin was in general not traveled to by ship, and even if was, the visual range from a ship is extremely limited.

    • BooS says:

      Dr. S – If this is the case, why even bother with this post? Feeling extra frisky I guess?

      • I suppose…or a glutton for punishment. I’m not saying that GHGs weren’t involved at all in recent sea ice retreat. But to blame it all on mankind ignores natural variability which we know has happened before. I suspect the cold 1800’s caused an ice buildup that even the warm 1920’s-30’s couldn’t reverse. One has to wonder how much of this is just a residual rebound from the Little Ice Age.

        • RichardLH says:

          Did you have time to look at my presentation of the UAH data to date?

          http://s1291.photobucket.com/user/RichardLH/story/70051

          Just adding a few more stages to your existing presentation 🙂

        • Whit says:

          And still, there’s no data that suggests that the extent in 1938 was less than double that of 2012. Which means that volume is probaly less than a quarter, and then I’m being really conservative.

          So why compare them? You should be looking at warm atlantic water entering Barents and upwelling further in, if you want to find other explanations, not repeat the nonsense that gets thrown around stating it was just the same in the 30’s as it is today. You see, it is not.

        • Sparks says:

          Nice find!
          I have a quick question, If GHG’s are an important factor of what a planets temperature will be, then how is it that Uranus which has 2 percent methane in its atmosphere, yet it emits more energy than it absorbs?

          According to Hubbard’s “The New Solar System” Uranus does not have a greenhouse effect.

          http://books.google.co.uk/books?id=iOezyHMVAMcC&pg=PA193&lpg=PA193&dq=Hubbard

          Have you any thoughts on this, thanks 🙂

    • Richard LH says:

      Measurement beats extrapolation every time!

      From looking at the data I have significant issues with the data before/after 2006/7 even in this record where the data appears to be almost as if it was from a different instrument.

    • B Parsons says:

      There are in fact people who do know what the extent of ice has been for many centuries – the Inuit. And it is clear from many things but especially their traditional knowledge that there are polar bear where they didn’t used to be, driven ashore by melting ice. It is also revealing that there is no words in Inuvialuit for “robin” “salmon” “butterfly”, which they now see regularly. That language is very old, at least a few thousands of years and it is a revealing fact. Perhaps the best proof is that in fact these very smart resilient and knowledgeable people (all the stupid ones are dead) have in fact survived the last few thousand years, because they live hunt and travel on the sea ice. No sea ice no Inuit. If there was a period in the past when the sea ice was much reduced this wd have made their traditional way of life impossible. Under today’s conditions they wd soon become extinct. And if you doubt the traditional knowledge of these folks, then I am not going out on the ice with you. I have been there, -35 C and dark all the time, no place for a southerner. The traditional lifestyle is now almost impossible to follow as freeze up is two months later and thaw two month earlier than it used to be. All over the world indigenous peoples myths have been proven to be correct – New Zealand really was settled by a small number of settler as their own culture has maintained (genetic studies show there is huge founder effect). On the whole they are the experts, and I believe them when they say this is unprecedented in their cultural knowledge, and these are people who knew and showed everyone where the Franklin expedition foundered, that was only a few hundred years ago. Traditional knowledge is huge and cannot be discounted. They know, and we ignore them only from cultural arrogance.

      • Robert Austin says:

        I am not saying that what you say about Inuit traditional knowledge should be discounted but who says that there hasn’t been climate change and commensurate environmental shifts coming out of the little ice age. So were polar bears “driven ashore by melting ice” or were they merely adapting to changing circumstances coming out of the little ice age? Were robins, butterflies and salmon seen during the medieval warm period but forgotten over the generations during the little ice age? You make a great leap in assuming that the “smart resilient” people would not have survived conditions of much reduced sea ice. And you must consider that the much reduced ice conditions would only occur for a short period at minimum extent. While I respect the Inuit mastery of a harsh environment, a mastery only possible with generations of passed on wisdom and lore, you eke too much conclusion out of a thin gruel of speculation.

  20. J Williams says:

    Those who have more systematically studied the history of sea ice extent have come to different conclusions than what is implied by this post. See:

    http://www.geo.umass.edu/faculty/jbg/Pubs/Polyak%20etal%20seaice%20QSR10%20inpress.pdf

    The last sentence in the abstract is pretty telling.

    • RichardLH says:

      Why not quote it as well?

      “The current reduction in Arctic ice
      cover started in the late 19th century, consistent with the rapidly warming climate, and became very
      pronounced over the last three decades. This ice loss appears to be unmatched over at least the last few
      thousand years and unexplainable by any of the known natural variabilities.”

      As Roy will no doubt observe – it all depends on how you ESTIMATE sea ice historically. I believe that is what he is pointing out.

    • John K says:

      Hello J Williams,

      The last statement reads:

      “Taking together the magnitude, wide geographic distribution, and abruptness of this ice loss, it appears to be anomalous in comparison with climatic and hydrographic variability observed on submillennial time scales and longer-term insolation changes.”

      The last statement tells me far too much about the credibility of the author, but not much else. If anyone actually observed temperature readings, and/or climatic and hydrographic variability on a submillennial time scale, say over hundreds of years, please provide the name/s. I’m sure we’d all like to read about them and their documented evidence. However, to claim “Arctic paleoclimate proxies in lake and marine sediments, tree rings, and ice cores” and other such material as observation of past events stretches more than credulity. Especially, when you consider that temperatures dubiously derived from tree ring data when compared to observed temperatures prove inaccurate and when you consider that no absolute chronometer exists to date the samples they theoretically investigate.

      You can pretend as the article does that some conjured points on a graph actually reflects sea ice extent from the middle ages, but why would any honest person do so? Unless of course, the object involves supporting a preconceived climate theory and not actual measurement.

      If you can provide actual measurements made in any given time period please do so. It would be better for all researchers to simply admit they do-not-know the answer to queries regarding past environmental history, rather than pretend they have data that simply doesn’t exist.

      “There is something fascinating about science.
      One gets such wholesale returns of conjecture
      out of such a trifling investment of fact.”
      Mark Twain.
      Life on the Mississippi

    • Robert Austin says:

      The last sentence is an unwarranted conclusion. Unfortunately, such flights of fancy seem to be the flavour of the day in the abstracts of climate related papers.

  21. RichardLH says:

    If you plot both 95% confidence limits when arguing your case, then you risk the eye turning it into a 50:50 bet despite that true statistical analysis may show otherwise.

    If you can make your case when only using the 95% confidence limit that does NOT support your case are you using the statistics correctly I believe.

    Given that criteria, I am not sure how well argued most of the climate positions to date are.

    See: http://www.woodfortrees.org/plot/best-upper and then consider any definite assertion of recent warming!

  22. shishupala says:

    Dr. Spencer had a great post about the models missing the natural warming of the 1930s and 1940s which he should revisit.

    This is interesting as well, from Callendar’s landmark 1938 paper Q&A peer review section –
    “In reply to Dr. Brooks, the author agreed that the recent rise in
    arctic temperatures was far too large to be attributed to change of CO, ;
    he thought that the latter might act as a promotor to start a series of
    imminent changes in the northern ice conditions. On account of their
    large rise he had not included the arctic stations in the world temperature
    curve (Fig. 4).” which was in response to the question from Dr. Brooks – “Dr. C. E. P. BROOKS said that he had no doubt that there had been
    a real cliniatic change during the past thirty or forty years. T,his was
    sho\vn not only by the rise of temperature at land stations, but also by
    the clccrease in the amount of ice in arctic and probably also in antarctic
    regions and by the rise of sea temperatures. This rise of temperature
    could honcvcr he explained, qualitatively if not quantitatively, by changes
    in the atiiiospheric circulation, arid in those regions where a change in
    the circulation aould be expected to cause a fall of temperature, there had
    actually been a fall; moreover the rise of temperature \vas about ten
    times as great in the arctic regions as in middle or low latitudes, and
    he cliil not think that a change in the amount of carbon dioxide could
    cause such a differential effect. The possibility certainly merited dis-
    cussion, however, and he welconied the paper as a valuable contribution to
    the problem of climatic changes.”

    sorry for the bad PDF “translation” SEE ORIGINAL ARTICLE here http://onlinelibrary.wiley.com/doi/10.1002/qj.49706427503/pdf
    pg 238

    Interesting that Callendar had to leave out the (“10X as great”)signal (or most significant warming area) essentially? High lat NH warming is the MO for Holocene warm periods, has anything changed? It does not seem so, though we have amlpified
    a natural signal with apparent high nighttime low temps in the same region? But, as Roy has shown, the models are off at least 40 percent (probably more depending on data changes through time) in hindcasting the NH warming in the 30’s which creates a problematic future attribution?

  23. shishupala says:

    and the thing the models have UNDERpredicted (i.e. the ever-popular “worse than we thought” NH sea-ice extent) may well come from the fact that the problem of historical DIFFERENTIAL warming of high latitudes was ignored/overlooked/neglected. funny perhaps?

  24. Norman says:

    For Whit from above

    You state: “And still, there’s no data that suggests that the extent in 1938 was less than double that of 2012. Which means that volume is probaly less than a quarter, and then I’m being really conservative.”

    Maybe you are not going back far enough. Here is an article for you. 8000-5000 years ago the Arctic ice was estimated at 50% of the ice coverage in 2007. Conditions were warmer in the Arctic during this time. Read the article for in it it states:
    “Funder says, “Our studies show that there have been large fluctuations in the amount of summer sea ice during the last 10,000 years. During the so-called Holocene Climate Optimum, from approximately 8000 to 5000 years ago, when the temperatures were somewhat warmer than today, there was significantly less sea ice in the Arctic Ocean, probably less than 50% of the summer 2007 coverage, which was absolutely lowest on record.”

    http://www.sciencedaily.com/releases/2011/08/110804141706.htm

    Fluctuating Arctic sea ice does not seem anything out of the ordinary. And Roy may be very correct. The temperatures in the 1920-1930’s in the Arctic may have been as high as today but the sea ice did not melt as much because the water was colder. The cooling after the 1930’s was not as long, deep or prolonged as the little ice age.

    • Whit says:

      Changes have causes. Summer insolation on the northerne hemisphere was seven percent higher during Holocene Thermal Maximum.

      We don’t have that extra insolation now.

      • Norman says:

        Thanks Whit but read this, nothing is quite as easy in climate as it should be. Even with greater insolation there were times when the Arctic was cooler. It is a nonlinear mechanism that seems to control the Arctic climate.

        http://www.pnas.org/content/108/48/19299.full

        • Whit says:

          Yes, there’s a multitude of feedbacks. That’s actually why a lot of scientists worry about the consequences of rapid arctic warming.

          I fail to grasp how this is an argument against my statement that there’s far less sea ice now, than in 1938. I also do not understand how this is an argument against for instance Kinnard et al 2011.

          When ice-shelves that were at least 3000 years old collapse (see Ayles and Ward ice-shelves for instance) it should be a sign that what we are seeing is most likely unprecedented for at least 3000 years.

          Or du you have any positive evidence to the contrary? it’s easy to speculate about alternative causes. It’s a lot harder to produce evidence for a hypothesis. So where’s the evidence for the hypothesis that what we are seeing is “normal”?

          Ice-conditions during Holocene Thermal Max just doesn’t do it for me I’m afraid. We don’t have those conditions now.

          • RichardLH says:

            I’ll pitch in with these observed natural cycles in the measured data. Less than 15 years period ones for now. Nyquist rules.

            http://s1291.photobucket.com/user/RichardLH/story/70051

            I get 37 months, 4 years, 7 years and 12 years as cyclic patterns so far. You?

          • Norman says:

            Whit,

            I think the point Dr. Spencer was making is that we now have a super precise means of meausring Arctic ice (satellites) that was not available at earlier times. What we have then is fuzzy data. If you look at a long term trend of 400,000 years.

            http://agwobserver.files.wordpress.com/2009/08/vostok_temp1.gif?w=1058&h=617

            From:
            http://agwobserver.wordpress.com/2009/08/24/rising-carbon-dioxide-concentration-stops-the-glacialinterglacial-cycle/

            You see large and rapid variations in temperature for the globe. These are not real precise measurements. The graph can give you a general idea that climate has rapid and considerable swings in temperature but it can’t give you the fine detail we have at our disposal.

            How many ships do you think they had sailing in the Arctic in 1938 to get precise measurements of arctic sea ice? Now we have satellite coverage.

            You may be correct about this warming (which seems to be AMO related at in glenncz post below) that it is really significant. But you need to be careful when comparing satellite era with an earlier one. The infromation may not transfer well.

          • Steve says:

            When ice-shelves that were at least 3000 years old collapse … it should be a sign that what we are seeing is most likely unprecedented for at least 3000 years.

            I should certainly hope so! remember that much of the planet was covered in ice at the peak of the last glacial period only 19,000 years ago- it has been melting ever since- without the help of a single SUV. Pray this does not reverse in our lifetimes or we might really have something to worry about!

  25. Ade Lewis says:

    Quality! Excellent! Had me going, there.

  26. John K says:

    Hi Roy,

    In recent threads I’ve ran across the “97%” consensus meme. Apparently this results from some book by a character named Cook that claims 97% of the papers they investigated supported AGW alarmism. Unfortunately for Cook the authors of said papers disagree.

    According to a Human Events article:

    “Global warming alarmist John Cook, founder of the misleadingly named blog site Skeptical Science, published a paper with several other global warming alarmists claiming they reviewed nearly 12,000 abstracts of studies published in the peer-reviewed climate literature. Cook reported he and his colleagues found 97 percent of the papers that expressed a position on human-caused global warming “endorsed the consensus position that humans are causing global warming.”

    The article also stated:

    “Investigative journalists at Popular Technology looked into which papers were classified within Cook’s asserted 97 percent. The investigatiors found Cook and his colleagues classified papers by such prominent, vigorous skeptics as Willie Soon, Craig Idso, Nicola Scafetta, Nir Shaviv, Nils-Axel Morner, and Alan Carlin as supporting the 97 percent consensus.”

    They cited skeptics as supporting AGW. The skeptics interviewed later denied supporting AGW. You can check out the article at the link below.

    http://www.humanevents.com/2013/06/18/climate-alarmists-caught-doctoring-97-percent-consensus-claims/

    • John K says:

      To All,

      In my post above I wrote:

      “Unfortunately for Cook the authors of said papers disagree.”

      I should have written:

      Unfortunately for Cook some of the authors of said papers disagree.

    • Steve says:

      usually the definition of ‘supporting global warming’ used comes down to acknowledging some technical forcing of CO2, whereby almost all skeptics would be included. Then it’s strongly implied that it refers to Hollywood disaster movie scenarios.

  27. Brian D says:

    Interesting to see how the melt is going in the Beaufort Sea region (Western Canadian Arctic region)
    http://ice-glaces.ec.gc.ca/prods/CVCSWCTWA/20130617180000_CVCSWCTWA_0007117614.gif

    http://ice-glaces.ec.gc.ca/prods/CVCHDCTWA/20130617180000_CVCHDCTWA_0007117616.gif

    Looks like only 1999 was slightly higher than this year since 1981 for this last week. We could see quite a rebound in ice coverage this year in the basin. Only time will tell.

  28. Slipstick says:

    Indeed, the 1930’s were quite warm; this lasted about a decade. Currently we’ve had three consecutive decades of warming. The Northwest Passage has been open four consecutive years and glaciers have receded to sizes not seen in thousands of years. Trying to equate these two periods is at best erroneous, at worst dangerously disingenuous.

  29. glenncz says:

    is the Arctic any warmer than it was in the 1930’s
    HADCRUT4 says no.
    http://www.climate4you.com/Polar%20temperatures.htm
    How about this paper.
    http://www.lanl.gov/source/orgs/ees/ees14/pdfs/09Chlylek.pdf
    The Arctic warming from 1910-1940 was significantly faster than from 1970-2008
    Arctic temp are HIGHLY correlated with the AMO.
    While arctic temp.’s might be a bit higher than the 1930-1940 warming, the AMO is also higher. See fig 3 in above paper and see here for AMO
    http://www.climate4you.com/SeaTemperatures.htm#AMO (Atlantic Multidecadal Oscillation) Ind
    Doesn’t it make more “common sense” that an enormous change in the oceans plays more of a role than 1 part in 20,000 parts of the atmosphere changing from something else to CO2?

    • Dr. Strangelove says:

      Yes Arctic warming in 1930s was probably due to AMO. Ocean drives atmosphere. But what drives the ocean when it is warming? Thermal expansion, sea level rising. That requires lot of heat. Only sun can provide that much energy? How? Solar variation? Clouds? If sea is rising faster than in last 100,000 yrs, all those natural variations not operating for thousands of yrs? Only now? Or is it CO2 which is now highest in 100,000 yrs.

      Easy to explain 20th century warming. It is known doubling CO2 will increase temperature by 1.1 C without feedback. This already explains half of the warming in 20th century since extrapolating the temp. and CO2 data give 2C climate sensitivity. We have to explain the other half of observed warming. IMO it is due to positive feedback of water vapor. Burning gasoline produces almost same no. of CO2 and H2O molecules. Plus warming ocean surface leads to more evaporation, more water vapor, more CO2.

      It’s a neat hypothesis. It’s the energy of the sun captured by greenhouse gases CO2 and H2O. What else could it be?

      • John K says:

        Dr. Strangelove or How I Learned to Stop worrying and conjure up the data,

        You wrote:

        “Or is it CO2 which is now highest in 100,000 yrs.”

        Fascinating, can you cite the ancient civilization and individuals who measured CO2 levels at that time? Perhaps some caveman variant of NOAA. You also claimed:

        “It is known doubling CO2 will increase temperature by 1.1 C without feedback.”

        Really? It couldn’t be 1.2 C could it? Since feedbacks always exist, you derived that figure precisely how? What model did you use to fabricate the completely unobserved? Could it be the same models discussed in the previous thread?

        Then again you wrote:

        “This already explains half of the warming in 20th century since extrapolating the temp. and CO2 data give 2C climate sensitivity.”

        How did you arrive at the global temperatures for most of the 20th century when satellites capable of measuring it existed only since 1979?

        BTW, as I’ve mentioned before I have no quarrel with the concept of glacial decline over thousands of years. Your precise measurement claims for unobserved phenomenon begs a question. Do you claim psychic powers? You’ve induced me to repeat a previous quote.

        “There is something fascinating about science.
        One gets such wholesale returns of conjecture
        out of such a trifling investment of fact.”
        Mark Twain.
        Life on the Mississippi

        • Dr Strangelove says:

          I will not waste time replying to you. It’s obvious you don’t know anything about climate science. Do your homework so you can say something sensible.

          • John K says:

            Of course you won’t reply, because you do not have the data. Apparently, I know a great deal more about climate science let alone the Socratic/scientific method than yourself since you have yet to provide the empirical source for your data in your post.

      • Norman says:

        Dr. Strangelove,

        I am not sure if the source of your information on thermal expansion is correct. Or the subject is so subjective that each group gives a different answer, or the calculations are very complex with potential for different outcomes.

        Here is a quote from an article on the topic.
        “1993–2007. Over 1993–2007, the altimetry-based rate of sea level rise was 3.3 ± 0.4 mm year−1.
        Mean thermal expansion rate (average of Levitus et al. 2009 and Ishii & Kimoto 2009 values over
        their common time span) is 1.0 ± 0.3 mm year−1. The rate difference between observed sea level
        rise and mean thermal expansion is 2.3 mm year−1. This represents the ocean mass increase (plus
        eventually a deep ocean thermal contribution). For the glaciers’ contribution since 1993, we use
        Kaser et al. (2006) and Meier et al. (2007) updates, leading to a value of 1.1 ± 0.25 mm year−1.
        Although ice sheet mass loss is clearly not linear (see Figure 5a,b), we deduce from a compilation
        of published results a mean contribution to sea level of ∼0.7 mm year−1 for the two ice sheets
        (∼0.4 mm year−1 for Greenland and ∼0.3 for Antarctica). This leads to a total ice component of
        ∼1.8 mm year−1, lower than the 2.3 mm year−1 residual rate. As in IPCC AR4 for 1993–2003,
        the sea level budget is not totally closed. But over 1993–2007, the mass component dominates the
        thermal component (unlike over 1993–2003).”

        Source:
        http://www.google.com/url?sa=t&rct=j&q=&esrc=s&frm=1&source=web&cd=10&ved=0CGgQFjAJ&url=http%3A%2F%2Fwww.icess.ucsb.edu%2F~davey%2FGeog163%2FReadings%2Fannurev-marine-120308-081105.pdf&ei=Yc3DUa7wBenVyAHyp4HACg&usg=AFQjCNHJaWjocSQ51YbrE0sdTNQXiRZG-Q

        • Dr Strangelove says:

          Of course different time periods will give different results. The numbers are clear 3.3 mm/yr over last 20 yrs; 17 cm last century. Nothing controversial there. Some put thermal expansion at 14 cm, others lower. It doesn’t matter because the heat needed is 150x greater than melting same mass of ice. The conclusion is same: unprecedented warming in 100,000 yrs. The physics and math are basic and straightforward. No need for speculation and complex modeling.

          • Massimo PORZIO says:

            One day I attended a seminar where an important high-end instruments maker presented its newest models of RF Network Analyzers (NA).
            Those days they introduced a new kind of calibrators.
            Who works with RF NA well knows the importance of calibrating any single input to get the right results from the instrument and well knows how much time one has to spend doing that procedure for any port.
            For the first time, they made those calibrators automatic, so that they reduced by a factor of three the time of the calibration. That because the user had to fit it at the input port one time only instead of three times.
            Well, everybody were glad to hear about that great improvement.
            All except one.
            He was a university professor who asked the engineer who was doing the presentation what was the precision limit of that kind of calibrators.
            He asked if those calibrators were capable of get a calibration of 0.01dB.
            The engineer waited a little (probably asking himself “who cares of one hundredth of decibels?”) and greatly answered to the professor that the simple fact that if he strengthen the rf connector a little more or a little less the resulting error would be greater than 0.01dB.
            That was a good example of what I mean when I wrote that there must be a clear difference in the concept of “measurement” between some scientist and the engineers.

            Have a great first summer day.

            Massimo

          • John K says:

            Dr. Strangelove,

            You claimed:

            “The numbers are clear 3.3 mm/yr over last 20 yrs; 17 cm last century. Nothing controversial there.”

            Unless of course you derived the 3.3 mm/yr figure from the same University of Colorado graphs presented earlier, in which case figure doesn’t represent raw measurements but has been altered by multiple “adjustments” including global isostatic adjustments based on assumptions/conjecture regarding a supposedly expanding sea basin.

            You go on to speculate:

            “The conclusion is same: unprecedented warming in 100,000 yrs. The physics and math are basic and straightforward. No need for speculation and complex modeling.”

            Any claims as to temperature, CO2 or any other supposed measurements going back 100,000 years involves multiple assumptions/conjecture (many likely false). As to the physics and math it would be nice if you presented some you have consistently refused to do so in support of such speculation on many posts.

  30. tonyb says:

    Roy

    I referenced the Zubov book and provided a link to it in my article here in April

    http://judithcurry.com/2013/04/10/historic-variations-in-arctic-sea-ice-part-ii-1920-1950/

    The article contains hundreds of other scientific references to the warming arctic in the period, as well as many from the media. There is a separate as yet unpublished longer version of the article I wrote with many more references.

    The Kinnard data and other sea ice charts representing the period appear to be incorrect for reasons explained in the article. Warming then -and sea ice loss-was something approaching that of the modern era but ice melt probably not as great as in 2007 and 2012.

    Would you like me to send you the much longer document which is in ‘Word’ format?

    I suggested to Neven that we might usefully attempt to reconstruct accurate sea ice charts for the period but he was too busy. Perhaps you-or someone you could nominate- might find this a worthwhile project?
    (nice blog)

    Tonyb

    • John K says:

      Tonyb,

      Thanks for the link. Do you know if Zubov’s book contains photos or supporting evidence for his claims?

    • John K says:

      Hi Tonyb,

      My question in the previous reply didn’t come off quite right. Rather, I simply wanted to know which books or articles contain photographic evidence for support. It would be fascinating to compare visual data comparing various arctic locations today with the same locations over half a century ago. Thanks.

  31. TINSTAAFL says:

    Neven is too busy for real science, only science that suits his personal believe that AGW armageddon is near will be interesting for him.

  32. tonyb says:

    JohnK

    Here is a direct link to the book.

    http://www.scribd.com/doc/70835248/Arctic-Ice-1963

    Most of it is paywalled but some can be read and there are a number of graphics/diagrams . I saw the original at the Scott Polar Institute (I think) in Cambridge. I think there were several groups of black and white photographs after the fashion of the period but I read so many books I couldn’t swear to it.

    Some of the other links that can be accessed in full or part via my article certainly had photos (but whether they are paywalled I don’t know).

    There were some good photos taken from the floating research stations on ice bergs and I remember seeing one of the water sitting on the ice, which promoted a comment by me in the article and as a result I asked Julienne Stroeve to give us a definition of ‘ice.’
    tonyb

  33. John K says:

    tonyb,

    Thanks for the link to the book. When I have free time I will persue it and possibly post what I think. Thanks again.

  34. curious says:

    tonyb

    Have you seen this new journal?

    http://www.journals.elsevier.com/weather-and-climate-extremes/

    I wonder if you could submit a paper (or more) on your work?

  35. MikeB says:

    This reminds me of one of the slides in a presentation by Profesor Richard Lindzen.

    “THE ARCTIC OCEAN IS WARMING UP, ICEBERGS ARE GROWING SCARCER AND IN SOME PLACES THE SEALS ARE FINDING THE WATER TOO HOT. REPORTS ALL POINT TO A RADICAL CHANGE IN CLIMATE CONDITIONS AND HITHERTO UNHEARD-OF TEMPERATURES IN THE ARCTIC ZONE. EXPEDITIONS REPORT THAT SCARCELY ANY ICE HAS BEEN MET WITH AS FAR NORTH AS 81 DEGREES 29 MINUTES. GREAT MASSES OF ICE HAVE BEEN REPLACED BY MORAINES OF EARTH AND STONES, WHILE AT MANY POINTS WELL KNOWN GLACIERS HAVE ENTIRELY DISAPPEARED.”

    Washington Post (Associated Press), November 2, 1922
    http://news.google.com/newspapers?id=0bVaAAAAIBAJ&sjid=AlQDAAAAIBAJ&pg=5277,376085&dq=too+hot+for+seals&hl=en

    I like the bit about the water being too hot for the seals.

  36. The way above average sea ice in Antarctica ,shows the decline in the Arctic sea ice is not due to global man made warming.

    End of story.

    • Glenn Tamblyn says:

      Actually no.

      The slightly above average sea ice in the Antarctic is only 1/5th of the decline in the Arctic.

      And the rise in Antarctic sea ice is due to warming. As more freshwater ice on Antarctica melts the oceans around Antarctica become less saline. This raises the freezing point for the sea water closer to zero, so it is easier to form ice.

  37. Thinker says:

    What the Arctic does is a long way from being representative of global climate. Temperatures rose very steeply there in the late 1930’s and reached peaks which are comparable with current temperatures.

    I don’t deny that there is a long-term natural global rise of about half a degree C per century, which will continue for about 500 years following the Little Ice Age. But then there can be expected 500 years of long-term cooling.

    Some of the longest records for any one location are at Armagh Observatory in Northern Island. These show a steady linear trend from 1796 with an increase of about 0.6 C degree per century. Those temperatures are representative of the ocean currents which flow past there and into the Arctic Ocean. But the rate of flow can affect the rate at which ice melts from below.

    All global climate is under the influence of natural cycles probably governed in some way by planetary orbits. Water vapour (the main “Greenhouse gas”) causes temperatures in moist regions to have lower temperatures than drier regions at similar latitude and altitude. This is easily established with a study of sufficient real world data. But the IPCC thinks places with ten times as much precipitation should warm ten times as much above that proverbial 255K.

  38. Stephen Richards says:

    Roy

    AQUA Channel6? Another problem or stratospheric warming ?

  39. Jeff Condon says:

    Quite an eccentric pile of comments you have acquired for rather an interesting post. A bit weighing on your use of time I’m sure.

    Still, I did find the post interesting and unlike the 99% I’ve spent a fair chunk of time on polar ice.

  40. Norman says:

    John K and Dr Strangelove,

    Since the good Dr. would not provide the math for you Mr. K I thought I would give it a try. I think the Dr. could be off by 10 on his calculations and I am thinking is because that he used 0.5 C (which is just surface warming, maybe down to 700 meters) for the entire ocean.

    First we will see how much energy the ocean has accumulated as a whole.
    Start here:
    http://www.windows2universe.org/earth/Water/temp.html
    “Surface water temperatures obviously change from season to season and year to year, but the whole ocean has warmed about 0.1 degree Fahrenheit (0.055 degree Celsius) in the past 30-50 years.”

    My original post got stuck in moderation, I believe because the post contained too many links in it. I will break it up and repost.

  41. Norman says:

    Now here:
    http://hypertextbook.com/facts/1998/AvijeetDut.shtml
    “1.37 × 10^21 kg” mass of oceans.

    Then here:
    http://www.engineeringtoolbox.com/heat-work-energy-d_292.html
    4190 joules to raise 1 kg/1 C

    Take (4190 joules/kg C)(0.055 C)= 230.45 joules/kg
    (it takes 230.45 joules to raise 1 kg 0.055 C)

    Now take (230.45 joules/kg)(1.37 x 10^21kg)= 3.157 x 10^23 joules. It takes this many joules to raise the entire ocean mass 0.055 C.

  42. Norman says:

    Now go to energy required to melt ice.
    Start here:
    http://climatesanity.wordpress.com/conversion-factors-for-ice-and-water-mass-and-volume/
    “1 mm / (2.78 microns / Gt) = 10-3 m / (2.78 x 10⁻⁶ m / Gt) = 360 Gt”

    Requires 360 gigaton (metric) ice to raise sea level 1 millimeter.
    1 gigaton =10^9 metric tons or 10^12 kg (1000 kg/metric ton)

    1000 millimeters equals one meter so it would take 360,000 gigatons of ice to raise the oceans by a meter. This would equal 3.6 x 10^14 gigatons, now multiply by 1000 to get kilograms. 3.6 x 10^17 kilograms of ice would raise sea level by one meter.

  43. Norman says:

    Then here:
    https://en.wikipedia.org/wiki/Enthalpy_of_fusion
    Heat of fusion of water is 334 kj/kg
    Takes 334000 joules of energy to melt a kilogram of ice.

    One meter of sea level rise would take 3.6 x 10^17 kg so take (3.6 x 10^17 kg)(3.34 x 10^5 joules/kg)=
    1.202 x 10^23 joules of energy needed to melt enough ice to raise the sea level 1 meter.

    The energy gained by the oceans the last few decades is
    3.157 x 10^23 joules
    you need 1.202 x 10^23 joules to melt enough ice to raise sea level by a meter.

    So a sea level rise of 2.6 meters would be the apples to apples for thermal expansion vs ice melt not the 25 the good Dr. had posted on an earlier thread.

    I find it hard to believe that in a 100 year period when the sea level changed 140 meters in 20,000 years or 200-100 year periods in that time, that none of that matched the current energy stored in the oceans.

    If I did the math wrong let me know, I think Dr. Strangelove miscalculated by 10 assuming the entire ocean has warmed 0.5 C where it is actually 10 times smaller at 0.055.

    • John K says:

      Hi Norman,

      Thanks for all the internet data trolling and some calculations. However, please know I’m quite familiar with Newtonian mathematics (calculus)and some physics. My issue with the Dr. Strangelove or How I Learned to Stop Worrying and Love the Speculation (We could just refer to him as Peter Sellers if you like, since he played the role of Dr. Strangelove in the original 1964 Stanley Kubrik nuclear holocaust satire by the approximately the same name “Dr. Strangelove or How I Learned to Stop Worrying and Love the Bomb”) reduces to the empirically observed fact that he relies on complete speculation for many if not most of his conclusions. I take no issue with any observed data he may present except those such as the University of Colorado sea surface data in which the raw measurements have been “adjusted” in accord with assumptions made by researchers who’s objectivity should never be assumed. You can find my comments regarding this in earlier threads.

      Please know I will post additional comments regarding your many interesting comments later. Thanks again, but I’m pressed for time.

  44. Dan Pangburn says:

    CO2 increase from 1800 to 2001 was 89.5 ppmv (parts per million by volume). The atmospheric carbon dioxide level has now increased since 2001 by 25.46 ppmv (an amount equal to 28.4% of the increase that took place from 1800 to 2001) (1800, 281.6 ppmv; 2001, 371.13 ppmv; May, 2013, 396.59 ppmv).

    The average global temperature trend since 2001 is flat

    Rationalize that the temperature increase to 2001 was caused by a CO2 increase of 89.5 ppmv but that 25.46 ppmv additional CO2 increase had no effect on the average global temperature trend after 2001.

    A simple equation at http://climatechange90.blogspot.com/2013/05/natural-climate-change-has-been.html calculates average global temperatures since they have been accurately measured world wide (about 1895) with an accuracy of 90%, irrespective of whether the influence of CO2 is included or not. The equation uses a single external forcing, a proxy that is the time-integral of sunspot numbers. A graph is included which shows the calculated temperature anomaly trajectory overlaid on measurements.

  45. sky says:

    Dare I say that Roy’s presentation warmed my heart?

  46. Thinker says:

    Is the Arctic warming? Yes, like everywhere else, with a long-term trend for 500 years rising out of the Little Ice Age at the rate of about half a degree per century, due to turn to cooling at least within 200 years.

    http://img854.imageshack.us/img854/2865/xkbx.jpg

    But it’s no hotter than it was in the late 1930’s and early 1940’s.

    http://img843.imageshack.us/img843/5030/pso0.jpg

    Is there a super-imposed 60 year natural cycle that caused all the alarm during the 30 years of rising prior to 1998. Yes.

    http://img27.imageshack.us/img27/2496/otc3.png

    But it’s all natural. Every bit of it – and nothing whatsoever to do with carbon dioxide, radiative forcing, back radiation, greenhouse effects or any such travesties of physics.

  47. Hi, great page however there is a problem whereby on occassion I am sent back to the main page whenever I view different topics in this web page.

  48. David Springer says:

    The pause in rising GAT is probably due to decreasing sea ice. I proposed years ago that Arctic sea ice acts like the thermostat in an automotive water cooling system. A simple mechanism whereby when water temperature rises metal expands and allows more water to flow between engine and radiator. Sea ice is a wonderful insulator and makes it difficult for heat to escape from the ocean. So the tropical ocean is the “engine”, the frigid Arctic sky is the “radiator” and sea ice is the “thermostat”. Exposing more of the warm water from the tropics to cold polar sky speeds up the rate of cooling. Easy peasy. Sometimes things are made more complicated than they need be.

  49. always a massive fan of linking to bloggers that I really like but do not get quite a bit of link appreciate from…

  50. I appreciate your quality stuff, that was really so useful and informative.

Leave a Reply