Global Microwave SST Update for May 2013: -0.01 deg. C

June 5th, 2013 by Roy W. Spencer, Ph. D.

The satellite-based microwave global average sea surface temperature (SST) update for May 2013 is -0.01 deg. C, relative to the 2003-2006 average (click for large version):
RSS_mwSST_2002_thru_May_2013

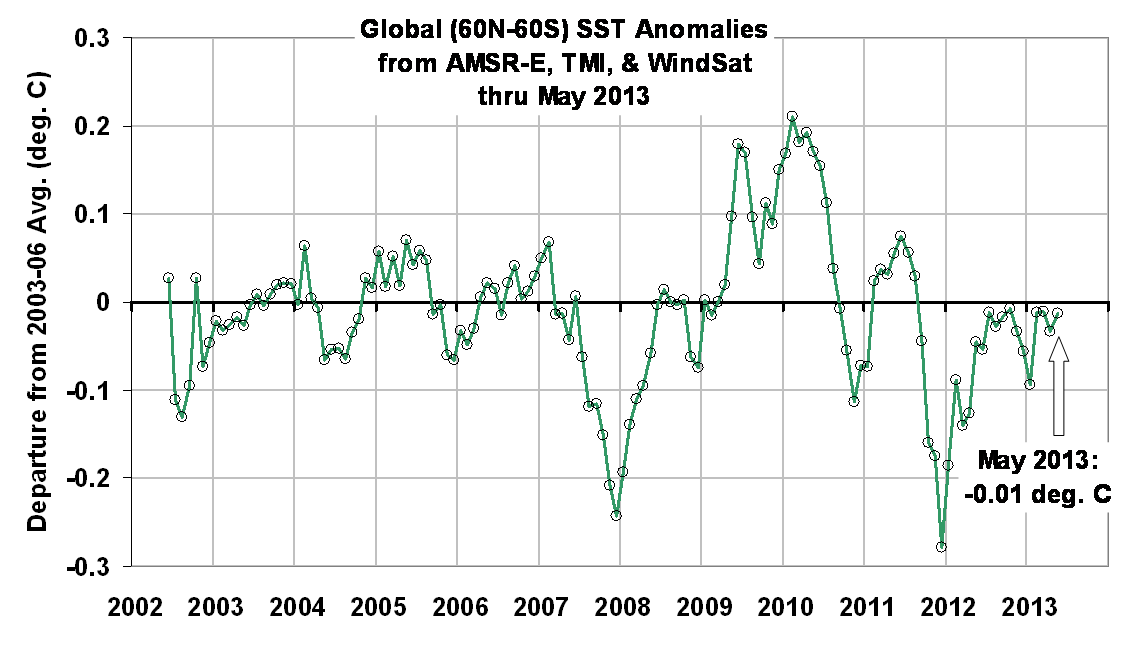
The anomalies are computed relative to only 2003-2006 because those years were relatively free of El Nino and La Nina activity, which if included would cause temperature anomaly artifacts in other years. Thus, these anomalies cannot be directly compared to, say, the Reynolds anomalies which extend back to the early 1980s. Nevertheless, they should be useful for monitoring signs of recent ocean surface warming, which appears to have stalled since at least the early 2000’s. (For those who also track our lower tropospheric temperature [“LT”] anomalies, these SST anomalies average about 0.20 deg. C cooler than LT since mid-2002, but there is considerable variability in that number).

The SST retrievals come from Remote Sensing Systems (RSS), and are based upon passive microwave observations of the ocean surface from AMSR-E on NASA’s Aqua satellite, the TRMM satellite Microwave Imager (TMI), and WindSat. While TMI has operated continuously through the time period (but only over the tropics and subtropics), AMSR-E stopped nominal operation in October 2011, after which Remote Sensing Systems patched in SST data from WindSat. These various satellite SST datasets have been carefully intercalibrated by RSS.

Despite the relatively short period of record, I consider this dataset to be the most accurate depiction of SST variability over the last 10+ years due to these instruments’ relative insensitivity to contamination by clouds and aerosols at 6.9 GHz and 10.7 GHz.


20 Responses to “Global Microwave SST Update for May 2013: -0.01 deg. C”

Toggle Trackbacks

  1. Scott Scarborough says:

    This sea surface temp. and the Mid Tropospheric air temp. are down slightly this month. But with all the new about record cold from the USA, UK, Scandinavia, Europe one would think that average temperatures for the earth would be much lower. Where are the hot places on the earth to average out against all this record cold?

  2. If Northern Hemisphere land areas are unusually cool, this often implies a circulation pattern where the N.H. ocean areas are unusually warm.

    I’m not saying it’s necessarily the case in this instance, but when cool air masses happen to coincide with major population centers, it doesn’t mean the whole Earth is cool any more than warm air setting up over those same centers means the whole Earth is warm.

    • Rob Shaw says:

      Dear Roy
      Have you had any more thoughts on the whereabouts of Kevin Trenberth’s 0.9 w/m^2 of missing heat??
      If the trapped heat is not warming the atmosphere or the top of the ocean, it surely must be going into the deep ocean,>2000 metres, where we do not measure anything. It must be transported there by the Thermohaline Circulation (17 million m^3/sec). We could lose this amount of energy down there for hundreds of years and not know about it, except that we will run out of fossil fuel in less than a hundred years.
      Regards,
      Rob

      • John K says:

        Hi Rob,

        You stated:

        “We could lose this amount of energy down there for hundreds of years and not know about it, except that we will run out of fossil fuel in less than a hundred years.”

        What do you label as a “fossil fuel?”

        Allow me to briefly address each of the three most commonly labeled fuels.

        Coal: Found in the form of lignite, bituminous and anthracite deep within the earth with fossil remains. American coal deposits remain largely untapped. No serious geologist believes coal will run out in the next 100 or even 200 years. World supplies remain extensive. However, some regions like Germany which only have small amounts of the least energy dense lignite coal may panic and burn what stock they have, but this seems unlikely.

        oil/petroleum: While near surface deposits show the telltale organic signature carbon-13 deficit. Deep deposit do not have a carbon-13 deficit and will most likely be inorganic. Enormous quantities of petroleum remain throughout the world and more geologists find new fields all the time. Proven U.S. reserves remain over a trillion barrels, last I checked steadily increasing every year. Most U.S. land cannot be drilled for oil, excepting the oil patch and Alaska.

        Natural gas: Methane, a volcanic gas, comprises over 80% of the natural gas deposits. Astrophysicist Thomas Gold claimed that iron oxide, calcite and water will under intense heat and pressure (around 50k giga-pascals), if I remember correctly) form hydrocarbon methane. Such heat and pressure presumably exists deep within the earth. I’ve read that Sandia Labs using lasers produced methane from these three compounds mentioned. In addition, methane vents from the earth’s surface throughout the planet including the bottom of the ocean where it will often form methane hydrates. Natural gas for the most part derives in-organically. Dr. James Gordon Prather wrote that many isolated geological formations retain so much natural gas that engineers and petroleum/gas extraction companies cannot remove the gas fast enough to produce even a decline in pressure from within the earth.

        If coal, which alone among the three mentioned, will not likely be replaced over the next several hundred years people can always switch to other hydro-carbons. In any case, the conclusion that “fossil fuels”, if by that you mean the earth’s hydrocarbons will all run dry in the next 100 years based on human consumption has long ago proven scientifically untenable and far less likely than the various temperature model predictions Roy posted on his blog.

        • John K says:

          Correction – My post stated:

          “If coal, which alone among the three mentioned, will not likely be replaced over the next several hundred years people can always switch to other hydro-carbons.”

          Should have stated: “If coal (which alone among the three hydrocarbons mentioned appears to be completely of organic origin) deposits fall too low people can switch to the other hydrocarbons.”

          My post stated: “Most U.S. land cannot be drilled for oil, excepting the oil patch and Alaska.” It should have read:
          “Most U.S. land cannot legally be drilled for oil, excepting the oil patch and Alaska.”

      • Stuart L says:

        The plant biosphere according to satellite observations have increased by 11% (not counting subsurface biomass) that is a lot of heat locked up as chemical energy!

  3. Espen says:

    Scott – no record cold in Scandinavia any more in May, in fact it’s been record hot in the high (arctic) part of Scandinavia lately. Here’s an example, the town of Kautokeino, which has an anomaly of +5.5 for the last 30 days: http://www.yr.no/place/Norway/Finnmark/Kautokeino/Kautokeino~298383/statistics.html

    – and set a new record high for May (+28 C).

  4. Chris says:

    Hi,

    I notice in many topics the Nino/Nina events are somehow regarded as an external influence. Aren’t they a result of the climate system and a mechanism that stores and releases energy. I can see how volcanic events can be considered as random and external. So shouldn’t we include the Nino/Nina events – just like nature has.

    With appreciation for the work you do.

  5. Richard LH says:

    It is interesting to see what happens if you take a set of low pass filters and apply them to this data.

    The simplest one to implement on the web or in a spreadsheet is by using the familiar central output of moving monthly averages. Unfortunately this has severe digital sampling errors if just used as a single pole filter, as is often the case in Climate Science.

    Much better is to use a simple multiple pole filter with values for each step that gives minimal digital sampling errors in the pass band. This can be achieved by using successive moving monthly averages with longer values and 1.3371 as the multiplier between steps.

    One of the simplest (and one that can often be used with data that has already been filtered once) is the sequence, 12, 16, 18, 21, 28, 39….. months. Other sequences are possible but this one has one of the smallest sampling errors in the pass band and also uses 12 months as one of the passes (and that is very often used elsewhere already).

    Obviously the longer filters only produce output in the center of the input range but the shorter ones give clues as to how the longer ones will progress later in time.

    If you plot the input values and all of the filter outputs on a single, scatter plot graph then you can create a reasonable overview of what the data is actually showing about natural proccess, how much they influence the output and what cycles may need to be accounted for. This is with very small processing overhead and potential data bias I believe.

    There are obvious ~3 year, ~5 year and ~60 natural patterns visible in the ouput for which I do not have an explanation but others may be able to help.

  6. Richard LH says:

    Interestingly, the filter outputs rather nicely converge on a 3rd order polynomial fit to the input data. That could give a valid reason for its re-inclusion on the graph!

  7. Richard LH says:

    Given that there appears to be strong 37 month, 48 month and ~60 year periodic features in the data I feel confident enough to give this prediction from the data observed so far.

    The 12 moving averages of the data will not fall below +0.13 until late 2013 to mid 2014.

    After that period the values will then fall further with a minimum of below -0.2 in the following 2 years or so.

  8. Byron Wooldridge says:

    I read the work referenced by David Hager above. It is very interesting in that it more closely aligns with real observations and measurements.

    I am not a climatologist so this may sound a dumb question: If the Earth were losing ice-sheet/cap coverage in terms of total mass, would that not tend to stabilize SSTs for a period of time and slow the changes worldwide due to the latent heat of fusion? I am not a alarmist climate-change believer but was wondering if the melting ice phenomenon would be applicable and was not considered in the IPCC models?

    One thing I have noticed that seems a bit strange. One would think that if the average temperatures were indeed increasing alarmingly, then the absolute high temperature records for given places should change. However, data I read from the records shows that most of the absolute records were set before the 1950’s and very few after.

  9. Chip Nihk says:

    http://www.c-change.la/pdf/LARC-web.pdf

    Really good insight into Think-Speak of the AGW Movement.

  10. thank, I thoroughly enjoyed scaning your article. I really appreciate your wonderful knowledge and the time you put into educating the rest of us.

  11. your website is very nice, the article is very enlightening, I wish you continued success.

Leave a Reply