U.S. Snowfall to decrease by 50% in 50 years!

May 8th, 2014 by Roy W. Spencer, Ph. D.

Following the release of the latest U.S. National Climate Assessment report, a new climate forecast visualization widget has just gone live today.

The National Climate Change Viewer (NCCV) allows you to visualize how climate models forecast temperature and precipitation to change over the next 50 years or so. You can examine either individual model’s projections, or the average of all of the models’ projections.

I just started playing with it, and the first thing that really that caught my eye was the dramatic decrease in total snowfall: a 50% decrease over the next 50 years, pretty much independent of calendar month. Here’s the graphic (click for larger versions of images):
NCCV-snowfall-decrease

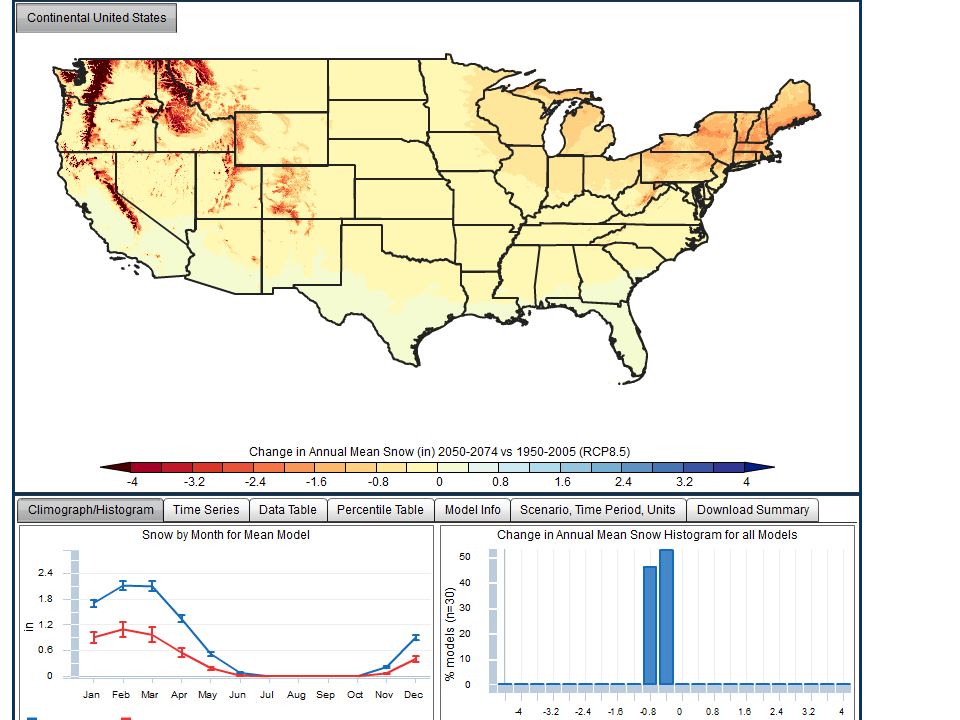
Note the largest decreases are in the mountainous areas of the west (where they get a lot of snow anyway), as well as over the Great Lakes and Northeast. It would be helpful if they also provided an option to plot the percentage change…a decrease of 10 inches of seasonal snowfall is a bigger deal in Iowa than it is in the mountains.

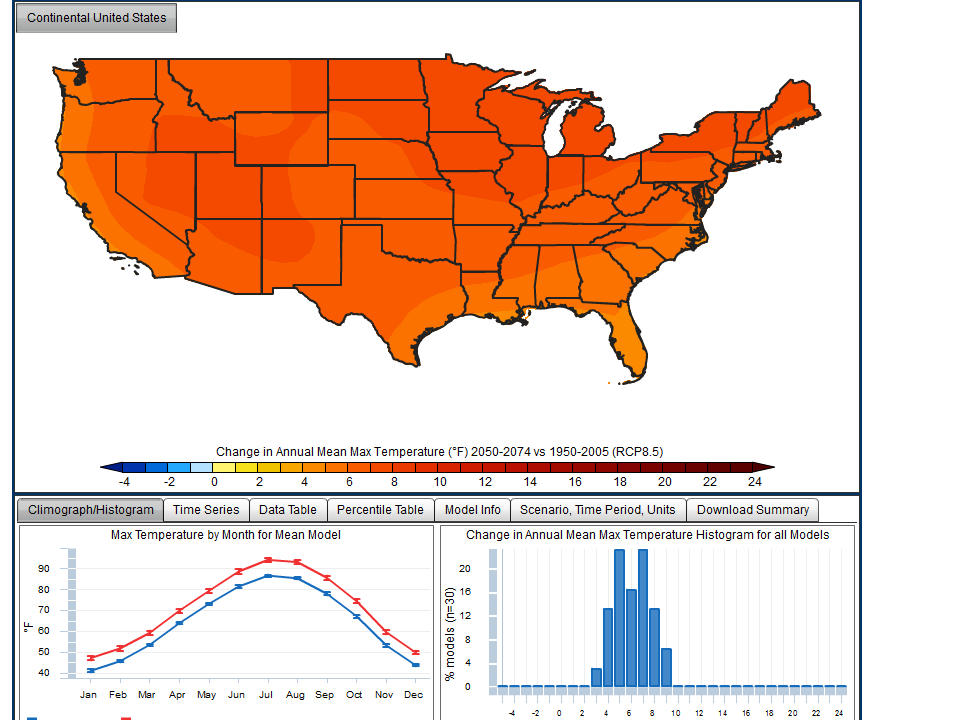
The forecast change in temperature just shows an almost uniformly red map (work on the color scales, guys) with the models forecasting generally 4 to 8 deg. F of warming for most of the U.S., in both daily maximum and minimum temperatures. Here’s the max temperature change graphic:
NCCV-Tmax-increase

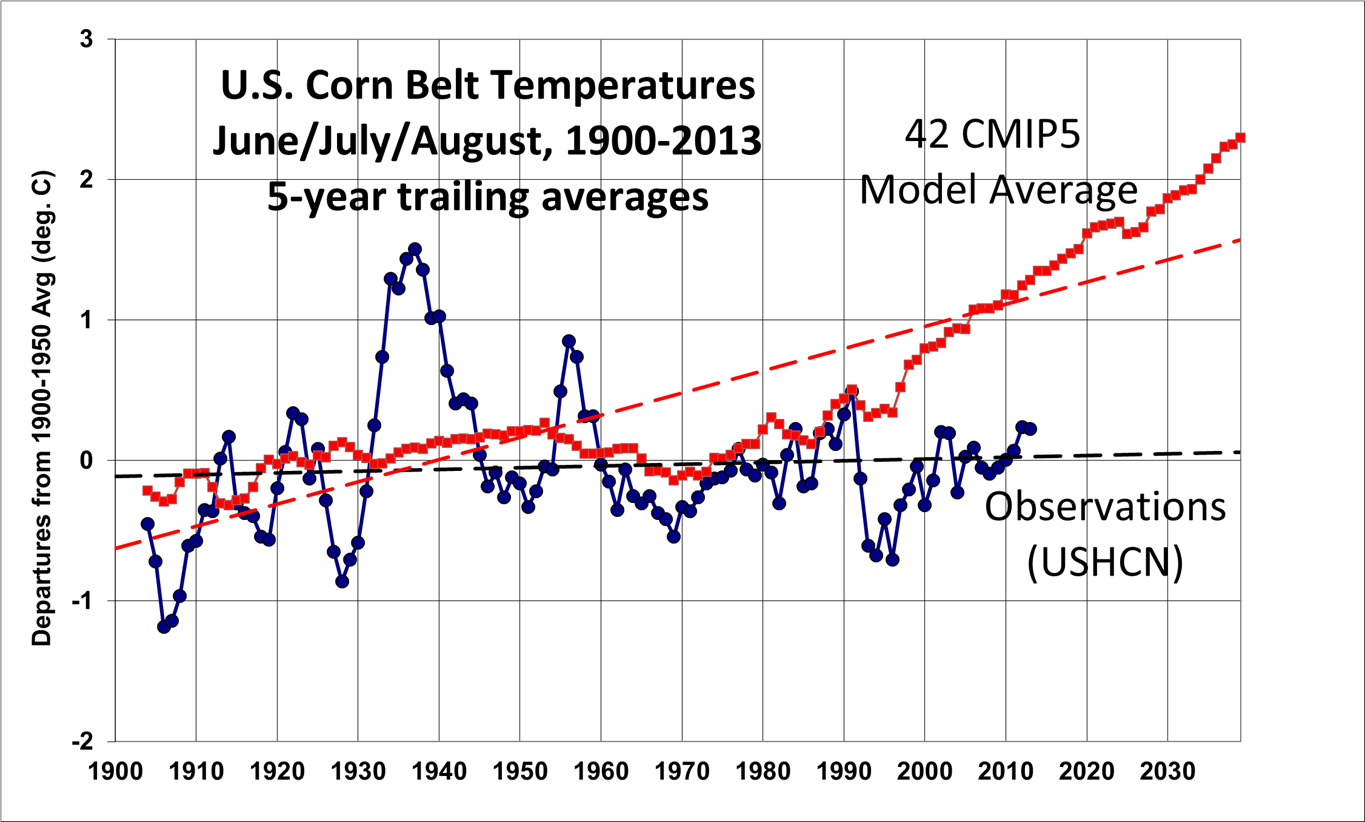
I’ve previously posted about the huge disconnect that is shaping up between the USHCN temperatures observed over the Midwest during the growing season and the climate model projections…eek!….
Corn-belt-CMIP5-models-vs-USHCN-temps

Setting aside the likely exaggerated forecast trends, the visualization tool, from the USGS and Oregon State University, is pretty cool, and is a useful public outreach tool for the science-savvy public. I’m sure they will improve it over time. Check it out.


26 Responses to “U.S. Snowfall to decrease by 50% in 50 years!”

Toggle Trackbacks

  1. Phyte On says:

    All I can say is, “We are doomed. The end is near.” There is no way that big government climate policy is capable, competent, and cost-effective to reverse/regulate climate change. Sack cloth and ashes. Woe is us. [sarc meter off]

    • well, the end isn’t THAT near. It’s still a ways off. Unless that deep-ocean heat suddenly burps out all at once. Then we’re screwed. 😉

      • Dave O. says:

        Concerning the burping of ocean heat. Why is it that the oceans, during the hockey stick runup in temps, decided NOT to store heat, whereas, during the past few years the oceans made a collective decision to store heat? There is probably a logical explanation that I’m not seeing.

        • lewis says:

          Oceans, like hurricanes are supposed, are female. So give up with the logical explanation request already.

  2. These predictions are not going to pan out for all the reasons you gave in the previous post not to mention some of my points.

    My thoughts those being:

    Initial State of The Climate
    Solar Variability
    Milankovitch Cycles
    Earth Magnetic Field Strength

    are being completely thrown out of the picture. I am not saying I am 100% correct but I think these aspects are in the running from one degree to another.

    The one I would think you would agree with would be the initial state of the climate. How far from glacial conditions if in inter- glacial or how close to inter-glacial conditions if in glacial.

    The closer the initial state of the climate is to the dividing line between these two states the more likely random/chaotic features of the climate could change it as you call for. As far as my thoughts the less variability would be needed ( for example solar,) if the climate was close to the glacial/interglacial state to exert a change.

    This is why maybe the climate had more dramatic swings 10,000-20,000 years ago, the initial state of the climate was closer to that line between glacial versus inter- glacial.

  3. I’m not sure why but this weblog is loading very slow for
    me. Is anyone else having this issue or is it a
    issue on my end? I’ll check back later and see if the problem still exists.

  4. Roy W. Spencer, Ph. D. says:

    May 8, 2014 at 8:48 AM

    …but even if we had perfect data and perfect knowledge of the forcings (which we don’t), we STILL might not be able to produce useful predictions. How the system RESPONDS is still largely unknown for some important variables that will determine the outcome(e.g. cloud feedback, precipitation efficiency changes).

    This is why the prediction will not pan out as Dr. Spencer says in the above.

  5. Mary Brown says:

    Hey Salvatore….or anyone

    I think I asked this before but can’t find it…

    Is there a place where I can find climate relevant astronomical data, both historical and forecast, in an easy to access format.

    That would be a big help.

    Thanks…

  6. Carson Wagan says:

    Did you start the CMIP5 runs at 1990 by any chance?

    Could you start at 1992 and show that plot?

    Also, I could not help but notice how well the hindcast
    was in your plot going back to about 1960. I thought
    you said models couldn’t hindcast?

    CW

  7. GO TO SOLARHAM.COM OR LAYMAN SUNSPOT SITE.

  8. david dohbro says:

    all actual historical data ends in 2005…. that’s almost a decade ago… I am sure there must be data from years after 2005 available. But maybe that data, such as snow cover, doesn’t fit the model so it’s omitted!?!?

  9. There is a wealth of climate data at the NCDC (National Climate Data Center) that archives climate data – follow this link (http://www.ncdc.noaa.gov/data-access/paleoclimatology-

    Mary that would be the last place I would look. They manipulate the data and have it conform to AGW as much as possible.

  10. Jimbo says:

    The IPCC says that ‘human influence’ has noticeably increased since the 1950s. Here is the result for winter snow extent in North America since 1967.

    Trending up.
    http://climate.rutgers.edu/snowcover/chart_seasonal.php?ui_set=namgnld&ui_season=1

    Spring is trending down while fall is up.

    Global warming is supposed to make itself felt most in winter in the higher latitudes. How was your last winter? Warm?

  11. The Weather Channel a mouth piece to spread the propaganda of global warming had a forum today hosted by Sam Champion.

    Can listen to the nonsense if one goes to the web-site weather.com

    I had to force myself to listen to all of the BS.

  12. Dr. Strangelove says:

    “U.S. Snowfall to decrease by 50% in 50 years!”

    I wish that’s true Roy because 43% of the world’s land is still covered with snow and ice on winter. Earth is damn too cold. Oh I forget we are still in an ice age.

    • John k says:

      Hi Dr Strangelove (Or How I Learned to Stop Worrying and Love the Warmth),

      • John k says:

        Hi Dr Strangelove (or How I Learned to Stop Worrying and Love the Warmth),

        Hmmm! I noticed the same thing in a previous post. We’d all do good to remember that the only historical evidence of mass extinction do to climate change remains the ICE AGE!!!

        Have a great day!

        P.S. Please excuse my accidental post. I’m not that use to posting comments from an I-Pad and I hit return by mistake.

  13. Josh says:

    LOL. Snowfall is dramatically INCREASING in the Great Lakes region since 2000, NOT decreasing. What a joke.

  14. Fernando Leanme says:

    The government “viewer” uses RCP8.5…. that scenario was “tricked” with very high methane concentrations, and the oil production profile isn’t realistic (it’s way too high above reasonable projections given the known oil resource base).

  15. stumble guys says:

    The last year for which we have complete historical data is 2005…. about a decade ago…. There has had to be more recent information than 2005. However, sometimes that information, like snow cover, is ignored since it doesn’t match the model.

Leave a Reply