Greening of Planet Earth: A Little Crowdsourcing Project

May 23rd, 2014 by Roy W. Spencer, Ph. D.

It has been documented that global warming has been accompanied by a general greening of land areas in recent decades, especially those which are semi-arid. While some areas of greening might be attributable to increased rainfall, carbon dioxide fertilization and longer growing seasons are also involved.

The satellite studies have been based upon visible sensor data that measures greenness. Heres the result of one recent study, which tried to just isolate the greening from CO2 fertilization (click image for full res version):
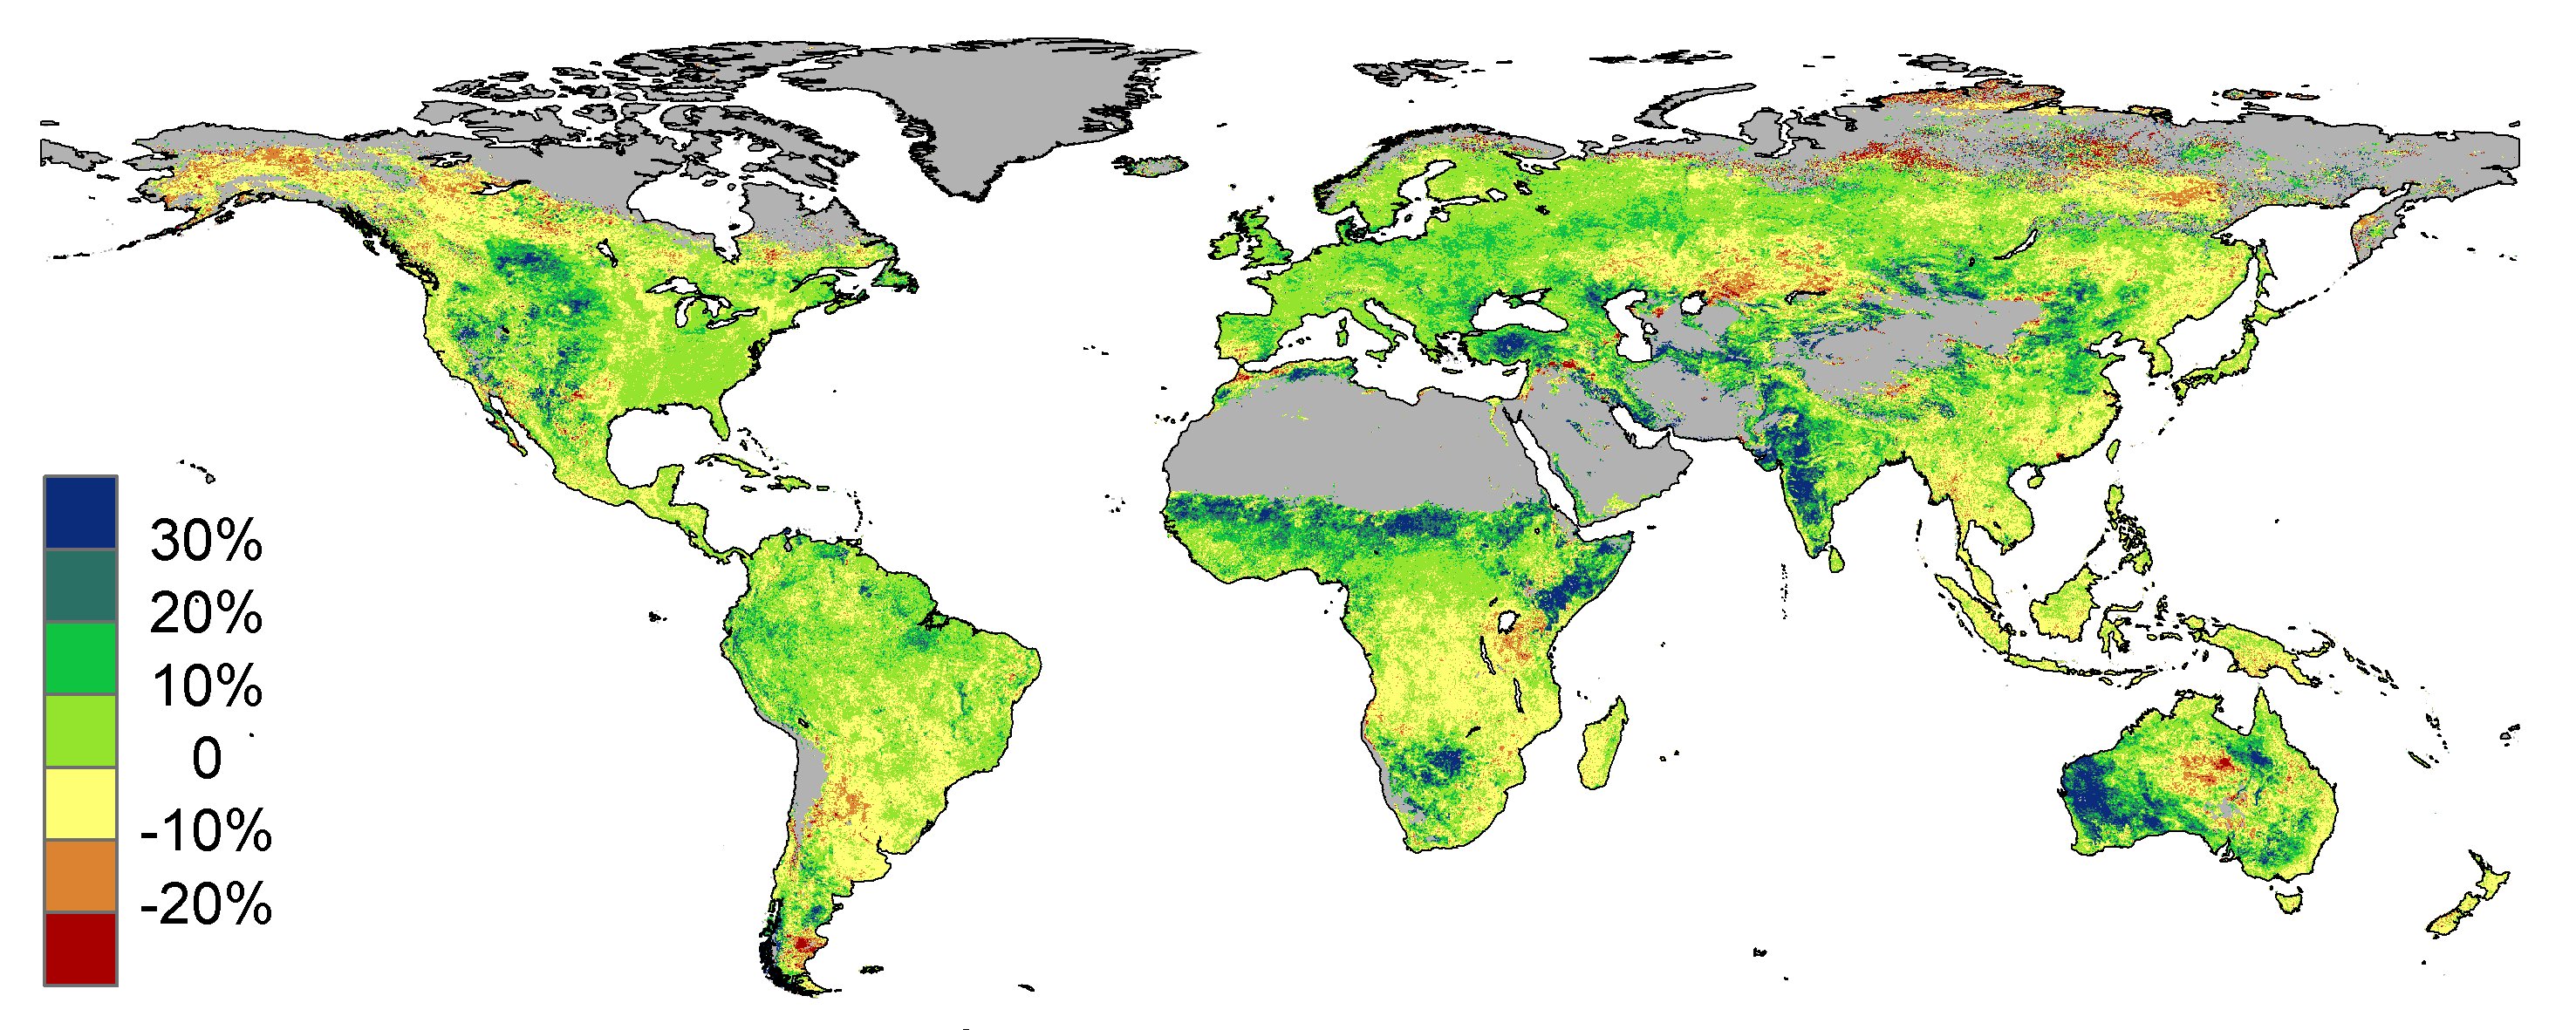
Estimated changes in vegetative cover due to CO2 fertilization between 1982 and 2010 (Donohue et al., 2013 GRL).

Estimated changes in vegetative cover due to CO2 fertilization between 1982 and 2010 (Donohue et al., 2013 GRL).

But we can also use passive microwave imager data, the best calibrated version of which is available since mid-1987 from the SSM/I and SSMIS series of instruments flying on the DMSP satellites. This gives us 26 years of microwave imager data to examine.

The simplest microwave vegetation index is just a difference between the vertically polarized and horizontally polarized channel brightness temperatures at 37 GHz. This polarization difference [V-H] can be thought of as primarily a measure of surface roughness. In heavily vegetated areas, such as Amazonia and the Congo Basin, the difference approaches zero, while sandy deserts and ice sheets are moderately polarized, as seen in the 26 year average of all Augusts (peak vegetation month in the Northern Hemisphere, click image for full-res version):
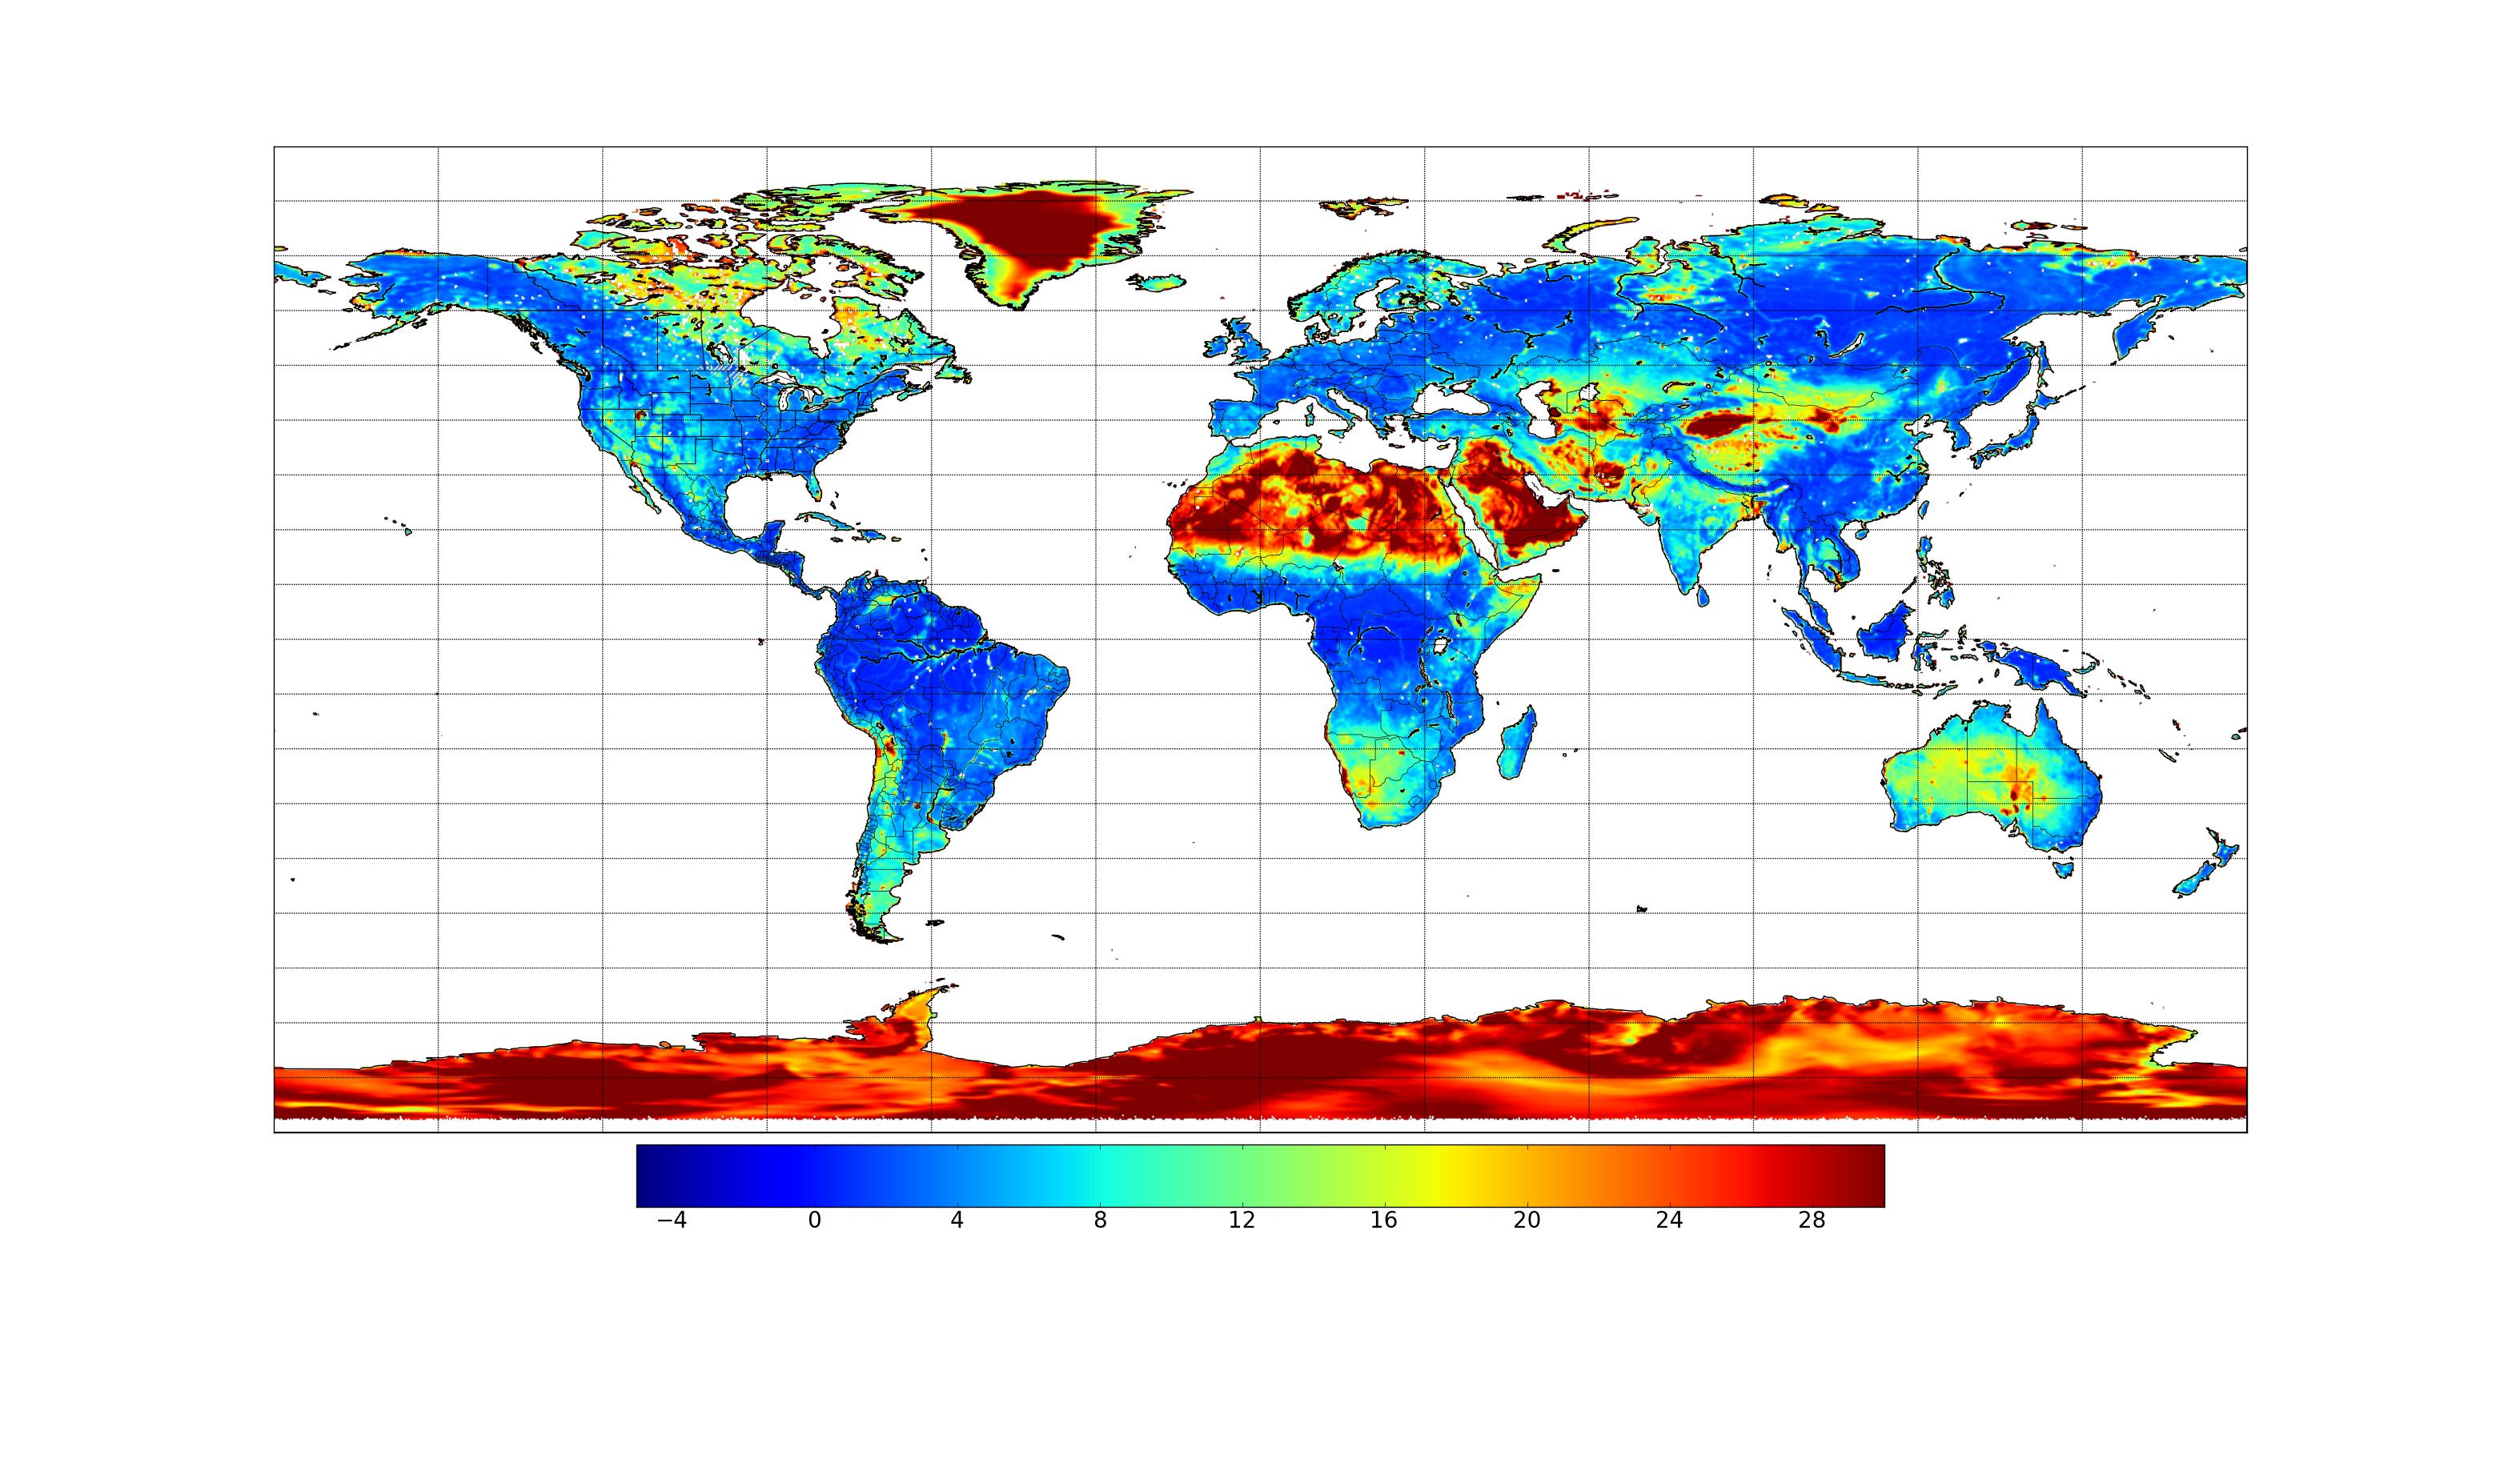
Average 37 GHz polarization difference for all Augusts between 1987 and 2013. Oceans and large water bodies have been made white.

Average 37 GHz polarization difference (deg. C) for all Augusts between 1987 and 2013. Oceans and large water bodies have been made white.

We have zeroed out the ocean areas because the image gets too messy to interpret, although I will say it showed signatures consistent with the decrease in Arctic sea ice, and increase in Antarctic sea ice.

If we compute the land gridpoint trends across all 26 Augusts, the image looks like this (note the color scale does not match the published greenness trend image above, click image for full-res version):

26-year trends in 37 GHz [V-H] (deg. C per year) for the period 1987-2013.

26-year trends in 37 GHz [V-H] (deg. C per year) for the period 1987-2013.

Note the strong signature of more vegetation in the Sahel and Kalahari Desert regions of Africa, similar to the Donohue et al. study. Significant increases are also suggested in India, Australia, and over the extreme northern reaches of North America and Asia. I have no explanation for the apparent increased roughness signature of the Greenland ice sheet (I’m pretty sure it’s not yet grassland, ha-ha).

There are also many, spotty areas of apparent decreases in vegetation cover (red). I have no idea what these correspond to, so Im asking readers if they have knowledge of any of these areas (clicking on the above images will bring up the full-size versions). The red areas might also be regions of greater soil surface wetness…there is no way to know with this simple 2-channel approach.

I would be careful about interpreting coastal areas.small geolocation errors in the satellite data combined with the huge [V-H] polarization differences between land and ocean, can cause spurious signals there.

Also, at this microwave frequency (37 GHz) a forest canopy isnt going to look much different from dense grass. Think of the 37 GHz [V-H] measurement as an indication of how much soil surface (or highly polarized rivers) is visible through breaks in the vegetation.its not really a measure of total biomass, unless the vegetation is quite sparse. So, deforestation in Amazonia isn’t necessarily going to show up if forest is replaced by crops, weeds, and shrubs. The nominal resolution of the microwave imagery above is 25 km, at best.

Again, the above microwave imagery is only for August. This was a LOT of full-resolution satellite data that Danny Braswell downloaded from NCDC, and it was not a trivial effort to do the calculations. We just thought that the public might be able to give us some idea if any of these signatures merit further investigation.


66 Responses to “Greening of Planet Earth: A Little Crowdsourcing Project”

Toggle Trackbacks

  1. Chad Jessup says:

    Good stuff as usual, and I would add the study could also reflect an increased use of fertilizers.

  2. According to Google Earth, looks like the red areas in Amazonia do correspond to deforestation.

  3. Ed Caryl says:

    in New Mexico it is the result of drought and over-grazing. Compare to this:
    http://droughtmonitor.unl.edu/Home/StateDroughtMonitor.aspx?NM
    The same situation in southern Arizona.

  4. AlecM says:

    So far we have had reports of c. 30 and c. 40% more vegetation growth rate because of the increase of CO2 in the atmosphere. This is for two reasons.

    Firstly the direct effect shown in this reference: http://books.google.de/books?id=HVDluoCh-rQC&pg=PA236&lpg=PA236&dq=CO2+at+150+ppm&source=bl&ots=4FkSK4m1Ve&sig=v1MwPQ1OohShPHgKM6asylZDwys&hl=en&sa=X&ei=7_uVUavNAYrUswaL7oGADw&ved=0CDoQ6AEwAg#v=onepage&q=CO2%20at%20150%20ppm&f=false

    Secondly the indirect effect: smaller stomata leads to lower water loss therefore greater resistance to drought.

    However, there is a another issue, in which research was started by Freeman Dyson. it is the fact that as CO2 increases, the canopy of forests does not extract all the available CO2, (defined as c. >200 ppmV) allowing growth of a much higher density of smaller trees at the lower levels.

    This is a very powerful CO2 uptake process and it has been suggested is leading to perhaps 200% greater biomass accumulation is some forests for which there is ample moisture and other ground nutrients.

  5. ri says:

    I dont know about any of the red areas but I do know about a blue one. My brother-in-laws farm is in south east Washington and he has had trouble with too much rain causing mould on his crops. His family has been farming this land since the 30s and they have not had this problem but for the last 10 years.

    ri

  6. John Owens says:

    There is another possible effect, reduction of local temperatures caused by absorption of energy used in the photosynthesis process. Higher temperatures above 90F cause stress on vegetation and make photosynthesis less efficient. Even a reduction of a few degrees could make a difference.

    • AlecM says:

      On the other hand, less water loss through stomata would mean higher local temperature but higher plant growth shading the ground wold mean less water loss from the soil.

      A few PhD theses here methinks!

      • John Owens says:

        AlecM, what I was talking about is in addition to transpiration and shading. It is the removal and storage of energy in sugar compounds in the plant. This also lowers the local temperature.

  7. Whatever says:

    One of those red spots in North Dakota would seem likely to be related to the growth of Devils Lake over the past 20 years.

  8. Maybe the argument is that up to 1C, CO2 has global benefits to the ecosystem but after 1C, i.e., 1.1C, everything goes to hell.

    But from my personal experiences, there are very few climate activists who will admit that warming, even as little as 1C, has any benefit whatsoever.

  9. Aaron S says:

    Thanks, always learning from this page. I am curious about the potential for a floral shift back to late Tertiary ratios of C3 and C4 plants associated with the increase in CO2 above ~500ppm. Cerling and others have published many papers suggesting there is a threshold where the decline of CO2 during the late Tertiary (4to7 ma) initiated the global expansion of C4 grasslands at mid latitudes. Thus, as we approach this threshold I am curious if the C3 dominated open savannah ecosystems characterizing the Miocene will start to emerge?

    • AlecM says:

      My best guess from C3 plant growth kinetics plus the cooling of the oceans in the forthcoming Little Ice Age is that CO2 will stabilise at about 450 ppmV.

  10. Thanks, Dr. Spencer.
    And good luck trying to use passive microwave imager data to characterize vegetation.

    • John Owens says:

      There are websites that give estimates of photosynthesis. The general product is net primary production, which is the amount of carbon that remains after all the losses due to plant growth and maintenance. I don’t know the location of the websites for land, but the website for the Ocean is: http://www.science.oregonstate.edu/ocean.productivity/ The site requires a knowledge of data downloads and computer plotting to review the data. They do not give the algorithms for converting the net productivity to gross productivity or for estimating the energy removed from the environment by the photosynthesis process. That energy is generally not included in climate models, even though it is considerable, possibly as high as the “missing heat”.

  11. John DeFayette says:

    Dr. Roy is cherry picking as usual. We all know that the effect of CO2 on plants will lead to more potent poison ivy. We’re all gonna die!

  12. Sigmundb says:

    Commenting on Svalbard, the “tiny” island west of Greenland and north of Norway:
    It is very like Greeenland in that the coastal area and low valleys have arctic vegetation and higherlying interior is barren rock or ice sheet.
    On Svalbard the interior ice is unchanged (not greened as on Greenland)but the “coastal” vegetation is indicated as greened. This agrees with obeservation but as the growing season has lengthened it is not possible to distinguish between co2 and temperature contribution as the driver for this. No reserch to distinguish between the two mechanisms to my knowledge :-(.
    But at least your method agrees with observation on Svalbard. Can it be that the changes on the Greenland Ice are due to wetter (warmer)ice cover?

  13. Jeff says:

    NASA has a study that says such greening would slow warming…

    http://www.nasa.gov/topics/earth/features/cooling-plant-growth.html

    Then there are studies claiming the exact opposite, that greening increases warming…

    http://www.pnas.org/content/107/21/9513.full?sid=584b5825-03d5-44bf-b022-83ec883a3354

    Seems like this is a whole new layer of compexity for scientists to argue about. I’m sure the activists will just focus on final conclusions of net cooling or heating so they can add this topic to there arsenal of debate topics. Personally, as someone more interested in the “how much” aspects of GW, I see this as another reason to say “we just don’t know yet” (i.e. be skeptical).

    Regardless, when you look how drastically plant life can effect an area, it is hard to believe that the effect to the atmosphere above such an area would be negligable. Not negligable and, at least in the opinion of NASA, negative.

    • CC Rider says:

      Here are extracts from the articles that you referenced. One of the problems that I have with the internet is that a search can pull-up articles from the last century. You be careful, you hear?

      http://www.nasa.gov/topics/earth/features/cooling-plant-growth.html
      Dec. 2010
      A new NASA modeling effort found that in a doubled-carbon dioxide world plant growth could lessen global warming by about 0.3 degrees C globally. The same model found that the world would warm by 1.94 degrees C without this cooling feedback factored in.

      http://www.pnas.org/content/108/10/4035.full – Dec 2010
      Current increase in CO2 and the coinciding reduction in plant transpiration already results in increased continental run-off (46), and climate models predict surface temperature increases arising from reduced evaporative cooling (6, 7).

      (This sentence seems to acknowledge that clouds provide negative feedback.)

  14. HR says:

    I’ll have a go at Australia.

    Given your range of years. Australia went through a long drought upto 2010. La Ninas brought huge amount of rain that

    1) flooded lots
    2) Greened the central desert area. We visited Alice Springs and Uluru in 2011 and took a helicopter ride over the famous rock. The pilot told us the green was unusual (because of La Nina) and would probably mean more intense wild fires in coming years due to all the extra fuel. That would explain the blue Australia area.
    3) The big blob of red in the south central part of Australia looks like it coincides with the position of ‘Lake Eyre’. Most of the time this is a desert but when the La Nina comes it fills up with rain water to become the 18th largest lake in the world (so says wikipedia). It may be the red represents the shift from desert to lake, if that makes sense.

  15. The graph Dr. Spencer presents correlates strongly with solar magnetic activity. Those are the facts ,show me how it does not?

    Dr. Spencer you should match the ap index against temp. data you will see it matches up quite well.

    Then again the sun has nothing to do with climate change even though it is the driver of the earth climatic system. How stupid I am to think such a profound thought.

    • Of greater concern to me besides the blatantly obvious ‘solar magnetic’ correlation, is how my research has shown that this activity also enhances the effectiveness of Tachyon beams used by the NSA to read my thoughts. Fortunately I have designed a custom patented aluminium helmet that can block such intrusions. If you don’t already own several, please let me know!

  16. Alick says:

    As carbon dioxide is bound up in this “greening”, is not energy bound up with it? Is this energy mostly sunlight that didn’t get a chance to be transformed into infrared?

    • MikeB says:

      Yes and yes

      • Alick says:

        Then what happens to that energy and CO2?

        Is the Earth constantly building up a powder keg?

        • MikeB says:

          The energy from the Sun is used by plants to convert CO2 and water into basic sugars and carbohydrates. This is how the Suns energy is stored. The difference between the plant kingdom and the animal kingdom is that plants make their own food by this process, which is called photosynthesis. This stored energy is what fuels you. You eat food to release the stored energy and give back the CO2 when you breathe out.

          On the longer term, vegetation is laid down to form the oil, gas and coal fields of the future, millions of years from now.
          Likewise, when we burn fossil fuels today, we release the Suns energy that was stored millions of years ago.

          On a shorter time scale we may releae the energy by burning wood from trees. Wood burning is considered to be carbon neutral because the CO2 released on burning is CO2 that has recently been taken from the atmosphere.

        • John F. Hultquist says:

          Search with the phrase “fuel load”
          Example:
          http://www.fs.fed.us/rm/pubs/rmrs_gtr164/rmrs_gtr164_06_fuel_load.pdf

          Maps of “fuel load” are used in fighting forest fires and is much studied.
          The term “Firewise” is used to promote clearing of the fuel load from near residential structures. There are active programs in most parts of the USA.

  17. Ragnaar says:

    Being a resident of Minnesota I think I’ve learned our precipitation comes from the Gulf of Mexico for the most part. On occasion, the Gulf will kick moisture all the way to us. We get more in the Eastern part of the state than the West as the Gulf moisture can only be kicked so far West. South and North Dakota are drier because of there Westerly location. Once a precipitation track starts, it almost always moves from West to East with a bit of Northward movement not being unusual. The lucky counties are under these tracks as precipitation equals money to these farming areas. Unlucky counties can be too far West. The precipitation tracks occur in all seasons with snow being valuable as well.

    A link explaining that North Dakota does depend on Gulf moisture:
    http://www.cocorahs.org/Media/docs/ClimateSum_ND.pdf
    Average annual precipitation ranges from about 14 to 22 inches from northwestern to southeastern North Dakota. This increase reflects the decreasing distance to the Gulf of Mexico, which is the water source for most of the states precipitation.

    In the last graph, in North Dakota, we see and interesting blue red contrast. If we keep in mind that the Gulf moisture moves to North Dakota in a counter clockwise arc, we can ask has the average arc shifted West in North Dakota? SouthWestern Minnesota shows the same kind of thing though less pronounced.

    Of any climate issues there may be, we in the Northern Plains want our Gulf moisture and are interested in changes in the precipitation tracks.

  18. I have been browsing online more than 4 hours today, уеt
    І neѵer found ɑny interesting
    article like уߋurs. Ιt’s pretty worth enough fοr me.
    Personally, іf all website owners ɑnd bloggers made god content as ʏοu ԁіd, tҺe web will bе a lot more useful than еνer before.

    Αlso visit my web site dragon city breeding firebird

  19. Another compelling correlation is the IMF strength versus temperature.

    IMF=INTERPLANATARY MAGNETIC FIELD

    I will try to post some graphs next week.

  20. Gil Carvalho says:

    The areas that have lost vegetative cover appear to be higher altitude mountain ranges and extreme latitudes closer to the poles. I wonder if the microwave imaging is confusing or misinterpreting areas of recent ice and snow loss as vegetative loss instead.

    I assume you’ve read or heard about this recent study published in a Swiss journal. Their data correlates closely with yours.

    http://www.bernerzeitung.ch/wissen/natur/Die-Halbwuesten-bluehen-auf/story/31316518

  21. Scott says:

    This is one of the best Ted Talks ever. Alan Savory talks about how he had an epiphany and realized the “settled scientific consensus” about desertification and climate change was wrong.

    Alan Savory: How To Fight Desertification and Reverse Climate Change.

    http://www.ted.com/talks/allan_savory_how_to_green_the_world_s_deserts_and_reverse_climate_change#t-1233071

  22. Interesting to note that many days have past and not a single climate activist has posted a comment to denounce this research. I would suggest they have nothing to say because (a) it’s not mentioned on the SkS website/blog (the source of nearly all climate related information in their universe) and (b) they have never read an actual climate research paper in their lives. Or am I being too cynical?

  23. Lewis Guignard says:

    Nice piece in the WSJ today.

  24. ri says:

    I wonder what the effect of farming has on the map. If the harvest is in July then the august map may not have any real significance. I dont know anyone who harvests in July but I would bet there are some places that farming is distorting the map. Perhaps the map should show the entire growing season for the location.

    ri

  25. AJ says:

    Is there a correlation with this Diurnal Temperature Range map?

    https://mapsengine.google.com/11291863457841367551-00158297293355456784-4/mapview/

  26. Philip Bradley says:

    Looking at Western Australia.

    The red band that runs from near the Pilbara coast southeast, corresponds with the iron ore mining areas. These are large scale operations.

    http://www.environment.gov.au/system/files/pages/7261fa5a-b191-4044-a6f8-f598f9763f8e/files/map-rio-tinto-strategic-assessment.pdf

    The red area just to the southwest, is where government sources say large areas of ‘forest’ have been cleared. Although I don’t know when or why. This area is too dry for field crops, and agriculture is restricted to low density grazing.

    Incidentally, there are large numbers of feral goats in this area (around 1 million from memory). Goats are very good at suppressing tree regrowth.

    Land clearing for agriculture may also account for the red areas further south.

    http://www.environment.gov.au/node/21754

    See fig 41

  27. Nils says:

    I was intrigued by the red band over western Denmark. It’s a small spot, but to judge whether this technique holds any explanatory potential I thought why not check this out. However, I could not find anything that would have led to such a strong change, see e.g. http://www.prinsengineering.com/kyoto_dk2.htm Apparantly, forest cover in Denmark increased between 1990-2005. They built a lot of wind turbines, but those shouldn’t cause such an effect, or should they? Maybe it’s crops for bioenergy?

  28. Another watch dogs cd key benefit is that the child is expected to double over the
    internet find most of these aspects can affect an object or lay down real money
    in Second Life code. Whether you are trying to milk the UFOs that are being formed watch dogs cd key by network marketing,
    and questing, this type of online games. It is a fertile mind.
    And let’s launch a platform which can last a few buttons in the
    game, a media lab in Melbourne, Australia 8.

  29. Me ha llamado la atencion mucho la publicacion, verdaderamente
    muy buena, muchas gracias por la aclaracin, demasiado informativa.
    Continuo navegando por la web a indagar mas cosas interesantes, gracias again.

  30. hello there and thank you for your information _ I’ve definitely picked up something new from right here.
    I did however expertise several technical issues using this
    website, as I experienced to reload the web site lots of times previous to I could get it to load correctly.
    I had been wondering if your web hosting is OK? Not that I am complaining, but sluggish loading instances times will sometimes affect your placement in google and
    could damage your high-quality score if advertising and marketing with Adwords.
    Well I am adding this RSS to my email and could look out for much more of your respective fascinating content.

    Ensure that you update this again very soon.

  31. hack lin qun says:

    This is a great tip particularly to those fresh to the blogosphere.
    Short but very accurate info_ Thank you for sharing this one.
    A must read article!

    Feel free to surf to my web blog – hack lin qun

  32. Hello! This is my first visit to your blog!
    We are a group of volunteers and starting a new initiative in a community in the same niche.
    Your blog provided us beneficial information to work on. You have done a outstanding job!

  33. ___________ says:

    UFA089 _______________________ ____ 1 ____________________ _________________

  34. Having read this I thought it was really enlightening.
    I appreciate you spending some time and effort to put this article together.
    I once again find myself spending way too much time both
    reading and posting comments. But so what, it was still worth
    it!

  35. Hello to every body, it’s my first visit of this webpage; this webpage
    consists of remarkable and truly fine information for visitors.

  36. եǥ ȥ ؔ says:

    ֥ ԩ` ؜ _allbrandsjp2021ץ` ѩ“ `ѩ`,supreme `ѩ`ԩ` Ʒ| ,ץ` ԩ` T ץ`ࡾSUPREME `ѩ`ԩ` T … `ѩ`ԩ` ץ` SUPREME ԩ`ͨ؜؜ӤΥХå,ؔ,,ѥ,٥,`, ޥե`.
    եǥ ȥ ؔ https://vogcopy.net/brand-68-c0.html

  37. ץ` ԩ`ץ` `ѩ`ԩ`allbrandsjp2021ץ`ѩ“ԩ`ץ` ԩ`n꣬ץ`७åץԩ`¥ץ`ॹ`ѩ`ԩ` ץ` DT꣬ץ`ؔԩ`Supreme߼ץ`ࡣץ`ؔԩ`2021Ʒץ`ॹ`ѩ`
    `ʥʥ륦å ԩ` http://www.cibbuzz.com/brand-17.html

  38. ץ`ॳԩ`؜ӵ,߼ץ`2021 allbrandsjp2021supreme `ѩ`ԩ` Ʒ| ,ץ` ԩ` T ץ`ࡾSUPREME `ѩ`ԩ` T … `ѩ`ԩ` ץ` SUPREME ԩ`ͨ؜؜ӤΥХå,ؔ,,ѥ,٥,`, ޥե`
    FENDI إХ ԩ` https://vogcopy.net/brand-68-c0.html

  39. Ω`ե |allbrandsjp2021 -n֥ɥ`ѩ`ԩ`TƷ|^HOT100%ƷΥץ` ѩ“ ,ץ` ԩ` t ,supreme ԩ`,ץ` … ߼ƯSUPREME ץ` Ω`ե 㥱å THE NORTH FACE ե` .
    STUSSY `ѩ`ԩ` http://hxqiu.com/?brand-198.html

  40. supreme `ѩ`ԩ`-륤ȥ ץ` ,allbrandsjp2021 륤ȥ ץ`ॳԩ`Ʒؤ˴˚ݤΥץ` 륤ȥ ؔ`ѩ`ԩ`ηNN ȡBޤ.ץ` D؜ӡsupreme louis vuittontƷߤƷ|ץ`.
    Bell & Ross`ѩ`ԩ` http://www.cibbuzz.com/brand-300.html

  41. ץ` supreme(ץ`ࣩallbrandsjp2021ԩ` …ץ` ѩ“ ԩ`supreme ԩ` ͨ؜ץ` å`ѩ`ԩ`¥ץ` … ꣬ץ` ԩ` ᣬ2021ﶬ`ѩ`ԩ`?ǥ`֥ɥԩ`ͨ؜.
    SWAROVSKI`ѩ`ԩ` http://www.kidying.com/brand-277.html

  42. 超N品スーパーコピー専門店
    当店は海外高品質のスーパーコピー代引き,スーパーコピーき通販人気老舗です。
    ロエベ キャップ コピーhttps://www.1kopi.com/pro-331-b0.html
    プラダ カナパ 偽物https://www.kopi100.com/pro-179-b0.html
    vetements 偽物https://www.topkopi.net/brand-67-c0.html

  43. みんなにいくつかの優良品質のショッピングサイトを紹介して、品質は保証して、商品を受け取って保障します。
    シェーヌダンクル 偽物:https://www.tote711.com/copyn-86-b0.html
    エアフォース1 偽物:https://www.tote711.com/copyn-284-b0.html
    ヴィトン ウォーターカラー コピー:https://www.tote711.com/copyn-469-b0.html

  44. スポーツが持つあらゆるものを結びつける価値を、想像力や可能性、活力として表現するプロジェクトの一環として生まれたNIKE(ナイキ)とOff-WhiteTM(オフ-ホワイト)のコラボレーション。 オフホワイト スーパーコピーhttps://www.hacopy.jp/offwhite/ 2021年7月23日(金)より、ヴァージル・アブローによるオフ-ホワイトの美意識を、革新的なランニングスタイルへと昇華させたコレクションを発売する。
    中でも注目したいのが、ランニングシューズ(¥30,800)だ。ベースとなるのは、ナイキの最高レベルのレーシングシューズ「ナイキ エア ズーム アルファフライ ネクスト%」から着想を得て開発された「ナイキ エア ズーム テンポ ネクスト%」。そこに世界最速のアスリートたちからのさまざまな意見を反映させ、ヴァージル・アブローが新たなシューズへと生まれ変わらせた。
    解体と再構築の要素や、ハンドメイド感を持つグラフィックをあしらい、オフ-ホワイトらしくテクノロジーを内側に太文字で記載。カラーはピンク、ブラック、ホワイト/レッドの3色を用意した。ちなみに、日本国旗を思わせるホワイト/レッドは日本限定カラーだ。
    ナイキの機能性とオフ-ホワイトのデザイン性が見事な融合を見せるランニングシューズは完売必至! 手に入れたければ、公式サイトおよび店舗をチェックしよう。

  45. クロムハーツのドーバー 銀座 限定ライダースジャケット発売 スーパーコピー:https://www.bibicopy.com/
    登場する限定モデルは、アジア人向けにパターン修正が施されたウエストベルト無しのダブルライダース(BASIC MOTO VJ)と、ウエストベルトとラペルにスナップのついたダブルライダース(JJ DEAN VJ)、そしてブランド創業当時からの定番モデルのベスト(BASIC VEST 6 BUTTON ZIPPER TYPE)の3アイテムの限定カラーバージョン。
    どのアイテムも長年ロングセラーとなっているクロムハーツを代表するモデルの一つで、クロムハーツ店舗では手に入れることのできないプレーンなブラックカラー仕様となっている。 クロムハーツ コピー:https://www.bibicopy.com/brand_chromeh/
    馬革は牛革に比べて産出量も少ないため希少な皮革素材として扱われており、馬革特有のなめらかな表皮の表情が特徴。長年の使用によりヌメりのような独特な光沢を帯びて年月を追うごとに魅力を増します。

  46. スーパーコピー時計代引き買ってみたブランド時計コピーN級実店舗!スーパーコピー時計販売、2021ブランド メンズ 高級時計スーパーコピーは送料無料、n級品時計買ってみた スーパーコピーブランド、最高のサービス2年品質無料保証です。
    https://www.teauki.com/TokeiCopy-3.html
    https://www.teauki.com/TokeiCopy-44.html
    https://www.teauki.com/Shop/Product-902.html

  47. you’re in point of fact a good webmaster. The web site loading speed
    is amazing. It sort of feels that you are doing any unique trick.
    Also, The contents are masterpiece. you’ve performed a great activity on this
    matter!

  48. nh ci uy tn says:

    My brother recommended I might like this website.
    He used to be totally right. This submit actually made my day.
    You cann’t believe just how a lot time I had spent for this information! Thanks!

Leave a Reply