
 Home/Blog
As Hyper-Hurricane Patricia approaches the western coast of Mexico with 190 mph sustained winds, satellite imagery shows what is usually only seen in typically-stronger West Pacific typhoons — a very constricted eye (in the center of the imagery), roughly akin to an extremely large tornado (but different physics, I know):
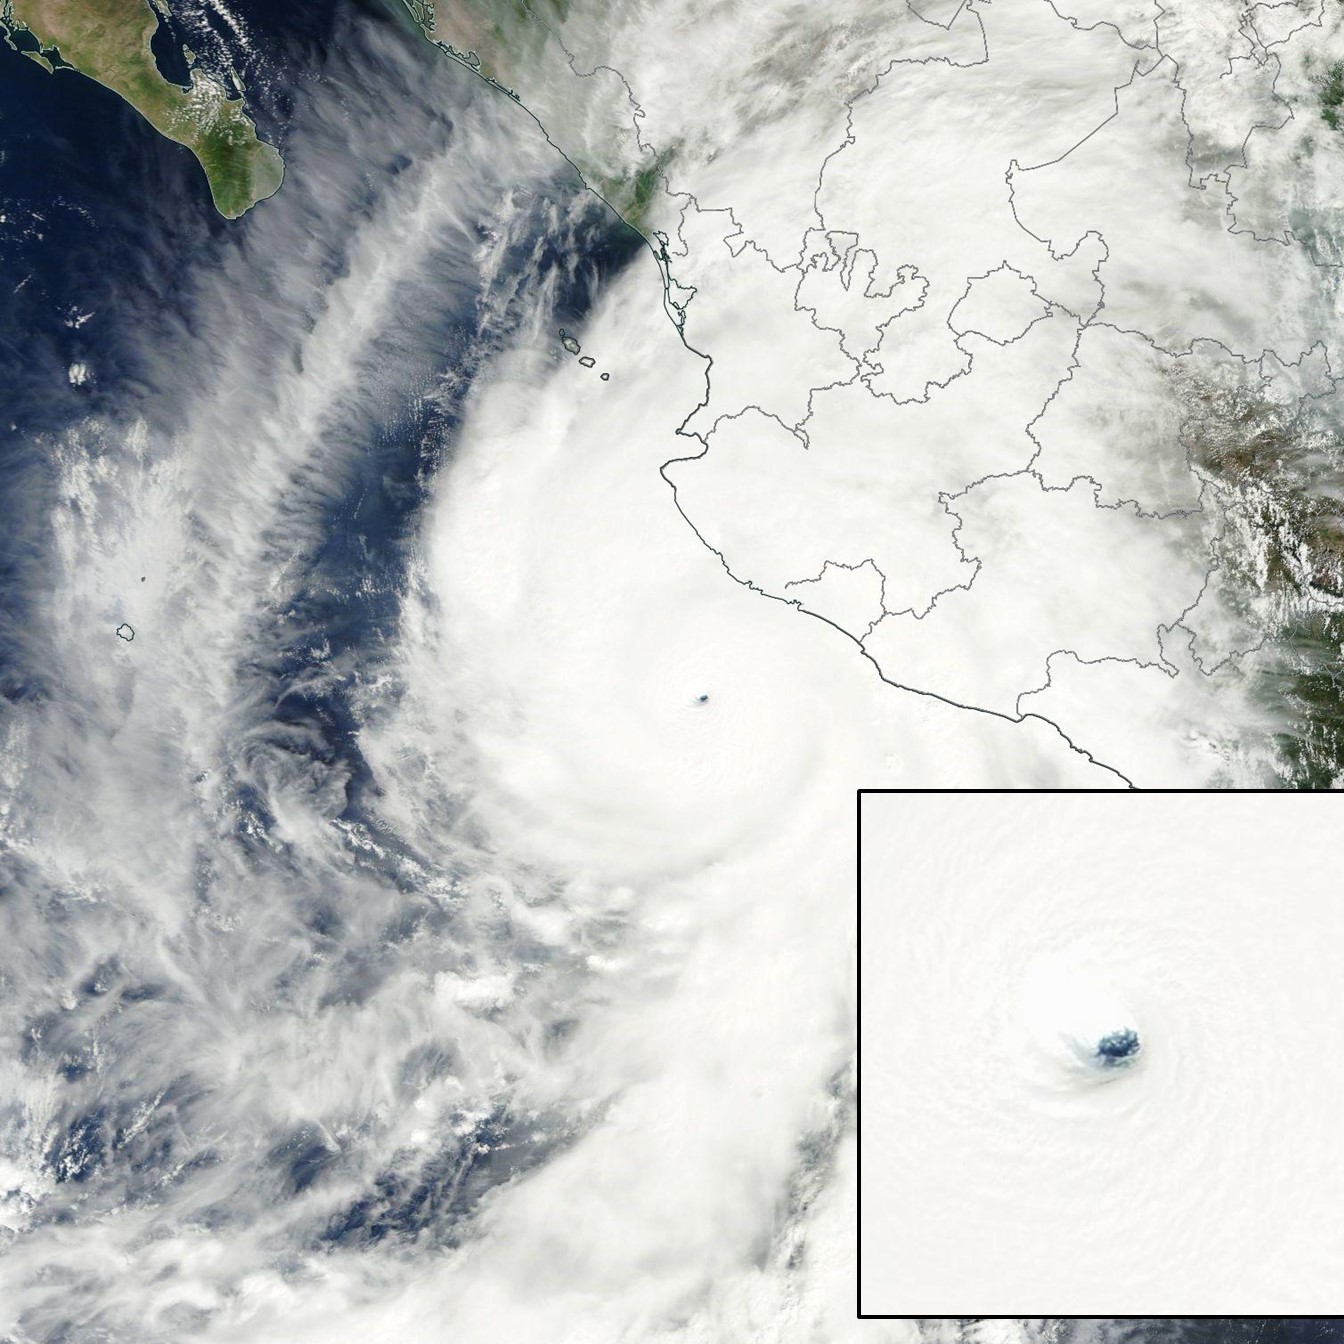
MODIS color imagery of Hurricane Patricia with 190 mph maximum sustained surface winds.
Eastern Pacific hurricanes are typically not flown into with “hurricane hunter” aircraft, so it’s questionable whether this one really is a “record setter”…they flew into this one because it looked like it would be unusually strong. The intensity of these systems is usually estimated based upon appearance in satellite visible and infrared imagery, which is prone to error.
This one is the strongest “hurricane” (Atlantic or East Pacific nomenclature) they have happened to fly into. It’s doubtful that a stronger one hasn’t occurred in, say, the last 50 years which wasn’t flown into with aircraft.


