Most meteorologists consider the stratosphere to be a pretty boring place: no warm fronts, cold fronts, low pressure systems, and (almost) no clouds.
But there are a couple of things that happen there which are pretty dramatic. Sudden stratospheric warming in the polar regions is one. Another, but lesser-known, type of event is sudden temperature changes in the tropical stratosphere.
For example, in the last week the tropical middle stratosphere, as measured by channel 14 of the AMSU instrument flying on NOAA-19, has cooled by over 3 deg. C (about 5 deg. F):

Daily departures from average in the temperature of the tropical (25N-25S) mid-stratosphere, through 10 August 2016.
The area covered is over 40% of the surface area of the Earth, so that’s a huge region.
The reason why such large temperature changes can occur in the stratosphere has to do with its vertical temperature structure, combined with dynamically-forced changes in the vertical circulation of air in the stratosphere.
The unique vertical temperature structure in the stratosphere is due to ozone being created and heated by ultraviolet solar radiation. The ozone layer then shields the air below it from UV radiation, so the layer is maintained at a “warmer” temperature as it continues to absorb UV energy.
Since the temperature increases with height in the stratosphere, any forced ascent of the air will cause a large drop in temperature at any given pressure altitude (since dry air ascent at any altitude will result in a temperature drop of 9.8 deg. C per km). Similarly, forced descent will cause a large temperature rise.
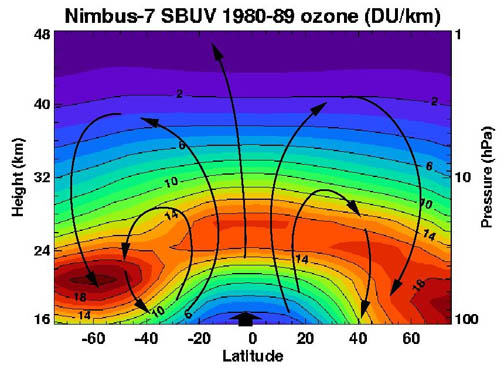
Now, the global stratosphere experiences a slow vertical circulation called the Brewer-Dobson circulation, with slowly rising air in the tropical stratosphere and slow sinking of stratospheric air outside the tropics. This circulation explains why, even though most stratospheric ozone is created in the tropics where sunlight (per square meter) is most intense, the greatest concentrations of ozone are found outside the tropics, as it is exported out of the tropical stratosphere.
Weather activity generated in the troposphere is what is believed to force this circulation (e.g., see here). As Rossby waves and gravity waves in the lower atmosphere propagate upward and equatorward, changes in their activity can cause changes in the strength of the Brewer-Dobson circulation, leading to the large temperature changes seen in the time series plot, above.
So, stronger rising of the stratospheric air is what led to cooling in the last week, but that will be almost exactly matched by warming outside the tropics where air is sinking faster than normal. (Note that rising air in one location and altitude must be almost exactly matched by sinking air elsewhere at the same altitude, otherwise there would be huge pressure differences leading to tremendous winds which will act to remove the pressure difference…this is what happens in hurricanes to some extent, where atmospheric mass is removed from the center of the hurricane faster than it can be replaced by in-flowing winds.)
I suspect these stratospheric temperature variations changes have no measurable effect on weather in the tropical troposphere, even though they might change the tropical radiative energy budget by a fraction of a Watt per sq. meter.
“NASA-funded researchers are monitoring a big event in our planets atmosphere. High above Earths surface where the atmosphere meets space, a rarefied layer of gas called “the thermosphere” recently collapsed and now is rebounding again.
“This is the biggest contraction of the thermosphere in at least 43 years,” says John Emmert of the Naval Research Lab, lead author of a paper announcing the finding in the June 19th issue of the Geophysical Research Letters (GRL). “Its a Space Age record.”
The collapse happened during the deep solar minimum of 2008-2009a fact which comes as little surprise to researchers. The thermosphere always cools and contracts when solar activity is low. In this case, however, the magnitude of the collapse was two to three times greater than low solar activity could explain.
“Something is going on that we do not understand,” says Emmert.
The thermosphere ranges in altitude from 90 km to 600+ km. It is a realm of meteors, auroras and satellites, which skim through the thermosphere as they circle Earth. It is also where solar radiation makes first contact with our planet. The thermosphere intercepts extreme ultraviolet (EUV) photons from the Sun before they can reach the ground. When solar activity is high, solar EUV warms the thermosphere, causing it to puff up like a marshmallow held over a camp fire. (This heating can raise temperatures as high as 1400 Khence the name thermosphere.) When solar activity is low, the opposite happens.”
http://www.astrobio.net/topic/solar-system/earth/spaceship-earth/the-collapse-of-the-thermosphere/
“Collapse” is a needlessly dramatic term. The extreme upper atmosphere expands and contracts with solar activity…but there is almost no air up there in the first place. When it contracts, the amount of air at, say, 300 km altitude mostly “disappears”…but that means virtually nothing because there was virtually no air there to begin with. NASA had the TRMM satellite operate at 300-350 km altitude for many years since there was almost no atmospheric drag there.
Roy W. Spencer, dr
Waves are created which have an influence on the pressure in the lower layers. Look at the waves in the winter. During the summer UV alleviates the effects.
http://www.cpc.ncep.noaa.gov/products/stratosphere/strat-trop/gif_files/time_pres_WAVE1_MEAN_ALL_NH_2016.png
Sorry.
http://www.cpc.ncep.noaa.gov/products/stratosphere/strat-trop/gif_files/time_pres_HGT_ANOM_ALL_NH_2016.png
In actual satellite observations, I don’t see any significant correlation between tropospheric and stratospheric temperatures variations. I don’t know why that model plot suggests there is.
“Comparison of UV solar activity in the three most recent solar cycles (SC) 22-24. The thick curves show the Mg II index timeseries twice smoothed with a 55-day boxcar. Dates of minima of solar cycles (YYYYMMDD) were determined from the smoothed Mg II index.”
http://www.iup.uni-bremen.de/gome/solar/mgii_composite_2.png
http://www.iup.uni-bremen.de/gome/gomemgii.html
Dr. Spencer, in looking at tropospheric vs stratospheric temperature correlations, did you consider putting in a time lag? For example, compare stratospheric temperatures from two to three years ago with current temps in the troposphere. I think you will see a correlation if you put the time lag in.
“The NCEP GDAS and CPC temperature and height analyses are used to monitor processes in the Stratosphere and Troposphere. In the table below are zonal mean time series of Temperature, Zonal Wind Component, Normalized Geopotential Height anomalies, amplitude of the height field’s Wave 1, Wave 2, and Wave 3.”
http://www.cpc.ncep.noaa.gov/products/stratosphere/strat-trop/gif_files/time_pres_TEMP_ANOM_ALL_EQ_2016.png
http://www.cpc.ncep.noaa.gov/products/stratosphere/strat-trop/
Cool! I didn’t know that plotting tool existed.
For me, the big mystery is the tropopause: 10 km of atmosphere with a flat temperature profile,i.e., little or no lapse rate.
What’s going on?
some representations of the average tropopause exaggerate the depth of the layer having little or no lapse rate. If you examine individual radiosonde profiles, there is usually a much better defined inflection point at the tropopause. The tropopause can be viewed as the thin layer of atmosphere where moist convective mixing below “bumps up against” the warm air above that is being heated by UV absorption by ozone.
Thanks, Dr. Spencer, that explains it: a zone of mixing between the upper troposphere and the lower stratosphere. Naturally. The inversion.
“..the thin layer of atmosphere where moist convective mixing below bumps up against the warm air above..”
One for the folks who like to claim that there is no moisture of significance in the upper troposphere.
Tropopause over the equator is very thick.
http://www.cpc.ncep.noaa.gov/products/stratosphere/strat-trop/gif_files/time_pres_TEMP_MEAN_ALL_EQ_2016.png
As one would expect.
Interesting posting.
What do you think of papers by Hartmann at UW who found stratospheric anomalies tended to lead tropospheric circulation changes?
Also, the mass exchanged across the tropopause would seem to be limited, but to what extent do you believe that STE provides a negative feedback? A warming troposphere exchanging with a cooling stratosphere means at least some additional upward leakage, right?
Not familiar with that part of Dennis’ work, but I suspect there is a non-zero effect on the troposphere, at least based upon theory…the question is whether it’s measurable. At some miniscule level, at least, every change in the atmosphere affects everything else.
There are solar influence on ozone concentrations in the stratosphere which I think translates to atmospheric circulation changes which in turn effect the climate.
EXTREME UV values – in response to changes in solar activity having a ozone impact effect.
The study below is trying to show a tie in between GCR and Ozone.
As far as the atmosphere goes and talking about the thermosphere and how it expands or shrinks with given solar activity I say the atmosphere is all interconnected and a change in one part will effect all the other parts to one degree or another.
Solar modulation of GCR [Galactic Cosmic Rays] is translated down to the Earth climate.
The mediator of solar influence are energetic particles.
GCR impacts the O3 budget in the lower stratosphere.
O3 influences the temperature and humidity near tropopause, and greenhouse effect.
Effectiveness of this mechanism depends on geomagnetic field intensity.
Abstract
The Sun’s contribution to climate variations was highly questioned recently. In this paper we show that bi-decadal variability of solar magnetic field, modulating the intensity of galactic cosmic ray (GCR) at the outer boundary of heliosphere, could be easily tracked down to the Earth’s surface. The mediator of this influence is the lower stratospheric ozone, while the mechanism of signal translation consists of: (i) GCR impact on the lower stratospheric ozone balance; (ii) modulation of temperature and humidity near the tropopause by the ozone variations; (iii) increase or decrease of the greenhouse effect, depending on the sign of the humidity changes. The efficiency of such a mechanism depends critically on the level of maximum secondary ionisation created by GCR (i.e. the Pfotzer maximum) − determined in turn by heterogeneous Earth’s magnetic field. Thus, the positioning of the Pfotzer max in the driest lowermost stratosphere favours autocatalytic ozone production in the extra-tropical Northern Hemisphere (NH), while in the SH − no suitable conditions for activation of this mechanism exist. Consequently, the geomagnetic modulation of precipitating energetic particles heterogeneously distributed over the globe is imprinted on the relation between ozone and humidity in the lower stratosphere (LS). The applied test for causality reveals that during the examined period 19572012 there are two main centers of action in the winter NH, with tight and almost stationary ozone control on the near tropopause humidity. Being indirectly influenced by the solar protons, the variability of the SH lower stratospheric ozone, however, is much weaker. As a consequence, the causality test detects that the ozone dominates in the interplay with ULTS humidity only in the summer extra-tropics.
Circulation in the lower stratosphere controls the circulation in the upper troposphere. Below the distribution of ozone and the pressure in the lower stratosphere in the northern hemisphere.
http://www.cpc.ncep.noaa.gov/products/stratosphere/strat_a_f/gif_files/gfs_t100_nh_f00.png
http://www.cpc.ncep.noaa.gov/products/stratosphere/strat_a_f/gif_files/gfs_z100_nh_f00.png
http://www.cpc.ncep.noaa.gov/products/stratosphere/strat_a_f/
Circulation in the stratosphere controls the circulation in the troposphere, because the temperature change (ozone) in the stratosphere is slow. Stable movement of air within about 10 days results in a similar movement of air in the troposphere.
I’m sorry, but no one I know of in the atmospheric research community believes what you just stated.
Hey Dr. Roy, do you know anyone that believes the atmosphere is a “blanket”?
Do you know anyone that believes IR from the sky can warm the planet?
Do you know anyone that tries to walk both sides of the street?
Geran, Dr. Spencer has shown IR from the sky is real through measuring it. I think it can have a warming effect to one degree or another.
☺
Sal, do you know anyone that believes IR is NOT real?
“Proving IR is real” is NOT proving it can heat anything it impacts. If that were true, houses, with windows and doors shut, would be burning down!
(Pseudoscientists won’t understand that.)
Ren I think you should have stated it is temperature changes in the stratosphere that influence the circulation in the troposphere due to the fact that temperature changes in the stratosphere effect the strength of the polar vortex.
It then follows the strength of the polar vortex determines the atmospheric wind patterns.
The circulation in the stratosphere on the other hand I doubt has much influence on the troposphere.
Dr. Roy,
Two thing’s: the understatement of the year:”Something is going on that we do not understand, says Emmert.”
and: Thanks for putting out an event or opinion and including your thoughts. Wonderful. I know little about weather or climate that I have not learned from you, thank you. Mac
Interesting to see that 4 of the 8 years represented had a spike downward mid-year. what causes this to happen… Less heat arriving, or more heat escaping?
From your article: “Since the temperature increases with height in the stratosphere, any forced ascent of the air will cause a large drop in temperature at any given pressure altitude (since dry air ascent at any altitude will result in a temperature drop of 9.8 deg. C per km). Similarly, forced descent will cause a large temperature rise.”
Such a gravitationally induced lapse rate has not been detected at presures below 10kPa in any solar system planatary atmosphere! In Earth’s upper stratosphere a 5F change in the very few molecules results in what change in sensible heat? Why is such change significant in any meaningful way?
Is this a result of?
http://www.cpc.ncep.noaa.gov/products/stratosphere/strat-trop/gif_files/time_pres_WAVE1_MEAN_ALL_NH_2009.gif
http://www.cpc.ncep.noaa.gov/products/stratosphere/strat-trop/gif_files/time_pres_HGT_ANOM_ALL_NH_2009.gif
It can this result is better?
http://www.cpc.ncep.noaa.gov/products/stratosphere/strat-trop/gif_files/time_pres_WAVE1_MEAN_ALL_SH_2009.gif
http://www.cpc.ncep.noaa.gov/products/stratosphere/strat-trop/gif_files/time_pres_HGT_ANOM_ALL_SH_2009.gif
Can the Stratospheric circulation patterns affect cloud formation in the troposphere below?
If there is any effect, it would be very small. People have tried to find any response of the troposphere to stratospheric variations, and the evidence has been very thin. In the temperature realm, I’ve done lag correlations between all different levels and I see nothing significant.
One of the problems is that there IS some lower stratospheric expression of tropospheric waves (Rossby waves), which are dynamically induced. Whether these then have a radiative feedback effect on the tropospheric weather pattern is less certain.
Translation: Dr. Roy has no clue.
But I’m sure you think you do.
What ever happened to “keep the dirty side down”?
No one did.
It has been shown (DATA) AO/NAO tend to be more negative during prolonged minimum solar periods of time which is in response to changes in ozone in the stratosphere. Therefore one can say changes in the stratosphere do effect the atmospheric circulation in the troposphere and hence weather /climate.
“Abstract.
In this work we continue studying possible reasons for the temporal variability of longterm
effects of solar activity (SA) and galactic cosmic ray (GCR) variations on the lower
atmosphere circulation. It was revealed that the detected earlier ~60-year oscillations of the
amplitude and sign of SA/GCR effects on the troposphere pressure at high and middle latitudes are
closely related to the state of a cyclonic vortex forming in the polar stratosphere. A roughly 60-
year periodicity was found in the vortex strength affecting the evolution of the large-scale
atmospheric circulation and the character of SA/GCR effects. It was shown that the sign reversals
of the correlations between tropospheric pressure and SA/GCR variations coincide well with the
transitions between the different states of the vortex. Most pronounced SA/GCR influence on the
development of extratropical baric systems is observed when the vortex is strong. The results
obtained suggest that the evolution of the stratospheric polar vortex plays an important part in the
mechanism of solar-atmospheric links.
http://geo.phys.spbu.ru/materials_of_a_conference_2012/STP2012/Veretenenko_%20et_all_Geocosmos2012proceedings.pdf
30-day loop of analyzed 50-hPa temperatures and anomalies. Each frame is an eleven-day mean, centered on the date indicated in the title, of 50-hPa temperature and anomalies from the NCEP Climate Data Assimilation System (CDAS). Contour interval for temperatures is 4�C, anomalies are indicated by shading. Anomalies are departures from the 1981-2010 daily base period means.
http://www.cpc.ncep.noaa.gov/products/intraseasonal/temp50anim.gif
https://earth.nullschool.net/#current/wind/isobaric/70hPa/orthographic=-145.11,-41.18,300
ECMWF 24 hour forecast from August 10 2016 12 UTC to August 11 2016 12 UTC:
150 hPa geopotential and temperature
http://users.met.fu-berlin.de/~Aktuell/strat-www/wdiag/figs/ecmwf1/ecmwf150f24.gif
http://img.meteocentre.com/models/ecmwf_hnord_12/GZ_PN_000_0000.gif
The stratosphere is actually key to climate variability because the tropopause is highest at the equator and lower at the poles.
If anything affects the tropopause height gradient between equator and poles then it also affects global albedo via cloudiness changes and that leads to warming or cooling over time.
More here:
http://joannenova.com.au/2015/01/is-the-sun-driving-ozone-and-changing-the-climate/
The heaviest snow in two decades blanketed Lesotho in late July 2016. The storm prompted the airlifts of at least eight tourists, and caused the deaths of several shepherds in the Joe Gqabi District Municipality, according to news reports.
It was the heaviest snow since 1996, said Stefan Grab, a professor at the University of the Witwatersrand (South Africa). Twenty years ago, the snow would have lasted as long as a week in places. This year, he said, snow at altitudes at or below 1800 meters (roughly 5,900 feet) melted within a day or two.
http://earthobservatory.nasa.gov/IOTD/view.php?id=88509
Roy W. Spencer, Ph. D.
Do you think that the polar vortex in the winter does not affect circulation in the troposphere?
http://www.cpc.ncep.noaa.gov/products/stratosphere/strat_a_f/gif_files/gfs_z50_sh_f00.png
Ren, I know your answer to that question is yes and I agree with you.
To clarify meaning you think as do I that any change in the polar vortex effects the atmospheric circulation in the troposphere.
“The warming affected the upper stratosphere (~ 40-45 km) first, and then propagated rapidly from the upper to the lower stratosphere. The temporal evolution of the stratospheric temperature was derived at fixed potential temperature levels between 500 and 1500 K. Lidar data show the first signs of the warming at the 1500 K level (~ 42 km) on 22 January, after a week of instrumental problems that prevented from carrying out measurements. After 2-3 days, the warming reached 1000 K (~ 34 km), 900 K (~ 32 km) and 800 K (~ 29 km), and after 5-6 days it reached 600 K (~ 23 km) and 500 K (~ 20 km). Comparison of Lidar data with CIRA model profiles indicates that during the SSW the measured temperature between 25 and 45 km altitude exceeded by 40-50 K the expected CIRA values, reaching a maximum of ~290 K at 40 km. The intensity peak of the SSW was observed between 22 and 24 January. The warming produced an abrupt and irreversible break of the polar vortex. Comparison of 2009 data with Lidar atmospheric temperature measurements obtained during several years between 1994 and 2007 indicates that the 2009 SSW was the strongest event ever observed by the Lidar at Thule.”
Sorry.
http://adsabs.harvard.edu/abs/2009AGUFM.A21C0202D
Visible currently strong wave in the stratosphere in the south causing interference in the polar vortex.
http://www.cpc.ncep.noaa.gov/products/stratosphere/strat-trop/gif_files/time_pres_WAVE1_MEAN_JAS_SH_2016.png
Storms in the US now distributed in accordance with the jet stream in the tropopause.
http://oi64.tinypic.com/vsncxt.jpg
Visible waves in the stratosphere in the south.
http://exp-studies.tor.ec.gc.ca/ozone/images/graphs/gl_dev/current.gif
DR. SPENCER QUESTIONS — Do you believe that changes in the temperature structure of the stratosphere both in a vertical and horizontal sense influence the strength and characteristics of the polar vortex?
Do you in turn believe that any change in the characteristics and strength of the polar vortex effect the circulation patterns of the troposphere? Meridian versus zonal atmospheric circulation for example.
If you do not agree then how do you then explain sudden stratospheric warming events which lead to major changes in the polar vortex and thus the atmospheric circulation patterns which dictate the climate all over the globe?
Finally I think you must agree that the degree of how zonal or not zonal the atmospheric circulation is has a major effect upon weather patterns /climate around the globe?
THANKS
Salvatore said:
“Finally I think you must agree that the degree of how zonal or not zonal the atmospheric circulation is has a major effect upon weather patterns /climate around the globe?”
Absolutely right, as I’ve been saying since at least 2010.
The reason being that the extent to which the jet stream tracks loop about affects global cloudiness by changing the length of the lines of air mass mixing.
Less cloud results in system warming and more cloud results in system cooling.
Jet stream loopiness being closely associated with the polar vortices which shrink or expand in line with solar variability.
Exactly Stephen. Dr. Spencer I would think won’t deny that.
@Roy…”…in the last week the tropical middle stratosphere, as measured by channel 14 of the AMSU instrument flying on NOAA-19,…”
Could you say a few words about how the frequency bands are used to focus on the surface as opposed to the middle stratosphere?
My understanding is that oxygen emits frequencies/wavelengths that are proportional to it molecular temperature. Obviously, the telemetry averages the emissions naturally, hence the temperatures.
In surface stations, it appears two temperatures are taken daily, a high and a low, with the average value taken. There could be quite a broad range between high and low.
Does the satellite telemetry give a more accurate averaging due to the far greater number of oxygen data points?
The line of storms shows the course of the jet stream. Dangerously in the east.
http://i66.tinypic.com/a17gb5.jpg
Sorry.
http://en.blitzortung.org/live_lightning_maps.php?map=30
Current circulation in the lower stratosphere explains stormy weather in the United States.
https://earth.nullschool.net/#2016/08/14/0000Z/wind/isobaric/70hPa/orthographic=-103.01,45.66,910
Please look at the graphic. You can see how the west jet stream enters the United States, in the east of circulation in accordance with the clockwise direction.
http://oi64.tinypic.com/rlhn4o.jpg
Satellite shows a “compressing” of water vapor over the USA.
http://www.goes.noaa.gov/GIFS/ECWV.JPG
As you see the rain in Louisiana will continue.
Thermalization explains why CO2 has no significant influence on climate.
Increasing water vapor is countering and perhaps preventing the expected global temperature decline from blank sun & decline in net ocean cycle temperature (R^2 = 0.98 since before 1900).
Switching from coal to natural gas adds water vapor.
Exactly as acted El Nino increases the evaporation above the equator. There now follows a reduction in water vapor and temperature drop.
http://www.pmel.noaa.gov/tao/jsdisplay/plots/gif/sst_wind_anom_5day_ps32.gif
The increasing water vapor is average global. The full story is at http://globalclimatedrivers2.blogspot.com
Polar vortex at an altitude of about 27 km.
https://earth.nullschool.net/#current/wind/isobaric/10hPa/orthographic=-213.37,-31.90,600
Temperature at a height of 3.5 km.
https://earth.nullschool.net/#current/wind/isobaric/700hPa/overlay=temp/orthographic=-213.37,-31.90,600
Distribution of ozone at an altitude of 27 km.
http://www.cpc.ncep.noaa.gov/products/stratosphere/strat_a_f/gif_files/gfs_t10_sh_f00.png
Oh those pesky data – August global temps actually rose – …. turns out that Dr. Roy’s prediction of dramatic cooling following El Nino has fallen a bit flat. Could it be, could it be the dreaded global warming genie has escaped the bottle?