
 Home/Blog
Sorry for the late posting of the global temperature update, I’ve been busy responding to reviewers of one of our papers for publication.
The Version 6 global average lower tropospheric temperature (LT) anomaly for November 2022 was +0.17 deg. C departure from the 1991-2020 mean. This is down from the October anomaly of +0.32 deg. C
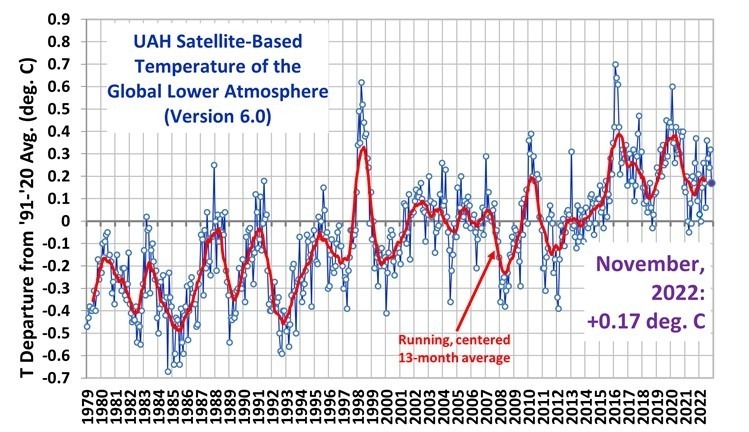
The linear warming trend since January, 1979 now stands at +0.13 C/decade (+0.12 C/decade over the global-averaged oceans, and +0.18 C/decade over global-averaged land).
Various regional LT departures from the 30-year (1991-2020) average for the last 22 months are:
| YEAR | MO | GLOBE | NHEM. | SHEM. | TROPIC | USA48 | ARCTIC | AUST |
| 2021 | Jan | +0.13 | +0.34 | -0.09 | -0.08 | +0.36 | +0.50 | -0.52 |
| 2021 | Feb | +0.20 | +0.32 | +0.08 | -0.14 | -0.65 | +0.07 | -0.27 |
| 2021 | Mar | -0.00 | +0.13 | -0.13 | -0.28 | +0.60 | -0.78 | -0.79 |
| 2021 | Apr | -0.05 | +0.06 | -0.15 | -0.27 | -0.01 | +0.02 | +0.29 |
| 2021 | May | +0.08 | +0.14 | +0.03 | +0.07 | -0.41 | -0.04 | +0.02 |
| 2021 | Jun | -0.01 | +0.31 | -0.32 | -0.14 | +1.44 | +0.64 | -0.76 |
| 2021 | Jul | +0.20 | +0.34 | +0.07 | +0.13 | +0.58 | +0.43 | +0.80 |
| 2021 | Aug | +0.17 | +0.27 | +0.08 | +0.07 | +0.33 | +0.83 | -0.02 |
| 2021 | Sep | +0.26 | +0.19 | +0.33 | +0.09 | +0.67 | +0.02 | +0.37 |
| 2021 | Oct | +0.37 | +0.46 | +0.28 | +0.33 | +0.84 | +0.64 | +0.07 |
| 2021 | Nov | +0.09 | +0.12 | +0.06 | +0.14 | +0.50 | -0.42 | -0.29 |
| 2021 | Dec | +0.21 | +0.27 | +0.15 | +0.04 | +1.63 | +0.01 | -0.06 |
| 2022 | Jan | +0.03 | +0.06 | -0.00 | -0.23 | -0.13 | +0.68 | +0.10 |
| 2022 | Feb | -0.00 | +0.01 | -0.02 | -0.24 | -0.04 | -0.30 | -0.50 |
| 2022 | Mar | +0.15 | +0.27 | +0.02 | -0.07 | +0.22 | +0.74 | +0.02 |
| 2022 | Apr | +0.26 | +0.35 | +0.18 | -0.04 | -0.26 | +0.45 | +0.61 |
| 2022 | May | +0.17 | +0.25 | +0.10 | +0.01 | +0.59 | +0.23 | +0.19 |
| 2022 | Jun | +0.06 | +0.08 | +0.04 | -0.36 | +0.46 | +0.33 | +0.11 |
| 2022 | Jul | +0.36 | +0.37 | +0.35 | +0.13 | +0.84 | +0.56 | +0.65 |
| 2022 | Aug | +0.28 | +0.32 | +0.24 | -0.03 | +0.60 | +0.50 | -0.00 |
| 2022 | Sep | +0.24 | +0.43 | +0.06 | +0.03 | +0.88 | +0.69 | -0.28 |
| 2022 | Oct | +0.32 | +0.43 | +0.21 | +0.04 | +0.16 | +0.93 | +0.04 |
| 2022 | Nov | +0.17 | +0.21 | +0.12 | -0.16 | -0.51 | +0.51 | -0.56 |
The full UAH Global Temperature Report, along with the LT global gridpoint anomaly image for November, 2022 should be available within the next several days here.
The global and regional monthly anomalies for the various atmospheric layers we monitor should be available in the next few days at the following locations:
Lower Troposphere:
http://vortex.nsstc.uah.edu/data/msu/v6.0/tlt/uahncdc_lt_6.0.txt
Mid-Troposphere:
http://vortex.nsstc.uah.edu/data/msu/v6.0/tmt/uahncdc_mt_6.0.txt
Tropopause:
http://vortex.nsstc.uah.edu/data/msu/v6.0/ttp/uahncdc_tp_6.0.txt
Lower Stratosphere:
http://vortex.nsstc.uah.edu/data/msu/v6.0/tls/uahncdc_ls_6.0.txt


Let the madness begin!
Always interesting to see the difference between tropospheric and ground temperatures in specific locations. The UAH map shows England as average, but at the surface it was very warm CET was almost 2C above the 1991 -2020 average.
Comparing specific locations would be difficult. Of course, the LT is not surface data, so any direct link to actual surface measurements is dubious. The UAH LT product is a gridded average with 2.5×2.5 degree resolution and the processing to produce these data is also the result of another averaging scheme. I suspect that the mathematical process to create the monthly maps further smears the data.
“Of course, the LT is not surface data, so any direct link to actual surface measurements is dubious”
About as dubious as any direct link between surface data and whole atmosphere figures.
swannie…”the LT is not surface data”
***
So halfway up Everest, above the 4 km measuring level of Channel 5, is not the surface, and well up on Everest (South Col) at the 8 km mark is not surface?
And you are trying to tell me that the AMSU unit on sats, where the channel 5 weighting curve reaches well below 4 km, cannot measure lower than 4 km?
There are other places on Earth where the surface reaches 4 km above sea level.
Each channel collects O2 radiation at a specific wavelength.
If they measure only one wavelength, and wavelength, as you say, is specific to a discrete layer of atmosphere, how is it that the weighting curves span many kilometres of atmospheric altitude?
The answer is that O2 gives of that specific wavelength captured by each of the channels throughout the curve. An O2 molecule can give off the specific wavelength that, say, channel 7 reads at any altitude along the curve. O2 does not only emit at a specific wavelength at a specific altitude, or those curves would be impossible. There wouldn’t be a curve in that case.
Thus, AMSU units cannot tell you the temperature at a specific height, including the tops of mountains.
In the UAH v6 methods paper Roy explains that mountainous regions interfere with LT measurements.
“The Arctic region changed from +0.43 to +0.23 C/decade. Note that trends are noisy over Greenland, Antarctica, and the Tibetan Plateau, likely due to greater sensitivity of the satellite measurements to surface emission and thus to emissivity changes over high altitude terrain; trends in these high-altitude areas are much less reliable than in other areas.”
No, the LT is not surface data. It can’t be distinguished from the rest of the curve, and where the land reaches up into the curve it actually interferes with the LT measurement to detrimental effect.
https://www.drroyspencer.com/2015/04/version-6-0-of-the-uah-temperature-dataset-released-new-lt-trend-0-11-cdecade/
barry…”The answer is that O2 gives of that specific wavelength captured by each of the channels throughout the curve”.
***
The AMSU receiver is designed to respond to O2 frequencies over a range. Chanel 5 receiver is designed to capture O2 emissions centred at 4 km, which will be so many Ghz. As far as I can see channel 5 has the capability of receiving O2 emissions from the surface.
Each frequency is emitted by O2 at a certain temperature hence a certain altitude. That’s what weighting curves represent, the emission per altitude. Knowing the relationship between altitude and frequency it should be possible to convert frequency per altitude to the temperature per altitude.
I am not claiming it is as simple as that. Roy has told us they don’t use frequencies straight from the surface due to natural microwave emissions at the surface that interfere.
Once the AMSU channel receives the data, it heterodynes the frequency band into lower intermediate frequencies, then it is detected (converted to D*C) where the relative frequency levels can be detected wrt the 4 km centre frequency for channel 5. The signal is then digitized and transmitted to the surface station.
“Each channel collects O2 radiation at a specific wavelength”
Each channel collects O2 radiation over a range of wavelengths, peaking at a specific frequency, is the more correct picture.
“The AMSU receiver is designed to respond to O2 frequencies over a range.”
No, they are set at specific wavelengths.
Channel 5 = 53.56 GHz
Channel 7 = 54.94 GHz
Channel 9 = 57.29 GHz
“Each frequency is emitted by O2 at a certain temperature hence a certain altitude.”
No, this is your fundamental misunderstanding.
Any object emits at a range of frequencies regardless of temperature, with the peak emissions corresponding to the temperature. You’ll recognize Wein’s curve.
https://upload.wikimedia.org/wikipedia/commons/a/a2/Wiens_law.svg
At each of the different temperatures there you see that a broad range of emissions with the peak of the curve corresponding to the blackbody temperature.
Look at those curves. Each curve represents a different temperature, and the curves greatly overlap at the range they emit. As you can see in the graph, a blackbody at 5500K emits from about 200 to 2000 n/m (it’s more but at each end of the wings the intensity is too low to show on a graph). As you can see, the blackbody emissions at 4500K cover almost the same range.
That’s two temperatures 1000K different, with plenty of overlapping frequency range.
Thus an O2 molecule at 1C will emit much the same range of frequencies as an O2 molecule at 10C, but their peak emission is different, as is their intensity.
The AMSU instruments are tuned to a specific frequency, and they pick that frequency up at a broad depth through the atmosphere.
Roy Spencer:
“For AMSU channel 5 that we use for tropospheric temperature monitoring, that brightness temperature is very close to the vertically-averaged temperature through a fairly deep layer of the atmosphere. The vertical profiles of each channels relative sensitivity to temperature (weighting functions) are shown in the following plot:”
https://www.drroyspencer.com/wp-content/uploads/AMSU-weighting-functions.gif
“For those channels whose weighting functions intersect the surface, a portion of the total measured microwave thermal emission signal comes from the surface. AMSU channels 1, 2, and 15 are considered “window” channels because the atmosphere is essentially clear, so virtually all of the measured microwave radiation comes from the surface. While this sounds like a good way to measure surface temperature, it turns out that the microwave ’emissivity’ of the surface (it’s ability to emit microwave energy) is so variable that it is difficult to accurately measure surface temperatures using such measurements. The variable emissivity problem is the smallest for well-vegetated surfaces, and largest for snow-covered surfaces. While the microwave emissivity of the ocean surfaces around 50 GHz is more stable, it just happens to have a temperature dependence which almost exactly cancels out any sensitivity to surface temperature.
https://www.drroyspencer.com/2010/01/how-the-uah-global-temperatures-are-produced/
So, no, MSU instruments cannot accurately measure the temperature of the surface, as Roy said, and they measure a deep layer of atmosphere at a single frequency. Because O2 molecules do not emit a single frequency at a given altitude or temperature. No object does.
More from Dr Spencer.
“The intensity of the signals these microwave radiometers measure at different microwave frequencies is directly proportional to the temperature of different, deep layers of the atmosphere.”
https://www.drroyspencer.com/latest-global-temperatures/
“Fig. 2. October 2019 LT temperature anomalies relative to the 1981-2010 average annual cycle. Note the anomalies have a smooth transition between land and ocean, as would be expected for deep-layer tropospheric temperatures (but not necessarily surface temperatures).”
https://www.drroyspencer.com/page/12/?q=node%2F526
“The merging procedure utilized to generate homogeneous time series of three deep-layer atmospheric temperature products from the nine microwave sounding units (MSUs) is described.”
https://journals.ametsoc.org/view/journals/clim/11/8/1520-0442_1998_011_2016_aotmpf_2.0.co_2.xml
And others:
“The brightness temperature for each channel corresponds to an average temperature of the atmosphere averaged over that channel’s weighting function. For each channel, the brightness temperature can be thought of as the averaged temperature over a thick atmospheric layer.”
http://apdrc.soest.hawaii.edu/datadoc/msu_rss.php
“Satellite-borne microwave sounders estimate the temperature of thick layers of the atmosphere by measuring microwave emissions”
https://archive.ipcc.ch/publications_and_data/ar4/wg1/en/ch3s3-4-1-2.html
“Since 1979, microwave sounding units (MSUs) on NOAA polar orbiting satellites have measured the intensity of upwelling microwave radiation from atmospheric oxygen. The intensity is proportional to the temperature of broad vertical layers of the atmosphere, as demonstrated by theory and direct comparisons with atmospheric temperatures from radiosonde (balloon) profiles. Upwelling radiance is measured at different frequencies; these different frequency bands sample a different weighted range of the atmosphere. Channel 2 is broadly representative of the troposphere, albeit with a significant overlap with the lower stratosphere…
https://encyclopedia.pub/entry/28535
“The Microwave Sounding Units (MSU) operating on NOAA polar-orbiting satellite platforms were the principal sources of satellite temperature profiles from late 1978 to the early 2000’s. The MSUs were cross-track scanners that made measurements of microwave radiance in four channels ranging from 50.3 to 57.95 GHz on the lower shoulder of the Oxygen absorp.tion band. These four channels measured the atmospheric temperature in four thick layers spanning the surface through the stratosphere.”
https://www.remss.com/missions/amsu/
If Spencer, Christy and other atmospheric sounding experts can’t convince you, no one can.
barry…”The intensity of the signals these microwave radiometers measure at different microwave frequencies is directly proportional to the temperature of different, deep layers of the atmosphere.”
***
A deep layer refers to the overall layer a channel can measure. Channel 5 is centred at 4 km but can measure frequencies from the surface to several km above 4 km. Channel 5 measures best at 4 km but it still has a significant reception right down to the surface.
The bell curve shape of the weighting functions should be replicated per channel reception in the AMSU. In other words, each channel receives O2 data from other channels, due to overlap.
I would guess there are 3 dB points on each curve indicating half power.
barry…”If Spencer, Christy and other atmospheric sounding experts cant convince you, no one can”.
***
I am in agreement with Roy and John as far as I understand the technology and Roy’s description of it. From what you write, you don’t seem to understand it at all.
Gordo wrote:
Channel 5 is centred at 4 km but can measure frequencies from the surface to several km above 4 km. Channel 5 measures best at 4 km but it still has a significant reception right down to the surface.
Barry has it right when he wrote:
Each channel measures INTENSITY of the received energy around the center frequency. For the novice EE, that might be called SIGNAL STRENGTH. The signal is compared with that from two other black body sources, which provides a scale of “brightness temperature”.
The weighting function is the THEORETICAL intensity for a particular ASSUMED set of conditions. Some of the radiant energy which reaches the AMSU Ch 5 comes from the surface and some from the stratosphere and that results in the data used to calculate the MT. The LT is not “raw” data, it’s the result of a calculation combining the MT, the TP and the LS data to compensate for the effects of the known cooling in the stratosphere.
“No, they are set at specific wavelengths”
The CENTER of each channel is set at a specific wavelength. They are NOT set to a single frequency nor are they infinitely small in bandwidth.
Cite to corroborate please. What is the range?
Barry: Are you suggesting that they are set to an infinitely small bandwidth as that is a single frequency means? Practical physics requires that they have a bandwidth over which they respond.
See https://www.drroyspencer.com/wp-content/uploads/AMSU-weighting-functions.gif
You have no idea what you’ve posted. That is the curves of weighting functions, representing the sensitivity of the MSU instruments to O2 emissions at the given frequency.
And maybe read the first few posts in this thread to see what the point is. Gordon is saying that MSU instruments can isolate readings to a specific altitude, instead of the deep layers reflected in those curves.
Barry: Let me educate you in receiver bandwidth.
https://man.fas.org/dod-101/navy/docs/swos/cmd/fun12/12-1/sld039.htm
barry says: Cite to corroborate please. What is the range?
The AMSU channel bandwidths are summarized at the link below.
https://www.esa.int/Applications/Observing_the_Earth/Meteorological_missions/MetOp/AMSU-A1_channels
At some level of detail (e.g. channel noise density estimation) this matters, but I’m not clear how germane it is to the topic at hand. Fundamentally the basis of UAH measurements is the strength of specific O2 spectral emission lines.
Barry: Note the table containing
Centre frequency (MHz), Bandwidth (MHz)
in the paper cited by Mark B.
Ok, the relevant channels have a range of between 170 and 400 Mhz around the centre frequency, less than 1 percent of the frequency.
Gordon’s view is:
“Knowing the relationship between altitude and frequency it should be possible to convert frequency per altitude to the temperature per altitude.”
It actually undermines his argument because the readings are fuzzier.
The point remains. MSU instruments have no way of telling whether the radiance they capture comes from a 2km or 8km altitude.
Thanks for posting that information, Mark.
@GR
Yes, mountains are not warming as much as sea level areas. Thanks for confirming what the surface data says.
England is probably catching the heat coming from Greenland. The cult teaches that more ice means more heat. Greenland ice sheet SMB is now in record territory — again.
http://polarportal.dk/fileadmin/polarportal/surface/SMB_curves_LA_EN_20221205.png
(For the braindead, THAT is sarcasm.)
The UK is only a small part of the northern hemisphere. Further afield the much colder weather has dragged down the average. The UK has been blessed until now sitting on the warm side of the jet stream, however next week it is due to change.
It’s already changed, and we are getting cold northerly winds from the Arctic.
Its been freezing in Sheffield for the last month. Central Britain.
To be clear, given some of the replies above, I’m not suggesting there is anything wrong with this. Just that over small areas the tropospheric temperatures won’t necessarily reflect those at the surface.
I the same way as the surface records do not fully reflect the bulk atmospheric temperatures.
The surface temperature is highly affected by airport and urban and development readings. Its not representative of the whole “surface” at all.
The TLT is much less affected by the local warming around surface thermometers.
Simply have a look at
https://www.drroyspencer.com/2022/12/uah-global-temperature-update-for-november-2022-0-17-deg-c/#comment-1406017
Yes the unadulterated USCRN data is an almost perfect trend match to UAH America (except where it responded more to the 2015 /16 El Nino.)
Thanks for confirming that UAH is validated by USCRN. 🙂
You are obviously SO DIM that you don’t realise that USCRN is now controlling the USA surface data… (how stupid would they look if they continued their airport and urban warming homogenisation nonsense)
Hence, warming has essentially stopped since the implementation of USCRN..
Funny about that ! ;-).
Oh and thanks for the two graphs showing that the current temperature in the USA is almost exactly what it was 17 years ago.
So much for your “warming”
Take another face-plant, bozo !
“You are obviously SO DIM (how stupid would they look if … homogenisation nonsense)”
Jarring language.
Once more, Robertson deliberately dissimulates the reality.
*
On the one hand, John Christy & al. explain each month in their GTR (Global Temperature Record), e.g. in:
https://www.nsstc.uah.edu/climate/2022/november2022/GTR_202211Nov_1.pdf
that the ” satellite-based instruments measure the temperature of the atmosphere from the surface up to an altitude of about eight kilometers above sea level “.
But on the other hand, Roy Spencer clearly stated in 2015
https://www.drroyspencer.com/2015/04/version-6-0-of-the-uah-temperature-dataset-released-new-lt-trend-0-11-cdecade/
the following already:
2.1 LT Calculation
” We have fundamentally changed the calculation of the lower tropospheric temperature product, LT, from a multi-angle method to a multi-channel method.
The main reason we changed methods for LT calculation is the old view angle method had unacceptably large errors at the gridpoint level.
While the errors cancel for global averages on a monthly time scale, on a regional or gridpoint basis they can be large “.
*
This is the reason why the evaluation of O2’s microwave emissions for LT have since then been replaced by an average of the three layers above, according to the formula
LT = 1.538*MT – 0.548*TP + 0.010*LS
which gives a homogeneous result independently of the size of the observed region (Globe, Nino3+4’s 5N-5S — 170W-120W, or even a single grid cell e.g. above Huntsville, AL).
*
It is evident that Roy Spencer’s explanation has more weight in describing LT anmaly calculations than a general statement about what satellite sensing is able to deliver.
But Robertson never cares about such repeated corrections. He always comes back with his unchanged personal narrative.
yet another Duplicate Comment with neither showing up
Roy explained it in the following two paragraphs…
“The MSU and AMSU instruments measure the thermal microwave emission from atmospheric oxygen in the 50-60 GHz oxygen absor.p-tion complex, and the resulting calibrated brightness temperatures (Tb) are nearly equivalent to thermometric temperature, specifically a vertically-weighted average of atmospheric temperature with the vertical weighting represented by weighting functions”.
“The MSU instrument scan geometry in Fig. 2 illustrates how the old LT calculation required data from different scan positions, each of which has a different weighting function (see Fig. 2 inset). Thus, only one LT retrieval was possible from a scan line of data. The new method uses multiple channels to allow computation of LT from a single geographic location”.
Unlike what you have been claiming they still use AMSU instruments to gather O2 emission data from all altitudes, as John Christy claimed. As Roy explained, they don’t use data from near the surface because their are spurious microwave frequencies generated by the surface. However, they could go as low as needed and obviously they get the right temperatures.
Gordo wrote:
Gordo is in LaLa land again. As Roy explained, they use intensity measurements from three channels to calculate the LT. There are no such “spurious microwave frequencies”.
SEE my comment above.
Robertson
” However, they could go as low as needed and obviously they get the right temperatures. ”
Again you show your stupidity coming from an incredibly opinionated brain. You are not able to think other than keeping contrarian against all odds.
Roy Spencer explained in 2015 that there is NO WAY to obtain correct grid data when using observations as the source, and therefore UAH had to construct the LT data as a sytnhesis of MT, TP and LS!
Will that finally go into your pea brain?
When will you acknowledge that this is the reverse of what is applied to surface data in order to get a bulk atmosphere temperature.
“there is NO WAY to obtain correct grid data when using observations”
You are talking about the erratically spaced urban and airport “surface” fabrication… right ?!
spike55
I’m sure you never compared the 135 pristine (*) USCRN stations (114 in CONUS, 21 in AK) to the over 900 GHCN daily weather stations located in the 1 degree grid cell around them (92 of them in airports, yes yes):
TMIN
https://drive.google.com/file/d/1TYN-ijaz-QZXEEAI7EM-vTR_NO4vqv-j/view
TMAX
https://drive.google.com/file/d/10dNcZA1OvOQr_32Tgh5iwzcviwKRjW6K/view
Maybe that speaks to you?
*
(*) Some years ago, a Heartland-paid guy named Gary Boden looked at two (!) paired USCRN stations showing for a short period of time different data and claimed that would be enough to doubt about USCRN as a whole! Great.
Linsley Hood
” When will you acknowledge that this is the reverse of what is applied to surface data in order to get a bulk atmosphere temperature. ”
Try to express your personal thoughts in such a way that they become a bit less nebulous, and add some valuable proof to them.
“Maybe that speaks to you?”
Maybe if you aware enough to realised that USCRN is now controlling the homogenisation of data.
Hence stopping the warming.
Try having a rational thought at some point. !
2c above November on the CET isn’t very warm. Less cold would be more accurate. It certainly wasn’t that much warmer than usual in my neck of the UK
It was warm for November. One of the 10 warmest out of the 360 year record.
The whole year has been warm in the UK so far. December would need to reach near record low levels if 2022 isn’t to set new warmest year records in both the UK (since 1884) and CET (since 1659) data.
“It certainly wasnt that much warmer than usual in my neck of the UK”
Would be interesting to know where that neck is. Checking the MO data for the UK as a whole, November was the 3rd warmest on record – 1.7C above the 1991 – 2020 average.
Global sea surface temperatures continue to fall.
https://www.tropicaltidbits.com/analysis/ocean/nino34.png
https://www.tropicaltidbits.com/analysis/ocean/global.png
Thank you Dr. Spencer for the graph and the work. Was getting worried as this comes out earlier.
Sunspots are on a bit of uptick before the 5.9 month cycle in Feb/Mar. Expect them to die back down as this cycle has been above predictions but below expectations.
Side note, frigid weather is driving coal sales. While more countries can build nuclear powered subs, even America has trouble building an atomic or nuclear power plant.
TechnoCaveman
” While more countries can build nuclear powered subs, even America has trouble building an atomic or nuclear power plant. ”
France has the highest nuke plant density per capita.
But they utterly failed in trying
– to move up in the 1980-1990’s to 4G plants based on liquid sodium cooling (Superphenix) which were thought to endlessly breed Pu239 out of U238;
– to design and implement a new 3G generation (EPR, European Pressurized Reactor): Olkiluoto in Finland with a 12 year delay, Flamanville ‘at home’ quite similar.
Of the 58 traditional reactors based on Westinghouse licenses, 33 % are since many months in huge maintenance, and that just in front of winter and Putin’s fascist war against Ukraine.
Why the UK nonetheless ordered lots of EPR’s for Hinkley Point and successors, no one knows.
*
Would you ‘as America’, when looking at such a disaster, be willing to invest in nuclear?
Hmmmh.
Indeed. December could be the first below average month in the CET since May last year. Still allmost certain though that this will be the warmest calendar year on record.
The planet is more important than the UK, and 2022 sure won’t be the warmest year on record.
Indeed. For 2022 UAH is likely to be 6th or 7th warmest.
For those of us who live in the UK and sometimes get into discussions with global warming alarmists a record warm year is something that will get thrown back at us for a long long time even though it’s irrelevant on a global scale and nothing more than cherry picking data. Plus it’ll be splashed across most media outlets without any context being given and used to push the alarmist agenda.
Matt Dalby
I’d enjoy you telling the same to all these cooling alarmists who tell us the Globe is cooling just because UAH’s Global anomaly series shows a negative trend since a few years.
Before the 20th century the warmest average year in CET was 10.5C, set in 1834. That record held for 115 years until it was broken in 1949 (10.6C). The 1949 record stood for a further 57 years, until 2006 (10.8C). The 2006 record only lasted 8 years, until 2014 (11.0C). The 2014 record looks set to be broken this year (likely ~11.2C).
A similar pattern of increased frequency of new record warmest years can be found in the UK record over the same period. Both CET and the UK data also have long term warming trends. Is this just a coincidence?
“For those of us who live in the UK and sometimes get into discussions with global warming alarmists a record warm year is something that will get thrown back at us for a long long time even though its irrelevant on a global scale and nothing more than cherry picking data.”
Just as every cold month gets thrown back as an argument that global warming has stopped and we are heading into an ice age.
Anybody who uses individual months or years of UK weather to claim anything about global temperatures doesn’t understand our weather. However, it is obvious we are seeing more hot years in recent years, and that there is a upward trend over the last 50 years or so.
It would be cherry picking to point out what’s happening in the UK and ignore the rest of the world, but the fact is the rest of the world is warming and so is the UK.
To avoid cherry picking just one year I could point out that of the top 10 warmest calendar years in the CET’s 360 year history, 8 will have come from the 21st century.
bellman…we can all read the graph Roy provides above and see clearly that 2022 was nowhere near a record.
It looks likey to be the record warmest La Nina-influenced year, ahead of 2021.
I never said 2022 was a record globally, just that it’s likely to be a record in the CET data.
According to UAH 2022 is likely to be the 6th or 7th warmest year (out of 43).
What is unusual about the recent run of years is how consistently warm they have been. Assuming 2022 doesn’t collapse in December, the last 8 years will all be in the top ten warmest years.
I think I might have spoken too soon. It’s now looking possible this will be an unusually cold December and it might be enough to drop 2022 below the record. A good illustration of how unpredictable the weather is here.
Update to my previous update.
CET 2022 now definitely going to beat the record, probably by about 0.1C or so.
Maximum CET temperatures are the real driver here. They are going to smash the annual record by around 0.5C.
That was meant to be in reply to Mark Wapples comment about UK temperatures getting colder next week.
“Sorry for the late posting of the global temperature update, I’ve been busy responding to reviewers of one of our papers for publication.”
I thought the world had ended….
😊
Thanks for doing this. What’s the general view on CO2 saturation? One would have thought that all the extra CO2 would have made a bigger difference to the temperature?
According to the Various Regional LT Departures Chart from the 1991-2020 average as shown below the UAH LT Satellite Graph:
For the past 23 months:
Globe = +.165*C per month
USA Lower 48 = +.377*C per month
No wonder. Even UAH’s John Christy tells us about global warming.
Really cold across in the UK, we are paying through the nose for green fraud, the solar panels and wind turbines aren’t working while our politicians cry for more to drive down costs. The UK is a an asylum run by the lunatics. P.S. Our MPS can heat their houses to our discontent (claim the lot on expenses along with their monthly rent and council tax) while we shiver in our houses.
Cold weather in the UK during Winter? Global warming is a hoax!
“Cold weather in the UK during Winter?”
And here I was thinking that anomalies took care of the seasons.
We’re talking absolute temps, bub.
Brace yourself.
President Biden is getting into the holiday spirit by slapping a bow and some American Flag wrapping paper on a sweet little surprise for Europe…The Inflation Reduction Act. Inside they’ll find a wide array of pro-American manufacturing programs that are less than favorable for the Europeans.
Europe has enjoyed 75 years of safe and lucrative trade thanks to the guns and butter deal we know as globalization, but the Americans have outgrown that model. They are ready to bring some of their manufacturing home, and not in a small quantity…we’re talking 12 zeros here. This comes at a time when Biden needs some new footing with the organized labor faction and nothing speaks louder than money.
Europe isn’t happy about the American’s leveling out the playing field and WTO action has been threatened, but at the end of the day, the Biden administration is going to get its way.
Biden will have to deal with Republican majority in the House. He learned nothing from the Midterms.
The Inflation Reduction Act of 2022 (IRA) was passed by the 117th United States Congress and signed into law on August 16, 2022.
maguff…”The Inflation Reduction Act of 2022 (IRA) was passed by the 117th United States Congress and signed into law on August 16, 2022″.
***
It figures that a climate alarmist would fail to grasp the irony. The inflation was caused by the Democrats, in a big way, and now they are paying lip service to reducing it.
It is horrific to watch the decay of the US under Biden’s watch.
You kidding me? The biggest thing killing the US right now is the MAGA crazies in the Republican party and Donald Trump himself.
Trump, who lied about election fraud – including months before the election actually happened, who refused to commit to a peaceful transfer of power, who incited the storming of the Capitol building, and who now says the constitution should be disregarded in favour of re-installing him to power.
The only thing worse than him is the Republican party that spinelessly caved to his BS for 5 years.
Biden will just show the republicans his veto stamp.
I was quite surprised that the Dems bucked the norm and kept the senate in the mid-terms, and did surprisingly well in the house, despite losing it to the Repubs.
The red wave expected by Republicans (and many others) turned out to be a red ripple.
Trump’s midterms saw the Dems gain 41 seats in the house.
Biden’s midterms saw the Repubs gain 10 seats, with 2 left to call.
Dems won 3 times as many seats in Trump’s midterms as Repubs did in 2022. Looks like sleepy Joe was a safer bet for the Dems than Trump was for the Republicans.
It’s not Biden vs. Trump. Firstly, everything has changed with the voting changes the pandemic allowed the Democrats to get through that are still in effect or at least further in that direction than they were before the pandemic. That caused a shift in voting patterns where less engaged people vote more and ballot harvesting is widespread. Secondly, not sure how significant it is, but I read that the Dobbs decision seems to have energized single young women for the 2020 election. Thirdly, Russia’s invasion of Ukraine relieved pressure on Biden that he would have otherwise felt, as the inflationary pressures caused in Europe from high energy prices and the resulting strong dollar has both obscured and partially mitigated the inflationary pressures from Biden’s policies and from policies that the Democrats were pushing forward during the pandemic. It’s easy to say “everyone is experiencing inflation, some a lot worse than here”. The relative levels of inflation would be a lot different without the Ukraine situation.
Trump, on the other hand, was harmed by the media blitz against him. But that’s ammunition spent that cannot be reloaded. If Trump were to be reelected again, the same effect would unlikely be seen.
In any case, the Republicans still pretty handily won the popular vote.
Trump won’t make it to the candidacy.
“I read that the Dobbs decision seems to have energized single young women for the 2020 election.”
Yes, polls show that it was a significant factor.
“In any case, the Republicans still pretty handily won the popular vote.”
Yes indeed. Repubs have 3 million more votes than Dems for the House total. In 2018, Dems had 8 million more votes than Repubs.
“Trump, on the other hand, was harmed by the media blitz against him.”
That may have impacted swing voters, but the Dems follow their news channels and the Repubs follow theirs.
Biden’s win wasn’t so much a result of his candidacy but of Americans voting against Trump. While Trump’s midterms gained 2 R seats in the Senate, the House lost R seats in the two elections following his instalment. If Warnock wins Georgia Dems will have gained senate seats two elections in a row.
With the runoff going to Warnock, that makes a very rare 2 senate seat midterm gain of the President’s party.
Tsk – Dems secured ONE more seat. And it’s still very rare for that to happen in the midterms for the sitting president’s party.
“If Trump were to be reelected again”
Given his stated desire to break his Presidential vow to protect the Constitution, it is hard to understand why any real conservative would vote for him.
“Given his stated desire to break his Presidential vow to protect the Constitution, it is hard to understand why any real conservative would vote for him.”
I suppose we can have a Pretend Republic for a while… What comes after that, I do not know, but I doubt it’s good. You make a good argument that conservatism is doomed.
Andrea…it’s time we in the true West took a look at the excesses of the European Union. I am not talking about Biden and his Mickey Mouse politics, the Democrats aligned with the EU to oust a democratically-elected president in the Ukraine which led to the current war. I am talking about Trump’s point that the EU, through NATO, are not pulling their weight or paying their fair share. Unfortunately, the freeloaders include Canada.
The EU is highly dependent on the US to protect them and they don’t dare cross the US. You can bet anything Biden has created is idiotic, based on lip-service with no substantial meaning.
When you really look at it, the EU has gotten themselves between a rock and a hard place. They have cut off Russia, hence required fossil fuels, and if they cut off or alienate the US, they are in deep doo doo.
Left up to Biden and his ilk, like Trudeau in Canada, we will soon be facing our own fossil fuel crisis.
Russian and US conservative propaganda.
The US aligned itself with the revolutionaries, but called for peaceful negotiations and a democratic election. The US did nothing material to “oust” the then president of Ukraine. Only policy measure aside from aid that had been ongoing in the Ukraine for 20 years through Republican and Democrat governments, was to ban 20 members of the Ukranian government from entering the US.
It wasn’t just the Democrats.
John McCain (a Republican) visited Ukraine in 2013 and publicly expressed his support for the revolutionaries and a peaceful resolution involving elections.
Recent European aid through the war makes up two thirds of assistance to that country.
You read conspiracy theories and gullibly regurgitate them.
Not to mention that you disregard the Ukranian people’s own agency in Ukranian matters. Patronising.
Hear hear! Shameful to read such Russian propaganda and conspiracy theories here. And, coming from what I would think is an American Republican viewpoint, I can only imagine that that great Republican American Ronald Reagan must be spinning in his grave, seeing as how his great party has become apologists for a still-communist thinking dictator like Putin. For shame.
Just as expected and as the technical analysis has shown for a long time.
(Use e.g. Google Translate)
Australia, Tropics and USA48, now or in a few months, are in declining climate in terms of scientific measures, 30 year moving average value. And all others most likely in a few monts more. Or less.
https://alvarnyren.wixsite.com/aidtrade/post/mina-klimatmodeller-30
Alvar Nyrn
Before I start translating your stuff: which period of UAH 6.0 LT are you talking about?
Here is a chart showing the Tropics from Dec 1978 till Nov 2020:
https://drive.google.com/file/d/11TBp6R5RmBbFwtBm_2agsYwevbLsh_zi/view
Trend: 0.117 +- 0.010 C / decade
*
Which period are you talking about?
Hopefully you didn’t start, like so many do, just before 1998… because then there is no chance to have any positive trend till today.
You realize that the reason they cite the pause is because it contradicts the CO2 control knob narrative. Thats the most important thing. Not at all skeptics think that the world is going to cool, but it is a possibility for sure. Although I can agree with what you say regarding the cherry picking from 2016.
I am talking of all parts from dec 1978. And I am talking about 360 months MA. That is what you call a climate period, and the MA is the only way to describe the situation correctly.
” … and the MA is the only way to describe the situation correctly. ”
Here is the same Tropics plot as above, but with
– a 360 month running mean
plus (because the Savitzky-Golay filter complained about 360 months being too long to form a valid window)
– a 180 month S-G filter output:
https://drive.google.com/file/d/1MJJGdr-Spm53lG4UN8V36CSKOhOc4u3F/view
Due to UAH LT’s excessive reaction to El Nino events, which are eliminated by the HQLP filter, the trend for the red S-G time series is reduced down to
0.095 +- 0.001 C / decade, i.e. 80 % of the trend for the original time series.
What exactly do you mean with ‘decline’ ?
Decline is MA360 below zero. Now or in a few months is refering to the weakening climate overall and in all regions when using the TA OSC(illator) that is a comparison between two MA, MA5 and 35 in this case which is the most common and reliable way to register a weakness. Australia have already been in negative territory intermittantly and the strong period during 1992+ will be subtracted more and more.
Time will tell.
“HQLP filter”
You do not use High Quality Low Pass filters in your work.
Here is Sept data for the tropics with a 60 month HQLP filter applied (This removes all the high frequency components above 60 months/5 years)
https://climatedatablog.files.wordpress.com/2022/10/uah-tropics.jpeg
Sorry to bother you but the monthly UAH temperature image chart doesn’t appear to be downloading on your site. Thank you for all the work that you do.
dan…do you mean this site???
https://www.nsstc.uah.edu/climate/
One warming event this century which lasted 6 months. The planet only warms during a very strong El Nino. The planet won’t warm again unless there is another very strong El Nino. There is no evidence of CO2 warming in this data set or any other. There is only El Nino warming, La Nina cooling, Volcano cooling.
There is no net positive feedback.
CO2 warming is theoretical as Dr Roy Spencer said it’s a matter of faith.
Beware of people permanently using the word ‘cult’.
” The cult teaches that more ice means more heat. Greenland ice sheet SMB is now in record territory again. ”
Apart from the fact that ‘more ice means more heat’ is their own invention, this is a typical sentence coming from one of these guys who only show at a minuscule portion at the end of a 140 year long time series because that end perfectly matches their narrative.
Here’s how their narrative looks:
https://tinyurl.com/mtv6epuc
Don’t think such people would spend a second in looking at how 2019 behaved! They just would say:
” That’s already three BIG years ago, forget it! ”
*
Let’s have a quick look at Greenland ice sheet’s SMB since 1840, and quickly forget it (duh, that would be kinda ‘dissecting the past’):
https://tinyurl.com/5n952ccd
By the way, we see that as opposed to so many ‘skeptic’ claims, no one hides the Arctic warmth around 1930. It was there, basta ya!
*
Let’s now show at the sat period, 1979-2022:
https://tinyurl.com/yeyujncm
using a quadratic fit estimate for the 26 days remaining till Dec 31.
The reality after Dec 31 could be lower or higher. No one really knows now.
*
What is so unusual in this sudden ramping up by 400 Gt from 2019 till 2022? The same happened only 40 years ago.
And why would that truly impressive steep slope in 2022 suddenly make us forget that the 2019 SMB was the third lowest since 1840 after 1931 and 2012?
Answer: Skeptics know everything better.
Yes Bindidon, everyone needs to be reminded of the cult’s nonsense. Thanks for bringing it up.
The cult claims that two 315 W/m^2 fluxes arriving at a surface will add to 630 W/m^2, thereby meaning the surface will raise to temperature of 325K.
315 W/m^2 is the flux emitted by ice. So the cult believes ice can raise something to 325K (52C, 125F).
Thanks again for bringing this up, Bindidon. It’s important people see such nonsense.
You, Clint R, are the cult here, inventing what other people allegedly would have wsaid what you put in their mouth.
You are exceptionally right, Clint R: Its important people see such nonsense you all the time write here, like the ball-on-a-string and other insane, unscientific stupidities.
Did you defect from west into communist East Germany ???
Bindidon, if you could translate that into English maybe I could help? You seem awfully confused.
Send your complain to Google’s translator team.
And please tell me when you finally managed to write in French and German as I do in English.
I’m not confused at all, Clint R: You’re only writing this nonsense because you can’t contradict me any other way than by ‘ball-on-a-string’ing.
You are only looking at what you want to see.
Bindidon, I can’t contradict NOTHING.
You don’t have a viable model of “orbital motion without axial rotation”. And you can’t discredit the ball-on-a-string. That means you have NOTHING.
“The cult claims that two 315 W/m^2 fluxes arriving at a surface will add to 630 W/m^2, thereby meaning the surface will raise to temperature of 325K. 315 W/m^2 is the flux emitted by ice.”
Possible
“So the cult believes ice can raise something to 325K (52C, 125F).”
False.
As has been explained to the loser-troll, Clint, multiple times, there is no way for ice of any size to shine more than its maximum emitted flux, 315 W/m^2, onto another surface.
But he is apparently just too thick to understand this simple geometric fact.
That’s NOT the issue, Nate.
See here: https://www.drroyspencer.com/2022/12/uah-global-temperature-update-for-november-2022-0-17-deg-c/#comment-1406465
Pup,
If you could do the Pole Dance Experiment maybe I could help?
https://tinyurl.com/dragon-cranks-honey-trap#comment-1406593
Whether it can or not is dependent upon the view factor Nate. It is not capable of doing so to the extend the sum of the view factors exceeds 1.0. So obviously a mean global flux cannot add to another mean global flux as mean any mean global flux has been adjusted to a view factor of 1.0.
This is gibberish.
“The cult claims that two 315 W/m^2 fluxes arriving at a surface will add to 630 W/m^2”
Yep, for a blackbody, no reflection/transmission. Showed many times physics sources confirming that incident fluxes are summed.
“thereby meaning the surface will raise to temperature of 325K.”
… in a black body scenario with view factor of 1.
And 4 such fluxes would then result in 113C, 235F. Plenty hot enough to boil water!
Congrats barry, you finally learned your cult is boiling water with ice.
Nope, and it’s been explained to you numerous times why that is.
An ice cube gives off 315 W/m2. But that is not what arrives at the receiving surface – it’s substantially less. View factors/incidence.
So how can you get the full 315 W/m2 from ice on a receiving surface? If the entire view factor for the receiving surface is 1. The entire field of view would have to be a dome of ice.
Same whether it’s one dome of ice, or many little ice cubes making up the dome.
Take one ice cube out of the dome and the receiving surface gets less than 315 W/m2.
Wrong again, barry. The two 315 W/m^2 fluxes arrive at the surface: “The cult claims that two 315 W/m^2 fluxes arriving at a surface will add to 630 W/m^2”
” Wrong again, Barry. The two 315 W/m^2 fluxes arrive at the surface: ‘The cult claims that two 315 W/m^2 fluxes arriving at a surface will add to 630 W/m^2″
Ice EMITS a maximum 315 W/m^2. TWO 315 W/m^2 emitted from ICE cannot ARRIVE simultaneously at a surface!
The lying scumbag switches EMITS to ARRIVES.
Nate, I’m enjoying your meltdown. You don’t have a clue about the discussion, yet you jump in with a vicious attack. This “ice boiling water” nonsense has really got you fuming. It’s like the ball-on-a-string. Reality always wins, meaning your cult always loses.
What is being discussed is fluxes ARRIVING. The only ones trying to divert from ARRIVING is your cult. Go back and find how this started.
But even if you want to change to emitted fluxes, you have to then find what flux you want to use for ARRIVING. Then, you are faced with using the same bogus math that Folkerts used. And that STILL makes your cult WRONG. It’s like I’ve said from the first, if you don’t have enough ice to boil water, just bring more ice. That’s how your bogus math works.
Now, please continue your meltdown. That’s why this is so much fun.
“You dont have a clue about the discussion”
Yes I do, loser, you and I discussed the very same thing, a couple of days ago, until you had no answers and ran away.
https://www.drroyspencer.com/2022/11/canadian-summer-urban-heat-island-effects-some-results-in-alberta/#comment-1403760
Remember?
Even when your lies and strawmen are pointed out for all to see, you shamelessly repeat them.
Thats how we recognize pure trolling.
And you use the ill-logic that ice cannot boil water to argue that two fluxes ARRIVING at a surface do SUM.
Which ignores the fact that ice can NEVER produce two fluxes of 315 W/m^2 both arriving at the same surface.
Yet YOU keep bringing up the strawman that WE are claiming that ice can boil water.
We never do that, loser-troll.
Correction
And you use the ill-logic that ice cannot boil water to argue that two fluxes ARRIVING at a surface do not SUM.
Nate, I’m enjoying your meltdown. When all you’ve got are insults, false accusations and misrepresentations, it means I don’t have to waste much time responding. Yet others get to see you for what you are.
Please continue.
“false accusations and misrepresentations”
sez loser Clint every time he has no answer.
Nate, if we give Clint the benefit of the doubt that he is not simply trolling, then the pretty clear conclusion is that he has fundamental blind spot that he can’t ever seem to understand. It’s as if he thinks that if a 315 W/m^2 flux leaves some some surface (eg a sheet of ice), then it remains a 315 W/m^2 flux until it is received by some other surface. That view works for some concrete examples — if I throw a 315 g ball, then you will receive a 315 g frisbee; if I mail a $315 check, you will receive a $315 check. But that view does NOT work for flux.
It’s like the inverse-square law does not exist in Clint’s world. As if once a flux is created at 315 W/m^2, it forever retains its original ‘315 W/m^2’ness characteristic, rather than becoming weaker and weaker flux as it gets farther and farther from the emitting ice sheet.
You know how it really works. I know how it really works. Every textbook and professor knows how it works. Either through ignorance or stubbornness or trollishness, the simple, correct answer eludes Clint.
“ignorance or stubbornness or trollishness, the simple, correct answer eludes Clint.”
Yep I think it actually is all three.
Fraudkerts invents more fraud and troll Nate swallows it.
Norman used to wear out knee pads worshiping Fraudkerts, but I believe troll Nate wants to have his love-child.
Notice that when Clint is in over his heaed, he reverts to ad hom and insults. Never actually addressing the science.
Maybe start with this. A sheet of ice 1m x 1m emits a 315 W/m^2 flux of thermal radiation. Does a surface say 5 m away receive a 315 W/m^2 flux from this sheet of ice?
Notice when fraudkerts gets caught making up crap, he tries to pretend he understands physics.
How many podunk community colleges “terminate” professors? Fraudkerts must have really done more than just fraud….
A sheet of ice 1m x 1m emits a 315 W/m^2 flux of thermal radiation. Does a surface say 5 m away receive a 315 W/m^2 flux from this sheet of ice?
Fraudkerts, you can try all the distractons you want, but fluxes do NOT simply add. 315 W/m^2 and 315 W/m^2 arriving at a surface do NOT add to 630 W/m^2.
You try to pervert physics, then you deny you’re doing it when you get caught red-handed.
You’re a fraud.
If you are not winning a debate, then it must be because your opponents are frauds, and members of a cult!
Never mind that there is no evidence for that, you can surely do better than that!
Your challenge is to make an actual logical argument with science facts to support your claims.
Try that for a a change.
Troll Nate, I’m winning a debate not only because my opponents are frauds and members of a cult. But also because I’m on the side of science and reality.
None of you cult idiots can make a logical argument, with science facts, to support your claims. Want to try?
Show a valid technical reference that two 315W/m^2 fluxes arriving a surface will result in the surface being 325K. And omit all insults, false accusations, distractions, and misrepresentations.
Try that for a change.
A sheet of ice 1m x 1m emits a 315 W/m^2 flux of thermal radiation. In your understanding of physics, does a surface say 5 m away receive a 315 W/m^2 flux from this sheet of ice?
“Show a valid technical reference that two 315W/m^2 fluxes arriving a surface will result in the surface being 325K.”
There is never going to a technical reference with THOSE specifics.
What law of physics are you questioning?
The basic physics that you have been questioning, AFAIK, is whether light intensity from two sources arriving at the same point sums or not.
Here is one source confirming that it does.
“when there are two or more light sources, the total light intensity measured at any point in the environment is the sum of the intensities measured with just one of the sources on at a time.”
https://people.eecs.berkeley.edu/~jfc/cs184f98/lec28/lec28.html
Im sure their are many more confirming this.
What other physics laws or principles do you want?
That’s a perfect example that you don’t understand ANY of this, Nate. That reference is talking about REFLECTED light. Your hero Fraudkerts is violating laws of physics by claiming two fluxes simply add at a surface, to raise the surface temperature so that it emits the sum of the two fluxes. That simply does NOT happen.
You don’t understand ANY of this, but you have a history of swallowing anything Fraudkerts spews, while falsely accusing me.
“That reference is talking about REFLECTED light. ”
False.
Show us something, a source, anything at all that agrees with you.
Constantly saying that your opponents ‘don’t understand any of this’ is admitting that you have not convinced anyone.
Why does the surface matter here at all?
If two sources of light can SUM, then what facts or logic prevents them from then hitting a surface and being abs*orbed?
It appears that you are simply making this nonsense up.
Nate, I gave you one more chance to see if you could behave like a responsible adult. You don’t have a clue about the relevant physics. You confuse “superposition” with “absorp.tion”. You don’t want reality, you want to pervert reality to fit your cult beliefs. You have no interest in learning. You just find things you can sling against the wall, hoping something will work.
You support your cult beliefs with debate tactics. You use debate to avoid reality and to distort truth. You will argue about anything, believing that means you are smart. Your cult lives by arguing over definitions and semantics. Just look at how fraudkerts keeps attempting the same distraction. He’s got NOTHING. Fighting reality means that you’re an idiot and a loser. Reality always wins.
https://www.drroyspencer.com/2022/12/uah-global-temperature-update-for-november-2022-0-17-deg-c/#comment-1407630
“Nate, I gave you one more chance to see if you could behave like a responsible adult.”
If that means behave better than you, then DONE.
Apparently your ‘no insults’ etc requirements are not meant for you.
“You dont have a clue about the relevant physics.”
Again, no relevant physics shown, so….
“You confuse ‘superposition’ with ‘absorp.tion'”
False, Your issue was with superposition, and I addressed it.
I made clear that I see that as a SEPARATE issue from absor.ption.
I asked:
“If two sources of light can SUM, then what facts or logic prevents them from then hitting a surface and being absor.bed?”
Do you have a science answer or not??
https://www.drroyspencer.com/2022/12/uah-global-temperature-update-for-november-2022-0-17-deg-c/#comment-1407980
As usual, no answer. No science answer. Nothing.
Then we can conclude is, there is no science reason why two sources cannot SUM, arrive at a surface, and if the surface has a high emissivity, be abso.rbed.
Oh well. Moving on.
Nate you argue inconsistently. If the atmosphere is made up of 20 layers of co2 as suggested by your beliefs in global warming why don’t those layers all “sum up” and radiate out toward the nearest star rather than your theory suggesting they don’t add and only the top coldest layer radiates out to space meekly?
Typical liberal thinking these days physics applies only if it supports what your daddy taught you. Of course it adds up beaming down. So your theory is radiation only adds in the direction of the pull of gravity? ROTFLMAO!!! Nate Bozo the Clown has absolutely nothing on you!
“If the atmosphere is made up of 20 layers of co2 as suggested by your beliefs in global warming why dont those layers all ‘sum up'”
Odd question, Bill. It suggests you don’t really have a good understanding of the model. The layers, by definition, are thick enough to be opaque.
Sorry troll Nate, but you’ve failed again.
You were given a chance to make a logical argument, with science facts, to support your claims:
Show a valid technical reference that two 315W/m^2 fluxes arriving a surface will result in the surface being 325K. And omit all insults, false accusations, distractions, and misrepresentations.
But, you couldn’t do it. Instead, you tried to distract by claiming the requiurement was too specific! That’s called “weaseling out”. (In science, a “general” law applies to “specific” examples.)
Then you found a link about superposition, and believed it might support your nonsense. But you didn’t understand that superposition has NOTHING to do with this issue.
And notice Fraudkerts just repeats the same thing over and over, like he’s insane or suffering from dimentia.
You two fail again, because you’ve got NOTHING.
“You were given a chance to make a logical argument, with science facts, to support your claims:”
I gave you logic, relevant facts and a reference that you dismissed. You shown no interest in science facts.
“And omit all insults, false accusations, distractions, and misrepresentations.”
All of these are things that make up the bulk of your posts. What is lacking in them is science facts.
We have addressed the issue of superposition. Fluxes, arriving at the same point in space, SUM.
You then complained that this SUMMING does not happen for fluxes arriving at, and being abso.rbed by surfaces.
So I will ask again:
If two sources arriving at the same point SUM, as my source showed:
a. what law of physics prevents them from then striking a surface?
b. if the surface has a high emissivity, what law of physics prevents them from being abso.rbed?
If you cannot answer these simple questions, then your complaints have no basis in science.
Sorry Nate, but that’s NOT how it works.
YOU are the one promoting nonsense, so YOU must answer questions. I’m not going to answer endless questions about YOUR distractions.
And, I’m NOT going to waste any more time if you can’t support your nonsense.
Show a valid technical reference that two 315W/m^2 fluxes arriving a surface will result in the surface being 325K. And omit all insults, false accusations, distractions, and misrepresentations.
This is your last chance — Put up, or shut up.
This was your last chance,
You make the nonsense claims, but as ever, put up nothing to back them up.
If you cannot back up your silly claims, then we all understand that they are BS.
what object nate is not opaque to the radiation it omits dufus?
that would be emits not omits.
Look up what opaque means, Bill. Then you should have your answer “why dont those layers all ‘sum up’ and radiate out”.
“what object nate is not opaque to the radiation it omits dufus?”
Any layer containing too few abso.rbing molecules to prevent all the light at that wavelength from passing thru.
A ruby that has too few of the right absor.bing impurities is pink, and sometimes called a pink sapphire.
https://en.wikipedia.org/wiki/Ruby
Thats correct.
But there is no way for fluxes to add unless the viewfactor is <1.0.
For solar flux, if a CO2 molecule gets in the way that solar flux will be blocked.
Then all the CO2 can do is remit it. You then can't sum the CO2 emission and the blocked portion of the solar emissions.
If you can come up with something that emits without absorbing then you would have something. But unfortunately for you nothing does that.
What is correct?
“For solar flux, if a CO2 molecule gets in the way that solar flux will be blocked.”
WRONG. Again, your lack of knowledge of physics leads you astray, Bill.
Tyndall explained it so clearly 150 y ago. https://en.wikisource.org/wiki/On_Radiation_(Rede_Lecture)
“Imagine the superficial molecules of the earth trembling with the motion of heat, and imparting it to the surrounding ether; this motion would be carried rapidly away, and lost for ever to our planet, if the waves of ether had nothing but the air to contend with in their outward course. But the aqueous vapour takes up the motion of the ethereal waves, and becomes thereby heated, thus wrapping the earth like a warm garment, and protecting its surface from the deadly chill which it would otherwise sustain.”
BTW, he showed same for CO2 molecules.
He continued:
“It might however be urged that, inasmuch as we derive all our heat from the sun, the selfsame covering which protects the earth from chill must also shut out the solar radiation. This is partially true, but only partially; the suns rays are different in quality from the earths rays, and it does not at all follow that the substance which absorbs the one must necessarily absorb the other. Through a layer of water, for example, one tenth of an inch in thickness, the suns rays are transmitted with comparative freedom; but through a layer half this thickness, as Melloni has proved, no single ray from the warmed earth could pass. In like manner, the suns rays pass with comparative freedom through the aqueous vapour of the air: the absorbing power of this substance being mainly exerted upon the heat that endeavours to escape from the earth. In consequence of this differential action upon solar and terrestrial heat, the mean temperature of our planet is higher than is due to its distance from the sun.”
Nate says:
”Imagine the superficial molecules of the earth trembling with the motion of heat, and imparting it to the surrounding ether; this motion would be carried rapidly away, and lost for ever to our planet, if the waves of ether had nothing but the air to contend with in their outward course. But the aqueous vapour takes up the motion of the ethereal waves, and becomes thereby heated, thus wrapping the earth like a warm garment, and protecting its surface from the deadly chill which it would otherwise sustain.”
thats certainly an observation but falls far short of a physics explanation of how it comes about.
You have multiple ways to warm the sky. It is estimated that GHG absorb about 80watts of incoming solar and do so on the topmost layer of GHG.
How the sky warms is primarily by convection. GHG actually cool the sky by not only reemitting that ~80 watts at the top layer but by having another 120 to 160 watts transported from the surface primarily by convection to TOA. If GHG did not exist in the atmosphere the atmosphere would be much hotter.
I say primarily by convection because the more layers of GHG in the atmosphere the more dependent it is upon convection.
So while it might be reasonable to assume this multiple pathways of heat transport might be responsible for a true greenhouse effect it is far from established that it is. And if it is our near surface atmosphere temperature which provides the basis for mean global surface (sic) temperature may be primarily due to the fact that GHG are inefficient at cooling the atmosphere. Thus additional CO2 in the atmosphere could lead to nothing, more warming, or more cooling with the result perhaps largely dependent upon how you define surface (sic) temperature.
Myself I don’t have an established opinion. I like to see how the math and physics actually work out so I can audit it based upon established laws of physics and mathematics.
Did you miss the second paragraph? It directly rebuts your post.
In the modern understanding we can replace
” But the aqueous vapour takes up the motion of the ethereal waves, and becomes thereby heated”
with “But the aqueous vapour takes up the motion of the ethereal waves, with the help of convection, and becomes thereby heated”
There is no question that the atmosphere is heated this way.
And then
“thus wrapping the earth like a warm garment, and protecting its surface from the deadly chill which it would otherwise sustain.”
A warm garment is also heated by the convection, conduction and radiation, and it is undeniable that it keeps us warm.
Nate says:
”A warm garment is also heated by the convection, conduction and radiation, and it is undeniable that it keeps us warm.”
So you recognize that it isn’t due just to adding radiative fluxes together. Indeed, something may be necessary to create a condition but that doesn’t automatically make it the cause because there may be the need for other ingredients.
One can mount the argument that the sky is capable of keeping the surface warm using SB equations and other physics due to the ability of water vapor to carry twice the energy aloft than indicated solely by its temperature and releasing that energy throughout the atmosphere including high in the sky into the tropopause. Likewise since water vapor is a full spectrum absorber of radiation the atmospheric window may flux in yet to be discovered ways. That is consistent with an already well accepted fact that a small percentage change in clouds of less than what we can reliably measure could account for not part of but the entire industrial age warming. CO2 could play an important role but it is far from established.
So just checking, you’ve completely backed away from your post
“For solar flux, if a CO2 molecule gets in the way that solar flux will be blocked.”
after Tyndall thoroughly debunked it?
“So you recognize that it isnt due just to adding radiative fluxes together.”
Non sequitur.
Climate science has not been ignoring convection, if thats what you are talking about, for at least 50 years.
Manabe and Weathereld 1967, explicity included convection in their model, and all the GCMs that followed.
Nate says:
So just checking, youve completely backed away from your post
”For solar flux, if a CO2 molecule gets in the way that solar flux will be blocked.”
after Tyndall thoroughly debunked it?
————————-
Tyndall debunked no such thing. CO2 blocks only the frequencies it emits and the sun emits IR.
Nate says:
Climate science has not been ignoring convection, if thats what you are talking about, for at least 50 years.
Manabe and Weathereld 1967, explicity included convection in their model, and all the GCMs that followed.
————————-
Yes they did in the exact proportions to support previous models and without verifying if the parameters he used correspond to anything in nature.
One does not solve these kinds of problems by producing a model that produces the desired political outcome. Its about physics and not politics. Manabe was embarrassed getting a Nobel for his work. When somebody hands you a million dollars its surprising he would say anything but ‘thank you’.
And I didn’t say they ignore convection they simply haven’t done to measure the change, if any. IMO, there is no expectation of any change. Convection and Conduction would warm the atmosphere in the absense of GHG.
Add some GHG and the atmosphere would then be able to cool. That would provoke some convection to resupply the heat that was lost.
If there are no GHG what would prevent the atmosphere from warming to a temperature found in Death Valley on a summer afternoon?
I don’t see any mechanism that would make the ”coldest” emissions in the atmosphere be the emissions that would warm the surface.
We know all you have are imaginative models and no facts regarding how it works.
Finally we do know that the difference between what the surface emits and the sunlight/atmospheric radiation received is about 50 watts. And evaporation adds about 100watts of which 50 would be added if water didn’t double the normal amount of heat carried by each molecule? Do we need more explanation than that, not to speak of what the actual emissivity is of the surface.
“Tyndall debunked no such thing. CO2 blocks only the frequencies it emits and the sun emits IR.”
C.mon, dont be ridiculous. The sun emits a broad spectrum from UV, visible to IR. Only a teeny-tiny fraction of the spectrum is abs*orbed by CO2 or H2O. But they abs*orb a much larger faction of the IR emitted by the Earth.
That was his point. Did you miss it?
Manabe and Weathereld 1967
“One does not solve these kinds of problems by producing a model that produces the desired political outcome.”
Sure, climate change was a big political issue in 1967??!!
Tee hee hee!
Obviously you were oblivious to politics in the universities of the 1960’s. After all you believed everything they said was science.
Uncertain on the science? Just substitute time-travelling politics!
Climate deniers say the darndest things!
The LSD generation.
In short, temperature is not conserved, energy is.
(wrong thread) ^
barry…summation of fluxes at a surface is not a summation of fluxes. It is a summation of heat produced ***IF*** the radiation is absorbed.
Whether or not the flux is absorbed has to do with the temperature of the source versus the temperature of the absorbing body. If the absorbing surface is at room temperature and the source is ice, nothing gets absorbed.
“summation of fluxes at a surface is not a summation of fluxes. It is a summation of heat produced”
In the greybody enclosure scenario with many surfaces at different temperatures I’ve cited here, from a few physics texts, the calculation is to sum the radiance incident on a surface, subtract the reflected portion, and account for the geometry of the surfaces (shape factor).
https://www.thermopedia.com/content/70/
https://www.eng.auburn.edu/~dmckwski/mech7210/radexchange.pdf (p. 13)
Just summing temperature won’t work because it doesn’t take into account the emissivity of the surfaces. Shine two lamps at a white surface and measure the temperature. Do the same with a black surface. Different results.
We are talking about the addition of fluxes. If you measure a temperature you are measuring the relative heat levels in a substance which is a measure of the kinetic energy of the atoms comprising the surface. At that point, the fluxes no longer exist.
We are talking about fluxes from different incident on a surface being summed. You said you can sum temperature – YOU introduced temperature to this discussion.
You can’t sum temperatures arriving on a surface and get a correct temperature of the surface.
Temperature is a red herring in this argument.
In short, temperature is not conserved. Energy is.
Temperature is a human invention to measure relative levels of thermal energy. The set points upon which the measure is based in the boiling point of water and the freezing point of ice.
Was temperature invented in winter or in summer, Gordo?
Little Willy, please stop trolling.
This is a little off topic, but I have been looking at the video of the lava flows in Hawaii. The image of the heat haze gives the impression that the lava at the point of eruption is heating the air directly by radiation rather than by convection. This would support the greenhouse gas model in much the same way that furnace simulation models rely on CO2 and water vapor for the radiant effect in the combustion area. In that case, the hot combustion gases radiate heat to the furnace tubes. Greenhouse gases absorb and radiate heat very well at elevated temperatures over 1,000 F.
tim…” The image of the heat haze gives the impression that the lava at the point of eruption is heating the air directly by radiation rather than by convection”.
***
The air is being heated by direct conduction, not convection. In a similar manner, the entire atmosphere is being heated via conduction, especially in the Tropics.
The haze to which you refer, which can also produce a mirage, is due to a difference in air density between a hot surface and different layers of air above it. Air density, of course, is related to the atoms/molecules of air, which is associated with heat, not radiation.
*********************
“This would support the greenhouse gas model in much the same way that furnace simulation models rely on CO2 and water vapor for the radiant effect in the combustion area”.
***
Are you serious??? Do you really think, at furnace temperatures, CO2 and WV are the only means of radiation? WV would not even exist at those temperatures and CO2 as a trace gas would produce an insignificant amount of heat, as in the atmosphere.
Have you ever run a furnace simulation? The only parameters are temp., CO2 content and water vapor from the combustion. Flame size and shape are irrelevant. Flame is just visible light. The simulation is very sensitive to CO2 and water vapor content, as it is affected by the amount of excess air allowed for safety to ensure that zero oxygen does not occur. If any direct fired furnace or package boiler on earth ever had its 1,700 F combustion gases replaced with 5,000 F pure nitrogen it would fail to operate. There is that much difference. IR radiation is a necessary feature. Maybe you should get out, learn some science or just basic industrial technology before making a complete fool of yourself.
tim s….” Flame size and shape are irrelevant. Flame is just visible light”.
***
Seriously idiotic comments. The flames are burning hydrocarbons, for cripes sake. Where did you get this propaganda?
Just in case anyone is confused about this, at 15% excess air, which is 3% residual oxygen, the combined effluent resulting from natural gas combustion is about 27% CO2 and water vapor (9% CO2 and 18% water vapor).
If you burn wood, natural gas/fossil fuels, it creates CO2 and water vapor. Burning natural gas or hydrogen makes a lot of water vapor.
For natural gas the ratio is 2:1.
CH4 + 2 O2 -> CO2 + 2 H2O
UAH team,
Ever consider a Twitter page that has the up to date climate models projected out to like 2030 and a monthly update for global temperature estimates?
Now that it could get traction from unbiased or perhaps less biased algorithms, it might be a powerful talking point for society. It just seems something that would be high impact.
Thanks
At 2030 AD global average air surface temperature will rise by less than .1 C
And by 2040 AD could add another .1 C
And by 2040 AD global average surface temperature will still be about
15 C.
15 C or 59 F is a cold air temperature.
Earth has a cold global average air temperature because Earth is in
an Ice Age.
Earth present Ice Age is called the Late Cenozoic Ice Age which started about 33.9 million years ago.
And the latest few million years has been the coldest.
We are between glaciation periods, which is called an interglacial period, which is relatively a short period of time.
Our interglacial period is called the Holocene interglacial period and the Holocene thermal maximum happened over 5000 years ago.
Over 5000 years ago, Africa was wetter than it is today.
And wetter period is called, African humid period:
https://en.wikipedia.org/wiki/African_humid_period.
During the Holocene thermal maximum global levels were 1 to 2 meters
higher than present sea level.
By 2100 AD we will still be in our Ice Age and global air temperature
might be higher than 15 C.
And the reason we in an Ice Age or also called icehouse global climate, is because Earth entire ocean is cold.
Our present ocean is said to be 90% of it being 3 C or colder.
And it’s guessed that average temperature of the ocean is about 3.5 C
and by the year 2100 AD, our ocean will be about 3.5 C.
As probably will be in century following it.
The ocean holds enormous amount of heat, a million nuclear bombs wouldn’t measurable warm it. Or, it takes a long time to warm or to cool the entire ocean.
NASA and NOAA say:
“Covering more than 70% of Earths surface, our global ocean has a very high heat capacity. It has absorbed 90% of the warming that has occurred in recent decades due to increasing greenhouse gases, and the top few meters of the ocean store as much heat as Earth’s entire atmosphere.”
https://climate.nasa.gov/vital-signs/ocean-warming/
If ocean could be warmed enough, Earth would leave this Ice Age.
But if ocean were to warm by just .5 C this would also have a huge effect upon global climate [but we would still be in an Ice Age]
In previous interglacial periods the ocean was 4 C or warmer and it caused and sea levels rise 4 to 9 meters.
In previous interglacial periods the ocean was 4 C or warmer and it caused global surface temperature air to about 17 to 18 C and the sea levels to rise 4 to 9 meters above present levels.
Btw, some imagine, higher CO2 level will delay Earth from returning
to it’s next glacial period- and for very long time, ie, thousands or tens of thousand of years of delay.
But everyone assumes without higher CO2, we will return- though whether it’s centuries [or shorter] or thousands of years, they might differ in opinion. Also there is no real definition of when a glaciation period begins, though the temperature records, indicate a gradual cooling [though it drops faster and rises back up, falls again, etc. And after 10,000 plus years, gets coldest with ice sheets covering Asia, America, and Europe. And then you get rapid global warming, and you in interglacial period, all Earth deserts green, and go from sea levels 100 meter lower, to higher sea levels than we have now.
Anyhow, I have my theory on why this occurs.
Well, not really a theory, I agree with everyone that the Milankovitch cycles are related or causal in terms of global warming and global cooling.
There not a Milankovitch theory, really.
It’s more of an observation, and guesses of why the Milankovitch cycles align with historical global temperatures.
It similar to analyzing ice cores to determine past global air temperatures- not something you call a theory, though likewise there some explanation or interpretation which is “added”. There is likewise no ice core theory.
Though there isn’t greenhouse effect theory, either.
What might called greenhouse effect theory, is what I would say, is
mostly, a fundamental misunderstanding of the planet Venus.
{{And throughout history this goddess has been misunderstood- particularly by men.
And puritan Americans [all the girls and boys] are not even up to a point of misunderstanding, rather they are in different time zone.
I am not piling on about what Americans have done wrong, it’s just they doing something different. And people would have admit they doing things quite different, lately- and of course, will, predictably in future, we do lots other weird stuff.
But I will point out {a truism}, all American stupidity doesn’t seem to directly hurt America, but instead “lands” elsewhere in the world- which does tends come back, and bite them. But it’s not really the same as karma.}}
GB says the planet’s thermal stability source is water due to the Earth’s perfect mass. I agree.
> Though there isnt greenhouse effect theory,
I thought you said you were a luckwarmer, gb.
Try coherence. It works.
— Willard says:
December 8, 2022 at 3:30 PM
> Though there isnt greenhouse effect theory,
I thought you said you were a luckwarmer, gb.–
Lukewarmer.
And I also said, it appears that lukewarmer have proven to be correct, and these days, everyone has become a lukewarmer.
Luckwarmers:
http://rabett.blogspot.com/2015/02/luckwarmers.html
No, they have not:
https://www.ipcc.ch/report/ar6/wg1/chapter/chapter-7/
And yes, if you play the luckwarmer in one comment and a Sky Dragon crank in the next you are not being consistent.
Willy, you might play your games, but you don’t claim
to believe that China large CO2 emission is going to cause
a large increase in global temperatures.
I think higher CO2 levels which might by caused by China burning more
4 billion tonnes coal per year might cause a small increase in
global temperature.
And I think China is currently at Peak Coal.
China has been paying around $400 per ton for Coal for more 6 months and China is largest importer of coal in the world.
https://tradingeconomics.com/commodity/coal
It appear to me, China would not import so much steam coal if
it had a lot of domestic steam coal left.
And it seems if China didn’t import so much coal, China would have
a lot Chinese citizens freeze to death, this winter.
Anyhow, I said I am lukewarmer. And Roy Spencer has said he is
a lukewarmer.
And no one on this blog has tried to argue global temperatures are going to suddenly increase.
And everyone agrees that fairly recently, we were in cold period, which is called the Little Ice Age.
And everyone agrees we in 33.9 million year Ice Age, which is called
the Late Cenozoic Ice Age.
And everyone in the world is a lukewarmer. Though they might want
exaggerate how much warming will occur for various political reasons.
If we were in danger from a slightly warmer world, why would so many people on board spend so much time arguing about the spin of the Moon?
This blog is not about exploring the Moon, but everyone seems very
interested in the Moon.
I agree that exploring the Moon is exciting and important.
gb,
But China:
https://climateball.net/but-china/
Look. No need to play squirrels. It’s quite simple.
Luckwarmers accept that the Greenhouse Effect.
Sky Dragon cranks do not.
You got to choose.
“Luckwarmers accept that the Greenhouse Effect.”
Greenhouse Effect and Greenhouse Effect theory
are different things.
Some imagine the Greenhouse effect is caused solely
due to CO2 gases.
“It’s not many people who imagine this, but:
The greenhouse effect is the way in which heat is trapped close to Earth’s surface by greenhouse gases. These heat-trapping gases can be thought of as a blanket wrapped around Earth, keeping the planet toastier than it would be without them. Greenhouse gases include carbon dioxide, methane, nitrous oxides, and water vapor. (Water vapor, which responds physically or chemically to changes in temperature, is called a “feedback.”) Scientists have determined that carbon dioxide’s warming effect helps stabilize Earth’s atmosphere. Remove carbon dioxide, and the terrestrial greenhouse effect would collapse. Without carbon dioxide, Earth’s surface would be some 33C (59F) cooler. ”
https://climate.nasa.gov/faq/19/what-is-the-greenhouse-effect/
Think NASA gets some things right, but not this.
If there was a greenhouse effect theory, why NASA allow
that?
It’s simply ass backward.
If Earth is cold, one will get dangerous low CO2 levels, like we got 20,000 years ago.
All Ice Ages cause low CO2 levels. Earth currently has low CO2 levels.
Having ocean with average temperature of about 3.5 C, causes low CO2 levels.
And when the average temperature of Earth ocean is 5 C or colder, it’s in an Ice Age- and it has lower CO2 levels.
And when an Ice Age gets the coldest it ever gotten [20,000 years ago] it gets dangerously lower CO2 levels [plants die].
Having 180 ppm with not kill a human [human’s breath is about 40,000 ppm- somehow having no CO2 will kill humans or other animals, but plants need higher level of CO2 then an animal, animals needs plants. No plants every higher lifeform dies.
There is recent idea that all life need oxygen, or without oxygen
no know life could exist. I don’t have opinion about it.
Keep waffling, gb.
It’s quite simple, just name an author of the greenhouse effect
theory.
Right after you name the author of number theory, gb.
My offer that you keep waffling is still on the table.
google says:
Andr Weil
David Burton
Andrew Granville
George Andrews
G. H. Hardy
And there are more, just google: Number theory author
Which one is the author, gb?
I asked for *the* author of number theory, not random authors who wrote about number theory.
Just like you did.
Number theory is as old as the Euclidean algorithm at least.
The point you might wish to waffle over is that scientific theories do not have authors.
willard:
“I asked for *the* author of number theory, not random authors who wrote about number theory.”
These not authors of books, rather they are authors of theories regarding number theory.
Al Gore is not stupid enough to say he is an author of greenhouse theory, but he wrote a stupid book about global warming.
Probably with a lot help, Al Gore wrote a book called, An Inconvenient Truth. {also the movie}.
People author stuff written in some textbook, again such people don’t claim they are an author of the greenhouse effect.
And I asked: “… just name an author of the greenhouse effect
theory.”
It’s not Al Gore and it’s not some textbook, it’s an author of the
greenhouse effect theory.
You could give list of them, or an author you have the most confidence in being correct.
But I am just asking for one.
And I don’t care if think actually correct.
Just existing theory not proven to be wrong, yet.
Let me give more examples of what are not authors of the greenhouse effect theory:
From wiki:
https://en.wikipedia.org/wiki/Svante_Arrhenius
“Arrhenius was the first to use principles of physical chemistry to estimate the extent to which increases in atmospheric carbon dioxide are responsible for the Earth’s increasing surface temperature.”
Not an author of the greenhouse effect theory
Of course, this not true, either, otherwise the IPCC could give a predictions rather a bunch of different projections.
Or IPCC could state how warming has occurred from CO2 levels and have a prediction of much will occur with future CO2 levels.
And:
“In the 1960s, Charles David Keeling demonstrated that the quantity of human-caused carbon dioxide emissions into the air is enough to cause global warming.”
Not author of greenhouse effect theory and also, nor is the above statement correct.
> theories regarding number theory
What’s a theory of a theory, gb?
What Is Number Theory?
–Number theory is the study of the set of positive whole numbers
1, 2, 3, 4, 5, 6, 7, . . . ,
which are often called the set of natural numbers. We will especially want to study
the relationships between different sorts of numbers. Since ancient times, people
have separated the natural numbers into a variety of different types. Here are some
familiar and not-so-familiar examples:
odd 1, 3, 5, 7, 9, 11, . . .
even 2, 4, 6, 8, 10, . . .
square 1, 4, 9, 16, 25, 36, . . .
cube 1, 8, 27, 64, 125, . . .
prime 2, 3, 5, 7, 11, 13, 17, 19, 23, 29, 31, . . .
composite 4, 6, 8, 9, 10, 12, 14, 15, 16, . . .
1 (modulo 4) 1, 5, 9, 13, 17, 21, 25, . . .
3 (modulo 4) 3, 7, 11, 15, 19, 23, 27, . . .
triangular 1, 3, 6, 10, 15, 21, . . .
perfect 6, 28, 496, . . .
Fibonacci 1, 1, 2, 3, 5, 8, 13, 21, . . . —
https://www.math.brown.edu/johsilve/frintch1ch6.pdf
And etc
And how about wiki:
https://en.wikipedia.org/wiki/Number_theory
There also what called philosophical matters related
to numbers. Also a lot religious crazy stuff related to it.
In a word, it’s endless.
And does endless, exist?
Willard says:
Look. No need to play squirrels. Its quite simple.
Luckwarmers accept that the Greenhouse Effect.
Sky Dragon cranks do not.
You got to choose.
——————————-
No you don’t Willard. Even the CAGW nutcases will deny that the greenhouse effect acts like a greenhouse effect because they want it to work another way to support their predictions.
What if it works like a greenhouse? Then the greenhouse effect would be saturated except for the addition of water vapor where water vapor is currently very sparse. Then CO2 would do nothing. Is saying the atmosphere really does act like a greenhouse is that denying the greenhouse effect?
Its like taking all the versions of Fauci telling us masks both do and don’t work. Which one do you deny?
For you its like a religious belief. Thats why you continue to hang around.
As usual little Willie has no response. He doesn’t know how the greenhouse effect works either despite his constant and vacuous claim every expert does.
barry…and swannie…”The AMSU receiver is designed to respond to O2 frequencies over a range.
No, they are set at specific wavelengths.
Channel 5 = 53.56 GHz
Channel 7 = 54.94 GHz
Channel 9 = 57.29 GHz
Each frequency is emitted by O2 at a certain temperature hence a certain altitude.
No, this is your fundamental misunderstanding.
Any object emits at a range of frequencies regardless of temperature, with the peak emissions corresponding to the temperature. Youll recognize Weins curve”.
***
No misunderstanding on my part, Barry. You don’t even understand the difference between frequency and wavelength.
53.56 Ghz is a frequency, not a wavelength. According to my calculations the wavelength should be about 5.6 mm.
The channel 5 AMSU receiver is set to receive 53.56 Ghz as its centre frequency because that is the frequency emitted by O2 at the 4 km altitude. Channel 5 is capable of detecting O2 emissions right to the surface, albeit at reduced amplitudes wrt the centre frequency.
If you look at the block diagram of the AMSU receiver it has a heterodyning unit to convert incoming radiation over a broad range of frequencies, centred around 53.56 Ghz. That means it is receiving O2 emissions from various altitudes centred at about 4 km. If the AMSU unit did not have that ability it would be useless for determining temperatures at different altitudes.
Objects may emit over a continuum if they are heavily laden with elements, like the surface. However, discrete elements emit and absorb only at discrete frequencies, the frequency being reliant on the temperature.
For example, pure sodium emits EM at a frequency coincident with the colour yellow. You can see the colour in sodium vapour lamps. And let’s not forget that Planck’s curve is based on light, which is essentially a continuum of emissions from a wide variety of sources. It’s a mistake to impose Planck’s curve on a solid surface.
If you heat a piece of iron with a torch, it will eventually glow red. As it warms, it glows orange, then yellow, until it reaches the state we call white hot, where it begins to melt. The iron at no time emits a continuum of colours, only specific wavelengths/frequencies directly related to the temperature.
The iron may emit more than one colour depending on where it is heated. It stands to reason that a piece of iron that is heated by a torch will have a continuum of temperatures along its length, hence colours. That’s not what I’m getting at. I am referring to a piece of iron where the temperature is uniform and produces one specific colour.
“The channel 5 AMSU receiver is set to receive 53.56 Ghz as its centre frequency because that is the frequency emitted by O2 at the 4 km altitude.”
Under assumed conditions, yes. A theoretical construct.
But CO2 emits at that frequency throughout the atmosphere, just most intensely at the 4km mark.
Therefore, channel 5 will measure O2 emissions at that frequency throughout the deep layer, with the instrument being most sensitive to the emissions at 4km, as Roy says.
What the AMSU units can’t do is to isolate measurement to that 4km height, nor can any post-processing do so. And this is the bit that you get wrong despite Spencer, Christy and others quoted above making clear that the AMSU channels measure O2 radiance at the frequency throughout a deep layer of atmosphere.
And that’s is why you have been unable to provide a single reference supporting your misconception, while there are several references above setting the record straight.
barry…”the AMSU channels measure O2 radiance at the frequency throughout a deep layer of atmosphere”.
***
First, O2 emits over a broad range of frequencies depending on its temperature. That’s basic quantum theory based on the original Bohr model.
Also, the statement above re deep layers proves my point. Each channel on the AMSU unit measures O2 emissions over a deep layer. With channel 5, the layer likely extends from 4 km downward and an equal distance upward. However, if the channel was only measuring O2 at one frequency, what good would that do?
What’s the point of have a weighting curve for channel 5 showing a bell curve centred at about 4 km where the curve represents the relative amount of O2 emissions versus altitude?
Again…a statement by Roy…
The MSU and AMSU instruments measure the thermal microwave emission from atmospheric oxygen in the 50-60 GHz oxygen absor.p-tion complex, and the resulting calibrated brightness temperatures (Tb) are nearly equivalent to thermometric temperature, specifically a vertically-weighted average of atmospheric temperature with the vertical weighting represented by weighting functions.
There is nothing in the weighting function curves about temperature, only the relative amount of O2 emissions versus altitude (pressure). Roy claims they ‘calibrated brightness temperature’ from the microwave emissions using the AMSU units. So, how do the AMSU units come into the picture?
If you look at a block diagram for channel 5, it shows a heterodyning unit behind the antenna and RF section. The purpose of a heterodyning unit is to beat a local oscillator frequency against incoming frequencies to get an intermediate frequency. The bandwidth of the IF is several megahertz. Why would they bother converting to a bandwidth that wide if they were converting only the centre frequency of 53.56 Ghz?
There is a reason for heterodyning, they are converting a broad band of O2 frequencies per channel. That means there is a broadband of O2 emission frequencies entering the AMSU antenna per channel.
Roy has also explained that the sat AMSU units are calibrated to set points. One of them is the temperature of cold space and the other is an internal heat source. So, they have a range of temperatures established with which to compare the brightness temperatures of received O2 emissions.
“First, O2 emits over a broad range of frequencies depending on its temperature.”
Yes, that was the point of citing the Wein curve upthread.
So, an O2 molecule at 1C emits over a broad range of frequencies that is similar to the range emitted by an O2 molecule at 10C.
The MSU instruments have no way of knowing if the frequency received by an O2 molecule was emitted by a molecule at 10C or 1C.
Therefore, the MSU instrument can’t isolate a specific layer (say at 4km) because the instruments don’t measure temperature, they measure radiance.
“Each channel on the AMSU unit measures O2 emissions over a deep layer.”
Good, you agree.
Roy confirms the point.
“the resulting calibrated brightness temperatures (Tb) are nearly equivalent to thermometric temperature, specifically a >b>vertically-weighted average of atmospheric temperature”
It seems you’ve abandoned the idea that the MSU instruments can isolate temperatures at a specific height. We no longer disagree.
Gordo copied Roy’s statement:
Gordo used that comment to support his previous sentence:
Gordo still doesn’t understand that gasses emit thermal radiation at very specific frequencies in spectroscopic bands, not a wide range like the emissions from a solid or liquid near BB surface.
The MSU/AMSU instruments measure only the net result of the emission and absorp_tion from the surface thru the entire column of the atmosphere. The physics is similar to that of any greenhouse gas, except that a narrow band within the “complex” is targeted which selectively provide the desired range of altitude for measurement. The weighting curves are the result of a theoretical calculation of this process and would be difficult to actually measure in the atmosphere.
binny the site-idiot…”Roy Spencer explained in 2015 that there is NO WAY to obtain correct grid data when using observations as the source, and therefore UAH had to construct the LT data as a sytnhesis of MT, TP and LS!”
***
Speak for yourself, and not for Roy. He said no such thing.
Anyone who suggests an equation can be applied to the atmosphere without observing the temperature of oxygen molecules and using that data in the equation is a raving idiot.
The equation uses data from channels 5, 7 and 9. Those channels are real, physical telemetry which detect oxygen emissions from the surface upward as claimed by John Christy. You are far too stupid to understand that. If you look at the weighting function for channel 5, it extends right to the surface.
Robertson
The ignorant idiot: that’s you.
Read what Roy Spencer wrote, and stop telling you eternal, egomaniac nonsense.
UAH’s LT is a product made out of a synthetic mix of MT, TP and LS.
Basta ya!
Since when is a mix of real data a synthetic mix? You can’t even explain your delusion.
Tell me where UAH gets the data for MT, TP, and LS. Do you think they conjure it out of a hat like they do at NOAA and GISS?
Robertson
” Tell me where UAH gets the data for MT, TP, and LS. ”
When will you stop keeping so stubborn?
I never said that MT, TP and LS wouldn’t be constructed out of real sensing.
I repeat for the umpteenth time that this is NOT the case for LT: LT is a synthetic combination of the three layers above it.
Basta ya.
“LT is a synthetic combination of the three layers above it.”
Do you mean 3 layers, each centered above it?
“LT is a synthetic combination of the three layers above it.”
The LT product might better be described as a weighted combination of overlapping layers which include, to various degrees, the desired LT signal.
“Three layers above it” implies (to me anyway) that the layer measurement boundaries are distinct which isn’t the case and is the core issue.
Nate
” Do you mean 3 layers, each centered above it? ”
No, I mean the atmospheric layers above LT: MT, TP, LS, according to the (probably ad hoc) formula:
LT = 1.538*MT – 0.548*TP + 0.010*LS
It is easy to demonstrate that LT data is, down to 0.01 C, identical to this combination.
I proved that using the Globe, the Nino3+4 area, and even one single grid cell located above Huntsville.
Here is for example the comparison of the grid cell average for the small Nino3+4 region 5N-5S — 170W-120W
– using the LT grid data (blue)
– using the MT/TP/LS combination (dashed red)
https://drive.google.com/file/d/1c1tQQ-XuYa6ddJ705uOgg4K6-_f7qIg-/view
If I wouldn’t have dashed the red lines (anomalies, running mean) you couldn’t see the blue lines behind.
“No, I mean the atmospheric layers above LT: MT, TP, LS”
The layers all overlap don’t they? The MT layer not is ALL above the LT, is it?.
Nate
” The layers all overlap dont they? ”
Yes I agree: it seems rather evident that they hardly could be disjoint.
All I can say is that when processing their respective 12-month climatology (the ‘acg’ files in the four layer directories), you obtain a yearly average as follows (I spare us the exact numbers):
LT: 264 K
MT: 251 K
TP: 226 K
LS: 211 K
With a lapse rate of about 6.5 km you can obtain an idea of how distant their (supposed) centers might be.
Ooops? I meant of course ~ -6.5 K / km.
tim s…” Flame is just visible light”.
***
You claim I am making a fool of myself then you make a statement like that. According to you, light is not emitted by electron transitions in material but just appears out of nothing at high temperatures.
Tell me this. What is producing the high temperature? It is combustion of a material like a gas, for example. That gas is made of hydrocarbons that burn in oxygen. When the hydrocarbons burn as a flame, they produce light. So, a flame is not light, it is a burning hydrocarbon that produces light, heat, CO2 and WV as a product of combustion.
Even a simple candle, which is made of wax, burns by converting the wax to a hot gas using oxygen. The paraffin making up the candle wax is nothing more than hydrogen and carbon atoms bonded by electrons in a hydrocarbon chain. Two products of combustion are water vapour and CO2. So, hydrogen is released at high temperature and combines with oxygen to produce WV and carbon combines with oxygen to produce CO2.
You are making it sound as if the CO2 is radiating heat when it’s only a product of combustion. The heat is produced by the burning of hydrocarbons in oxygen.
Even engineering textbooks make egregious error talking about this. They refer to radiation as radiative heat transfer, which is nonsense. That is an anachronism dating back to the mid 19th century when scientists believed heat was transferred through air by ‘heat rays’.
It was not till 1913 that Bohr put forward the true relationship between heat and electromagnetic energy. He did that by relating the kinetic energy of electrons to the EM emitted when they give up KE by dropping to a less energetic orbit. Of course, KE, by definition, in this case, is heat.
It’s nonsense to talk about one electron having heat but over bazillions of them in a mass going through the same downward transitions is a heat loss. Conversely, when you add heat to a mass, the electrons all jump to higher energy (KE) levels and the temperature of the mass rises. Raise the temperature high enough and they will jump right out of the mass, possibly destroying it.
When so-called experts talk about radiation being a prime dissipator of heat, you need to take that with a generous pinch of salt. It’s virtually impossible in a non-vacuum environment like a furnace to distinguish how heat is related to radiation, conduction, and convection, especially at high temperatures as found in a furnace.
I am talking here specifically of the combustion chamber.
In the immediate vicinity of a high heat source, in air, how do you tell what is producing the heat: the molecules of air immediately adjacent to the source or radiation.
You can bring your fingers very close to the glass on a burning 100 watt lamp and feel very little. It’s only when you touch the glass that you get burned. Therefore radiation from the lamp is insignificant even though the nearby filament is at 3000C.
This:
“Flame is just visible light”
is not the same as saying
“light is not emitted by electron transitions in material but just appears out of nothing at high temperatures”
Nice cherry pick, Barry. I was being facetious and you cherry picked my statement to make it appear as if I was claiming light is not emitted by electron transitions.
Tim S claimed a flame is ***just*** visible light, suggesting it is only EM. As I tried to point out, EM is one product of the flame, which is the combustion of hydrocarbons in oxygen.
Tim was trying to link the greenhouse myth, in which CO2 is a raised to a super-gas, to a furnace. He got the comparison completely wrong by focusing on CO2 and WV as products of combustion. inferring that CO2 was a prime radiator of heat in a furnace. That’s bs, both in the atmosphere and in the furnace.
It’s the 99% nitrogen and oxygen in the air that produces the heat in a furnace plus the radiation. Yes, O2 and N2 can radiate at those temperatures.
http://hyperphysics.phy-astr.gsu.edu/hbase/quantum/atspect.html
Nitrogen radiates all the way down to the red region.
There are spectral graphs for both nitrogen and oxygen at the following link, about 5/8th way down. Below lightning photos.
https://www.itp.uni-hannover.de/fileadmin/itp/emeritus/zawischa/static_html/atoms.html
Note the nice bright red line for O2.
In the opening paragraphs, they liken the electron to a wave but they have it wrong. It is considered wave-like because it orbits with an angular frequency. The Schrodinger wave equation treats orbiting electrons as particles with angular frequencies.
The wave function used by Schrodinger is akin to the same equations used to observe a pendulum motion or a mass-spring unit. In the example, they seem to use a guitar string as the wave function source. All of them can be represented by continuous sine waves hence are wave functions.
Have only skimmed the article but it seems to be a good example of fundamental quantum theory.
The facetiousness did not translate in print.
In the context of my comment, it made a lot of sense. Let me help you some more. Flame size and shape does not contribute to furnace performance. It dose not matter. The radiant effect, which is absolutely dominant in the fire box area, is not affected in any way by the visible light from a flame. Flame shape and color does not contribute to the radiant effect. Visible light from a flame produces very little if any radiant heat. This is also true of campfires and other sources of flame. Flames from hydrogen or certain alcohols, which are not visible, provide a radiant effect from their combustion products of CO2 or just water vapor in the case of hydrogen.
Flame impingement on a metal surface is an entirely different matter. Impingement in a furnace is a serious problem. A blow torch works best with direct application of the blue flame to the metal surface because the combustion reaction is now on the metal surface and the heat rate is dramatically increased. Does that help? If you want to learn, listen to people who have knowledge. Otherwise, I have no help for you.
Let me quote myself:
“Just in case anyone is confused about this, at 15% excess air, which is 3% residual oxygen, the combined effluent resulting from natural gas combustion is about 27% CO2 and water vapor (9% CO2 and 18% water vapor).”
Those greenhouse gases are absolutely essential for heat transfer in any smooth surface area of any furnace or package boiler. In the upper area of most furnaces above the bridge wall where the combustion gases have cooled, there are finned tubes for convective heat transfer in what is aptly named the “Convention Section”. Finned tubes actually interfere with radiant heat transfer, and the fins overheat anyway. The fire box area with smooth surfaces is also aptly named the “Radiant Section”. This is not rocket science. This is basic Industrial Technology 101. The excess air is an essential safety feature to ensure complete combustion and prevent the possibility of a back fire or explosion from unburned fuel.
“Those greenhouse gases are absolutely essential for heat transfer in any smooth surface area of any furnace or package boiler.”
Nonsense. A pure inert gas at the same temperature works just as well (adjusted for specific heat, etc.).
The term “greenhouse gas” is just a piece of SkyDragon silliness.
Although, commercial greenhouse operators do use CO2 in higher concentrations, along with often electric greenhouse heaters, to maximise greenhouse plant yields.
You really have no clue wha5 you are talking about, do you?
This post confirms my belief that most of you habitual posters on this site know very little about anything of importance, and/or are just here to argue and troll each other. You cannot make such a stupid statement without being completely ignorant or blatantly trolling. There is NO other alternative. Knock yourself out:
https://www.sciencedirect.com/science/article/pii/S2666821122001144
“The primary sources of radiation in the RS are the combustion products which are assumed to be uniform in temperature. According to [21] there is a great difference in the emissivity of the various gases at the same temperature. Furthermore, the diatomic gases such as O2, N2 have very poor emissivity, hence are ignored in fired heater design work. Under this assumption, H2O and CO2 are the only radiating flue gas components that are considered. To simplify the combustion calculations, the fuel gas is assumed to contain only hydrocarbons. Contaminant gases such as CO2 and N2 in the fuel gas stream do not partake in the combustion reaction. However, these contaminant gases are accounted for in calculating the amount of flue gases released and in calculating the thermo-physical properties of the fuel gas.”
Tim S,
From your link –
“In this work, a custom dynamic mathematical model of an industrial vertical-cylindrical type natural gas fired natural draft heater is developed . . . ”
However, the modelling is based on physical principles, which have nothing at all to do with greenhouse gases, the GHE or any other SkyDragon silliness.
As I stated, it is feasible (although generally a complete waste of time and money) to heat water in a boiler using air heated by electricity. As a matter of fact, a small heat gun can heat air to around 500 C without difficulty. Even air containing no CO2 or H2O! Don’t believe it? Professor John Tyndall did it 150 years ago – although he heated his gases with a copper plate, from memory.
Maybe you should read your reference again, and see what the authors are investigating, and why. You may not be aware that gas to liquid heat heat exchangers take hot air without combustion products (from air compressors, for example), and allow the hot air to lose its energy to a liquid, cooling in the process. No greenhouse gases needed.
As I said before, you really have no idea what you are talking about, do you?
No GHE. The Earth has cooled for four and a half billion years or so, whether you like it or not.
Got any more irrelevant SkyDragon silliness?
Classic trolling. That is a complement because it means you probably are not a stupid as you seem.
Tim S,
From your answer, it seems you have no answers.
If you support the SkyDragon silliness called the GHE, you have as little chance of explaining how the GHE cooled the Earth for four and a half billion years or so, as any other SkyDragon.
Nobody has even managed to describe the GHE, so explaining how something non-existent is supposed to work is an exercise in futility.
But give it a try, if you aren’t worried that someone might make you look ignorant, stupid, or both. By the way, you might mean compliment instead of complement, but that is neither here nor there, compared with your “greenhouse gas” nonsense.
No GHE. Accept reality.
Swenson has an unusually hard time with the concept of ‘relevance’. Most of what he posts has no more relevance to the existence of the GHE than the price of milk.
And here he shows how he cannot appreciate the relevance of basic heat transfer science that others post, to the GHE and heat transfer in the atmosphere.
He often states that ordinary science seems like magic to him, and therefore it needs to be doubted, diminished or dismissed outright.
Here he again mentions Tyndall, who famously debunked Swenson’s belief that the GHE requires ‘magic insulation’, and left him speechless.
https://www.drroyspencer.com/2022/11/canadian-summer-urban-heat-island-effects-some-results-in-alberta/#comment-1402815
I’ve tried to follow the comments from Tim S, but he doesn’t seem to have a point. He talks a lot about a gas-fired boiler, and seemingly tries to imply that has something to do with the bogus GHE. A gas-fired boiler is real. The GHE is bogus.
Maybe he could try to make his point as succinctly as I just made mine?
The problem here is that people who deny the existence of the GHE because they are stupid or simply trolling distract from the real question. How does the small contribution made by increasing CO2 in the atmosphere, due to fossil burning, affect the large contribution from water vapor? And yes, for trolls who are obsessed with spell check errors (a classic trolling tactic), the word is affect, not effect. Increasing CO2 does have an affect on the overall effect. The problem for climate science is to accurately quantify the overall and real long term effects from increasing CO2 on the extremely complex climate system. This problem is greatly complicated by political considerations because public policy is a political question.
Tim S,
We must render to Caesar what is Caesar’s. The misunderstanding of the mechanism of the greenhouse effect clearly finds its origin in the incredible pseudo-physics invented by Manabe in his 1967 article. A situation which worsened further around 1980 with the invention of the stupid notion of radiative forcing.
Let me state the obvious. There is a GHE and the satellite record proves it. The satellite record very clearly proves that ENSO affects global temperature and that leads very strongly to the conclusion that humidity levels make that effect possible. The other very clear evidence is obvious to anyone who lives a location where humidity levels fluctuate. Done!
Tim,
You wrote –
“There is a GHE and the satellite record proves it.”, which is about as useful as “Yes, Virginia, there is a Santa Claus”.
You can’t even describe the GHE, much less explain why it cooled the Earth’s surface from the molten state, to its present temperature.
The satellite “record” proves nothing. The satellite coverage does not even cover the surface, and as Dr Spencer has pointed out, has to be based on numerous assumptions and estimates.
As to CO2 having an effect on weather (and climate is just average weather), of course it does – and so does everything else in the Earth’s sphere of influence, plus anything at all which impinges on it!. The fluid dynamics of the atmosphere are chaotic, and there is no theoretical minimum disturbance to initial conditions which determines future outcomes in a chaotic system. In other words, the approximate present does not determine the approximate future.
If you don’t like chaos theory, Richard Feynman came to the same conclusion about ultimate unpredictability using quantum electrodynamic theory – the most rigorously tested theory in the history of mankind.
No GHE. You can’t even describe such a mythical beast, can you? You might as well keep being confused about gases, heat, radiation, emissivity, and all the rest.
> people who deny the existence of the GHE because they are stupid or simply trolling
Why not boat?
“No GHE. You cant even describe such a mythical beast, can you?”
Tyndall described it. You saw it Flynnson. And you had no answer for it or interest in it.
https://www.drroyspencer.com/2022/11/canadian-summer-urban-heat-island-effects-some-results-in-alberta/#comment-1402815
Why do you keep asking for something you clearly have no interest in seeing?
Yet another sign of insanity.
Little Willy, please stop trolling.
The polar vortex in the lower stratosphere is broken into two parts according to the geomagnetic field in high latitudes. One part will swirl over northern Canada, bringing heavy frost to the northern US. The other vortex will spin over Siberia and bring Arctic air to Europe.
https://i.ibb.co/rcccDSk/gfs-z100-nh-f00.png
https://www.geomag.nrcan.gc.ca/images/field/fnor.gif
https://i.ibb.co/YTXJvNs/Zrzut-ekranu-2022-12-07-112657.png
swannie…one of the better comedians on the blog…”As Roy explained, they use intensity measurements from three channels to calculate the LT. There are no such spurious microwave frequencies.
***
Yes, and Roy explained why.
“The MSU instrument scan geometry in Fig. 2 illustrates how the old LT calculation required data from different scan positions, each of which has a different weighting function (see Fig. 2 inset). Thus, only one LT retrieval was possible from a scan line of data. The new method uses multiple channels to allow computation of LT from a single geographic location”.
Nothing to do with what you alarmists are braying about.
Wrong again Robertson.
Since 2015, the UAH team has decided to replace LT evaluation by microwave sensing by a function computing, for each grid cell, a combination of the three layers above:
LT = 1.538*MT 0.548*TP + 0.010*LS
I tried to demonstrate that to you with a chart comparing, for a single grid cell for 1979-2021
a time series generated out of LT grid data
to
a time series generated out of the combination above
and the plots were nearly identical.
But you do not understand such things.
There is NO valuable microwave sensing at LT level because it creates too many errors at gridpoint level.
The fact that MT, TP and LS all three are OF COURSE the result of microwave sensing has nothing to do in this discussion.
You are opinionated and denying facts to such an extent that you are not even able to correctly read what Roy Spencer wrote in 2015.
This, Robertson, has by the way NOTHING to do with ‘alarmism’.
Basta ya.
biny…”…the UAH team has decided to replace LT evaluation by microwave sensing by a function computing, for each grid cell, a combination of the three layers above:
LT = 1.538*MT 0.548*TP + 0.010*LS”
***
Roy has explained clearly why they did that and your explanation is not even close. You seem to have it locked between your ears that UAH no longer uses real data from AMSU units but are fabricating data based on an equation.
You seem to be under a delusion that MT, TP and LS data appears magically out of a black box.
And in the expectation that you will now understand how stupid your allegation of ‘LT going down to the surface’, here is another bit of text out of
https://www.drroyspencer.com/2015/04/version-6-0-of-the-uah-temperature-dataset-released-new-lt-trend-0-11-cdecade/
” The new LT weighting function is less sensitive to direct thermal emission by the land surface (17% for the new LT versus 27% for the old LT), and we calculate that a portion (0.01 C/decade) of the reduction in the global LT trend is due to less sensitivity to the enhanced warming of global average land areas “.
But people like you never learn because they want to keep their own narrative above anything else, even Roy Spencer’s own text.
“people like you never learn”
Wow – strong tone.
Gordo posts a quote from Roy without any understanding of what it means. The old TLT converted each swath of data into a product for each point along the ground track in space and time. The new processing can only provide monthly values for the MT, TP and LS on a 2.5×2.5 degree grid. The LT is calculated from these data based on the theoretical models of the respective channel weighting functions.
Gordo’s introduction of “spurious microwave frequencies” is completely wrong, as each channel provides measurements for specific frequencies with a narrow band width to isolate the desired O2 emission bands, although there is also some input from upward emissions from the surface.
swannie…”Gordo posts a quote from Roy without any understanding of what it means”.
***
This from someone who believes heat can be transferred from cold to hot by its own means.
I wouldn’t put it that way. Any material which emits thermal IR EM at a specific wavelength can absorb same when an incident flux arrives. As a result, any emissions from a colder body with appropriate wavelengths intercepted by a warmer one will be absorbed. With the Green Plate model, the emissions from the GP to the BP will result in the BP’s temperature increasing. That does not violate the 2nd Law.
Of course, Gordo also still can’t understand the absorp_tion-emission processes in gasses, so he has no clue what happens with the microwave emissions in the O2 bands.
Swanson, please stop trolling.
About the difference between lower troposphere and surface with evidence of the UHI effect:
https://www.zupimages.net/up/22/16/804k.png
phi
All what you were able to show is that the lower troposphere and the surface are two places on Earth which behave very different.
You would see exactly the same when comparing the lower troposphere to the middle troposphere, wouldn’t you?
No.
What is highlighted is that the tropospheric amplification due to the increase in absolute humidity with temperature is indeed present in the high frequencies but not in the trends.
I did not make the LT – MT comparison but in principle we should not see such a phenomenon.
As it is known on the other hand that UHI is not properly treated in surface measurements, it is quite logical to assume that we have a measurement of it there.
” As it is known on the other hand that UHI is not properly treated in surface measurements… ”
Some really, scientifically valuable proof (please coming from another corner than WUWT guest posts) would be welcome.
GISS for example reduces all UHI corners down to their rural context (ah, yes: I forgot that some think UHI is everywhere; they very probably never compared for example Las Vegas to stations within 50-100 km around them).
The UHI effect is known and important. It necessarily impacts the measurements. However, these measures are corrected upwards and not downwards.
https://www.zupimages.net/up/19/47/dyn5.png
I wrote:
” Some really, scientifically valuable proof (please coming from another corner than WUWT guest posts) would be welcome. ”
Ce graphe personnel, de plus vieux comme Mathusalem, une preuve tangible? Vous vous moquez du monde, ma parole.
It couldn’t be more tangible and reproducible.
So go discuss cooking on a blog more suited to this subject.
Non mais!
Bunny,
There is no GHE, and the future cannot be predicted by “experts” who “dissect” the past.
Play with graphs and temperatures to your heart’s delight.
Not a single fact will be changed, but you are free to waste your time in any meaningless way you choose.
Others may think what you are doing is a valuable contribution to science, but I doubt it.
Carry on.
And the very best is that your good ol’ graph has only to do with the accumulated differences in GHCN V3 (deprecated since years) between adjusted and unadjusted data, and has nothing to do with UHI.
And this is a real comparison of adjusted vs. unadjusted data in GHCN V3:
https://drive.google.com/file/d/1YPpBGeP8K5YzwIt3oFcIU16XqLKoxI04/view
Your graph is no more than a pure, intended exaggeration.
My poor Bindidon, you still have much to learn. It is not a matter of simply comparing the qca to the qcu but of evaluating the overall methodological bias. Your graph provides very little information because it only highlights a minor part of the problem. I gave the formula used, you can reproduce my results.
I make an evaluation of the warming added by the method in the global index. Most of the bias comes from connecting series that your comparison cannot highlight.
That said, my assessment is a bit dated and it’s fairly certain that the bias is now even more improtant.
Yep, it has everything to do with UHI.
Oh the Frenchie becomes quite condescending as it seems.
That happens mostly to people who have nothing real to offer.
phi: I propose that you come back here when you bring a consistent proof of any correlation between adjusted/unadjusted GHCN V3 data and UHI.
Until then: please refrain from your unproven claims.
Bindidon,
It’s not up to you to tell me what to do; ridiculous. Begin by acknowledging or disproving the magnitude of the GHCN warming bias.
Already on December 5, the thermometer in Oymyakon, Siberia, showed -56 degrees C.
https://i.ibb.co/0s17kSW/318449555-592591656201148-1049168078063291799-n.jpg
Ojmjakon is, together with Verkhoyansk and a few others, one of the coldest places in Northeast Siberia.
It is so cold there that during winter months, the lower troposphere often is warmer than the surface.
RSM00024688 63.2500 143.1500 740.0 OJMJAKON
RSM00024688 61-129 1968 12 8 -60.3 (C)
RSM00024688 61-129 1968 12 9 -60.3
RSM00024688 61-129 1982 12 6 -59.9
RSM00024688 61-129 2021 12 8 -58.9
RSM00024688 61-129 1982 12 5 -58.8
RSM00024688 61-129 1997 12 2 -58.8
RSM00024688 61-129 1997 12 3 -58.8
RSM00024688 61-129 1993 12 9 -58.7
RSM00024688 61-129 1997 12 1 -58.3
RSM00024688 61-129 2021 12 7 -58.1
Interesting however is that when restricting the output to years starting with 2010, you see that 2021 already was colder than other years in the decade:
RSM00024688 61-129 2021 12 8 -58.9
RSM00024688 61-129 2021 12 7 -58.1
RSM00024688 61-129 2021 12 2 -54.5
RSM00024688 61-129 2010 12 4 -54.4
RSM00024688 61-129 2021 12 1 -54.3
RSM00024688 61-129 2021 12 5 -54.2
RSM00024688 61-129 2021 12 4 -54.1
RSM00024688 61-129 2010 12 3 -53.7
RSM00024688 61-129 2011 12 6 -53.4
RSM00024688 61-129 2020 12 9 -53.4
Some hope for Global Cooling?
Thanks.
Nie ma za co!
A look at UAHs lower stratosphere (LS) 2.5 degree grid data
August 2022
https://drive.google.com/file/d/1n6rXv2cSP0mRCE2nJ4DHeflLVmvF0jmD/view
September 2022
https://drive.google.com/file/d/1Cr2RYXTwO4nGOFCT-oWxecqU5JG8Opr-/view
October 2022
https://drive.google.com/file/d/1Kut91328oJEKMjXNwTCBavpxP64x3G9z/view
The cold region moved from 30S-60S toward the South Pole, and became bigger and a lot colder.
We will see how it looks in November when the LS grid data for this month is available.
Unless you live under a rock, you’ve probably heard that Europe has placed a $60 price cap on Russian crude exports.
This is uncharted territory for EVERYONE.
But the real fun part is: The single global price for crude that we’ve all enjoyed for the last 85+ years is GONE. Meaning that global shipping becomes riskier and riskier by the day.
In terms of energy, we are well on our way to how things were in the 1930s. Exciting!
Well it’s possible, if you elect a brain dead President.
Or to loosely quote President Obama, someone who will screw up
everything.
But I kind of like a weak President.
And I regard politicians as shades of various kinds of shit.
Nancy Pelosi also noted the some dems are glasses of water with a label of D on them.
You should note she didn’t say cups of shit- as she is wise
Politician and would be slightly aware that she is also a cup of shit.
gb…”I kind of like a weak President”.
***
You must love Biden.
I would prefer someone less sleepy.
andrea…”Unless you live under a rock, youve probably heard that Europe has placed a $60 price cap on Russian crude exports”.
***
Not very clear, Andrea. Do you mean European imports from Russia?
If that’s the case, they are shooting themselves in the foot since most of their oil imports came from Russia recently.
The truth is, Europe shot themselves in the foot. They lied to Russia about NATO, promising Russia they would not expand NATO beyond Germany. Then they expanded it to other European countries along the Russian border. When they tried to include the Ukraine, the Russians called foul.
The truth is, the EU stuck their noses where it did not belong, in the Ukraine. They tried to separate the Ukraine and Russia by interfering in Ukrainian politics. The EU, along with influence from the US, actually succeeded in having a democratically-elected, pro-Russian president removed from office, something we normally find abhorrent in a democracy.
It back-fired big-time. The president in question had been elected in a large part by pro-Russian Ukrainians in eastern Ukraine. They rebelled in 2014 when their chosen president was violently removed from office by Ukrainian, anti-Russian nationalists. So, they rebelled.
Three subsequent Ukrainian presidents promised to fix the problem but accomplished nothing. In 2022, the Russians went in and fixed it for them. After initiating this war, the EU imposed sanctions on Russia, so Russia cut off their oil supply. I call that shooting yourself in the foot. In other places they might call it cutting off your nose to spite your face.
If The EU is stupid enough to carry on this nonsense then they deserve to freeze in the dark. The people of Europe don’t. However, as long as stupid leadership is in control in Europe that is an unfortunate outcome. Not only will innocent Ukrainians keep on dying, so will innocent Europeans.
I get blamed for being pro-Russian and I’m not. I am pro-human, and human problems don’t get fixed through blatant propaganda.
Maybe our wondrous planet simply is returning to the global climate profile circa 250 CE after having been through a geologically brief cooling period?
Such an amazing and complex intertwining of galactic disk dust, solar variance, tectonic plate exposure, deep sea and land volcanism, and, yes, humanity still is beyond our full comprehension.
It is as though we’re asked to describe the scenery of an eight hour road trip having only been awake for five seconds.
Not back far enough.
It is the Eocene epoch that many of the experts looking at and projecting Earth’s future climate now study.
TM,
You wrote –
“It is the Eocene epoch that many of the experts looking at and projecting Earths future climate now study.”
Couple of points.
1. It is not possible to predict future climate states, according to the IPCC, so the experts are wasting their time. You may be worshipping false Gods.
2. Richard Feynman said that science is belief in the ignorance of experts. I agree.
And by the way, the Earth has continuously cooled for four and a half billion years or so. In what alternative universe do you expect it to reverse this trend, and why?
Accept reality. No GHE.
Swenson, are the words projection and prediction synonymous? Please inform.
TM,
What a stupid gotcha!
Do you think you know the answer, and are trying to make me look stupid?
Or maybe you are really appealing to me as an authority on such things, and are prepared to accept what I say without question – which would make you gullible.
So no, I decline your request. If you are really interested in making some imagined semantic point, you might care to inform yourself as to the practical difference between projection and prediction.
But you won’t, will you? That would mean you were just trying to be a silly SkyDragon, posing witless gotchas.
Dimwit.
“Do you think you know the answer, and are trying to make me look stupid?”
You do that very well yourself already.
TM,
An unsupported assertion, from an acknowledged trol,l carries all the authority of its author.
Still dont know the difference between “prediction” and “projection”?
You could always look the words up in a “dictionary”, I suppose.
Carry on trolling.
[laughing at juvenile gotcha poser]
Wait ,I knew this one, climate projections are made by debils who don’t understand anything about climate, just take snippets of data, draw straight lines through it and extend it into the future,
Climate Predictions are made by people who understand the underlying causes that change climate
Swenson at 5:02 PM
To recap:
[Me] …many of the experts looking at and projecting Earths future climate…
[Swenson] “…It is not possible to predict future climate states…”
[Me] …are the words projection and prediction synonymous?
[Swenson] “…trying to make me look stupid?”
[Me] You’re doing just fine on your own.
TM,
What a stupid gotcha!
Do you think you know the answer, and are trying to make me look stupid?
Or maybe you are really appealing to me as an authority on such things, and are prepared to accept what I say without question which would make you gullible.
So no, I decline your request. If you are really interested in making some imagined semantic point, you might care to inform yourself as to the practical difference between projection and prediction.
But you wont, will you? That would mean you were just trying to be a silly SkyDragon, posing witless gotchas.
Dimwit.
Trolling TM,
You wrote –
” . . . many of the experts looking at and projecting Earths future climate . . . ”
Experts? Looking at? Future climate?
Any fool can make any projection they like. Many do, and claim to be “expert” projectionists. It doesnt matter. If you are trying to claim that “projections” are somehow better at divining the future than “predictions”, then you are even more detached from reality than the average deranged SkyDragon – who believes in a GHE that he can’t even describe!
Go on, tell me which “experts” believe that climate is anything but the average of past weather observations. How hard can it be?
You are getting desperate aren’t you? Implying that there is any use at all for “experts” who can “project” the future, but can’t “predict” it. What about weather “forecasts”? Predictions? Projections? If weather can be “forecast”, can the average of “weather” be “forecast”?
You really believe wriggling and obfuscating, don’t you?
Still no GHE. The Earth has cooled for four and a half billion years or so. Accept reality.
Swenson at 10:00 PM
“…Many do, and claim to be “expert” projectionists.”
A projectionist is a person who operates a movie projector, particularly as an employee of a movie theater.
Blah, blah, blah.
Dimwit,
Would I prefer I call them “projectors” instead?
You would probably whine that a “projector” is a piece of equipment, blah, blah, blah!
Only joking of course. From Merriam-Webster, a projectionist is “one that makes projections”, but you might not like a reference from an American dictionary, I suppose.
Maybe a selection from the Cambridge English Corpus might impress you more –
“Evidence that is potentially problematic for the projectionist approach has recently come from a series of studies on auxiliary selection and other reflexes of split intransitivity.”, or even better –
“It further calls for a theoretical account that combines some of the fine-grained semantic distinctions incorporated in projectionist models with the syntactic mechanisms embodied in constructional models.”
Models?
Gee, that sounds like some nonsense you might utter, trying to defend the idiot SkyDragons who believe that they have miraculous abilities to peer into the future – whether you call it predicting, projecting, forecasting, or just plain old-fashioned fortune selling!
All irrelevant- you can’t even describe the mythical GHE upon which all these predictions of doom are supposedly based on, can you? That’s why you are reduced to gotchas, and silly semantic games.
Keep trying.
maguff…”…are the words projection and prediction synonymous? Please inform”.
***
Informing….
The IPCC used the word ‘prediction’ till expert reviewer, Vincent Gray, advised them that climate models cannot predict. So, they changed prediction to projection.
In TAR, they were still making the claim that future climate states cannot be predicted. Then they started using climate models to make predictions, until Gray caught them at it. Now, they use the word projection, in which they are claiming to offer several likely scenarios but actually make them sound like one prediction.
Naturally, idiotic politicians in their infinite gullibility or dishonesty (take your pick) latch onto these lies and spread them to a gullible public to scare them into accepting stupid solutions.
C’mon, Gordo –
https://www.ipcc.ch/site/assets/uploads/2018/02/WG1AR5_Chapter12_FINAL.pdf
More than ten years trolling this website and you still have not RTFR.
Swenson at 5:17 PM
Here’s the link to your quote from Merriam-Webster: https://www.merriam-webster.com/dictionary/projectionist
TM,
Here’s what you wrote –
“A projectionist is a person who operates a movie projector, particularly as an employee of a movie theater.”
Why did you cherry-pick?
Trying to be clever?
As I said, if I called someone who projects (such as a SkyDragon “climatologist”) a projector, you would probably whine about my use of the word projector! I assume you would not complain about a forecaster, or a predictor – even a fortune teller!
No matter, you are determined to get bent out of shape because I keep pointing out that your silly SkyDragon insistence that the climate can somehow be foreseen, regardless of whether you call it predicting, projecting, or forecasting, is just wishful thinking.
If you wish to do a dance about cherry-picking, why do you not accept that the GHE has cooled the Earth? Dimwitted SkyDragons try to cherry-pick furiously – the last so many years, decades, centuries or whatever.
Try and get it through your thick SkyDragon skull that the GHE is a myth! The Earth has cooled over the period from its birth to now. No amount of playing silly semantic games can help you out of your self-excavated hole.
Oh, and by the way, one who projects the future is a projectionist, according to me. What would you call such a person? A fortune seller of the SkyDragon variety?
Carry on trying to defend the indefensible.
TM,
Even the eminenently Woeful Wee Willy wrote –
“Recent multi-model estimates based on different CMIP3 climate scenarios and different dynamic global vegetation models predict a moderate risk of tropical forest reduction in . . . ”
SkyDragons just can’t help themselves, can they?
“Model estimates” now become “predictions”.
Go on, say that the nonsense Wee Willy quoted is so vague as to be meaningless. Unless you believe that the results of “estimates”, “models”, and “climate scenarios”, can be used to “predict” anything at all!
Go on, cherry- pick something out of that. I’m an even better cherry-picker that most (if not all) SkyDragons, but try if you must.
Off you go, now.
Mike Flynn,
I didn’t write what you think I wrote.
So what are you braying about?
Woebegone Wee Willy,
You wrote –
“I didnt write what you think I wrote.
So what are you braying about?”
More unsubstantiated assertions? More stupid questions?
Why do you bother, fool? (That’s a rhetorical question, of course – I don’t expect you to answer, and I am unlikely to do anything except laugh, if you do).
Have you managed to explain why the GHE cooled the Earth for four and a half billion years, rather than making it hotter?
Didn’t think so!
Swenson at 12:00 AM
“Why did you cherry-pick?”
Rhetorical question.
I know why. It’s because you’re a liar and a cheat.
Gordon Robertson at 6:58 PM
Funny story about Vincent Gray. Also not true!
The IPCC report defines the terms Climate Prediction and Climate Projection.
Must all you deniers be liars and cheats?
Come on, Tyson.
Gordo and Mike Flynn might be liars and chests, but they are *our* liars and cheats.
Tyson, Little Willy, please stop trolling.
“Have you managed to explain why the GHE cooled the Earth for four and a half billion years, rather than making it hotter?”
Have you managed yet to put two and two together, and figure out if there is any point to this oft repeated statement?
It appears not.
Stating that the insulating power of the GHE did exactly what insulation is supposed to do for a hot thing, slow, but not prevent, its cooling, adds little of relevance to this discussion.
But perhaps you can tell us some other interesting factoids like water is wet, or rabbits are good at hopping, and subsequently re-inform us on these topics hundreds of times.
That will be equally as useful to the discussion.
#2
Tyson, Little Willy, please stop trolling.
Tyson, Little Willy, didnt post recently, you are mistaken.
#3
Tyson, Little Willy, please stop trolling.
Even lower surface temperatures of the equatorial Pacific.
https://i.ibb.co/jM7xcyz/ct5km-ssta-v3-1-pacific-current.png
Strong planetary waves in the upper stratosphere in the polar vortex belt.
https://www.cpc.ncep.noaa.gov/products/stratosphere/strat-trop/gif_files/time_pres_WAVE1_MEAN_OND_NH_2022.png
Temperatures in the upper stratosphere above the 60th parallel are falling.
https://www.cpc.ncep.noaa.gov/products/stratosphere/strat-trop/gif_files/time_pres_TEMP_ANOM_OND_NH_2022.png
These are daily temperatures (C) in the north of the US. How much will it be at night?
https://i.ibb.co/L5ySG77/Zrzut-ekranu-2022-12-07-213347.png
A little warmer in North Dakota.
https://www.wunderground.com/weather/KNDWESTF12
I expect snow in England today and more frost.
https://i.ibb.co/crpQZtw/gfs-z100-nh-f00.png
Unusually strong pressure over Greenland. 1077 hPa at sea level.
https://i.ibb.co/DLn6L8d/Zrzut-ekranu-2022-12-08-154628.png
Oldest DNA shows Greenland once was home to forested ecosystem
https://www.upi.com/Science_News/2022/12/07/Greenland-DNA-forest-ecosystem-reindeer-mastodon/8321670439615/
That’s in the early Pleistocene, with global temperatures on a gradual cooling trend and roughly equivalent to the present.
There’s a weaker glacial cycle and the Greenland ice sheet is probably starting to grow.
https://www.pnas.org/doi/10.1073/pnas.1809600115
Right now, it’s pretty cold in northern Greenland.
What I thought interesting is the cold allows it to be the oldest DNA.
Also interesting was about weird creatures which were living way up there.
Right now, we not anywhere close to how warm it was during the last interglacial period which far warmer for thousands of years and such warmer world, didn’t wreck the DNA. And there were many interglacial period between this early Pleistocene and the present time. Or many interglacial periods, warmer then now and many times of many thousands of warmer periods warmer than we are right now.
And right now, we not a warm as it was when Sahara desert green and inhabited by people.
So, it seems our Sahara desert would first have become mostly grassland, before we could get that warm, again.
Antarctica was once located near the equator.
And about 4.5 billion years ago or so, Earth was in a molten state, imagine! And since then it has even been cooling, non-stop!
I’m literally… Amazed.
You’re not Amazed, Binny.
That was Mike Flynn’s old sock.
Bunny,
The physics of cooling amazes you? Really?
How did you work out that Antarctica was located near the Equator? Did you read the Tarot?
Maybe Antarctica was at the North Pole, and gravity dragged it to the South Pole, just like some idiots at NOAA claim happens to water from the North Pole!
You really are a simple and gullible SkyDragon, aren’t you?
At least you now accept the Earth cooled for four and a half billion years or so. Due to the GHE, do you think, or do you believe that the atmosphere (complete with CO2 and H2O) only formed recently?
No wonder you can’t even describe the GHE!
Oh, look at how much Greenland’s ice sheet is likely to start growing:
https://drive.google.com/file/d/1LkGou41kbLSR246s57Sw1LLGCRNB9DSn/view
Im literally… Amazed again!
Fortunately, the trend has been reversed for the past 10 years. Warmer North Atlantic surface means more snow in Greenland.
http://polarportal.dk/fileadmin/polarportal/surface/SMB_curves_LA_EN_20221208.png
https://www.tropicaltidbits.com/analysis/ocean/natlssta.png
Somebody explain to me why Greenland needs ice, do they have some special crops that grow on ice ? or industry that needs it ?
I live on land that had a mile of ice on it just 12k years ago, I don’t know anybody who complains it melted and wishes it returns.
This is a retarded debate
Eben
Consider the effect on Coastal areas if all the ice in Greenland were to melt.
https://scied.ucar.edu/learning-zone/climate-change-impacts/greenlands-ice-melting
It would raise sea level 23.6 feet, that would flood lots of coastal areas.
In your other example, the melting of all that ice in the past had drastic changes.
https://www.e-education.psu.edu/earth107/sites/www.e-education.psu.edu.earth107/files/Unit2/Mod4/Figure17.jpg
Change in sea level of around 120 meters or 360 feet. This rapid sea level rise could be the reason for many flood stories written in ancient times.
Better buy a boat, quickly
“Better buy a boat”
???
No. Better write a letter to the grandkids apologizing for the pile of doo doo you’re about to hand them.
TM,
You wrote –
“Better write a letter to the grandkids apologizing for the pile of doo doo youre about to hand them.”
Would your suggestion be based on a prediction, a forecast, a projection, or do you just make up stuff about the future as you bumble along?
Do you have to put a lot of thought into the nonsense you utter, or do you just hammer away at random on your keyboard?
Keep hammering.
Norman,
According to Harvard geophysicist Jerry Mitrovica recently –
“When Greenland melts, places as far away as Norway and Scotland could actually see the sea level fall by as much as 50 meters. ”
Who do you want to believe? A “concensus” of SkyDragon cultists, or someone who actually knows what they are talking about, backed up by peer reviewed publication in Science?
I suppose you just believe whatever you are told to believe, and just ignore any inconvenient alternatives.
That’s the SkyDragon ethos, isn’t it?
Ignore four and a half billion years of GHE induced global cooling, and pretend it was really heating!
Oh well . . .
” … reversed for the past 10 years. ”
That would be nice.
But when I look at 2019, third lowest point since 1840:
https://drive.google.com/file/d/1EUs-5sqcdeU4Dyh4Rdd81dR_QLQHwk8u/view
I’m doubting a bit.
And warmer North Atlantic surface indeed means more snow in Greenland, but also more coastal glacier calving, which is not included in the surface mass balance.
Fake graph.
So obvious you should be ashamed to post it
How could anyone know or make a real graph about Greenland SMB that includes the dates 1840 to 1970?
Data only legitimately derived from GRACE which did not exist then.
Perhaps Michael Mann swapped jobs and tree rings.
Certainly the graph is fake news as far as real observation goes.
Oh look: angech speaking about an allegedly ‘fake graph’ though he is very certainly 100 % unable to prove it is.
” How could anyone know or make a real graph about Greenland SMB that includes the dates 1840 to 1970? ”
*
Poster angech, you are an Ignoramus.
You should ASK where the graph comes from instead of claiming nonsense and insulting people doing a lot of work to present existing data you yourself know nothing about.
I have mentioned the source of that data many times.
*
Programme for Monitoring of the Greenland Ice Sheet (PROMICE)
(Geological Survey of Denmark and Greenland GEUS)
Greenland ice sheet mass balance from 1840 through next week
https://tinyurl.com/428ecbej
From that page you move to
– yearly:
MB_SMB_D_BMB_ann.csv
(This is the source for the graph above.)
*
or
– daily data:
MB_SMB_D_BMB.csv
Using the daily data, we can for example produce the chart below:
https://tinyurl.com/mtv6epuc
but I doubt that a cheap polemicist like you would ever be able to do the job.
Bunny,
Who cares about whatever the “graphs” show?
As I said to Norman –
“According to Harvard geophysicist Jerry Mitrovica recently
When Greenland melts, places as far away as Norway and Scotland could actually see the sea level fall by as much as 50 meters.
Peer reviewed. Published in Science.
So what is your concern about Greenland Ice Sheet Mass Balance?
Just think – if sea levels fall around Germany, for example, how much more land will become available? Lots?
Hellooooom again, you blathering stalker!
Do you have something to say?
No?
Ah yes, Flynnson is just urging to say something irrelevant.
Bunny,
Who cares about whatever the graphs show?
As I said to Norman
“According to Harvard geophysicist Jerry Mitrovica recently
When Greenland melts, places as far away as Norway and Scotland could actually see the sea level fall by as much as 50 meters.”
Peer reviewed. Published in Science.
So what is your concern about Greenland Ice Sheet Mass Balance?
Just think if sea levels fall around Germany, for example, how much more land will become available? Lots?
As usual Flynnson the troll latches onto one thing and ignores all else, like sea level rise in the other 95% of the world.
Sea level has been rising for 15,000 years and currently is far below the average rate of sea level rise over that time.
Evidence?
Nevrmind. Sea level rose from 20000 – 6000 years ago for good reasons, massive ice sheet melting.
The current rate is again high, higher than its been in 6000 years. The remaining ice sheets and glaciers are melting.
business as usual for the last 15,000 years. Like I said.
During the previous interglacial sea level rose 10 meters higher than present.
Our interglacial isnt done..
Thats correct.
Bindidon
In 2007, Denmark launched the Program for Monitoring of the Greenland Ice Sheet (PROMICE) to assess changes in the mass balance of the ice sheet. The two major contributors to the ice sheet mass loss are surface melt and a larger production of icebergs through faster ice flow. PROMICE is focused on both processes. Ice movement and discharge is tracked by satellites and GPSs. The surface mass balance is monitored by a network of weather stations in the melt zone of the ice sheet, providing ground truth data to calibrate mass budget models.
My question was
How could anyone know or make a real graph about Greenland SMB that includes the dates 1840 to 1970?
The only way to do it properly is with satellites. The only way to have it valid is while the satellites are up there measuring.
No satellites.
Fake data.
Fake manufactured, cheap guesswork.
Despite many of the recent 10 years being above the average SMB
the comments say the level has fallen..
What is the point of having an SMB when you have to run around pretending that more is less?
The major contributors to the ice sheet mass loss are global temperature variation and the warmth of the currents reaching the Arctic each year which vary.
Other factors are direction of ice loss [Fram] and air pressure with arctic cyclones.
Surface melt is the action, not the contributor.
Faster ice flow always occurs naturally in Summer when ice bergs naturally break off.
The flow is always faster than in winter.
Amazing brains, these Danish guys.
When you read that explanation you understand films like Frozen.
angech
” Fake data.
Fake manufactured, cheap guesswork. ”
You are, like Robertson, Swenson and a few others, an arrogant, ignorant and above all cowardly person.
You are, like Robertson, Swenson and a few others, an arrogant, ignorant and above all cowardly person..
And those are my good traits?
Thank you.
–
Now after you feel better I would appreciate your views on any of the following.
what the SMB of Greenland means.
How it is calculated.
How one connects recent satellite estimations, the only way of actually attempting to measure it with huge standard deviations.
With the Michael Mann style proxy guesswork of anything pre satellite.
–
If you want to defend your science here, instead of just being a repeat graph poster,do so.
Argue the actual amount of SMB loss .
Who estimates it.
What the errors are.
How you justify putting said graph together.
–
Scientific discussion proceeds with clear facts and trying to understand them as you have pointed out here a numbers of times in the past.
Helping my understanding, or La of it would be appreciated.
You are, like Robertson, Swenson and a few others, an arrogant, ignorant and above all cowardly person.
–
I would not choose to-apply those descriptions to those people who have with you and others made this blog what it is today.
–
Doing so is just expressing frustration and anger, letting off steam which makes one feel good temporarily but leaves permanent mild regret at intemperance and upsetting people for decades afterwards.
–
However the heavy hand banter at this site mixed in with often very intelligent scientific arguments is what draws me back to it.
Please continue to enjoy feeling free to say whatever you want and in proving your assertions.
Climate Alarmism w/ Professor Richard Lindzen
https://www.youtube.com/watch?v=spKTb3wMmJM
I will call it an evangelist of bitcoin has discussion with
Richard Lindzen.
Kind of a wild ride- and in the end, Saifedean Ammous urges Richard to get on twitter.
https://co2coalition.org/wp-content/uploads/2022/09/Lindzen-Greenhouse.pdf
Is a link from it.
Richard Lindzen says tropics doesn’t change {I agree}
He also says it’s wrong that tropics is controlling aspect.
I disagree, though I what I think he meant the whole hot spot thing.
Which has been disproven and of course is wrong.
I have said more than 80% of sun’s energy which is absorbed at the surface is absorbed by the ocean [which covers 70% of planet] and
said the Tropical ocean absorbs more than 1/2 of the sunlight [though
in tropics the ocean is about 80% of tropics.
The tropical ocean of course has large effect on global weather, and many falsely assume global climate is some kind summation of weather
in the entire world. I would say Richard Lindzen has focusing on weather and I would say, weather is important [or very important].
But in terms of being in interglacial period, or in a glacial
period, during our 33.9 million ice age, it not about the tropics- which have change much in last 33.9 million years.
Instead, it’s about polar sea ice. And weather in general would be related to this, if you mean natural variable is weather- which is roughly assumed to be the case.
But interglacial and glacial periods are related to the Milankovitch cycles which are not weather- rather it’s how Earth moves around the sun and this affect polar sea ice.
” But interglacial and glacial periods are related to the Milankovitch cycles which are not weather- rather its how Earth moves around the sun and this affect polar sea ice. ”
It very certainly won’t affect it earlier than in about 5,000 years.
Look at the three Milankovitch periods: we are in the miidle of all three.
It doesn’t look good, but I am optimistic, and I agree CO2 might add enough warming in the near term.
But I am more optimistic that human being will become a spacefaring
civilization.
But it’s possible that this is not possible.
Though there is also other things to be optimistic about.
One of these things, is we could have ocean settlements within the near future. And there are other things, maybe even more important.
JAXA ARCTIC SEA ICE EXTENT: 10,970,478 KM2 as at 08-Dec-2022
– Extent gain on this day 270k which is 189 k more than the average gain on this day (of the last 10 years) of 81k,
The immense variation in Arctic ice belies the fact that or interpretation of ice gain or loss is ephemeral at present.
It links in to the global temperature.
Most of the time we have been in 10th year highest territory, a big disappointment for warmists in so many areas.
The very weak 3 La Ninas have produced this.
La Nina is just a representation of decreased solar heating [albedo or sun]
Could we have a 4th or 5th in a row.
You bet.
There’s no way to estimate sea ice using satellites. The ice is not one huge covering of ice, it is many sections that butt against each other, producing pressure ridges that extend 40 feet or so in the vertical direction. Arctic ice is riddled with these ridges and that ice is not included in satellite images.
Theres no way to estimate sea ice using satellites.?
Yes there is.
Is it highly accurate? ??
Is it reasonably accurate?
Yes
Until you prove that satellite orbits can be determined within a millimeter, given the influence on them of other orbital bodies in the solar system, then calling it accurate to a millimeter is not possible.
RLH says:
December 10, 2022 at 12:20 PM
Until you prove that satellite orbits can be determined within a millimeter, given the influence on them of other orbital bodies in the solar system, then calling it accurate to a millimeter is not possible.
–
Another attempt to diss information.
–
What is wrong with you guys?
Seriously.
–
So what?
The first and only message I get from your comment is that you dislike the data presented by the satellites .
Presumably because it currently upsets one of your per narratives.
Which one is it today?
Is it because it shows ice had diminished over the last 40 years when you know it has been steady because there is no CO2 or no global warming.
No back radiation?
–
Can you estimate sea ice using satellites.
Yes.
(Bindidon, I apologise)
–
Do satellites measuring ice extent over thousands of kilometres have millimetre accuracy?
No.
Is it important or significant?
No.
Please try another line of reasoning.
Or persist with your measurement inanity.
“Until you prove that satellite orbits can be determined within a millimeter, given the influence on them of other orbital bodies in the solar system, then calling it accurate to a millimeter is not possible.”
And who said they were accurate to a millimetre?
Why, nobody. You just fabricated this dispute out of thin air.
Solar wind
speed: 519.8 km/sec
density: 9.71 protons/cm3
Daily Sun: 09 Dec 22
Sunspot number: 115
The Radio Sun
10.7 cm flux: 143 sfu
https://www.spaceweather.com/
Thermosphere Climate Index
today: 15.30×10^10 W Neutral
Oulu Neutron Counts
Percentages of the Space Age average:
today: +1.5% Elevated
48-hr change: -1.0%
I was going say I am hopeless failure at predicting
Neutron count, but it dipped down a bit.
It also doesn’t look like going as predicted:
https://www.swpc.noaa.gov/products/weekly-highlights-and-27-day-forecast
“Forecast of Solar and Geomagnetic Activity
05 December – 31 December 2022
Solar activity is expected to be at very low to low levels. M-class
(R1-R2, Minor-Moderate) flares are possible on 05-13 Dec and 18-31
Dec due to current and returning M-class producing regions.”
spaceweather.com had other things to say:
“ORION IS COMING IN HOT: NASA’s Orion spacecraft is hurtling toward Earth for a nail-biting grand finale to its maiden 25-day space voyage. On Sunday, Dec. 11th, Orion will skip across the top of the atmosphere like a pebble on the surface of a pond, bleeding away some of its kinetic energy before it plunges toward the Pacific Ocean like a 5,000 degree Fahrenheit meteor. Will Orion’s experimental heat shield work? Tune into NASA TV on Dec. 11th for live coverage.”
We all hoping it works on Sunday. And:
PHOTOS OF THE LUNAR OCCULTATION: On Dec. 7-8, the full Moon passed directly in front of Mars, producing a rare lunar occultation visible across North America and Europe. Photographer Gwenael Blanck watched the Red Planet disappear from Paris, France:
“I was really excited when the clouds over Paris parted just as Mars was approaching the edge of the Moon,” says Blanck. “Perfect timing!”
The occultation was rare in part because it occurred within a week of Mars’s closest approach to Earth. The disk of the Red Planet was unusually wide, and it shone with a brightness greater than any star in the sky. During the occultation, Mars was twice as bright as Sirius, allowing people to see and photograph the planet even when it was very close to the edge of the full Moon. ”
[It too cold here, for me to even consider looking at it.]
Sea ice extent on 2022, Dec 8
Arctic
https://tinyurl.com/44mwwt8s
Antarctic
https://tinyurl.com/2p8sw8zp
Globe
https://tinyurl.com/knxexby7
*
We shouldn’t keep fixated on the Arctic all the time. For example, 2022 was a good year for Arctic sea ice rebuild, but in the Antarctic it kept below 2021 nearly all over the year.
What matters is not how much more or less sea ice extent you have in a day. We must consider how full years behave.
*
Below is a descending sort of various year and period averages for Global sea ice extent (absolute values in Mkm^2), from Jan 1 till Dec 8 (day 344 of 365/66):
2014: 23.55
2013: 23.42
81-10: 23.32
2015: 23.04
2012: 22.45
2021: 22.17
2011: 21.81
2020: 21.70
2016: 21.51
17-21: 21.50
2018: 21.44
2022: 21.41
2017: 21.18
2019: 21.04
(2011/13/14/15 aren’t present in the three charts above.)
Here you see that 2012, best known as the year with the highest Arctic sea ice melt season, in fact was a very icy year in the Antarctic: it was all the time above the 1981-2010 average.
Conversely, 2019 was a year with sea ice loss at both Poles.
*
Source
https://tinyurl.com/s6d98by4
Bunny,
You wrote –
“We shouldnt keep fixated on the Arctic all the time. For example, 2022 was a good year for Arctic sea ice rebuild, but in the Antarctic it kept below 2021 nearly all over the year.
What matters is not how much more or less sea ice extent you have in a day. We must consider how full years behave.”
Good to see you have appointed yourself the resident dictator of what people must and must not not do. When you say “we”, presumably you are referring to yourself and God?
If people do not obey your dictates, what then? Thirty lashes on the foreskin with a boiled lettuce leaf? Or will you stamp your little foot, and threaten to hold your breath until you turn blue?
You idiot, you can’t even explain the fact that four and a half billion years of the GHE just made the Earth colder, not hotter!
Issue some more commands. See who leaps to obey. Laugh uproariously, make a nice cup of tea and have a good lie down. You’ll feel better.
Carry on.
Hellooooo, you blathering stalker!
Do you have something to say?
No?
Ah yes, Flynnson, as so often, is just urging to say something absolutely irrelevant.
Like his all time repeated, insulting blah blah
” You idiot, you cant even explain the fact that four and a half billion years of the GHE just made the Earth colder, not hotter! “
Bunny,
Well worth repeating, isn’t it?
“You idiot, you can’t even explain the fact that four and a half billion years of the GHE just made the Earth colder, not hotter!
You are even saying it yourself!
Keep it up.
Earth is just going thru a cold period, right now,
“You idiot, you cant even explain the fact that four and a half billion years of the GHE just made the Earth colder, not hotter!”
No. More precisely, 4.5 billion years of the GHE has slightly slowed the cooling. The interior would be cooler now if there was no atmosphere and no GHE. The earth is COOLER than it was, but WARMER than it might have been. No contradiction. No disproof of the GHE.
I have always wondered whether our ocean keeps Earth interior warmer or whether it cools it.
Obviously more of Geothermal heat is a higher average per square amount from ocean floor.
One could say this is due to the thinnest of ocean surface floor.
Or the obvious answer is ocean cools more, but I still wonder about whether the ocean does cause more cooling.
Dim Tim,
You idiot, you can’t even explain the fact that four and a half billion years of the GHE just made the Earth colder, not hotter.
Slow cooling is not heating, you dimwit.
You even admit that the Earth has cooled, when you say “The earth is COOLER than it was, . . .”!
Exactly. Cooler, not hotter. SHOUTING won’t help, either. Saying ” . . . but WARMER than it might have been.” Here’s a scoop, Tim – thermometers don’t measure what “might have been”. Some idiot SkyDragons claim that a GHE which they can’t even describe, is actually making the Earth hotter – raising its temperature! Even you aren’t that silly, are you?
Here’s the facts – the Earth has cooled. The surface is no longer molten, but more than 99% of the sub-surface is hot enough to glow in the visible spectrum.
The Earth continues to lose energy at a rate of about 44 TW or so, as the radiogenic heat reserves decrease. A body losing energy is cooling.
Slow cooling is not heating (that is, not increasing in temperature, whatever semantic silliness you attempt.)
Try describing the GHE which resulted in the Earth cooling (not getting hotter) over the past four and a half billion years or so, if you like. Can’t do it, can you?
Carry on being an idiot. I don’t mind.
“Slow cooling is not heating, you dimwit.”
I never said it was! You should pay attention, rather than repeating the same irrelevant strawmen.
Tim, please stop trolling.
So Tim is called a ‘dimwit’ three times and ‘idiot’ twice and his posts misrepresented.
But Tim is the one called out for trolling.
All can see that our ‘troll police’ have no integrity.
#2
Tim, please stop trolling.
Speaking of Sun, here is the latest comparison chart
https://i.postimg.cc/YCCxkxDj/comp11.jpg
Japanese billionaire selects crew for circumlunar Starship flight
“WASHINGTON A Japanese billionaire has selected an eclectic group of people who will accompany him on a SpaceX Starship flight around the moon, although it remains uncertain when that mission will take place.
In a Dec. 8 video, Yusaku Maezawa revealed the eight people he selected, along with two alternates, for his dearMoon circumlunar flight. The announcement was the culmination of a competition he started more than a year and a half ago.”
https://spacenews.com/japanese-billionaire-selects-crew-for-circumlunar-starship-flight/
“The selection process had been shrouded in mystery since a March 2021 deadline for submissions. In a release, the project said it received more than one million applications from 249 countries and regions around the world. (There are 193 nations who are members of the United Nations.)”
I didn’t apply, but more than 1 million did. I wonder what portion of the million were actually serious. I would rather have someone else do it, but could be something someone should do, if someone was younger and wanted to do it.
And probably a lot people decided to do things with far more risk and far less potential reward. And you going to need to get training and you don’t have much of idea when and if it’s going actually happen.
Of course, that is question, when is going to happen.
Once the Starship does a successful test launch, could get some better idea of when.
Considering SLS has almost finished it’s test flight and seems it could launch crew in two years, if had chance to go, would you?
{You don’t have chance to go, but if did}
And will Starship launch these 9 within 2 years [or before SLS]?
phi…”The misunderstanding of the mechanism of the greenhouse effect clearly finds its origin in the incredible pseudo-physics invented by Manabe in his 1967 article. A situation which worsened further around 1980 with the invention of the stupid notion of radiative forcing”.
***
Good points. G&T covered that in their paper on the GHE. The radiative forcing nonsense began with the advent of desktop computers where basic models could be run by every Tom, Dick, and Harry. Radiative forcing does not exist in a real atmosphere.
Russia is weak, and Putin is puppet.
Discuss.
gb…I see you’ve been indulging in western propaganda. According to them, Putin has been losing the Ukrainian war for 8 months or more.
He threatened the other day to send back 100 missiles for every one fired at Russia. We’ll see how weak he is. Or how stupid the West is for pushing him to that extent.
“gbI see youve been indulging in western propaganda.”
I spend some time with:
https://www.youtube.com/channel/UCC3ehuUksTyQ7bbjGntmx3Q
And this samples a lot russian progaganda, clips
{far too many as far I am concern}:
https://www.youtube.com/results?search_query=speak+the+truth
Far more indulgence with those two, than all the rest.
The first does one every week, and second in theory is daily but it’s not- roughly, a few a week.
Since the Aussie, Perun talks for hours, mostly Perun.
And since, winter & war in Ukraine was 6 days ago, another one should be coming up, soon.
But obviously Russia appears weaker than many assumed it was and I would guess most people don’t imagine Putin is a puppet.
But to me, Putin appears too similar to our dear leader, Biden.
One advantage of Biden, is I can’t be disappointed in his actions.
Probably many Russians are disappointed in their brave leader.
With Russian talking heads, their reality is they doing brutal war against Russians, but sometimes they say they fighting the Nazis, and sometimes the whole world is Nazis, and whole world against them.
But sometimes a lone wolf, will mention bombing civilians isn’t a really good idea- mainly, cause it doesn’t win wars. But none them mention that they bombing what they regard as Russia.
It seems as weak as your typical MSNBC show. Or something like The View [which I will not watch}.
In terms of Putin the puppet, he doesn’t seem to want to be seen as being in charge, and he doesn’t seem understand what going on.
Both Putin and Biden seem more like hostages, than leaders.
Disappointed with sleepy Joe? Who has already signed 3 times more more legislative bills in his 2 years than Trump did in his 4? Who brought sanity back to US government?
And the major bills he has signed have been arguably good for the country, including reducing the sudden rise in poverty begun in 2020, and increasing jobs.
Trump worked on Middle East peace plan. Biden is supporting Iran getting more nuclear weapons.
I am not disappointed with sleepy Joe. In some ways, he is better than Obama.
I thought Trump would only get 1 term. I am not Rep, but a fair number of Reps were terrified Trump would get a second term.
But these Reps are clueless of lefties- they feared dems would work with the president [who was a New York Dem}.
But Lefties eat their own.
Due to strong highs in the Arctic, the extent of sea ice will increase rapidly.
https://i.ibb.co/b6Gn117/Zrzut-ekranu-2022-12-10-125937.png
When the Arctic moves to Europe.
https://earth.nullschool.net/#2022/12/15/0400Z/wind/surface/level/overlay=temp/orthographic=-16.06,65.76,709
There are literally hundreds of locations that show no warming. Do the laws of physics cease to exist at these locations? Until you can explain why CO2 didnt warm these locations you cant blame CO2 for warming other locations. At least that is how it works in real science.
https://imgur.com/a/IrE63Xo
No. Weather and climate show variations. Some days and weeks and years some places get warmer and some get cooler. The laws of physics are perfectly in line with these sorts of variations.
The expected effects of CO2 would not be for every location to show exactly the same warming, but for locations to show some warming superimposed on the chaotic background. A place that might have cooled by 1 C without increased CO2 might only cool by 0.5 C. A place that might have warmed by 1 C without increased CO2 might warm by 1.5 C.
There SHOULD literally be 100’s of locations that show no warming (or even cooling). There should just be even more that show warming, with a net increase in temperature overall.
REAL science destroys the GHE nonsense. The nonsense is kept alive through endless efforts by the cult to pervert reality. That’s where we get such nonsense as ice cubes can boil water.
“There should just be even more that show warming, with a net increase in temperature overall”
There should also be areas that show UHI since 1870 given that the physical infrastructure has increased significantly in that time.
Also true.
Yes, Tim, but the so-called ‘skeptics’ deliberately ignore that many places on Earth have temperatures well below the norm around them.
All of this is of course ‘natural’.
But if they thought the other way around, rest assured they would soon invent an RCI (‘rural cool island’) to support their narrative.
That’s what they are, the ‘skeptics’.
But how much of the measured increase in temperatures are due to that UHI?
More than 90% of global warming is warming our average ocean temperature of 3.5 C.
So, one could say 90% of measurement of global warming is measuring
the average temperature of the ocean. And the guess is the ocean has warmed recently by about .1 C.
And the ocean is suppose to measured with very very accurate thermometers.
” And the guess is the ocean has warmed recently by about .1 C. ”
Keep guessing strong, gbaikie. It helps!
Solar wind
speed: 492.4 km/sec
density: 8.92 protons/cm3
Daily Sun: 10 Dec 22
Sunspot number: 116
The Radio Sun
10.7 cm flux: 149 sfu
Thermosphere Climate Index
today: 15.29×10^10 W Neutral
Oulu Neutron Counts
Percentages of the Space Age average:
today: +1.8% Elevated
48-hr change: -0.6%
–THIS EXPLOSION DEFINITELY WON’T: The sun just shot an interestingly narrow stream of plasma into space. SOHO coronagraphs watched it jet away from the southwestern limb of the sun on Dec. 9th
This was no ordinary CME. The jet was less than 50 thousand km wide at its base, but it stretched more than 15 million km into space. Coherent blob-like structures can be seen traveling down the stream as the eruption progresses.
The underlying physics of this event is a bit of a mystery. It might be a strangely skinny helmet streamer. Helmet streamers are magnetic arches rooted in the sun, which are sculpted and stretched by the solar wind. They’re normally 10 to 100 times wider than this one, though.
One thing is certain: It won’t hit Earth. Maybe next time. —
https://www.spaceweather.com/
It seems it will keep moderately active and seems like in short term
will more rather less.
I guessed the Neutron Counts would get down +0 but it hasn’t.
Dim Tim,
It’s a pity that you cannot even describe this silly supposed GHE, isn’t it?
You yammer on about “The expected effects of CO2 . . .”, but of course you can’t actually measure these “expected effects”, can you?
Without some reproducible experimental support, you are just another SkyDragon fantasist. When faced with the fact that the Earth has cooled over the past four and a half billion years or so, all you can do is start shouting that your mythical GHE doesn’t actually stop the Earth from cooling, but slows the rate at which this happens.
Cooling is cooling, Tim, whether you like it or not. Temperature falls. If temperatures rise, it is called heating, and even you admit that the Earth has cooled from its creation to now.
Whether the Earth is hotter or colder than someone thinks it “should be” is irrelevant. You “should be” capable of accepting reality, but you aren’t. That’s the nature of delusionalSkyDragon cultists – deny reality, and substitute bizarre religious fantasies.
Keep praying – maybe a miracle will occur, and four and a half billion years or so of physical laws will be tipped on their head, the oceans will boil, and we will all be really, really, sorry that we laughed at the silly SkyDragon cultists. Only joking – that’s sarcasm.
Carry on shouting.
tim…”There SHOULD literally be 100s of locations that show no warming (or even cooling)”.
***
There are, most of the planet shows no warming.
See white areas…
https://www.nsstc.uah.edu/climate/2022/november2022/202211_Map.png
Yes, for the month of November 2022 some places were cooler than the 1991-2020 average, and some places were warmer. And the average for the whole globe for November 2022? Warmer. As Tim said.
Now, has the globe unequivocally warmed since 1991?
Yes, yes it has, even using the preferred data index of ‘skeptics’, good old UAH v6 LT.
0.14 C/decade (+/- 0.08)
It appears ‘skeptics’ will never learn the difference between weather and climate, and statistical averages.
Global warming is only about a more uniform global temperature and an increase in global water vapor.
We are cold and dry, and have more 1/3 total land area being deserts.
Deserts have wide swings in daily temperature and seasonal temperature, and they are hot and also very cold.
The tropics [excluding the deserts] has uniformity in temperature, but even deserts in tropics do not get as cold nor as hot as other deserts.
The tropics gets the most intense sunlight and the most sunlight, and have most amount of greenhouse gases.
The tropics aren’t effected much in terms of global warming or cooling- other than their deserts become wetter or drier. And when they become wetter and aren’t deserts, they have higher average temperature, but they don’t get as hot [compared to when they were deserts].
Wiki give the amount of sunlight at noon and sun at zenith and on a clear day. This only happens in the tropics. As only in the tropics is the sun ever at zenith.
That amount of sunlight is about 1050 watts of direct sunlight plus
70 watts of indirect sunlight, giving a total amount sunlight of 1120 watts per square meters.
No where else in the world can get as much sunlight, unless it’s higher than sea level.
[oh yeah, forgot, the above 1120 watts of both direct and indirect sunlight is when at sea level elevation].
” At least that is how it works in real science. ”
In real science ???
I would rather say ‘… how it works in CO2IsLife’s childish pseudoscience.
*
S/he has been explained so many times how wrong it is to presuppose that CO2’s effect has to be identical at any place on Earth – independently of any other factor locally superseding CO2’s effect.
Especially at all very cold places on Earth (Antarctica, North Siberia etc) it can be shown that its effect is inverted.
*
It is incredibly dumb to think so trivial as does CO2IsLife, but it seems that s/he can so pretty good live with such nonsense that s/he endlessly replicates it everywhere.
The very best in the story is that CO2’s effect is equal to zero dot zero in all places where H2O’s effect prevails: for example, in the Tropics, where its atmospheric abundance can reach up to 4 %, i.e. 100 % more than CO2’s.
Two French researchers – Jean-Louis Dufresne and Jacques Treiner – have shown in 2011 how CO2 works:
https://tinyurl.com/yp7efy89
Of course
– it is about 100,000 times more complex than CO2IsLife’s elementary school level
– no ‘skeptic’ will ever be willing let alone able to read its French translation.
*
‘Skeptics’ love it simple. Anything complex is for them wrong by definition.
Gosh Bindidon, all that blah-blah and you still end up with NOTHING.
No wonder Eben has so much fun ridiculing you.
The babbling Edog aka Eben has exactly the same difficulties to ridicule me with real facts as you have, Clint R.
You are only able to come up with your eternal ‘… and you still end up with NOTHING’.
That’s all you can write, regardless what it’s about: GHE, lunar spin, etc etc.
Bunny,
Here’s a fact for you –
The Earth’s surface is no longer molten. The Earth cooled. It continues to do so – according to real scientists, not the nonsensical “climate scientist” variety.
No GHE.
Now Bin, that’s obviously not the truth.
I’m always asking you for your viable model of “orbital motion without axial rotation”. I’m trying to get you away from you addition to astrology.
No wonder it’s so easy to ridicule you.
If only you could do the Poll Dance Experiment, Pup.
Meanwhile, there is this:
https://tinyurl.com/dragon-crank-honeypot/#comment-1407754
CO2…here’s a better visual…
https://www.nsstc.uah.edu/climate/2022/november2022/202211_Map.png
When it is acknowledged Earth’s atmosphere is very thin – it will become obvious, Earth doesn’t have any greenhouse warming effect.
–
https://www.cristos-vournas.com
christos…as someone said, ‘we build greenhouses to do what the atmosphere cannot do’.
Christos Vournas
Your claim “Earths atmosphere is very thin” is based upon what? It is thick enough to support heavy passenger jets in flight? If you compare it to Jupiter it is very thin but what an unscientific statement. It means nothing in an analytical sense and you use your incorrect assumption to form an even more incorrect conclusion.
Here is real data.
https://gml.noaa.gov/webdata/tmp/surfrad_6395fb0472960.png
This is actual measured Downwelling IR from the “thin” atmosphere. It will be absorbed by the surface and lower the total amount of heat lost by the surface via radiant heat transfer. I think you need to get out of your incorrect nonscientific opinionated thinking and look at the real evidence. Please at least try. We already have enough opinionated unscientific posters on this blog who reject evidence and give their endless opinions on things. You can be scientific and go with evidence or you can be like the other so called skeptics who just make things up like one who thinks the GHE would mean “ice cubes can boil water” Some individual posters on this blog are true idiots that cannot reason or logically think. Will you drift to that level of stupidity? I hope not!
Norman, a couple of corrections:
1) Earth’s atmosphere cannot “support heavy passenger jets in flight”. The jets would need “lift” and “propulsion” to counter gravity and drag.
2) Downwelling IR does NOT mean it will be “absorbed by the surface”.
But your link is a good example of “It’s the Sun, stupid”. Notice the difference between daytime and nighttime.
And if you want to “get out of your incorrect nonscientific opinionated thinking”, you should admit:
* Two 315 W/m^2 fluxes arriving a surface will NOT result in the surface emitting 630 W/m^2
* Earth does NOT have a “real 255K surface”
Admitting just those two things will start you on the road to reality. Then we can work on the fact that you don’t have a viable model of “orbital motion without axial rotation”.
Clint R
The lift of a jet comes from a reduction of pressure over the top of the wing and the atmosphere below holds it up as it moves through the air so the lift is caused by the “thin” atmosphere. Without an atmosphere the plane would not have lift.
https://web.mit.edu/16.00/www/aec/flight.html
2) “Downwelling IR does NOT mean it will be absorbed by the surface.”
The point is it WILL be absorbed by the surface, almost all of it since the surface has a high emissivity for IR bands. You can state your opinions forever, but it will not make then true.
And yes a blackbody receiving two fluxes of 315 W/m^2 at its surface will raise to a temperature where it will emit 630 W/m^2 to equal the incoming energy. Your opinion is noted. It is wrong. You have had many posts showing you are wrong but you are not able to understand the logic and reason behind the posts.
So you may become scientifically minded if you accept you are wrong and opinionated and the evidence DOES not support you false opinions. Your opinions are not science. They are false fabrications of your ignorance of real science.
Norman, you got 1) about half right. It takes both “lift” and “propulsion”.
But you’re still confused about 2). A cold sky can NOT raise the temperature of a warmer surface. And two fluxes do not simply add.
You got one thing exactly correct, however — Opinions ain’t science.
So, I hope you can support your opinion with a valid technical reference that a surface receiving two fluxes of 315 W/m^2 will raise to a temperature where it will emit 630 W/m^2. As we both agree, opinions ain’t science.
Clint R
The forward propulsion of a jet engine will not keep the jet in the air if it is flying horizontally. It will still accelerate to the Earth. The propulsion forces the air over the wing which creates the low pressure. It has to be moving fast enough to create a low enough pressure for the lift. Not sure what your point is with that one. No atmosphere no jet flight.
2)The important point is you are not addressing my point. You are diverting to another. Your firs false and unscientific claim was that DWIR will not be absorbed by the Earth surface. This is not correct. Then you diverted and state a cold sky cannot raise the temperature of a warmer surface. That is correct to a point. The DWIR and the solar input will result in a higher surface temperature because the DWIR reduces the heat loss by radiation of the surface. The Radiant heat loss is what it emits minus what it receives from the air so the loss is reduced leading to a warmer solar heated surface.
On the fluxes adding do your own experiment with heat lamps. It will demonstrate to you very clearly that two fluxes do simply add. Turn one on at an object and log the temperature. Turn on the other and observe the temperature goes up. You have clear evidence two fluxes simply add at a surface. You are entitled to your opinions. They are wrong and unscientific.
You can do your own experiment on the two fluxes of 315 adding to produce a temperature that emits around 630 W/m^2. Get two strong heat lamps. Measure the flux one produces at the surface and turn on the second lamp. Get them set up so the surface receives 315 W/m^2 from each lamp and then see what happens. Science will prove you wrong. You will never do such an experiment and if I took the time and effort for you, you would still deny the results. E. Swanson already did a similar experiment for you on another thread and it fell on deaf ears. Do it yourself and be amazed at how bad your opinions are. Let real science do the talking. You might actually like science if you learned what it is. It is not coming on blogs, insulting and denigrating posters who make scientific claims then offering your endless wrong opinions over and over.
Now is the time for you to do science. Get your heat lamps and thermometers and go to town. If you want try to prove you are right, that would be interesting. You can turn on two heat lamps on a source and it does not warm up after you turn on the second one because your false claim that fluxes do not add at a surface will be shown correct if the object does not increase in temperature.
Norman, you look like an idiot after all that blah-blah, yet NO science.
Opinions ain’t science.
No valid technical reference for your nonsense means you got NOTHING.
Clint R
You offer your opinion ” you look like an idiot after all that blah-blah, yet NO science.”
Yet what did I state that was an unscientific opinion. You will offer them all day. What was mine that you consider to be idiotic?
What you consider opinionated blah-blah is me suggesting you do an experiment with heat lamps. I think maybe you have severe ADD you can’t follow a post more a few words.
So will you do some experiments on your own or not. You are wrong on many points.
Norman, you still look like an idiot, all blah-blah but NO science.
Opinions ain’t science.
No valid technical reference for your nonsense means you got NOTHING.
Clint R
Your response to my rational post was expected. When you are not able to intelligently respond to a poster you rely on repeating your previous post. Does doing that make you feel intelligent or special in some way?
Norman, an “intelligent response” would be you providing the valid technical reference for your nonsense. You know, the reference you claimed you always provided….
With no valid reference for your nonsense, you’ve got NOTHING.
“providing the valid technical reference for your nonsense”
Yeah like Clint does……never ever.
Norman:
“Here is real data.
https://gml.noaa.gov/webdata/tmp/surfrad_6395fb0472960.png
This is actual measured Downwelling IR from the thin atmosphere. ”
–
From the graph in the link a read there is measured about 300 W/m2 IR downward radiation at night.
–
Also the 255K refers to the 240 W/m2 outgoing IR radiation to outer space. And at night too.-
Thus we shall have at night from atmosphere:
300 + 240 = 540 W/m2
–
It is impossible!
–
Our atmosphere is invisible, but we cannot do without it.
–
https://www.cristos-vournas.com
“lso the 255K refers to the 240 W/m2 outgoing IR radiation to outer space. And at night too.-
Thus we shall have at night from atmosphere:
300 + 240 = 540 W/m2”
Why are you adding these numbers?
One is up to space, and the other is down to the surface.
They are observed, so clearly must be possible.
And Modtran shows that they make sense.
http://modtran.spectral.com/modtran_home#plot
How do you like them short mild snowless winterz predicted by global warmistas ???
https://climateimpactcompany.com/wp-content/uploads/2022/12/06dec22_snow1.png
Heck, I was looking forward to a mid-winter cruise through the Arctic Ocean. Maybe lying on the beach near the mouth of the Mackenzie River, sunbathing in January.
I was wondering how that would be possible with no Sun shining, but hey, that’s a minor problem for climate alarmists.
Grand Solar Minimum Update
> Regions around the world are experiencing multiple increasing climate extremes and impacts. The maps show regions where recent decades have seen increases in extreme heat, heavy rainfall, agricultural drought, and the length of the fire weather season, as well as changes in river flows, and glacier mass. Regions with decreasing extremes are also shown. Confidence in attribution of trends to human-caused climate change varies between impacts and regions, and information is not available for all impacts. There are numerous other impacts related to human-induced climate change, such as coastal flooding and risks to biodiversity leading to widespread decline in ecosystems, that are also of concern but not shown here.
Source: https://www.metoffice.gov.uk/research/climate/climate-impacts/global-impacts-of-climate-change—observed-trends
Eboy might particularly like:
https://www.metoffice.gov.uk/binaries/content/gallery/metofficegovuk/images/research/climate/climate-impacts/climate-impact-trend-maps/climate_maps_web_artboard-16.png
SkyDragon fantasy – 2000
“According to Dr David Viner, a senior research scientist at the climatic research unit of the University of East Anglia, within a few years winter snowfall will become “a very rare and exciting event”. “Children just aren’t going to know what snow is,” he said.
Reality today (Daily Mail) –
“Snow STOPS flights: Planes are grounded as runways close at Manchester airport as temperatures plunge to MINUS 10C today and RAC warns don’t drive to watch England match – with snow on way for London tomorrow.”
The current Met Office SkyDragon fantasy has all bases covered – increasing extremes, and decreasing extremes. Heavy rainfall, drought, and the length of the fire weather season! Coastal flooding, widespread decline in ecosystems (whatever that word salad is supposed to mean).
Reasons? None given – the numbskulls believe that people will just mindlessly accept whatever drivel is dished out by the Met Office! Luckily, there are many mindless SkyDragons like Witless Wee Willy, who believe any nonsense at all.
swenson…”According to Dr David Viner, a senior research scientist at the climatic research unit of the University of East Anglia…”
***
Ah, we’re back to the source of climate chicanery…the home of the Climategate email scandal, East Anglia.
Mike Flynn,
What are you braying about?
Little Willy, please stop trolling.
The Met Office is right up their with the best of climate cheaters. Think Climategate email scandal.
Funny how Willard descends to the depths of scumbbag science.
Come on, Gordo.
East Anglia. MET Office. Two different entities.
Get your fabrications straight.
Rubbish…get your facts straight.
Come on, Gordo:
East Anglia:
https://www.uea.ac.uk/climate/past-future
MET Office:
https://www.metoffice.gov.uk/
You are a cranky uncle.
Wiggling Wee Willy,
A bumbling gaggle of SkyDragons by any other name would still smell.
Which organisation of the two is the most useless?
I will uncritically accept your decision, even if you decide it is impossible to differentiate the degree of uselessness shared by both.
Carry on.
Mike Flynn,
What ar enough braying about, Sky Dragon crank?
Wiggling Wee Willy,
You wrote –
“What ar enough braying about, Sky Dragon crank?”
That sounds like the braying of a SkyDragon cultist donkey – cannot spell, cannot even be bothered to read the nonsense you are posting!
In case you are only trying to play dumb, rather than actually being dumb, here you go –
A bumbling gaggle of SkyDragons by any other name would still smell.
Which organisation of the two is the most useless?
I will uncritically accept your decision, even if you decide it is impossible to differentiate the degree of uselessness shared by both.
Carry on.
Mike Flynn,
What are you braying about?
Wiggling Wee Willy,
You wrote
What ar enough braying about, Sky Dragon crank?
That sounds like the braying of a SkyDragon cultist donkey cannot spell, cannot even be bothered to read the nonsense you are posting!
In case you are only trying to play dumb, rather than actually being dumb, here you go
A bumbling gaggle of SkyDragons by any other name would still smell.
Which organisation of the two is the most useless?
I will uncritically accept your decision, even if you decide it is impossible to differentiate the degree of uselessness shared by both.
Carry on.
Mike Flynn,
What are you braying about?
Little Willy, please stop trolling.
Rutgers’ Snow Lab, Northern Hemisphere
https://tinyurl.com/497fdsd9
The snow excess in this season wrt the mean of 1981/82-2010/11 you can see on the green line.
The excess was very early this year, as it began in week 38, i.e. in September.
No anomalies needed here, the absolute data speaks for itself.
I hope that the excess will keep alive till Xmas for the kids!
Source
https://climate.rutgers.edu/snowcover/files/wkcov.nhland.txt
But I thought the NH was getting warmer, and now we have more snow!
Not only, it’s darned cold her in Vancouver, Canada. It certainly is not warming and sea levels remain the same. Heck, they are still skiing on the local mountains.
I thought people understood that seasonal weather is not the same every year!
binny…”I hope that the excess will keep alive till Xmas for the kids!”
***
As W.C. Fields put it, ‘never met a kid I liked’.
A New Way to Produce Primordial Black Holes in the Early Universe
“Primordial black holes remain an intriguing option to potentially explain dark matter. A new study has found a plausible scenario for creating them in the early universe.
Astronomers do not understand roughly 80% of the mass of every galaxy. The unknown portion is known as dark matter, and astronomers typically assume that its a form of matter that does not interact with light. One option for the dark matter is for it to be made of black holes, which as their name suggests do not emit radiation. However, these black holes cannot be made through the deaths of stars. First, there havent been enough generations of stars in the age of the universe to produce enough black holes. And second, even if the universe was older, there simply isnt enough raw material to make enough stars in the first place. So this kind of black hole formation cant explain all of the dark matter.”
https://www.universetoday.com/158890/a-new-way-to-produce-primordial-black-holes-in-the-early-universe/#more-158890
“Instead if we want to make the dark matter be made out of black holes, those black holes have to be primordial. That means they are not made from the deaths of massive stars, but instead through some exotic process in the early universe.”
It seems if “Astronomers do not understand roughly 80% of the mass of every galaxy”
It’s probably not one thing.
Or it seems to me that the odds are against it.
And it seems to me, one can roughly say nothing disappears from this Universe.
Or given enough time, “maybe” a significant amount could disappear, but I mean, we have not had enough time, therefore can posit nothing much has disappeared from this universe.
Though I would not say nothing much has been added to this Universe- as I think there no reason or evidence for saying this.
So, when matter and anti-matter combine it doesn’t disappear from this universe.
And mass we detect is what it began with [unless there some addition, later- which I am not going to rule out].
Anyhow, maybe problem is we have not used enough anti-matter, perhaps we can do that after we become a spacefaring civilization.
gb…”The unknown portion is known as dark matter, and astronomers typically assume that its a form of matter that does not interact with light”.
***
There’s another possibility, astronomers are incapable of thinking at that level. For the average astronomer, if something does not emit light, it is a black hole. They seem to have extended that hypothesis to other area that don’t qualify as a black hole.
According to blackbody theory, any matter should emit infrared energy, at least. That leaves us with some interesting speculation. Either BB theory is wrong, dark matter theory is wrong, or the scientists are wrong, or all three are wrong. That means we’re back to “we don’t know”, a situation I prefer.
“….That means were back to we dont know, a situation I prefer.”
In our solar system, the sun and far more mass than all known planet, but we don’t know all significant planet like masses in our solar system.
But will assume all the shining stars have most of mass.
And since don’t know all planet size masses in solar system we don’t know planet size beyond solar solar. And there is a lot space between the stars.
And it’s considered that Sol system ejected a lot of planet size object out of solar system and so possible that other star systems ejected a lot planets, maybe more than Sol system. And our sun is not the old, and so there has more time to eject planet size stuff away things which shine- and these are dark because we lack big enough telescopes and lack the time of using telescopes which exist to see them. So not seeing them, not because they don’t shine, but don’t shine enough, or no one has looked.
maguff…”Funny story about Vincent Gray. Also not true!
The IPCC report defines the terms Climate Prediction and Climate Projection”.
***
Maguff, the simpleton, cannot research properly.
https://web.archive.org/web/20081014204946/https://nzclimatescience.net/images/PDFs/gray2.ipcc%20spin.pdf
Page 4 of 6…
“As before, you search very hard to find anything at all that is below Likely; and as before, the
probability figures are pure guesswork and have no relationship to mathematical statistics.
These procedures are merely an orchestrated litany of guesswork.
From the 1995 Report on, the IPCC always makes “projections, never “predictions”. They thus admit
that their models are not suitable for “prediction” at all.
Also as everything is “evaluated” but not “validated”. There can never be never preferred models or
scenarios, as they have no way of choosing between them”.
Come on, Gordo.
Vincent is pulling your leg. The IPCC is not in the business of telling you how many kids humans will produce. Think.
Besides:
https://fr.m.wikipedia.org/wiki/Vincent_Courtillot
He is a political shill who blockaded scientific progress for decades.
Whacky Wee Willy,
You wrote –
“Vincent is pulling your leg.”
Which Vincent are you burbling about?
Vincent Grey? Vincent Courtillot? Vincent Van Gogh?
You seem confused. Or is this another cunning SkyDragon ploy to demonstrate stupidity through obscurity? If so, you are achieving your aim.
Maybe you are just redefining “Vincent” in the usual SkyDragon fashion to mean anyone or anything that suits your purpose. Something like defining “slowly cooling” to mean “increasing temperature”?
If anybody points out that you are looking like a fool, you could just call them a liar and a cheat!
You don’t need to thank me.
Mike Flynn,
What are you braying about?
Whacky Wee Willy,
You wrote
Vincent is pulling your leg.
Which Vincent are you burbling about?
Vincent Grey? Vincent Courtillot? Vincent Van Gogh?
You seem confused. Or is this another cunning SkyDragon ploy to demonstrate stupidity through obscurity? If so, you are achieving your aim.
Maybe you are just redefining Vincent in the usual SkyDragon fashion to mean anyone or anything that suits your purpose. Something like defining slowly cooling to mean increasing temperature?
If anybody points out that you are looking like a fool, you could just call them a liar and a cheat!
You dont need to thank me.
Mike Flynn,
What are you graying about?
Little Willy, please stop trolling.
Who the heck is Vincent Courtillot? Courtillot is not French for Gray.
Willard is slowly but surely losing it. That’s what you get Willard, as a Sky Dragon, when you try to deal with people like the skeptics here who understand science.
Come on, Gordo.
Vincent is very gray indeed:
https://en.wikipedia.org/wiki/Vincent_R._Gray
Think.
Little Willy, please stop trolling.
Gordon Robertson,
You gullible lackey. Review Comments for the IPCC reports are easily discoverable. Show me where Vincent Gray’s comments were ever accepted by the IPCC as constructive. His comments were generally rejected as mere opinions.
Your link is to a self-referencing article by Vincent Gray which only proves that he is (was died in 2018) another denialist blowhard.
maguff…denial sure hits you hard. You insult someone who is deceased who loyally served the IPCC since its inception as an expert reviewer. He talks about that briefly at the end of link 2 video. He reveals the scams as an expert reviewer.
From one of your favourite sites…
https://www.heartland.org/about-us/who-we-are/vincent-gray
https://www.climatedepot.com/2018/06/19/rip-skeptical-scientist-dr-vincent-gray-ipcc-expert-reviewer-dies-at-96/
A good talk by Vincent in which he reveals the scams of climate change and the IPCC. Hard to watch because the volume is so low and ther are people trying to fix the Powepoint system. Worth it, however, to those who appreciated the brilliance of Vincent Gray.
Many good links to Vincent Gray stuff at the link above…
Gordon Robertson,
You useful idiot.
Since you will not research for yourself the easily discoverable IPCC Review Comments, I give you this reply to one of Gray’s comments about AR5:
Rejected – Broad opinion statement has nothing to do with Chapter 1. The evidence he “wants” is found both in past IPCC assessments and in later chapters of this one.
The rest of his comments received similar replies.
As Isaac Newton said: science advances one funeral at a time.
Q.E.D.
Tyson, please stop trolling.
Earlier, I asked Tyson McGuffin if he had an explanation for the GHE apparently being responsible for the Earth having cooled for four and a half billion years or so, rather than getting hotter over that period.
After a bit of toing-and-froing, taking refuge in semantics, and generally avoiding facing reality, TM unleashed a devastating bit of SkyDragon repartee, as follows –
“Swenson at 12:00 AM
“Why did you cherry-pick?”
Rhetorical question.
I know why. Its because youre a liar and a cheat.”
Well, that’s certainly sorted that out! Dont worry about facts or reality, just bury your head in the sand, and call anybody who challenges your cultist SkyDragon beliefs a liar and a cheat! Explanations or justifications? Who needs ’em?
If I refer to the SkyDragon Michael Mann as a faker, fraud, scofflaw and deadbeat, it’s because the facts show that he is . . . a faker, fraud, scofflaw and deadbeat.
If you think that falsely claiming to be a Nobel Prize winner also makes him a liar and cheat, rather than suffering from delusional psychosis, you are free to do so.
Still no GHE, and climate remains the average of historical weather observations, with precisely no power to affect anything at all.
“…TM unleashed a devastating bit of SkyDragon repartee…”
dev-as-tat-ing
Which are you bleating about? Toughen up buttercup.
TM,
“sarcasm
/ˈsɑːkaz(ə)m/
noun: sarcasm; plural noun: sarcasms
the use of irony to mock or convey contempt.”
Your ability to do anything
a) highly destructive or damaging.
b) causing severe shock, distress, or grief.
c) extremely impressive or effective.
with regard to me, is nil.
Carry on dreaming, while you try to find something (anything) to contradict “Still no GHE, and climate remains the average of historical weather observations, with precisely no power to affect anything at all.”
Or just keep trying to play silly semantic games.
[laughs at wriggling Warmist worm]
swenson…maguff is built too close to the ground, these matters go right over his head. Courtesy of Foghorn Leghorn.
Sarcasm: “Still no GHE, and climate remains the average of historical weather observations, with precisely no power to affect anything at all.”
Got it!
Tyson, please stop trolling.
angech…”The major contributors to the ice sheet mass loss are global temperature variation and the warmth of the currents reaching the Arctic each year which vary”.
***
There are other issues, like the currents in the Arctic Ocean that dump Arctic ice into the North Atlantic. It’s important to understand that Arctic sea ice is not a huge mass of ice. It is, in fact, many chunks of ice that can be relocated by wind and ocean currents.
Roy also mentioned relatively warmer water variations in the North Atlantic. It would seem then that variations in temperature of the North Atlantic and North Pacific could be factors in reducing sea ice extent.
https://www.nasa.gov/home/hqnews/2007/oct/HQ_07216_Sea_Ice.html
“Nghiem said the rapid decline in winter perennial ice the past two years was caused by unusual winds. “Unusual atmospheric conditions set up wind patterns that compressed the sea ice, loaded it into the Transpolar Drift Stream and then sped its flow out of the Arctic,” he said. When that sea ice reached lower latitudes, it rapidly melted in the warmer waters”.
It’s important to understand that the Arctic Ocean is not an ice sheet. It is, in fact, a collection of ice floes of variable sizes, and not an ice sheet, as in the Antarctic. As such. the ice can be compressed, and as the article claims, dumped into the North Atlantic.
Something of interest…
https://www.physicsforums.com/threads/physicist-falsifies-gh-gas-theory.186598/
Read about ‘ridge’ formations here…how much of the ice seen by satellites is hidden in vertical ridges?
https://www.pmel.noaa.gov/arctic-zone/essay_wadhams.html
The following is a condensed version of another article. The climate alarmists are always rooting out scientific articles that don’t relate well to climate change bs and rep[lacing them with watered down versions.
tinyurl.com/2zjdmhjw
I’ll post the original link if I find it.
The most important factor might be the compressability of sea ice. Henry Larsen, who was captain of the St. Roch, an RCMP cutter that was first to sail both ways across the Arctic, in the 1940s. On the eastward journey it sailed from Vancouver to Halifax but it took two years. Larsen explained that the sea ice moved and hemmed them in on the northern shore of Canada.
On the return trip, east to west, they sailed through in 87 days. Larsen explained that the sea ice always moves and is unpredictable. When it moves, it compresses into a smaller area. Satellite images would not show the extent of compression. Nor would they show the ice hidden in the vertical pressure ridges.
All true, except “Satellite images would not show the extent of compression.” Not sure where you get that idea…
The satellites measure areal density of the ice, so when it is compressed, they detect that as increased areal density.
Nate,
You wrote –
“The satellites measure areal density of the ice, so when it is compressed, they detect that as increased areal density.”
Do you make this stuff up yourself, or are you a tad dyslexic, and unable to properly transcribe what you read?
The devil is in the detail as usual. As NASA points out “New state-of-the-art snow accumulation models have been developed to provide this extra data in preparation for the launch of ICESat-2.”
Models and estimates, guesses and assumptions, are still necessary. Even NASA refers to “new” models, presumably because the “old” models were unfit for purpose. Unfortunately, NASA doesn’t spend a lot of time telling people how inaccurate the “old” models were, nor how inaccurate the “new” models are. I suppose we have to wait for the “new” models to become “old”!
In any case, measuring ice extent is about as useful as measuring temperatures. It predicts nothing, as the SkyDragon cultists’ “Ship of Fools” demonstrated. Wishful thinking does not overcome fact.
Carry on with areal density assertions. Good for a laugh, if nothing else.
No surprise that Swenson goes off somewhere irrelevant to the topic.
nate…areal density is the mass per unit volume. Never heard of an instrument flying in a satellite that can measure mass per unit volume.
“areal density is the mass per unit volume”
Ooohh, a tricky self goal there, Gordon.
Note the word ‘areal’ in areal density.
Areal, as in an ‘area’, which is not a volume, last I checked.
“Sea ice concentration is a useful variable for climate scientists and nautical navigators. It is defined as the AREA of sea ice relative to the total at a given point in the ocean.”
https://en.wikipedia.org/wiki/Sea_ice_concentration
Perhaps you should research the matter of Arctic sea ice thickness and volume before going off half cocked as usual.
https://agupubs.onlinelibrary.wiley.com/doi/full/10.1029/2012JC008141
http://psc.apl.uw.edu/research/projects/arctic-sea-ice-volume-anomaly/
Adding a source never hurt
https://ocean.dmi.dk/arctic/icethickness/images/FullSize_CICE_combine_thick_SM_EN_20221210.png
Up until a few years ago, DMI also provided a data text file for thickness, but I can’t find it anymore.
A comparison to PIOMAS
https://drive.google.com/file/d/18wtrwRFIVe3JvkCxyGmJCJp5DYPPtAL3/view
ent…”Perhaps you should research the matter of Arctic sea ice thickness and volume before going off half cocked as usual”.
***
I’m surprised that you can read such a paper with your thick Irish mind.
From paper 1…
“Recent observations of large losses of Arctic sea ice are considered a key indicator of changes presently occurring in the climate…”
The authors don’t explain the mechanism of so-called disappearing sea ice. During the winter, there is no solar input for months and little or none for a good portion of the rest of the fall/winter/spring. Even in summer, when all the ice is claimed to melt, temperatures seldom get much above 0C. Yet, these rocket scientists believe a trace gas can warm the Arctic.
Here we have a couple of yahoos, using an unvalidated climate model and data from satellites, admitting there is very little change in sea ice thickness year to year, yet claiming on the other hand that the sea ice is disappearing.
Only twits could reach such conclusions.
I have offered good information on the local conditions in the Arctic that offer perfectly good natural reasons why sea ice extent varies year to year.
From link 2….
“Sea Ice Volume is calculated using the Pan-Arctic Ice Ocean Modeling and Assimilation System …”
Enough said. I am tired of inferences based on unvalidated climate models.
Gordon you seem to be trying to say, again, that you cannot estimate sea ice extent by satellite imagery
–
This is simply wrong and you know it.
You have satellites, they can measure and detect sea ice extent.
Get over it.
Stop trying to use it as an excuse for not using a valid measuring system that you are not happy with because warmists are.
–
Thank you for sharing your thoughts on causes of SMB gain or loss though you interpose sea ice loss on the mix.
–
Wind is an important vector for sublimation which the Great Danes and Bindidon completely neglect to mention, raising issues as to their scientific rectitude and knowledge
Currents in and out of the Arctic are important.
Rainfall in Summer might have an effect on increased melt as would cloud cover..
–
Compression and ridging of ice is nothing new and not a concern..
Yes it has an effect on estimates of area and can change quickly but in winter ice extent increases and in summer it reduces despite the temporary effects of ridging or compression.
The volume may be different but that is a different measurement technique.
The surface area and extent can be estimated and stated.
Ice is not invisible.
Any ice that gets too far away from the Arctic will melt quickly unless a large iceberg.
It does not matter really whether it is thin or compressed, just where it travels to.
The Arctic Ocean is not an ice sheet?
I guess any ocean is an ocean.
The Antarctic is an ice sheet.
No, it is mostly covered with an ice sheet but it is either a very large island or a very small continent.
angech…”Gordon you seem to be trying to say, again, that you cannot estimate sea ice extent by satellite imagery…”
***
I am not claiming the sea ice extent cannot be estimated by satellites I am merely pointing out other factors involved that make an accurate estimation unlikely. Those who estimate sea ice extent don’t seem satisfied to report what the satellites see and leave it at that, they tend to suggest it is related to global warming.
I have seen sat photo of the Arctic ocean where most of the ice is crammed against the northern Canadian shore, leaving the equally cold Siberian side ice free. Sometimes the North Pole, of all places is ice free, while the rest of the ocean is covered in ice. All I am trying to do is offer a more complete picture of the situation in the Arctic Ocean, which is not as simple as it may seem.
OK.
I am not claiming the sea ice extent cannot be estimated by satellites
–
The sea ice extent can be easily measured.
Your point about sea ice compression is not relevant to the question of measuring the extent.
–
Volume and extent both measure ice presence.
Sometimes it is spread out thin, sometimes compressed.
Generally there is a relationship between the two but if all one can measure is extent then monitoring and measuring extent has to suffice as a a useful tool which can and should be used as much as possible, bearing in mind caveats you have mentioned.
Another stratospheric intrusion will bring frigid air to southern California and Arizona.
https://i.ibb.co/pwkcK0s/gfs-hgt-trop-NA-f048-1.png
If anyone thinks that the blockage of the polar vortex by the concentration of ozone over eastern Siberia will end, they are sorely mistaken.
https://i.ibb.co/hDjvtwD/gfs-t30-nh-f120.png
https://i.ibb.co/bLcn8yT/gfs-z100-nh-f120.png
If anyone thinks that the blockage of the polar vortex by the concentration of ozone over eastern Siberia will end, they are sorely mistaken.
https://i.ibb.co/L1RWhb2/gfs-toz-nh-f120.png
Very strong high over Greenland.
https://i.ibb.co/cyWgVcW/Zrzut-ekranu-2022-12-11-162622.png
Goody, goody….looks like it might miss us, at least partially.
I think the climate gods are sending a message to the idiots in California who push this climate propaganda.
Contrary to some predictions the Sun did not flame out last week
https://i.postimg.cc/K8SR5vB2/EISNcurrent.png
Notably from the die-hard coolistas, like Eben.
Grand Solar Minimum Update
https://globalnews.ca/news/9316074/2021-bc-extreme-weather-events-cost/
Wee Willy Wanker,
So 2021 “weather” events will cause large costs, but 2021 was the single most expensive year for “climate disasters”!
Surely you are not stupid enough not to know that “climate” is the average of past “weather” observations? Or am I wrong – you really are stupid enough to believe that “climate” affects “weather”, is that it?
Have you considered reading what you are going to post before actually posting it?
Probably not, given some of the stuff you post.
Maybe you could find something to support your claim that the GHE resulted in the Earth cooling for four and a half billion years or so? Or are you claiming that I am wrong, and the GHE made the Earth hotter?
Or are you claiming nothing, and just trying to be a troll?
Come on, Wee Willy – the world wants to know,
[sniggers at clueless SkyDragon]
Mike Flynn,
What are you greying about?
Wee Willy Wanker,
So 2021 weather events will cause large costs, but 2021 was the single most expensive year for climate disasters!
Surely you are not stupid enough not to know that climate is the average of past weather observations? Or am I wrong you really are stupid enough to believe that climate affects weather, is that it?
Have you considered reading what you are going to post before actually posting it?
Probably not, given some of the stuff you post.
Maybe you could find something to support your claim that the GHE resulted in the Earth cooling for four and a half billion years or so? Or are you claiming that I am wrong, and the GHE made the Earth hotter?
Or are you claiming nothing, and just trying to be a troll?
Come on, Wee Willy the world wants to know,
[sniggers at clueless SkyDragon]
Mike Flynn,
What are you blathering about?
Come on, Willard, there is no such thing as blathering.
Wee Willy Wanker,
So 2021 weather events will cause large costs, but 2021 was the single most expensive year for climate disasters!
Surely you are not stupid enough not to know that climate is the average of past weather observations? Or am I wrong you really are stupid enough to believe that climate affects weather, is that it?
Have you considered reading what you are going to post before actually posting it?
Probably not, given some of the stuff you post.
Maybe you could find something to support your claim that the GHE resulted in the Earth cooling for four and a half billion years or so? Or are you claiming that I am wrong, and the GHE made the Earth hotter?
Or are you claiming nothing, and just trying to be a troll?
Come on, Wee Willy the world wants to know,
[sniggers at clueless SkyDragon]
Flynsson repeats the same post, 3 times, hoping no one will notice it contains nothing but the usual blather.
“blather
Learn to pronounce
verb
talk long-windedly without making very much sense.
“she began blathering on about spirituality and life after death”
long-winded talk with no real substance.
“all the blather coming out of Washington about crime”
willard…it wasn’t a climate disaster. As you know, climate is theoretically an average of weather over 30 years. If we’d had the same issue every November, that would indicate a climate disaster. Since it was a ‘one of’, related to the La Nina, it’s not a climate issue.
This November we saw no flooding whatsoever, which is relatively normal for BC in November. This year it was the abnormal cold that bothered us.
Come on, Gordo.
Disasters.
With an S.
Once again you are riffing without reading.
swenson…the 17 billion was not for flood damage, it was largely to rebuild river dikes that were severely under height. The government had been told about the situation and ignored it. No one was thinking climate change then, it was after they got caught with their pants down they decided to blame it on climate change.
Much of the flood damage was in the region where the dikes were overwhelmed. For the rest of us in BC, it was yet another wet November. Surprising how that happens in a rain forest climate.
It seems no one knows how much global warming is caused by amount CO2 in Earth’s atmosphere.
At least one person at NASA thinks Earth’s CO2 causes Earth’s average temperature to be 33 C warmer than it would be
without CO2 in the atmosphere:
“Remove carbon dioxide, and the terrestrial greenhouse effect would collapse. Without carbon dioxide, Earth’s surface would be some 33C (59F) cooler. ”
https://climate.nasa.gov/faq/19/what-is-the-greenhouse-effect/
Or cooler. How much cooler could reasonable be? Does anyone think Earth would be 40 C or more cooler. Or is 33 or more about the highest the effect of CO2 which is less than 1% of atmosphere – it presently apparently less than .1% of atmosphere. All greenhouse gases are less than 1%. Though if focus on the tropical region there is more than 3% of water vapor.
The tropics has only about 20% of it’s area being land, and all human population lives on land areas. About third human population lives in tropics.
“The tropics account for 36 percent of Earth’s landmass”
https://education.nationalgeographic.org/resource/tropics
The tropics are defined by the tilt of Earth axis which varies over time, though it shrinking presently, and is “the parallel of latitude 23 degrees 26ʹ north (tropic of Cancer) or south (tropic of Capricorn) of the equator” – google
And descending air from tropical ocean creates tends to cause desert around 30 degrees north or south- called horse latitudes.
Within tropical zone are large deserts [which don’t many people living there] and large rainforests such in Brasil [which also don’t many people living within them].
More than 1/2 of sunlight reaching Earth surface falls within 23.5 degrees latitude north and south- and about 40% of entire
land and ocean surface. And if widen to closer 50% of Earth surface, say around 30 degree, north and south, you get more desert,
more portion of entire amount sunlight reaching Earth and a lot more people- more of India, more China, Egypt and etc.
One could say most people are living where there is the most sunlight- though the notable exception is Europe.
And there a good reason Europe is exception, as it warmed by the tropical Gulf Stream- it would be about 10 C colder
without it.
Instead the amount sunlight, one could talk about average temperature- most people live in regions with average temperature
15 C or warmer- India average is 25 C, and in terms of large nation, a country with most people living in relatively small
region- and also mention smaller nation near called Bangladesh average of 25.5 C which more people living a smaller region-
more overcrowded- or limited in land area. Africa continent has about same population as India, it’s called hottest
continent, but it’s large continent, it has desert area larger than US, but excluding desert area, it’s quite a large region.
US has 3 times area of India, and Africa got 9 times more than India. US is not over populated, and neither is Africa- and large
portion of US population are living where average temperature is 15 C or warmer. Florida is about 23 C, and a faster growing
state [largely due to political reasons]. I think California has better weather [averages about 15 C] but is trainwreck in many ways, politically- though silicon valley was very powerful engine of technical innovation].
But I am getting sidetracked {obviously].
One thing was how much warming does cargo cult think CO2 levels cause, is it 33 C or more?
And/or is bad for the movement to claim CO2 causes 33 C or more?
Or is it better to double down and claim it is probably much more than 33 C?
Is there any evident which supports more than 33 C?
“But I am getting sidetracked {obviously]”
Dementia setting in (obviously).
studentb,
Presumably, you agree with the following utter nonsense from NASA –
“Remove carbon dioxide, and the terrestrial greenhouse effect would collapse. Without carbon dioxide, Earths surface would be some 33C (59F) cooler.”
You are such a dimwit that you uncritically accept the existence of something you can’t even describe – the “terrestrial greenhouse effect”!
That’s called religion – trying to get others to believe in something that cannot be described, yet has awesome powers – causing floods, droughts, heat waves, more extreme weather, less extreme weather . . .
Oh, and cooling the Earth for four and a half billion years or so, while simultaneously making it 33C hotter than it is!
Carry on believing.
Presumably?
Presume away!
Better still, try yelling at the clouds.
studentb,
Presumably, you agree with the following utter nonsense from NASA
Remove carbon dioxide, and the terrestrial greenhouse effect would collapse. Without carbon dioxide, Earths surface would be some 33C (59F) cooler.
You are such a dimwit that you uncritically accept the existence of something you cant even describe the terrestrial greenhouse effect!
Thats called religion trying to get others to believe in something that cannot be described, yet has awesome powers causing floods, droughts, heat waves, more extreme weather, less extreme weather . . .
Oh, and cooling the Earth for four and a half billion years or so, while simultaneously making it 33C hotter than it is!
Carry on believing.
swenson…”[from NASA] Remove carbon dioxide, and the terrestrial greenhouse effect would collapse. Without carbon dioxide, Earths surface would be some 33C (59F) cooler”.
***
How does something collapse that doesn’t exist? You could remove all CO2 from a real greenhouse and it wouldn’t cool at all, never mind get 33C cooler.
” something you cant even describe the terrestrial greenhouse effect!”
No worries.
When Swenson asks for a description of the GHE, and GETS ONE from Tyndall, no less, he doesn’t show even the slightest interest.
https://www.drroyspencer.com/2022/11/canadian-summer-urban-heat-island-effects-some-results-in-alberta/#comment-1402815
You see, for Swenson, the facts just don’t matter.
Because he is only here to troll.
Yeah, but what wanted to get to was immigration, but I didn’t get enough coffee.
https://worldpopulationreview.com/country-rankings/immigration-by-country:
United States 50.6 million
Germany 15.8 million
Saudi Arabia 13.5 million
Russia 11.6 million
United Kingdom 9.4 million
United Arab Emirates 8.7 million
France 8.5 million
Canada 8.0 million
Australia 7.7 million
Spain 6.8 million
One could roughly say Canada gets the most considering it’s
population, but the numbers indicate Saudi Arabia got most cause
they started with small population. But it seems to me mostly related to Saudi wealth and largely importing cheap labor [who are Muslim].
Canada projected to 50 million people by 2080 AD
Saudi going get to about 50 million by 2060 and be flat to 2080 AD
Russia going drop to 118 million by 2080, and now about 145 million.
I am more interested where people want go or leaving, Russia has as many leaving and as coming. Germany like Russia is crashing:
72 million by 2080 and has +82 million now, but Germans aren’t fleeing like they are with Russia. And with Russia’s war, I imagine it will be updated, downward.
Top 10 Countries with the Highest Number of Emigrants (Former Residents living Internationally) – United Nations 2020:
India 17.9 million
Mexico 11.1 million
Russia 10.8 million
China 10.5 million
Syria 8.5 million
Bangladesh 7.4 million
Pakistan 6.3 million
Ukraine 6.1 million
Philippines 6.1 million
Afghanistan 5.9 million
What sort of surprising is Afghanistan, an I wonder how many are
going to Saudi Arabia.
According to this, China will have 972 million by 2080,
I would guess much lower than this.
gb…”One could roughly say Canada gets the most considering its population…”
***
Not one Canadian was consulted before the immigration exodus began. Canada was built, like the US, on a European base of immigrants. Somewhere along the line, it was arbitrarily decided that our population base was too small to support growth (translation: profits for corporations and businesses). So, a decision was made , without consulting Canadians, to open the doors to Asian immigration.
That is not a racist comment. European immigration was essentially put on hold while we sought immigrants and refugees from Asia and Africa. That is racism in itself. However, we sought out wealthy immigrants from Asia, encouraging them literally to come to Canada and bring your money.
Canada is absolutely pathetic in that way. We have a humungous amount of natural resources yet very little has been put in place to develop them and profit from them. Rather, we are content to let international investors develop our resources off-shore. We are totally reliant on the US to refine our oil into gasoline. We had a nation fuel corporation called Petro-Canada and we sold it off to private interests.
I was talking to a guy of Chinese descent who was a manager at a company I worked at. I commented to him that many of the Chinese immigrants being landed illegally on boats were from the poorer Asian classes. He told me essentially to give him a break, that it cost US$5000 to get on such a boat and no Chinese from the peasant class could ever afford that.
We are essentially importing immigrants who are from the wealthier side of Asia and it goes without saying that much of that wealth was gained at the expense of the poorer classes through corruption.
The aim seems to have been to get younger Asians installed in Canada with the idea of bringing their elders behind them. They get away with that somehow but when a landed immigrant from Europe tries it he/she is met with strong resistance. I recall a friend trying to bring his aging mother from the UK and the resistance was so strong he had to give up.
“He told me essentially to give him a break, that it cost US$5000 to get on such a boat and no Chinese from the peasant class could ever afford that.”
You can loan the peasant class the money. Or indentured slaves- a lot
peasant class from beginning America arrived that way.
And the criminal Cartel on US border are likewise charging a fee to cross into US, and probably more than $5000 dollars and this also what talking about generally with “human trafficking” but it’s girls without any money.
Canadians don’t have a Mexican Cartel which not only controls Southern border but also the entire Mexican govt. But also of course it also involves US intel and FBI, like they have always involved with criminal activity as in with Vietnam and Afghanistan and endless known examples.
And Chinese crime is also famous and doing this stuff, before US existed. Or Chinese nor US intel didn’t stop doing this.
Solar wind
speed: 482.6 km/sec
density: 10.42 protons/cm3
Sunspot number: 111
The Radio Sun
10.7 cm flux: 142 sfu
Updated 11 Dec 2022
https://www.spaceweather.com/
Thermosphere Climate Index
today: 15.24×10^10 W Neutral
Oulu Neutron Counts
Percentages of the Space Age average:
today: +2.1% Elevated
48-hr change: +0.6%
–THE HEAT SHIELD WORKED: NASAs Orion spacecraft successfully completed a parachute-assisted splashdown in the Pacific Ocean today at 12:40 EST as the final major milestone of the Artemis I mission. Engineers will perform several additional tests while Orion is in the water and before powering down the spacecraft.–
That’s good news.
gbaikie
Thanks for your update on Orion. Glad it was a success!
Solar wind
speed: 467.9 km/sec
density: 6.36 protons/cm3
Sunspot number: 142
Updated 12 Dec 2022
The Radio Sun
10.7 cm flux: 148 sfu
Thermosphere Climate Index
today: 15.40×10^10 W Neutral
Oulu Neutron Counts
Percentages of the Space Age average:
today: +2.1% Elevated
Solar wind
speed: 339.7 km/sec
density: 3.52 protons/cm3
Sunspot number: 174
Updated 15 Dec 2022
The Radio Sun
10.7 cm flux: 165 sfu
Thermosphere Climate Index
today: 15.35×10^10 W Neutral
Oulu Neutron Counts
Percentages of the Space Age average:
today: +2.3% Elevated
–INCREASING SOLAR ACTIVITY: Yesterday, fast-growing sunspot AR3165 unleashed a remarkable series of M-class solar flares. All day long, no more than a few hours went by without a significant explosion:–
Solar wind
speed: 325.4 km/sec
density: 3.74 protons/cm3
Sunspot number: 140
Updated 16 Dec 2022
The Radio Sun
10.7 cm flux: 166 sfu
Thermosphere Climate Index
today: 15.47×10^10 W Neutral
Max: 49.4×10^10 W Hot (10/1957)
Min: 2.05×10^10 W Cold (02/2009)
Oulu Neutron Counts
Percentages of the Space Age average:
today: +2.4% Elevated
It seems things are fading rather than new small spots
appearing and growing, but we will see happens in few days.
Dec month might be significantly higher.
But as for Jan month, I have no idea, though it seems
odds favor more sideways.
Solar wind
speed: 288.5 km/sec
density: 2.97 protons/cm3
Sunspot number: 139
Updated 17 Dec 2022
The Radio Sun
10.7 cm flux: 166 sfu
Thermosphere Climate Index
today: 14.70×10^10 W Neutral
Oulu Neutron Counts
Percentages of the Space Age average:
today: +2.4% Elevated
–CHANCE OF FLARES TODAY: Following two days of non-stop flaring, active sunspot AR3165 is quieting. It could be gaining strength for a bigger flare. NOAA forecasters say there is a 50% chance of M-class flares and a 10% chance of X-flares on Dec. 17th.–
And: RARE STELLAR OCCULTATION
A fair size spot coming from far {as others leaving us]- or
better chance Dec sunspots will be higher.
But wind, thermosphere and neutron counts indicates quite
weak for a solar max. And got couple big coronal holes facing us.
Solar wind
speed: 331.3 km/sec
density: 5.29 protons/cm3
Sunspot number: 128
Updated 18 Dec 2022
The Radio Sun
10.7 cm flux: 155 sfu
Thermosphere Climate Index
today: 15.20×10^10 W Neutral
Oulu Neutron Counts
Percentages of the Space Age average:
today: +2.4% Elevated
3169 is a head of snake from the farside.
3170 might grow a bit
Solar wind
speed: 348.6 km/sec
density: 8.93 protons/cm3
Sunspot number: 132
Updated 20 Dec 2022
The Radio Sun
10.7 cm flux: 152 sfu
Thermosphere Climate Index
today: 15.43×10^10 W Neutral
Oulu Neutron Counts
Percentages of the Space Age average:
today: +0.6% Elevated
48-hr change: -1.8%
Neutron counts drop a lot
Solar wind
speed: 632.3 km/sec
density: 0.09 protons/cm3
Sunspot number: 85
The Radio Sun
10.7 cm flux: 128 sfu
Updated 24 Dec 2022
Thermosphere Climate Index
today: 15.58×10^10 W Neutral
Oulu Neutron Counts
Percentages of the Space Age average:
today: +0.5% Elevated
48-hr change: +0.5%
Just out of curiosity, I downloaded the monthly Lower Troposphere data and examined its time series properties. It soon became evident that the properties vary for the different regions identified, so I separately examined TropicLand, TropicOcean, NHExtTropicLand, NHExtTropicOcean, SHExtTropicLand, SHExtTropicOcean, NPoleLand, NPoleOcean, SPoleLand and SPoleOcean. Although the documentation does not say, I assume that these are mutually exclusive sets that cover the whole surface.
Here were some interesting results:
1. For all 10 series, the hypothesis that they have a unit root was easily rejected at a very low significance level. In other words, the series are not integrated. Since CO2 in the atmosphere is integrated, this alone throws doubt on the hypothesis that CO2 drives Lower Troposphere temperatures in any simple way.
2. Seven of the series were fractionally integrated (they are long-memory processes). The estimated fractional differencing parameters were (to 2 decimal places):
TropicLand 0.24
NHExtTropicLand 0.40
NHExtTropicOcean 0.43
SHExtTropicLand 0.32
SHExtTropicOcean 0.37
NPoleLand 0.28
NPoleOcean 0.44
These are probably not statistically different except for TropicLand and NPoleLand. Perhaps the land areas in the latter cases are not so concentrated or far from oceans. The lower values for the two SH series are perhaps consistent with that hypothesis?
3. Five series showed evidence of short-run autoregressive dynamics:
TropicLand ar(1) 0.79 ma(1) -0.33
TropicOcean ar(1) 0.87 ma(1) -0.09 ma(2) 0.20
NPoleLand ma(12) -0.11
NPoleOcean ar(1) 0.57 ma(1) -0.77
SPoleLand ar(1) 0.32
SPoleOcean ar(1) 0.56 ma(1) -0.29
4. Once these processes were estimated, the residuals easily passed tests for being white noise, suggesting no strong evidence of any further autocorrelation.
Some questions/observations: What kinds of theoretical process could explain these estimated patterns in the temperature series? It is interesting that 4 of the 5 “Land” series have long memory (South Pole is the exception) suggesting perhaps lingering effects of changes over land? On the other hand, the 2 series with largest fractional differencing parameters are NHExtTropicOcean and NPoleOcean, reflecting perhaps lasting ocean current effects? NPoleLand has an annual seasonal, but none of the other series do. While TropicOcean does not display long memory, it has the most complicated short-run dynamics.
The question is: why does the global temperature of the troposphere drop during La Nina?
Ren
The question is: why does the global temperature of the troposphere drop during La Nina?
All layers of the atmosphere depend on heating from the sun.
La Nia is associated with cooler global climate.
La Nia and El Nio are basically just a partial measurement of the amount of energy reaching the earth.
Why complicare matters any more than that.
Albedo causes with clouds might be another factor I guess..
angech…”Ren
The question is: why does the global temperature of the troposphere drop during La Nina?
All layers of the atmosphere depend on heating from the sun”.
***
Agreed, but given that fact, why does this climate sub-system mediate global temperatures and climates? I think that is what ren is asking.
DA
Agreed, but given that fact, why does this climate sub-system mediate global temperatures and climates? I think that is what ren is asking.
–
I did not read his comment that way.
I think he was replying to Peter Hartley who may have made that assumption in one of his 4 points?
–
Peter uses the term retained memory which I dislike as it imposes thought on mechanical processes which does not exist.
Secondly he claims his 10 areas are mutually exclusive, which they are not.
Thirdly he chooses to use that show recurrent patterns to suggest that this is what you have termed a mediating factor.
Those who seek patterns can assuredly find them.
What significance they have is in the eye of the pattern seeker.
Seek man made Climate change and you will assuredly find it .
Seek to prove it does not exist and you will find what you want also.
Agreed, but given that fact, why does this climate sub-system mediate global temperatures and climates?
Maybe this NOAA El Nino blog post is helpful:
https://www.climate.gov/news-features/blogs/where-does-global-warming-go-during-la-ni%C3%B1a-0
Peter uses the term retained memory which I dislike as it imposes thought on mechanical processes which does not exist.
He’s using statistical model terminology, “long term memory”. The statistics are a sort of black box approach, looking at the resulting time series without explicitly making any a priori assumptions about the system that generated the time series. I think what he’s seeing is in fact coupling from El Nino/La Nina intervals that bias the statistics for a few years. There is a hysteresis in El Nino dynamics that is arguably a sort of memory.
Secondly he claims his 10 areas are mutually exclusive, which they are not.
As I read the doc file, “tropics (-20 to 20)” is distinct, but “extratropics (20 to 85)” includes “npole (60 to 85)”.
Thirdly he chooses to use that show recurrent patterns to suggest that this is what you have termed a mediating factor.
Not sure I follow this point. His statistical analysis has found auto correlation over a period of several months and over a period of a few years. The first is just that monthly samples are not statistically independent, that is, last month’s temperature is a reasonably good guess for next month’s temperature and out several months. The second, as above, is mostly coupled to the El Nino phases that is pseudo cyclical over a few years.
Mark B
Thank you for that review of the points mentioned
Thanks for the info, but… you ‘speak’ to us as if you would expect the average poster on this blog to be familiar with statistical evaluations.
For example, I like to process e.g. temperature data (surface thermometers, remote sensing by sats, radiosondes).
But I lack any statistical knowledge – apart from trivial stuff like linear estimates, quadratic/cubic fits, HQLP filters and the like.
Some deeper explanations of what you did, and what you expect at the end (‘Some questions/observations’) would be welcome.
Explain how exactly you use all this processing to get all your forecast perfectly backwards ???
“HQLP filters”
You don’t use HQLP filters in your work.
“In other words, the series are not integrated”
???? “not integrated” ????
In other words, you are talking rubbish.
s,
Another possibility is that you are just another stupid SkyDragon troll, trying to look intelligent and authoritative.
Others can decide for themselves.
Have you found an explanation for the GHE cooling the Earth for four and a half billion years or so, or do you believe that the Earth has actually become hotter as a result of your mythical GHE.
You are not really adept at supporting your cultist SkyDragon fanaticism, are you?
My my my.
You are easily triggered.
Get out of the wrong side of bed today?
s,
Another possibility is that you are just another stupid SkyDragon troll, trying to look intelligent and authoritative.
Others can decide for themselves.
Have you found an explanation for the GHE cooling the Earth for four and a half billion years or so, or do you believe that the Earth has actually become hotter as a result of your mythical GHE.
You are not really adept at supporting your cultist SkyDragon fanaticism, are you?
1. What is, to start somewhere, to be understood under
‘In other words, the series are not integrated‘ ?
2. You write:
” Since CO2 in the atmosphere is integrated… ”
What does this mean?
” … this alone throws doubt on the hypothesis that CO2 drives Lower Troposphere temperatures in any simple way. ”
Is this a wonder? Until now, what a I have read about CO2’s estimated action is that it starts above the Tropopause, a level above which H2O seems to be nearly absent.
Thus your analysis should include the three remaining atmospheric layers (Mid Troposphere, TropoPause, Lower Stratosphere). Right?
Here is the root, including the original data in 2.5 degree grid form:
https://www.nsstc.uah.edu/data/msu/v6.0/
Bunny,
You wrote –
“Until now, what a I have read about CO2s estimated action is that it starts above the Tropopause, a level above which H2O seems to be nearly absent.”
Rubbish. You can’t even describe “CO2s estimated action”, can you? You are a gullible wee sauerkraut, aren’t you?
I suppose you are going to claim that four and a half billion years or so of the Earth cooling is due to “CO2s estimated action”! Or do you think it was due to a GHE which you can’t describe either?
Keep those graphs and dissections of the past up to date, even if it means you have to revise everything continuously. Have you considered just buying a crystal ball, or learning how to read the entrails of dead animals?
Just as effective at predicting the future, and you can probably use the time you save to learn about physics or whatever interests you.
Hellooooom again, you blathering stalker!
Do you have something to say?
No?
Ah yes, Flynnson is just urging to say something irrelevant.
And invokes the ‘freedom of speech’ to endlessly disturb others and to insult them.
Bunny,
You wrote
Until now, what a I have read about CO2s estimated action is that it starts above the Tropopause, a level above which H2O seems to be nearly absent.
Rubbish. You cant even describe CO2s estimated action, can you? You are a gullible wee sauerkraut, arent you?
I suppose you are going to claim that four and a half billion years or so of the Earth cooling is due to CO2s estimated action! Or do you think it was due to a GHE which you cant describe either?
Keep those graphs and dissections of the past up to date, even if it means you have to revise everything continuously. Have you considered just buying a crystal ball, or learning how to read the entrails of dead animals?
Just as effective at predicting the future, and you can probably use the time you save to learn about physics or whatever interests you.
” 3. Five series showed evidence of short-run autoregressive dynamics:
TropicLand ar(1) 0.79 ma(1) -0.33
TropicOcean ar(1) 0.87 ma(1) -0.09 ma(2) 0.20
NPoleLand ma(12) -0.11
NPoleOcean ar(1) 0.57 ma(1) -0.77
SPoleLand ar(1) 0.32
SPoleOcean ar(1) 0.56 ma(1) -0.29 ”
Maybe you discuss such points with e.g. Dr Nick Stokes on his moyhu blog?
https://moyhu.blogspot.com/
Peter Hartley, when there is no answer, one is left with a mindless attack. It is clear that anomalies are very unstable, especially on the continents. Just look at North America and Australia. The anomalies in the Arctic are so high that the ice is increasing.
https://i.ibb.co/7gxjdgW/r00-Northern-Hemisphere-ts-4km.png
https://earth.nullschool.net/#current/chem/surface/level/overlay=co2sc/equirectangular/loc=8.600,51.360
ren
” The anomalies in the Arctic are so high that the ice is increasing. ”
How far is this sentence from utter nonsense?
What the heck do high deviations from the mean of a reference period have to do with increasing ice?
Bindidon
Why so much CO2 over Germany?
Sorry.
https://i.ibb.co/B3xrLgW/Zrzut-ekranu-2022-12-12-001040.png
Why don’t you show the original picture with a scale explaining what the different colors exactly mean?
It’s always and always the same problem.
And in this we agree.
https://i.ibb.co/0V150XN/Zrzut-ekranu-2022-12-12-084947.png
I apologize. I found these results and wanted to note them down and report them to get comments, I expected from other time series experts. I thought others would just ignore them. However, I agree it was rude to post them on a public site without explanation.
peter hartley….please feel welcome to contribute and be sure to ignore major idiots like studentb, whom I refer to as stupidb.
Peter Hartley
A very good contribution from your side would be e.g. to show us what happens with UAH’s monthly LT time series when you process them using sophisticated statistical tools eliminating anything which shouldn’t be present in them.
What is the result?
Are the changes restricted to small corrections along the time series?
Do their linear estimates change upon such processing?
Or does rather the standard error – as in Kevin Cowtan’s trend computer when the trend period becomes smaller?
http://www.ysbl.york.ac.uk/~cowtan/applets/trend/trend.html
*
What I miss in such trend computers and viewers (WoodForTrees and Nick Stokes’ included) is the possibility to use then with own data, e.g. temperature series they don’t support, or even tide gauge data coming from the PSMSL corner, etc etc.
“peter hartley.please feel welcome to contribute and be sure to ignore ”
Tee hee!
Gordon simultaneously sucks up to Mr. Hartley, puts down others, and acts as if he perfectly well understands all the posted statistical jargon that wasn’t defined.
What kinds of theoretical process could explain these estimated patterns in the temperature series?
This is an analysis of global temperature, but the same process could be applied regionally:
https://iopscience.iop.org/article/10.1088/1748-9326/6/4/044022
La Nina is very stable.
http://www.bom.gov.au/archive/oceanography/ocean_anals/IDYOC007/IDYOC007.202212.gif
Brilliant!
La Nina has been with us for nearly 3 years and you have just noticed it is “very stable”.
What an insight!
Next, I expect you will be telling us that weather is very variable.
The surface of the western equatorial Pacific is still cool.
https://www.tropicaltidbits.com/analysis/ocean/nino4.png
What do you say if La Nina doesn’t end in the spring of 2023?
I say nothing.
There is no need to state the bleeding obvious.
Everybody can see that La Nina is still here and that the “western equatorial Pacific is still cool”.
Imagine if I woke up each morning and posted:
“The sun has just risen in the east”.
Please desist with your inane observations.
s,
You wrote –
“Please desist with your inane observations.”
Why should he? Would you accede to a pleading request from an idiot who can’t even describe the GHE, but believes in it anyway? Don’t you support freedom of speech?
By the way, weather is very variable – and unpredictable, whether you like it or not. Hence climate, being the average of historical weather observations, is also unpredictable. Once again, whether you like it or not.
The IPCC agrees, and has stated that it is not possible to predict future climate states. Someone in the IPCC had a rare moment where reality intruded into the collective IPCC fantasy.
You need to work a lot harder if you are trying to be annoying. It’s hard to feel annoyed if you are laughing at the stupidity of an amateur troll.
More effort needed.
I don’t know how some people can cope with caring for dementia patients. The endless repetition must take enormous patience.
s,
You wrote
Please desist with your inane observations.
Why should he? Would you accede to a pleading request from an idiot who cant even describe the GHE, but believes in it anyway? Dont you support freedom of speech?
By the way, weather is very variable and unpredictable, whether you like it or not. Hence climate, being the average of historical weather observations, is also unpredictable. Once again, whether you like it or not.
The IPCC agrees, and has stated that it is not possible to predict future climate states. Someone in the IPCC had a rare moment where reality intruded into the collective IPCC fantasy.
You need to work a lot harder if you are trying to be annoying. Its hard to feel annoyed if you are laughing at the stupidity of an amateur troll.
More effort needed.
stupidb…”Imagine if I woke up each morning and posted:
The sun has just risen in the east”.
***
That’s about the level of your intelligence, thinking the Sun rises every morning.
“some people can cope with caring for dementia patients.”
Because they themselves are dementia patients. Swenson, for example, has posted the same red herring about the Earth cooling hundreds of times. He should be aware by now that it has no point.
A possible answer
” Speak of the devil and the devil shows up. “
Thanks.
Next thing you know Ren will be predicting fourth La Nina
If solar activity continues to jump strongly, La Nina will continue.
https://i.ibb.co/0Gh30Ts/onlinequery.gif
If there’s only 4 we’ll be lucky. The way things are going we could be headed for a Little Ice Age, 21st Century style. Of course the alarmists will portray it as having been predicted by the models.
ren…ignore the idiot. I call him stupidb for a reason.
stupidb…”La Nina has been with us for nearly 3 years and you have just noticed it is very stable.
What an insight!”
***
Your stupidity gets deeper every day. Amazing!!!
Snowfall is approaching London. This is not the end of snowfall in England.
https://i.ibb.co/1bkcZW8/Zrzut-ekranu-2022-12-12-002306.png
I have just finished dinner.
The sun must be about to set.
stupidb…take your idiotic comments elsewhere.
Come on, Gordo.
After you.
Little Willy, please stop trolling.
In the morning, the sun will rise in the east.
The sun is very hot.
But, the sun will set again tomorrow.
Winter will be cold.
Summer will be hot.
s,
If you consider rarely above -40 C to be “hot”, you are right.
–December 11, 2022
ABOUT TIME, IF TRUE: US scientists reportedly make fusion energy breakthrough. The Financial Times today reported three separate sources confirmed a recent experiment at the federal Lawrence Livermore National Laboratory in California yielded successful results. The experiment reportedly produced a net gain in energy produced for the first time since observations began back in the 1950s. The Financial Times said the fusion reaction, produced about 2.5 megajoules of energy, which was about 120 per cent of the 2.1 megajoules of energy in the lasers, the people with knowledge of the results said, adding that the data was still being analysed. The US department of energy told the news outlet it will announce major scientific breakthrough at the Lawrence Livermore National Laboratory on Tuesday.
Heres the (paywalled) FT story.
Posted at 10:35 pm by Glenn Reynolds–
https://instapundit.com/
gb…”US scientists reportedly make fusion energy breakthrough”.
***
Just another PR announcement to get more funding.
gbaikie
I think we all should calm down upon such ‘success’.
1. 2 Mj is a little over… 0.5 kWh, i.e. 0.0000000005 TWh.
A modern nuclear power plant like the French EPR has a capacity of 1.65 GW and produces about 10 TWh per year at a (generously stated) load factor of 0.75.
2. Due to cross-sectional problems, the only isotope mix we currently can think about is D+T.
While deuterium is free available (about 25,000 Gt exist on Earth), tritium isn’t at all (a best 5 kg worldwide above the oceans), and hence must be bred using lithium (hum hummh !!!) and beryllium blankets in fission reactors, to be processed exactly as Pu239, which once was thought to be a wonderful 4G transformation of the fertile but non-fissile U238, a byproduct of the U235 enrichment.
The next problem is that tritium is probably the most volatile material on Earth; no one knows how to store it, since it can escape out of even the densest steel-zirconium alloys.
Tokamak was born around 1958…
I can wait until Tuesday for announcement.
Scott says it real:
https://www.youtube.com/watch?v=QcxG7L1uCII
But he had extra sleep, so he is overly optimistic.
Practical useable fusion energy comes from the sun for a reason.
Space provides the perfect containment field for such violent locally destructible energy.
Like an acid strong enough to dissolve any container true fusion energy at any scale larger than 2 atoms will incinerate and obliterate any holding field.
Hence certain observations.
There is an extremely small amount, limiting amount (LA) of fusionable material which will obliterate any holding mechanism capable of being built by humans as the temperature of any sustainable process is too hot for any material to survive
The energy needed to produce and contain any fusion I s any orders of magnitude greater than any useful energy able to be produced
Either that, or no one has a clue how the Sun works.
They have completed an experiment that physically demonstrates it is possible to do. Still a very long way from applied implementation, with several significant hurdles to overcome. But it is a significant step forward.
Japanese company’s lander rockets toward moon with UAE rover
A Tokyo company aimed for the moon with its own private lander Sunday, blasting off atop a SpaceX rocket with the United Arab Emirates’ first lunar rover and a toylike robot from Japan that’s designed to roll around up there in the gray dust.
It will take nearly five months for the lander and its experiments to reach the moon.
The company ispace designed its craft to use minimal fuel to save money and leave more room for cargo. So it’s taking a slow, low-energy path to the moon, flying 1 million miles (1.6 million kilometers) from Earth before looping back and intersecting with the moon by the end of April.
https://phys.org/news/2022-12-japanese-startup-historic-moon-mission.html
Link from: https://instapundit.com/
The rovers are not going to lunar polar region, though the flashlight orbiter will look for ice in polar region by using lasers.
This was related to Google Xprize, which wanted small and cheap lunar missions [offered 20 million prize]. The idea of prizes is not to pay
for things, but give incentive to do things. And it gave incentive for many attempts and some have been successful in terms helping things get to be launched, but one can argue does more than that.
I think governments should be more prize type stuff, the Brits starting doing this centuries ago. Anyhow later ispace missions are going to lunar polar region as are others which beginning can traced back to the Google Xprize.
I think X prizes should given for climate model type stuff.
norman …”Your [Christos] claim Earths atmosphere is very thin is based upon what? It is thick enough to support heavy passenger jets in flight?”
***
Come on, Normie, let your consciousness expand a little. Christos has made it clear on several occasions that he is talking about the thickness of the altitude wrt the diameter of the Earth.
Gordon Robertson
That is a poor choice of defining “thin” atmosphere. Venus thickness is similar to Earth’s yet it is considered very dense. Not sure he is using good thinking with that metric.
So then I guess Venus, Mars and Earth all have very “thin” atmospheres based upon that definition but what is the value of that explanation. Venus atmosphere 90 times denser than Earth’s yet it is only 60 miles high.
https://en.wikipedia.org/wiki/Atmosphere_of_Venus
Basically that way of defining a “thin” atmosphere is meaningless. Can you do better or will you just ignore it?
norman…I had no quarrel with the article till they got stupid and started talking about a runaway greenhouse effect. You’d think after admitting the surface temperature is 450C+, they would clue in that a greenhouse effect could never heat the surface to that temperature.
Considering a surface temperature about 30 times that of Earth, how would you explain the temperature and the predominantly CO2 atmosphere?
If you look at a real greenhouse here on Earth, the interior is heated by solar energy, not CO2. In fact, CO2 has nothing to do with real greenhouse warming. You could remove the trivial 0.04% that is CO2 and the greenhouse would warm fine.
I would suggest the heat at the surface is coming from some process within the planet.
Currently, there will be faster ice growth in the Greenland Sea.
http://polarportal.dk/fileadmin/polarportal/sea/CICE_map_thick_LA_EN_20221211.png
Currently, I am drinking a cup of water.
Currently, I am thinking how tragic it would be to get dementia.
studentb, please stop trolling.
swenson…”studentb,
Presumably, you agree with the following utter nonsense from NASA…”
***
Unfortunately, as you know, NASA is saddled with NASA GISS, their incompetent climate division. Even more unfortunate is the notion that stupidb would understand any of that.
“I think that is what ren is asking.”
Admit it, the poor guy knows SFA and has SFB.
ren has infinitely more intelligence than you. You’re a dumbass troll.
Currently, the stock market is down.
But, it may rise with the next sun spot maximum.
On the other hand, the moon is in the seventh house.
Jupiter trines with Mars tho.
studentb, Little Willy, please stop trolling.
wonky wee willard…re connection between Met Office and U. of East Anglia….
tinyurl.com/53872k98
“Had-CRUT3 is a gridded dataset of global historical surface temperature anomalies. Data are available for each month since January 1850, on a 5 degree grid. The dataset is a collaborative product of the Met Office Hadley Centre and the Climatic Research Unit at the University of East Anglia.
sorry …wrong URL
tinyurl.com/2zjdmhjw
not posting for some reason…
https://tinyurl.com/53872k98
seems if you don’t include https it won’t load.
Come on, Gordo.
The Hadley Centre of the UK Met Office.
The Climatic Research Unit (CRU) of the University of East Anglia.
Two different institutions, like I said.
You are not very good at this.
Come on, Gordo.
We all know about Had-Crut.
You did not?
Little Willy, please stop trolling.
Arctic sea ice extent as of December 10, 2022. It’s not even winter and the entire Arctic Ocean is choked with ice.
https://tinyurl.com/mrxw5r3h
The following link show the ice thickness which ranges from 2.5 metres to 3.5 metres thick off the Canadian north shore to 1.0 to 2.0 metres elsewhere. Winter has not even started yet. Ice won’t reach its thickest extent till February or so.
http://polarportal.dk/en/sea-ice-and-icebergs/sea-ice-thickness-and-volume/
Methinks the demise of Arctic sea ice is somewhat exaggerated, little or no Sun to melt it.
It states on the following link that the Sun is down all day as of December 12th. It’s the same all through winter and the map doesn’t even extend to the North Pole.
Climate alarmists begone!!!
“Ice wont reach its thickest extent till February or so.”
That occurs in March almost every year.
“Climate alarmists begone!!!”
As you’re talking about weather, I doubt they’ll even show up.
Some people are sooo incredibly ignorant that they don’t understand how (sea) ice melts.
They really, really think the Sun is the origin of the process.
But… as mentioned sooo often, ice melts from the bottom, and that’s due to the water below it being a bit too warm.
Ignorants begone!!!
Bindidon, why is “the water below it being a bit too warm?”
“The ice cover in the Arctic grows throughout the winter, before peaking in March. Melting picks up pace during the spring as the sun gets stronger, and in September the extent of the ice cover is typically only around one third of its winter maximum.”
More simply, It’s the Sun, stupid.
So in your version of reality the long term decrease in minimum Arctic sea ice extent is because the sunlight is getting stronger.
Have you told Eben?
Oh Entropic Man… be careful!
I wouldn’t wonder if Clint R would suddenly tell you that the sea ice decrease in the Arctic was kinda remnant of the Modern Maximum 60 years ago :- )
Oh look, Clint R’s next ball-on-a-string.
He must be even more ignorant than I thought.
The sun’s power decreases from the tropics to the poles as the square of the cosine of the angle of latitude: at 75 degrees latitude this is less than 7%.
Again, Clint R: it’s the Sun, of course, as it is our only power supply. But… not in the Arctic.
It’s the water warmed by the Sun way, way, away from the Poles, stupid!
“It’s the water warmed by the Sun way, way, away from the Poles”
But now you acknowledge that the Sun warms the water that melts the ice. So what if it has a way to go before it does so?
What warms the water?
See above, Linsley Hood, and next time think before writing.
So you’re saying the Sun doesn’t directly warm the water at the poles?
Blinny claims that warm water melts the ice but somehow does not think the Sun warms the water first.
Bindidon
You may want to back of your position a bit. It is not correct.
Here:
https://education.nationalgeographic.org/resource/solstice-solar-radiation
In the summer the artic receives more solar energy than the equator (the sun shines 24 hours, no night).
“According to CERES, the amount of solar energy received at the North Pole is 30% higher during the summer solstice than the amount of solar energy received at the Equator.”
Also:
https://www.ucdavis.edu/climate/definitions/arctic-sea-ice#:~:text=In%20the%20summer%2C%20the%20ice,size%20of%20the%20winter%20maximum.
“In the summer, the ice will melt due to warmer temperatures and longer exposure to the sun. During the summer, when sea ice will reach its thinnest by mid-September, the area covered by ice is about half the size of the winter maximum.”
It is clear from the evidence that the solar input does directly melt ice. It does absorb solar IR very well and will also absorb visible light.
I would not say the evidence supports your claim although in parts of the Arctic you would have a valid point when ocean currents from warmer water melt the fringe ice. The bulk of Arctic ice melt is from the Sun in summer months and would not be from warmer water moving in from somewhere, this only takes place at the edges of the sea ice.
binny…”In the summer the artic receives more solar energy than the equator (the sun shines 24 hours, no night)”.
***
There’s that word energy being abused again. They make it sound like the temperature in the Arctic in summer is higher than in the Tropics. So, you can go to the Mackenzie River delta, on the Arctic Ocean, and get a good tan.
I recall being in Fiji once, waiting for a plane to arrive, and I decided to work on my tan. Within 5 minutes I was getting burnt skin. I had a good tan already and that 5 minutes put a red tinge on it.
There is nowhere in the Arctic that will happen. Nor will you feel an intensity from the Sun as you get in Fiji. And that was in their Spring.
Gordon Robertson
Again you display complete ignorance of science. In this case Chemistry. Why not learn something instead of giving us your incorrect opinions. You are not a genius at all and actually seem very ignorant (no knowledge of subject material).
There is a great deal of energy that is required to change ice from solid to liquid (heat of fusion)
Here read this an learn something.
http://www.kentchemistry.com/links/Energy/HeatFusion.htm
Contrast to water heat capacity.
https://bio.libretexts.org/Bookshelves/Introductory_and_General_Biology/Book%3A_General_Biology_(Boundless)/02%3A_The_Chemical_Foundation_of_Life/2.14%3A_Water_-_High_Heat_Capacity#:~:text=Water%20has%20the%20highest%20specific,one%20calorie%2C%20or%204.184%20Joules.
The same amount of energy to melt on gram of ice would raise water temperature 80 C.
Gordon Robertson
You are ignora
Gordon Robertson
You also are ignorant of physics. The Arctic will have a less intense Sun than Equator noon (Watts) but will deliver more overall joules to the surface than Equator. You are a clueless poster. Know nothing and spew ideas from crackpots like Gary Novak.
I really do not understand why you think rational experimentally based physics is wrong and the crackpots who make up stuff with no logic, experiment or validation are right. Why is this the state of your thinking? Because of how you learned the way current flows? All this because of this thing? That is a sad reason to reject all science and cling to crackpot made up ideas.
1. Anderson
” So youre saying the Sun doesnt directly warm the water at the poles? ”
NO.
It does, that is evident.
But… how much in comparison to the Tropics?
I repeat what you do not seem to have understood:
” The suns power decreases from the tropics to the poles as the square of the cosine of the angle of latitude: at 75 degrees latitude this is less than 7%. ”
*
2. Norman
You have misunderstood and hence misrepresent what CERES means.
They are talking about the amount of RECEIVED AND REFLECTED sunlight, and NOT about the amount of energy available for MELTING.
” In the June solstice, darkness dominates the south, while the north is now the location receiving and reflecting the most sunlight. ”
And of course, Norman: the reply to Anderson is valid 4u2!
*
3. Linsley Hood
” Blinny claims that warm water melts the ice but somehow does not think the Sun warms the water first. ”
As usual: brainless nonsense.
Read correctly what I wrote, Blindsley Hood!
*
4. Thus I repeat: Sun warms the oceans, but it does that very CERTAINLY a lot more outside of the Arctic than inside of it!
Is that so difficult to grasp, peopleszzz?
In 2023, look for Republicans to blame Democrats for not making them do the right thing, and scientists for not convincing them that their Fox News echo chamber was toxic.
From a weekend interview:
Mitt Romney: “A price on carbon with border adjustment taxes, that’s the only thing that has an impact.”
Interviewer: “But hasn’t your party rejected that over and over again?”
Romney then proceeds to blame the Democrats for not overcoming obstinate Republican resistance to climate action.
https://youtu.be/7vzIEzqpK7U
Romney is from another planet. Calling him a Republican is just plain weird.
Did you see any carbon taxes issued by the Feds during Trump’s tenure? They were going after NOAA for corrupt science and they ignored the Paris Accords.
TM, It looks like you linked the wrong video, hopefully I’ve got it correct here:
https://youtu.be/ZtDLGVvK5bA?t=3288
I think Romney is correct in that a carbon tax is the best way to approach this problem. It’s pretty much the econ 101 textbook approach to externalized costs, it can be implemented independently by any nation, and it lets market economics downstream do it’s magic.
He’s also correct in saying (essentially) the Republicans are never going to back such a tax and will campaign against the issue if and when the Democrats put it on the table. To be fair the Democrats couldn’t have gotten that through the current Senate either.
Mark B, yes I linked to the wrong clip.
This is the correct link: https://youtu.be/hzyQcpUqivc Romney on a carbon tax
Thanks.
A major snowstorm is developing over France.
https://i.ibb.co/xFdbfNm/Zrzut-ekranu-2022-12-12-170836.png
Pressure over Iceland 1045 hPa.
Pressure over Greenland 1048 hPa.
Johnnys in the basement mixing up the medicine
Im on the pavement thinking about the government
Keep a clean nose
Watch the plain clothes
You dont need a weatherman
To know which way the wind blows
What? A ‘major’ snowstorm developing over Southwest France?
Show us the exact source, ren, and not your anonymous, non-binding copy.
Before you choke on those cherry pits:
South America Heat Wave: Chile so far had quite escaped the extreme heat of its neighbouring countries; not yesterday. Temperatures rose to record levels in the Central regions with 40.5C at San Felipe in the Valparaiso Region, 0.3C from the Chilean record high for December.
After a cool November, the past few days were very hot in Sub Saharan Africa, in particular in Senegal where many stations rose above 40C for several days in a row. Matam and Diourbel shot as high as 41.5C, not far from the December records.
Mandora in Western Australia yesterday rose to a scorching 48.5C.
Seasonality eh!
With these issues eternally settled:
1) A ball on a string is not rotating on its own axis.
2) Rotation about an external axis, with no rotation about an internal axis, is motion like the "moon on the left".
3) The moon issue is not resolved by reference frames.
4) "Revolution/orbit" is defined as "rotation about an external axis".
5) The green plate(s) cannot warm/insulate the blue plate.
6) The non-GHGs are the planetary insulators, not the GHGs.
There’s nothing really left to debate. We need a new subject!
All the issues raised thread after thread by (Sky, Moon) Dragon cranks have been settled in the Moon Dragon Cranks Honeypot:
https://tinyurl.com/Dragon-cranks-honeypot
Patent pending.
"All the issues raised thread after thread by (Sky, Moon) Dragon cranks have been settled in the Moon Dragon Cranks Honeypot…"
…in the "Non-Spinners" favour.
Oh nein! Jetzt geht das schon wieder los…
So gut:
https://youtu.be/N9uuMXsvxqY
Belle trouvaille, merci.
Let’s see…
…Bindidon agrees with 1), so he should agree with 2). I’m fairly sure he also agrees with 3). Guessing he might have a problem with 4) – 6)? Who knows. He probably won’t say.
(1), (2), (3) correct but do NOT contribute in any valuable way to the discussion.
(4), (5), (6): all plain wrong.
Just as I thought. Thanks for confirming, Bindidon.
Invest in a coal mine on the moon.
When the inevitable lunar colony opens they will need a source of energy.
The moon has no atmosphere so no fear of causing lunar warming when the coal is burned.
ken…with no lunar atmosphere how will the coal burn?
The fantasy of burning coal is as absurd as moon rotating around the earth.
“1) A ball on a string is not rotating on its own axis”
It rotates about the axis of rotation.
…which does not go through the ball itself.
Only because the ball at the outer end of the string is the lesser of the 2 (at least) masses that makes the combination.
rlh…the axis of rotation is the other end of the string.
Correct. But if there was a (large) sphere there….
"Correct."
So, all waffling aside, you agree on 1).
Grand Solar Minimum Update
https://www.cbc.ca/news/canada/nova-scotia/climate-crisis-means-more-extreme-weather-ns-predicts-1.6675182
Little Willy, please stop trolling.
Long-term measurements of tide gauges and recent satellite data show that global sea level is rising, with the best estimate of the rate of global-average rise over the last decade being 3.6 mm per year (0.14 inches per year).
Exactly, studentb
I had much work & fun when processing the PSMSL & SONEL data sets, and comparing my little layman’s job to what professionals did.
https://drive.google.com/file/d/1_s5eKMqX-SlQIx28pTgbF2lTAcPgvIz5/view
Especially funny was the Skeptics’ eternal claim that while sat altimetry showed for 1993-2020 near 3 mm/yr, the gauges allegedly never showed much more than a half of it.
All these ignoramuses of course compared the gauge trends over their full lifetime (for a few of them over 100 years, oh Noes) to less than 30 sat altimetry years.
But computing the gauges’ trends for the same period as for the altimetry of course gave quite different results: the average of all gauge trends was even a tiny bit higher.
*
How was that possible? The best way to prove it was to compute, for example from 1900-2015 to 1995-2015, all consecutive 5-year distant trends for the gauge average:
1900-2015: 1.4 0.01 (mm/year)
1905-2015: 1.4 0.01
1910-2015: 1.4 0.01
1915-2015: 1.4 0.01
1920-2015: 1.5 0.01
1925-2015: 1.5 0.01
1930-2015: 1.5 0.01
1935-2015: 1.5 0.01
1940-2015: 1.5 0.01
1945-2015: 1.5 0.01
1950-2015: 1.6 0.01
1955-2015: 1.7 0.02
1960-2015: 1.8 0.02
1965-2015: 2.0 0.02
1970-2015: 2.1 0.02
1975-2015: 2.2 0.02
1980-2015: 2.4 0.02
1985-2015: 2.5 0.02
1990-2015: 2.7 0.02
1995-2015: 2.9 0.03
https://drive.google.com/file/d/1e_fuJ5FZDbf1Uv3m3YbwLfM35qq9oQre/view
Apart from the slightly outlier NOAA, all evaluations have shown nearly the same trend change over time.
*
Last not least, a comparison of the best PSMSL evaluation (Sönke Dangendorf & al.) to the sat altimetry by NOAA shows how good they fit together:
https://drive.google.com/file/d/1nsa7ByOgWKtwkh05FrdP970ZS3_LeK2Q/view
The blog’s crazy scanner once more has let disappear all the ‘±’ by ‘magic’. My bad.
Russian media reporting that Putin has canceled the traditional December press conference he has been holding for years. In addition, the traditional message to the parliament did not pass, and the New Year’s reception in the Kremlin was also cancelled.
This is a big deal, there was a New Year’s address, even when the USSR was collapsing on Dec 31, 1990.
Santa has canceled all flights to Russia because Putin’s been a bad boy.
A cynic might ask, everything is cancelled this year because the special operation is going according to plan then?
Cynism? Not sure.
I’d rather say like the Frogs:
” C’est le commencement de la fin. ”
Coz never and never would the Putin guy have decided to cancel such events by his own. He must have ‘been decided’ to do.
Shitler steals Christmas.
Putin is a prince compared to the new Ukrainian dictator, Zelensky. Democracy kaput in the Ukraine.
One more time, Robertson shows his love to Fascist dictators like Putin, who proves since at least 20 years to be the best successor of Hitler and Stalin.
Since Gorbachev’s presidency, there has been no democracy in Russia.
I wouldn’t wonder when Putin’s cock sucker Robertson was paid by Russians to spew on this blog the same lies as those endlessly propagated by German and French Neo-Nazis.
Gordon clearly visits propagandistic websites, like Russia Today, or the subsidiaries that disseminate their nonsense.
Grand Solar Minimum Update:
https://www.nbcnews.com/science/environment/firmageddon-researchers-find-11-million-acres-dead-trees-oregon-rcna59671
Little Willy, please stop trolling.
Snowstorm in the south of France on Dec. 12, ahead of the astronomical winter.
https://i.ibb.co/C6mcmQY/Zrzut-ekranu-2022-12-12-213100.png
Parts of Australia are forecast to reach temperatures as high as 48 degrees Celsius ahead of the astronomical summer as large parts of the north bake under some of the hottest temperatures in the world.
The sun will be very hot.
I must remember to wear a hat.
studentb is having a climate shittattack in here
” Snowstorm in the south of France on Dec. 12 ”
Now ren is on his 1,000 % exaggeration highway with an intellectual Lamborghini Aventador, and is going full throttle.
*
From Météo France we read (translated using Google’s tool):
” “In the night of Monday to Tuesday and Tuesday morning, a disturbance goes up on the Center-East region then the Saône-et-Loire by the south-west.
When arriving on the very cold air which currently concerns us, the precipitation will be snowy until the plain at first (ONE TO FIVE CENTIMETERS), then it will turn into rain, with the thaw, first on the south of Auvergne and the Rhône valley during the night”. ”
That’s ren’s megasnowstorm…
Expect traffic disruptions, like after a snowfall in London.
Your predictions are worthless.
https://i.ibb.co/p1PY4s4/Zrzut-ekranu-2022-12-13-001816.png
Get ready for more snow in Germany as a lower low from the east finds its way over Scandinavia.
https://i.ibb.co/HNWfkvY/Zrzut-ekranu-2022-12-13-002510.png
What is a “lower low”?
Trading wordology:
https://www.contracts-for-difference.com/course/higher-highs-and-lower-lows.html
Sorry.
The low from over Latvia will be over Sweden. Will it be enough?
https://i.ibb.co/Kq9fstg/Zrzut-ekranu-2022-12-13-065525.png
Temperature anomalies in Australia. December will be below average.
https://i.ibb.co/VpC1WxN/gfs-T2ma-aus-2.png
Total rainfall forecast in Australia for 8 days.
https://i.ibb.co/LY9tpRW/pme1to8.png
There will be lightning in Petauke, Zambia on Sunday.
https://www.weatheronline.co.uk/Zambia.htm
The average temperature anomaly for Australia in December will be above average.
studentb, please stop trolling.
My blog today –
NSW cold records tumbling in mild start Australian summer
http://www.warwickhughes.com/blog/?p=7044
is trying to keep up with cold records falling in SE Australia.
Hoping to keep it updated – there must be many more NSW records broken on the 15Dec. BoM must be deliberately not reporting these.
More Vincent Gray (Gordon Robertsons authority) sanctimonious bullcrap…
[VINCENT GRAY, NEW ZEALAND] It is the mean global anomaly that has increased, It is not correct to assume that this implies an increase in mean global temperature because this cannot be measured.
[IPCC] Rejected. The global anomaly increase can only occur if the global mean temperature has also increased. To state otherwise cannot, logically, be correct.
[VINCENT GRAY, NEW ZEALAND] Return to the mere opinions of the self-styled experts.
[IPCC] Rejected. Comment is ad hominem with no science to act upon.
[VINCENT GRAY, NEW ZEALAND] Your model does not allow you to know that much of the absorbed energy from solar radiation in the daytime is removed by convection and radiated at higher levels in the atmosphere. The temperature at the surface during the daytime and its variabilty is thus unknown. You are also not allowed to know that everything is different at night when there is no radfiation from the sun and the radiation from the earth declines, except the atmosphere can return part of the ordinary and latent heat it absorbed during the day.
[IPCC] It is not clear how the reviewer’s comments relate to the material presented in the section under consideration.
[VINCENT GRAY, NEW ZEALAND] The revisions accentuate the absurdity of the whole exercise. The “uncertainties” are actually ranges of the extent to which all of the figures vary with changed circumstances and the so-called “balance” is admittedly bogus. All of the figures involve calculations usiing non linear equations and skewed distribution curves, Even the supposedly constant solar radiation and TOA radiation received are constantly varying.
[IPCC] We cannot follow the reviewer’s argumentation here.
TM,
Does any of your comment help to explain why the only known effect of the GHE is not to have interfered with the cooling of the Earths surface from the molten state – over the last four and a half billion years or so?
The IPCC seems to share the common SkyDragon silliness of rejecting fact, and replacing it with “expert” opinion.
Even the IPCC cannot actually describe the GHE, resorting to nonsense such as this –
“Greenhouse gases are gases in the atmosphere such as water vapour, carbon dioxide, methane and nitrous oxide that can absorb infrared radiation, trapping heat in the atmosphere. This greenhouse effect means that emissions of greenhouse gases due to human activity cause global warming.”
What garbage! Try and “trap” some heat – it cant be done! Wait for nighttime, maybe that will help? These IPCC idiots just reject the fact that the Earth has cooled over the last four and a half billion years or so.
Im not challenging your SkyDragon cultist beliefs. I just dont want to pay for them. As Thomas Jefferson said ‘”t does me no injury for my neighbor to say there are twenty gods or no god. It neither picks my pocket, nor breaks my leg.”
Unfortunately, SkyDragons want to do both – nutters like Bindidon threatens unbelievers with physical violence and death, and ignorant SkyDragon politicians are picking my pocket as fast as they can.
Go out on the street, if you wish, waving your “Stop Climate Change” placard. Do me a favour, and dont whine if I run you over because you are trying to interfere with my right to use the roads which I am legally entitled to do. Go and demonstrate in your own backyard, or rent a sports ground. Trust me, Ill do my best to stay out of your hair.
Dimwitted SkyDragon cultist.
[laughing at delusional SkyDragon]
Classic old man shouting at the clouds.
Go Sweno!
Blah, blah, blah. Are you off your meds again?
You wrote
I am confused.
Then you followed up your silliness with –
I am unclear why we should get ready for snow in Germany!
Grow a pair, laddie! Take a teaspoon of cement and harden up! Make up your own mind although SkyDragon cultists dont have a sterling reputation for independent thought.
Do you believe the Earth has increased in temperature over the last four and a half billion years or so? Or do you believe in some sort of magical Greenhouse Effect that leapt into existence a little while ago? SkyDragon cultists cant even tell you when their magical global warming started can they?
So sad.
Keep believing.
TM,
You wrote –
“Blah, blah, blah. Are you off your meds again?”
Is that really the best you can do? I’ll give you something to deny, and I typed it really, really, slowly – just for you!
“Does any of your comment help to explain why the only known effect of the GHE is not to have interfered with the cooling of the Earths surface from the molten state over the last four and a half billion years or so?
The IPCC seems to share the common SkyDragon silliness of rejecting fact, and replacing it with expert opinion.
Even the IPCC cannot actually describe the GHE, resorting to nonsense such as this
Greenhouse gases are gases in the atmosphere such as water vapour, carbon dioxide, methane and nitrous oxide that can absorb infrared radiation, trapping heat in the atmosphere. This greenhouse effect means that emissions of greenhouse gases due to human activity cause global warming.
What garbage! Try and trap some heat it cant be done! Wait for nighttime, maybe that will help? These IPCC idiots just reject the fact that the Earth has cooled over the last four and a half billion years or so.
Im not challenging your SkyDragon cultist beliefs. I just dont want to pay for them. As Thomas Jefferson said t does me no injury for my neighbor to say there are twenty gods or no god. It neither picks my pocket, nor breaks my leg.
Unfortunately, SkyDragons want to do both nutters like Bindidon threatens unbelievers with physical violence and death, and ignorant SkyDragon politicians are picking my pocket as fast as they can.
Go out on the street, if you wish, waving your Stop Climate Change placard. Do me a favour, and dont whine if I run you over because you are trying to interfere with my right to use the roads which I am legally entitled to do. Go and demonstrate in your own backyard, or rent a sports ground. Trust me, Ill do my best to stay out of your hair.
Dimwitted SkyDragon cultist.”
[laughing at delusional SkyDragon]
your silliness is duly noted.
“Try and trap some heat it cant be done!”
Surely you want to re-think that statement?
Yell louder. There’s a good boy.
TM,
You wrote
Blah, blah, blah. Are you off your meds again?
Is that really the best you can do? Ill give you something to deny, and I typed it really, really, slowly just for you!
Does any of your comment help to explain why the only known effect of the GHE is not to have interfered with the cooling of the Earths surface from the molten state over the last four and a half billion years or so?
The IPCC seems to share the common SkyDragon silliness of rejecting fact, and replacing it with expert opinion.
Even the IPCC cannot actually describe the GHE, resorting to nonsense such as this
Greenhouse gases are gases in the atmosphere such as water vapour, carbon dioxide, methane and nitrous oxide that can absorb infrared radiation, trapping heat in the atmosphere. This greenhouse effect means that emissions of greenhouse gases due to human activity cause global warming.
What garbage! Try and trap some heat it cant be done! Wait for nighttime, maybe that will help? These IPCC idiots just reject the fact that the Earth has cooled over the last four and a half billion years or so.
Im not challenging your SkyDragon cultist beliefs. I just dont want to pay for them. As Thomas Jefferson said t does me no injury for my neighbor to say there are twenty gods or no god. It neither picks my pocket, nor breaks my leg.
Unfortunately, SkyDragons want to do both nutters like Bindidon threatens unbelievers with physical violence and death, and ignorant SkyDragon politicians are picking my pocket as fast as they can.
Go out on the street, if you wish, waving your Stop Climate Change placard. Do me a favour, and dont whine if I run you over because you are trying to interfere with my right to use the roads which I am legally entitled to do. Go and demonstrate in your own backyard, or rent a sports ground. Trust me, Ill do my best to stay out of your hair.
Dimwitted SkyDragon cultist.
[laughing at delusional SkyDragon]
What are you braying about, Mike?
Weird Wee Willy,
You wrote –
“What are you braying about, Mike?”
I am sorry that you suffer from a lack of comprehension, so I will repeat – just for you –
TM,
You wrote
Blah, blah, blah. Are you off your meds again?
Is that really the best you can do? Ill give you something to deny, and I typed it really, really, slowly just for you!
Does any of your comment help to explain why the only known effect of the GHE is not to have interfered with the cooling of the Earths surface from the molten state over the last four and a half billion years or so?
The IPCC seems to share the common SkyDragon silliness of rejecting fact, and replacing it with expert opinion.
Even the IPCC cannot actually describe the GHE, resorting to nonsense such as this
Greenhouse gases are gases in the atmosphere such as water vapour, carbon dioxide, methane and nitrous oxide that can absorb infrared radiation, trapping heat in the atmosphere. This greenhouse effect means that emissions of greenhouse gases due to human activity cause global warming.
What garbage! Try and trap some heat it cant be done! Wait for nighttime, maybe that will help? These IPCC idiots just reject the fact that the Earth has cooled over the last four and a half billion years or so.
Im not challenging your SkyDragon cultist beliefs. I just dont want to pay for them. As Thomas Jefferson said t does me no injury for my neighbor to say there are twenty gods or no god. It neither picks my pocket, nor breaks my leg.
Unfortunately, SkyDragons want to do both nutters like Bindidon threatens unbelievers with physical violence and death, and ignorant SkyDragon politicians are picking my pocket as fast as they can.
Go out on the street, if you wish, waving your Stop Climate Change placard. Do me a favour, and dont whine if I run you over because you are trying to interfere with my right to use the roads which I am legally entitled to do. Go and demonstrate in your own backyard, or rent a sports ground. Trust me, Ill do my best to stay out of your hair.
Dimwitted SkyDragon cultist.
[laughing at delusional SkyDragon]
Mike, Mike,
Just *what* are you braying about?
Little Willy, please stop trolling.
Dr Vincent Gray died in 2018.
“Get ready for more snow in Germany”
What should I do?
Should I get on a flight and leave Germany?
But I am not in Germany.
Should I get on a flight and go to Germany?
Maybe for the skiing?
I am confused.
s,
You wrote –
“I am confused.”
Grow a pair, laddie! Take a teaspoon of cement and harden up! Make up your own mind – although SkyDragon cultists dont have a sterling reputation for independent thought.
Do you believe the Earth has increased in temperature over the last four and a half billion years or so? Or do you believe in some sort of magical “Greenhouse Effect” that leapt into existence a little while ago? SkyDragon cultists cant even tell you when their magical “global warming” started can they?
So sad.
Keep believing.
I have met quite a few obsessive/(on the spectrum) personalities in my time. The common theme is that no matter what the topic of conversation, they always digress in order to prattle on about their personal favourite topic.
For example:
“I am unclear why we should get ready for snow in Germany”
Response:
“Do you believe the Earth has increased in temperature over the last four and a half billion years or so?”
You wrote
I am confused.
Then you followed up your silliness with
I am unclear why we should get ready for snow in Germany!
Grow a pair, laddie! Take a teaspoon of cement and harden up! Make up your own mind although SkyDragon cultists dont have a sterling reputation for independent thought.
Do you believe the Earth has increased in temperature over the last four and a half billion years or so? Or do you believe in some sort of magical Greenhouse Effect that leapt into existence a little while ago? SkyDragon cultists cant even tell you when their magical global warming started can they?
So sad.
Keep believing.
Louder! The clouds can’t hear you.
You wrote
I am confused.
Then you followed up your silliness with
I am unclear why we should get ready for snow in Germany!
Grow a pair, laddie! Take a teaspoon of cement and harden up! Make up your own mind although SkyDragon cultists dont have a sterling reputation for independent thought.
Do you believe the Earth has increased in temperature over the last four and a half billion years or so? Or do you believe in some sort of magical Greenhouse Effect that leapt into existence a little while ago? SkyDragon cultists cant even tell you when their magical global warming started can they?
So sad.
Keep believing.
Swenny
The Earths temp has warmed and cooled many times in 4 half billion years what is your point?
Galaxie,
You wrote –
“Swenny
The Earths temp has warmed and cooled many times in 4 half billion years what is your point?”
No “point”, just stating an inconvenient fact for SkyDragons. The Earth has cooled, over the longest possible period known.
No cherry-picking, by the way. Are you denying that the Earth has cooled, or are you just being silly, and claiming that the mysterious indescribable GHE has alternately cooled and heated the planet – using some form of magic, perhaps?
Only joking, of course – nobody has managed to describe the GHE. A most unusual effect, which appears to have had no effect at all. The Earth has cooled – whether you like it or not!
Maybe you could try another stupid attempt to avoid facing reality.
Off you go.
Louder!
s,
Thank you for the opportunity. You may not be the only who needs repetition to comprehend .
Again –
Galaxie,
You wrote
Swenny
The Earths temp has warmed and cooled many times in 4 half billion years what is your point?
No point, just stating an inconvenient fact for SkyDragons. The Earth has cooled, over the longest possible period known.
No cherry-picking, by the way. Are you denying that the Earth has cooled, or are you just being silly, and claiming that the mysterious indescribable GHE has alternately cooled and heated the planet using some form of magic, perhaps?
Only joking, of course nobody has managed to describe the GHE. A most unusual effect, which appears to have had no effect at all. The Earth has cooled whether you like it or not!
Maybe you could try another stupid attempt to avoid facing reality.
Off you go.
“just stating an inconvenient fact for SkyDragons. The Earth has cooled, over the longest possible period known.”
If you mean that the fact the globe has been different temperatures in the past, and is now cooler than when the surface was 1000C at conception, then, no, none of this is at all inconvenient to the understanding of AGW. Except in your level 2 mind, of course.
Mysterious Patterns Span The Arabian Desert, And We May Finally Know Why
12 December 2022
By Carly Cassella
“The deserts of Saudi Arabia were once the lush and fertile homes of ancient people more than 8,000 years ago.
Today, the remnants of these long-gone communities still stand frozen, or rather, desiccated in time.
Right across the Arabian peninsula, from Jordan to Saudi Arabia to Syria, Armenia, Kazakhstan, and Iraq, researchers have identified thousands of huge stone structures from the sky.
The V-shaped arrangements were first noticed by British air force pilots in the 1920s, and for more than a century, experts have debated why they were built.
Recent satellite images and drone surveys in the ʿUwayriḍ desert of Saudi Arabia now support a commonly held suspicion.
Today, archaeologists working on these ancient stone patterns, sometimes known as ‘desert kites’, think they were most likely used as mass hunting traps.”
https://www.sciencealert.com/mysterious-patterns-span-the-arabian-desert-and-we-may-finally-know-why
Linked from: https://instapundit.com/
Mysterious Patterns Span The Arabian Desert, And We May Finally Know Why
12 December 2022
By Carly Cassella
“The deserts of Saudi Arabia were once the lush and fertile homes of ancient people more than 8,000 years ago.
Today, the remnants of these long-gone communities still stand frozen, or rather, desiccated in time.
Right across the Arabian peninsula, from Jordan to Saudi Arabia to Syria, Armenia, Kazakhstan, and Iraq, researchers have identified thousands of huge stone structures from the sky.
The V-shaped arrangements were first noticed by British air force pilots in the 1920s, and for more than a century, experts have debated why they were built.
Recent satellite images and drone surveys in the ʿUwayriḍ desert of Saudi Arabia now support a commonly held suspicion.
Today, archaeologists working on these ancient stone patterns, sometimes known as ‘desert kites’, think they were most likely used as mass hunting traps.”
https://tinyurl.com/2p9anhty
Linked from: https://instapundit.com/
Can you see the superdeveloping La Nňa yet ???
https://i.postimg.cc/dQzBxTr7/mei-lifecycle-11.png
You can see.
https://www.tropicaltidbits.com/analysis/ocean/nino34.png
Silly Swenson at 9:27 PM
Says: “Try and trap some heat it can’t be done!”
Please explain.
maguff…trying quoting Swenson in the context he is writing. He is quoting the alarmist POV that heat can be trapped by CO2. Of course, I would not expect you to understand anything that deep.
TM,
You wrote –
“Silly Swenson at 9:27 PM
Says: “Try and trap some heat it cant be done!”
Please explain.”
To those who understand, no explanation is necessary. To those who dont, no explanation is possible.
If you dont understand what the IPCC says, dont blame me.
Dimwit.
Silly Swenson,
“Try and trap some heat it can’t be done!”
Try thinking about this. On a cold night go outside naked, you’ll be freezing, no?. Then, when you get arrested, the nice police officer will throw a blanket over you and you’ll immediately begin to feel warmer.
Your body was generating the same amount of heat before and after your arrest but the blanket, by trapping heat, has warmed you.
Now do you understand how heat can be trapped?
TM, you’re confused by the terminology. The thermodynamic definition of heat involves transfer. That’s what Swenson is referring to. If there is no transfer, there is no “heat”.
Your cult gets confused because you don’t understand the science. The blanket is NOT “heating” anything. Thermal energy transfer from the body heats the blanket.
Pup,
Mike Flynn admitted he had no point.
What about you?
Clint R
The blanket is slowing down the heat transfer allowing the skin temperature to increase as it gains energy from the body’s internal energy generating process. The term “Heat Trap” was just a simplified attempt to communicate with nonscientific general public.
Sorry Norman, but your cult’s effort was/is to pervert reality. But, realizing that the atmosphere is like a blanket destroys the GHE nonsense. Radiative gases act as holes in the blanket, cooling Earth.
Maybe you haven’t noticed, but reality always wins.
(Got any valid technical references for all your nonsense yet?)
Clint R
Not a cult but real science. GHG will cool parts of the atmosphere they WILL not act to cool the solar heated surface. They will greatly reduce the radiation heat loss keeping the surface warmer. With your lack of any scientific education I won’t expect you to understand any of it.
It’s a cult, Norman. And you’ve swallowed everything they spew.
You even make up stuff you can’t support, as you deny valid science like the ball-on-a-string.
“Radiative gases act as holes in the blanket, cooling Earth.”
Well you got that back-asswards. Without radiative gases the surface would lose its heat directly to space, much quicker than having to pass that heat through radiative gases up through the atmosphere.
It is this blanket of radiative gases that slow the escape of heat radiated from the surface up to space, thereby keeping the surface warmer than if there were no atmosphere.
The blanket-on-a-person analogy is quite apt. The blanket/atmosphere doesn’t provide energy by itself, but moderates the flow of heat.
Any continuously heated object that has its rate of thermal heat loss slowed must therefore get hotter. This is as basic as it gets.
TM,
You are confused. Insulation does not “trap heat”, nor prevent an object from cooling.
SkyDragon idiots try to talk about overcoats, blankets, and the like, because they are faced with the fact that the Earth has cooled for four and a half billion years, and don’t want to accept reality.
Wrap your blanket around a corpse, and it will cool – possibly more slowly, but slow cooling is not “getting hotter”.
Try and “trap” (or even sillier “accumulate” some heat). Can’t be done. That’s why the Earth has cooled for four and a half billion years or so. As Fourier pointed out, during the night, all the heat of the day is lost, plus a little of the Earth’s internal heat. Rather like a just deceased human – it cools, no matter how many coats or blankets you wrap around it.
So carry on trying to avoid facing the reality that nobody can even describe this mythical GHE without getting laughed at. Try another zinger. It will be equally as defective as the damp squib you just offered up for my amusement.
Check this out:
Heat Loss in Humans Covered with Co*t*t*on Hospital Blankets
Bob Dylan wrote some lyrics just for you:
“Idiot wind
Blowing every time you move your mouth
Blowing down the back roads headin’ south
Idiot wind
Blowing every time you move your teeth
You’re an idiot, babe
It’s a wonder that you still know how to breathe”
TM,
Your source says that the living bodies lost heat at a rate of around 81 W (joules per second). Insulation in the form of blankets reduced the rate of loss, but did not stop it. The lost heat was of course replenished by the body converting carbohydrates to heat internally. Once the body ceases to live, the temperature will fall – regardless of how many blankets it is wrapped in!
You are confused. Insulation does not trap heat, nor prevent an object from cooling.
SkyDragon idiots try to talk about overcoats, blankets, and the like, because they are faced with the fact that the Earth has cooled for four and a half billion years, and dont want to accept reality.
Wrap your blanket around a corpse, and it will cool possibly more slowly, but slow cooling is not getting hotter.
Try and trap (or even sillier accumulate some heat). Cant be done. Thats why the Earth has cooled for four and a half billion years or so. As Fourier pointed out, during the night, all the heat of the day is lost, plus a little of the Earths internal heat. Rather like a just deceased human it cools, no matter how many coats or blankets you wrap around it.
So carry on trying to avoid facing the reality that nobody can even describe this mythical GHE without getting laughed at. Try another zinger. It will be equally as defective as the damp squib you just offered up for my amusement.
Swenson,
your unhinged rant is duly noted.
“It’s a wonder that you still know how to breathe”
Swenson has the strange idea that the Earth is like an unheated corpse. Does he really think the Earths surface isn’t being heated by the sun, while also being insulated by the atmosphere?
Tyndall explained this to him very clearly, and he became mute.
He shows zero interest in facts that disrupt his clueless narrative.
Tyson, please stop trolling.
“Wrap your blanket around a corpse”
Bad analogy. The Earth receives continuous energy, so the proper analogy is with a blanket and a live body generating its own heat.
But you’ve done this silly diversion countless times and had the flaw explained nearly as many, so it’s likely you simply don’t have the wherewithal to understand the topic.
I prefer that analysis to one in which you actually do know better and are being mendacious.
Frost in England, France and Germany.
https://i.ibb.co/BcYwCgz/Zrzut-ekranu-2022-12-13-064556.png
Clouds in the sky, England, France and Germany.
Indeed. Here in southern England, we’ve had a week of very low temps (for early December). It reminds me of the weather we used to get here in the 1960s and 1970s.
I have just been reading Valentina Zharkova’s predictions of solar cycle 26 and future cooling. If she’s right, what we are getting now will be normal for six months of the year!
Well, the blockage of the stratospheric polar vortex over eastern Siberia will get even stronger.
https://i.ibb.co/RHh7BjV/gfs-t70-nh-f240-1.png
barry…better bust out the ice skates, during the Little Ice Age the Thames was frozen over.
Will there be a white Christmas in New York this year? Yes, it will be white.
https://i.ibb.co/7pzVKsT/Zrzut-ekranu-2022-12-13-072320.png
One for you Ren
A heatwave has hit parts of central South America this week, coinciding with the Immaculate Conception pilgrimage attended by Catholic worshippers.
A sizzling 43.5C was recorded in Santiago del Estero, Argentina, on Wednesday, a day before the holy day. Weather warnings for extreme heat were issued by the Argentinian and the Paraguayan national meteorological services this week, as temperatures rose 10C above the seasonal norm for several days in many places.
A cold front from over the chilly Pacific will bring relief to Argentina.
https://i.ibb.co/xCVgRvK/Zrzut-ekranu-2022-12-13-125849.png
Will Santa Claus visit you this year?
Santa Claws only visits to collect the souls of children who sold them for toys that too often lie broken and forgotten in less than a week.
ren is only interested in reporting about (mostly alleged) cold.
I’ll help him!
Friday & Sunday at night in Northeast Germoney: -10 C !!!!
Woooaaah.
*
Here is December 2010 for a nice comparison (coming from a Super UHI airport station, yes yes):
https://www.wetteronline.de/?pcid=pc_rueckblick_data&pid=p_rueckblick_diagram&sid=StationHistory&diagram=true&iid=10385&gid=10385&month=01&year=2011&metparaid=TNLD&period=4&ireq=true
Dec/Jan/Feb 2010/11 was our last real winter :- )
binny…”ren is only interested in reporting about (mostly alleged) cold.
Ill help him!”
***
You’ll help him??? Advice from you will do much more harm than good. However, Ren has the intelligence to see that.
Are you saying the Earth Temperature has never been cooler in the past?
C02 is just one of the long term active drivers of Earth temperature. There are other factors involved Solar irradiance , aerosols.
Reply to Swenson in wrong place apparently .
Swenson is saying that the core and mantle have never been cooler. For some reason, he is adamant that this important when considering the temperature swings of the atmosphere. No one but Swenson knows why this should be germane.
Galaxie500,
You wrote –
“Are you saying the Earth Temperature has never been cooler in the past?”
Presumably, you are trying for a gotcha, because you are a delusional SkyDragon.
But because you wish to appear ignorant and deluded, I will answer your attempted zinger – no, the “Earth Temperature” has never been cooler in the past. All matter above absolute zero emits radiation. This loss of radiation results in a reduction in the “degree of hotness”, which is what thermometers measure.
You are probably guilty of listening to people who have never measured the “Earth Temperature” in the present, let alone in the past.
If you believe otherwise, you might like to try to support your assertion, by describing the change in physical laws which allow an object to spontaneously heat and then cool again. Presumably, you believe this happens repeatedly, at random, and due to some magical process know only to idiots such as yourself.
You will notice that even your fellow nitwit, Tim Folkerts, believes “the atmosphere” magically gets cooler or warmer as a whole – depending one how Tim feels at the time. At least he agrees that the core and mantle cool continuously. He is probably ignorant enough to believe that the ocean is heated throughout by the Sun, and “stores” or “traps” heat, by some magical process.
Maybe he believes that liquids and gas follow different unwritten laws of thermodynamics – once again, known only to idiot SkyDragons.
Off you go now, try and come up wth a better gotcha. Your current attempt has failed miserably.
Even more rain in New South Wales.
https://i.ibb.co/wRv4rqw/Zrzut-ekranu-2022-12-13-124909.png
Another strong planetary wave in the upper stratosphere in the polar vortex belt.
https://www.cpc.ncep.noaa.gov/products/stratosphere/strat-trop/gif_files/time_pres_WAVE1_MEAN_OND_NH_2022.png
https://www.cpc.ncep.noaa.gov/products/stratosphere/strat-trop/gif_files/time_pres_TEMP_MEAN_OND_NH_2022.png
It seems the northern Polar Vortex is delayed in forming. Since a PV requires energy, I suspect this long La Niña is the culprit.
Grand Solar Minimum Update
https://gizmodo.com/food-prices-climate-change-inflation-drought-1849883609
Coming up next – the Earth was once molten.
Not that the current (and continuing) La Nina has anything to do with Arizona climate/rainfall. https://www.weather.gov/fgz/ElLa
We still have La Niňa ?
Bindiclown forecasting said it would be gone by last April
👽
Hi babbling Edog!
You manifestly have so few to say that you can’t refrain from repeating the dumbest things again and again and again.
Thank you for confirming today that you keep at the same mental level as all these people you yourself permanently laugh about because they endlessly repeat their ball-on-a-string idiocies.
https://www.drroyspencer.com/2022/05/uah-global-temperature-update-for-april-2022-0-26-deg-c/#comment-1279572
Or this one
https://www.drroyspencer.com/2022/02/uah-global-temperature-update-for-january-2022-0-03-deg-c/#comment-1167955
👽
[BINNY] We will see how this develops.
[EBOY] You were wrong. AHA!
It seemsd necessary to repeat what I wrote above because you didn’t understand it.
” Thank you for confirming today that you keep at the same mental level as all these people you yourself permanently laugh about because they endlessly repeat their ball-on-a-string idiocies. ”
*
You perfectly know that I have agreed being wrong in my estimate of predictions made by others.
Thus: what is the sense of endlessly reposting my wrong comments?
Are you an onanist?
It’s not about being wrong on forecast, anybody can be wrong on that, it’s about how you go about it, and you being the worst creep and a piece of scum on this board.
In deep denial, Willard, chortles…”…crop production has been greatly affected this year by a drought forming from reduced water levels in the Colorado River”.
***
Willard fails to grasp that La Ninas produce droughts in that part of the US while causing flooding in the Pacific NW. Climate change is a silly myth, as used.
Come on, Gordo.
First, these are not my words.
Second, the Colorado River has its source in the Rockies,
Think.
Little Willy, please stop trolling.
I don’t think the Moon Dragon Cranks dispute that, as we orbit the Sun, the orientation of Earth’s axis remains the same with respect to the fixed stars, and this is the reason we have seasons.
However, they dispute the fact that if the Moon did not rotate on its axis, it would also keep a fixed orientation with respect to the fixed stars as it orbits Earth. And observers on Earth would see all its sides.
Is this
a) unfathomable pinheadery from Moon Dragon Cranks, or
b) willful ignorance.
Wrong again, TM.
You don’t understand “orbital motion, without axial rotation”. That’s the advantage of the ball-on-a-string. It’s easy to understand. One side of the ball always faces the inside of its orbit, just like Moon.
Tyson, the ‘debate’ comes down to choosing between two variations on the definition for “orbital motion”. Either:
A) “orbital motion” imposes specific constraints on the orientation of the orbiting object.
b) “orbital motion” does NOT impose any constraints on the orientation of the orbiting body.
Option (A) is like a ball on a string. Like a horse bolted to a merry-go-round platform. Like a truck driving along an oval track. It is indeed a simple and intuitive option. The motion along the path in all cases necessarily causes a specific orientation of the object relative to the ‘fixed stars’ — the point where the string attaches must be toward the center; the nose of the horse must be forward; the hood of the truck must be forward. There is only “rotation about the object’s axis” when there is some ADDITIONAL change in orientation relative to the string / platform /car.
Option (B) say there is “rotation about the object’s axis” whenever there is a change in orientation relative to the ‘the fixed stars’. So if the MGR horse always has its nose pointing north, it is not rotating. Period. This is the ‘simplicity’ of option (B).
As with any ‘debate’ in science, the answer is found in experiment; in actual data about the actual universe.
One huge problem with Option (A) is that it fails to describe the orientation of actual moons or planets in actual elliptical orbits. Option (A) is NOT ‘just like the moon’.
A ball swung in a circle at varying speeds will change orientation relative the the ‘fixed stars at a varying rate. A truck driving around an elliptical track at varying speeds to model Kepler’s Laws will change orientation relative the the ‘fixed stars’ at a varying rate.
But the actual moon changes orientation at a constant rate relative to the ‘fixed stars’. As predicted by Option (B).
Moon is Option (A), it always keeps one side facing the inside of its orbit. It is NOT rotating about its axis.
Fraudkerts attempts to pervert reality by mentioning Moon’s slightly elliptical orbit, which has NOTHING to do with axial rotation.
Once again you forget to cut the string, Pup:
https://tinyurl.com/cut-the-string
The Moon has no string.
Do the Pole Dance Experiment.
Tim Folkerts at 12:26 PM
I agree with you.
My point, though, is that the motion of the Earth’s axis is observable evidence of an orbit without rotation. Granted, on human timescales.
The Moon’s motion is observable evidence of an orbit with rotation.
Yet, Moon Dragon Cranks accept the former but deny the latter.
I need more evidence before I decide if they’re guilty of unfathomable pinheadery or willful ignorance.
So please, keep them talking.
TM, if you believe Earth is NOT rotating, but Moon is, there’s nothing anyone can do for you.
You’re a confirmed braindead cult idiot.
All wrong, Tim.
Both "Spinners" and "Non-Spinners" impose specific constraints on the orientation of the orbiting object, for their definition of "orbital motion".
For "Spinners", "orbital motion" is like the "moon on the right", which is motion in which one face of the orbiting object remains oriented towards some distant star, throughout. "Axial rotation" is then separate from this motion, in other words there needs to be an orientation change in addition to the "moon on the right" motion, for there to be axial rotation. You could think of the "moon on the right" motion as being "translation in a circle".
For "Non-Spinners", "orbital motion" is like the "moon on the left", which is motion in which one face of the orbiting object remains oriented towards the inside of the orbit, throughout. "Axial rotation" is then separate from this motion, in other words there needs to be an orientation change in addition to the "moon on the left" motion, for there to be axial rotation. You could think of the "moon on the left" motion as being "rotation about an external axis".
Now, when you look up definitions of "orbit", or "revolution", you will find many that simply say it is a path, or trajectory. These definitions support neither "Spinners" nor "Non-Spinners", since they specify nothing about orientation. However, you can find a few definitions that suggest "revolution/orbit" is a "rotation about an external axis". So that supports the "Non-Spinners". You can’t find any definitions that suggest "revolution/orbit" is "translation in a circle/ellipse". They do not use the word "translation" at all…so, no support for the "Spinners"…
…so, overall, the definition argument is settled in the "Non-Spinners" favour.
“Now, when you look up definitions …”
That is not how science is done. There could be 100’s of definitions with small or large differences in wording. They could be aimed at the public or experts. Support is not found in definitions or in pictures. Arguments are not settled by how many definitions you can find supporting a particular position.
The only interesting or important support is whether the definition agrees with how the universe works. While either model works find for perfectly circular orbits, only one works accurately for elliptical orbits.
No, definitions themselves never ‘settled’ anything.
Are you attempting more fraud, Fraudkerts?
It doesn’t matter if the orbit is circular or elliptical. If the same side of the object always faces the inside of the orbit, the object is NOT rotating.
Of course it matters that the orbit isn’t circular, Pup:
https://www.geogebra.org/m/mMN9Vpe3
Rotation preserves isometry.
That implies a circle.
Better luck next trolling time.
“If the same side of the object always faces the inside of the orbit, the object is NOT rotating.”
But the ‘same side’ of the moon does not always ‘face the inside’. We see slightly different sides of the moon. So by your own definition, the moon IS rotating == slightly back and forth each orbit. Why? How does your model explain this? What torque causes this rotation?
Wrong again, Fraudkerts.
The ‘same side’ of Moon always faces the inside of its orbit. What we see from Earth is due to libration, which is due to our slightly changing view as Moon travels its elliptical orbit. Moon is NOT moving “back and forth”. That’s your incorrect and invalid interpretation. You understand none of this.
“Moon is NOT moving ‘back and forth’.”
So you now realize that the Moon’s motion does not need to be described in an Earth-centric frame of reference.
Progress is slow but steady. Keep it up.
Yeah troll Nate, I hope I was clear enough that hopefully fraudkerts will get it. Progress has been slow with him. But, at least people are learning what a fraud he is.
Just like they’re learning what a troll you are.
Now, by losing the Earth-centric view, you should be able to see that the Moon is indeed rotating as it orbits.
But you might not be there yet.
Tim,
Is that why SkyDragons define “slow cooling” as “getting hotter”?
They definitely seem to think there is a significant difference between a “prediction” and a “projection” or “forecast”.
I seem to recollect that you argued that “warming” is completely different to “heating”, when I used one or the other in relation to a rise in temperature.
I agree with you about definitions, and add that the “science” is never “settled”, unlike some idiot at the helm of the IPCC at one time, who claimed that “the science is settled”!
What are you braying about, Mike?
Silly Wee Willy,
Your lack of comprehension is noted. I always try to help those less fortunate than myself, so maybe this will help you –
Tim,
Is that why SkyDragons define slow cooling as getting hotter?
They definitely seem to think there is a significant difference between a prediction and a projection or forecast.
I seem to recollect that you argued that warming is completely different to heating, when I used one or the other in relation to a rise in temperature.
I agree with you about definitions, and add that the science is never settled, unlike some idiot at the helm of the IPCC at one time, who claimed that the science is settled!
What are you braying about, Mike?
Let’s hope it’s not the same silly semantic arguments coming from your lot of Dragon cranks!
Silly Wee Willy,
Your lack of comprehension is noted. I always try to help those less fortunate than myself, so maybe this will help you
Tim,
Is that why SkyDragons define slow cooling as getting hotter?
They definitely seem to think there is a significant difference between a prediction and a projection or forecast.
I seem to recollect that you argued that warming is completely different to heating, when I used one or the other in relation to a rise in temperature.
I agree with you about definitions, and add that the science is never settled, unlike some idiot at the helm of the IPCC at one time, who claimed that the science is settled!
What are you braying about, Mike?
illy Wee Willy,
Your lack of comprehension is noted. I always try to help those less fortunate than myself, so maybe this will help you
Tim,
Is that why SkyDragons define slow cooling as getting hotter?
They definitely seem to think there is a significant difference between a prediction and a projection or forecast.
I seem to recollect that you argued that warming is completely different to heating, when I used one or the other in relation to a rise in temperature.
I agree with you about definitions, and add that the science is never settled, unlike some idiot at the helm of the IPCC at one time, who claimed that the science is settled!
What are *you* braying about, Mike?
Silly Wee Willy,
Your lack of comprehension is noted. I always try to help those less fortunate than myself, so maybe this will help you
Tim,
Is that why SkyDragons define slow cooling as getting hotter?
They definitely seem to think there is a significant difference between a prediction and a projection or forecast.
I seem to recollect that you argued that warming is completely different to heating, when I used one or the other in relation to a rise in temperature.
I agree with you about definitions, and add that the science is never settled, unlike some idiot at the helm of the IPCC at one time, who claimed that the science is settled!
What are you *braying* about, Mike?
What are you braying about, Mike?
Little Willy, please stop trolling.
“You cant find any definitions that suggest “revolution/orbit” is “translation in a circle/ellipse”. ”
Say what!?
“An orbit is a regular, repeating path … ” NASA Knows! (Grades 5-8)
“In celestial mechanics, an orbit is the curved trajectory of an object … ” wikipedia.
“a path described by one body in its revolution about another (as by the earth about the sun or by an electron about an atomic nucleus)” Merriam-Webster.
“The path of a celestial body or an artificial satellite as it revolves around another body due to their mutual gravitational attraction.” American Heritage Dictionary
“orbit, in astronomy, path of a body revolving around an attracting centre of mass, as a planet around the Sun or a satellite around a planet.” Britannica.
Every source I found says astronomical orbits are ‘paths’. The center of the satellite follows a curved line. None mentions ‘rotation about an external axis’.
The consensus is against you.
Tim, you could not find a single one mentioning translation in a circle/ellipse. You just, as I already said, found a bunch defining “orbit/revolution” as a path, or trajectory…in other words, not mentioning orientation, so not supporting either side of the argument. Both sides can agree that an orbiting body follows a path or trajectory around the body it is orbiting. That kind of goes without saying. What is missing is the orientation it has whilst following that path.
So, the “Spinners” need a definition that includes orientation just as much as the “Non-Spinners” do. When are you people going to get that? The “Spinners” orientation for “orbital motion” is like the “moon on the right”, where one side of the body remains oriented towards some distant star throughout the orbit. You could describe it as “translation in a circle/ellipse”. So you need to find a definition mentioning that. Good luck!
STRAWMAN ALERT.
An ORBIT is a path, a trajectory, ie a series of points, or positions in space.
The rotation of the body is not restricted by this definition!
So NO. Orbital motion doesnt need to be a pure Translation, since it allows for the body to rotate.
Thanks for alerting us to your straw man, troll Nate.
No one has said that translation prevents rotation. Earth does both, for example.
The strawman is the need for the concept of orbit to contain an orientation, Pup. Once we accept that celestial bodies spin, there is no need for that. Orbit, spin. Try it, it works.
Moon Dragon cranks ought to accept that a satellite in a 3:2 spin-lock still spins. Same for any ratio except 1:1. Readers might notice how special is your pleading.
Little Willy, it’s no strawman. Both "Spinners" and "Non-Spinners" have a concept of "orbital motion" than includes orientation…whether they understand that they do, or not! That’s proven by asking any "Spinner" a simple question:
How does an object that is orbiting, but not rotating on its own axis, remain oriented?
The answer to that question is the orientation involved in their concept of "orbital motion". Any "Spinner" will answer that the orbiting object will move with one side always oriented towards some distant star.
Gaslighting Graham still misses the concept of spin.
Oh well.
Not at all, Little Willy. See my response further down-thread.
Let readers decide if he succeeds in escaping the spin-orbit lock paradox Moon Dragon cranks are facing.
Yes, Little Willy. Let readers decide exactly how confused you are.
Orbit and rotation are not inevitably linked. Which is why we have planets that don’t rotate in the direction they orbit.
The definition and action of an orbit does not require the orientation of the orbiting object. That’s a separate matter. In celestial mechanics the calculations for orbit do not require rotation to estimate trajectory. It is incidental. It doesn’t matter if an object is rotating, or not rotating, or which direction the rotation is occurring. That will have no impact on its orbital trajectory.
“For “Spinners”, “orbital motion” is like the “moon on the right”, which is motion in which one face of the orbiting object remains oriented towards some distant star, throughout.”
Demonstrably False. Stop telling ‘Spinners’ what you want them to believe!
Earth’s motion is an example of what ‘orbital motion’ looks like, and it most certainly doesnt have one face oriented to a distant star!
That’s because ‘orbital motion’ means following an orbital path thru space WITHOUT a specified or rotation rate or orientation, other than the orientation of the rotational axis, tilted toward a fixed star throughout each orbit.
This observational fact of the axial tilt of the Moon is shamelessly dismissed by the ‘non-spinners’.
OK, so let’s just get one thing straight, in case anyone obnoxious gets themselves all "confused".
When I say "orbital motion", I of course am referring to orbital motion without axial rotation.
“When I say ‘orbital motion’, I of course am referring to orbital motion without axial rotation.”
The Earth and all other planets have various rotation rates yet are bodies in Orbital Motion.
Thus you find a need to SPECIFY a second parameter, rotation rate, when describing the motions to others.
The fact that you need to do that SHOULD tell you that this parameter IS OBVIOUSLY NOT ALREADY SPECIFIED in the definition of ORBIT or ORBITAL MOTION!
This should be quite easy to understand for anyone who is open minded.
Troll Nate, you forgot to alert us to your straw man.
Earth has both motions — orbiting and rotating.
Moon only has one motion — orbiting.
And of course the ball-on-a-string is an example of “orbital motion WITHOUT axial rotation”.
Your next straw man, please.
An orbit is a trajectory, Pup.
Rotation and translation are motions.
Do keep up.
“An orbit is a trajectory, Pup.”
Definitions where an orbit is said to be a path, or trajectory, don’t support the “Spinners” any more than they support the “Non-Spinners”, Little Willy. Both sides can agree that an orbiting body follows a path or trajectory around the body it is orbiting. That kind of goes without saying. What is missing is the orientation it has whilst following that path.
Gaslighting Graham misses the concept of spin.
Readers might wonder when he will find it.
Not at all, Little Willy. The thing about spin is, you have to make sure you are keeping it separate from the “orbital motion”. Kind of hard to do that, unless and until you have a fixed idea of what is “orbit without spin”.
To look at motion like the “moon on the left”, for instance, and be able to say “that is both orbiting and spinning”, you have to first establish that “orbit without spin” is motion like the “moon on the right”.
I don’t understand. If the Moon and the Earth are attached to opposite ends of the string, why does an observer on the Moon see the Earth rotating?
Gaslighting Graham still misses that we already have an explanation as to why the Moon is now in a 1:1 spin-orbit lock with the Earth.
Moon Dragon cranks still lack an explanation as to why the Moon would be the only celestial body that does not spin. In fact they still fail to acknowledge that all the other spin-lock ratios involve spin.
Tyson is onto something.
Poor Little Willy. Always confused. No, “Non-Spinners” see all “1:1 spin-orbit lock” bodies as not rotating on their own axes. So that is not just our moon. It is most moons in the solar system, and beyond.
As for Mercury, in its “3:2 spin-orbit lock”, yes, that is indeed rotating on its own axis. At a rate of half an axial rotation per orbit (“Spinners” see it as rotating 1.5 times per orbit, therefore “Non-Spinners” see it as rotating 0.5 times per orbit).
Readers might like to know how many celestial bodies Moon Dragon cranks claim are not spinning.
They might also note that Gaslighting Graham is compelled to hold the following absurdity:
1:2 lock? Spinning.
1:1 lock? Not spinning.
3:2 lock? Spinning.
A 1:1 spin-orbit lock is Very Special indeed in Moon Dragon cranks physics!
Moon has a 0:1 spin-orbit rate. Just like the ball-on-a-string has a 0:1 spin-orbit rate.
Reality wins over blah-blah, every time.
Anything in what “Spinners” think of as being a “1:1 spin-orbit lock” is not rotating on its own axis, according to “Non-Spinners”. That ought to be obvious to anyone that understands the debate. Little Willy proves his ignorance, time and again.
🤦
Little Willy, please stop trolling.
Very true, Tim. So simple only Gaslighting Graham could pretend to sincerely disbelieve that the Moon spins.
You might like:
https://tinyurl.com/tim-haz-three-pennies
"No, definitions themselves never ‘settled’ anything."
I said:
"…the definition argument is settled in the "Non-Spinners" favour."
I did not say:
"the moon issue is settled in the "Non-Spinners" favour by the definition argument."
There is an ongoing argument, related to the moon issue, about definitions, Tim. That argument is settled in the "Non-Spinners" favour. That’s what I meant. I did not say that "science is done by definitions", or that the definition argument settles the overall moon issue, or anything that you are accusing me of saying. As usual, Tim bashes his straw men.
Tyson,
I think it’s a bit of boat.
As I noted above:
“I have met quite a few obsessive/(on the spectrum) personalities in my time. The common theme is that no matter what the topic of conversation, they always digress in order to prattle on about their personal favourite topic.
For example:
I am unclear why we should get ready for snow in Germany
Response:
“You dont understand orbital motion, without axial rotation…”
OR
“How are you today?”
Response:
“A ball swung in a circle at varying speeds will change orientation relative the the fixed stars at a varying rate…”
We can see in these posts what can happen when a group of obsessives gets together. Boring, but somehow morbidly fascinating at the same time.
s,
You wrote –
“Boring, but somehow morbidly fascinating at the same time.”
You are perfectly free to feel as bored as you wish, and equally free to be morbidly fascinated. I assume you think that somebody cares for your inability to fill in your time to better effect. Out of more than seven billion people on the planet, can you name more than one who cares for your opinion?
You appear to be just another idiotic SkyDragon trying to appear intelligent and authoritative, and failing miserably.
Have you managed to find an explanation for the fact that the Earth has cooled over the past four and a half billion years or so, with the mythical GHE unable to prevent this cooling?
A rhetorical question, of course, because neither you nor any other witless SkyDragon can even describe the object of their cult worship – the GHE!
You might as well keep on being bored and morbidly fascinated. You haven’t got the brainpower to do anything else, have you?
For most people, having nothing of substance to say is reason enough to not post.
maguff…”…they [realists, aka non-spinners] dispute the fact that if the Moon did not rotate on its axis, it would also keep a fixed orientation with respect to the fixed stars as it orbits Earth. And observers on Earth would see all its sides”.
***
I don’t recall a non-spinner even addressing such a stupid claim. The truth is, the Moon does not rotate on it axis mainly because it has no rotational axis nor any angular momentum about such a fictitious axis.
The Moon does not keep a fixed orientation wrt the stars because it is orbiting the Earth while keeping the same face pointed at Earth. As it does so, it is lit by the Sun at various angles. Were it rotating on a local axis, we on Earth would see all sides of the Moon.
Come on, Gordo.
The silly GIF.
Is all about.
That counterfactual.
How many times must Gaslighting Graham repeat himself before you start paying attention?
This thread began with Tyson making it abundantly clear that “Spinners” see it as a “fact” that an object orbiting without rotating on its own axis would “keep a fixed orientation with respect to the fixed stars”.
Funny how there have been so many attempts from other “Spinners” to try to pretend otherwise, since then…there have been at least three of them trying to claim that orientation is not a part of how “Spinners” see “orbit without spin”.
…and yet, it obviously is…
Tyson made a case for the following alternative –
Either Moon Dragon cranks are ignoramuses or trolls.
He forgot one possibility – it could be boat.
Gaslighting Graham clearly shows that this possibility is quite plausible.
Tyson presented a false dichotomy, and Little Willy lapped it up.
[TYSON] Here is an alternative.
[W] Why not boat?
[GG] W is lapping the dichotomy!
🤦
It is not just “either of these two options, or both”. “Neither” is also an option.
Gaslighting Graham begs another question!
“Neither” is also an option. “Non-Spinners” are neither ignoramuses nor trolls, they are simply correct argument-winners who happen to be able to see through the programming that prevents “Spinners” from realising the truth.
Gaslighting Graham forgets a smol detail – there is another option only if the Moon Dragon crank Master Argument was coherent.
Is it?
I doubt it very much.
Little Willy, please stop trolling.
A major snowstorm is developing in the Midwest with winds of up to 60 km/h in gusts.
https://i.ibb.co/mNC1zrM/Zrzut-ekranu-2022-12-13-174116.png
The sun is rising in the east.
By human definition.
“in the Midwest”
“By human definition.”
Brilliant. Just a brilliant observation that illuminates the whole subject, really.
Is it even tornado season?
A line of storms moving across North Texas spawned at least two confirmed tornadoes early Tuesday morning, December 13.
Much of North Texas is currently under a tornado watch through 11 a.m. on Tuesday.
Tornado damage has been reported in parts of Palo Pinto County and Jack County where emergency responders have been dispatched to help with downed power lines and damaged barns.
The Dallas-Fort Worth Airport has cleared its “Shelter in Place” as of 9:05 a.m.
The risk of severe storms will move east throughout the day, with more tornadoes possible in the afternoon and evening in eastern Texas, Louisiana, and Mississippi. The National Weather Service advised residents to take cover, get to the lowest interior floor of a building, and avoid windows.
TYSON MCGUFFIN
December tornadoes take place in the deep South fueled by warmer Gulf water. Texas has had 189 tornadoes touch down in December over the period from 1950 to 2013 (average of 3 tornado touchdowns a year).
https://www.ustornadoes.com/2014/12/10/heres-where-tornadoes-typically-form-in-december-across-the-united-states/
Yes, agreed. Though a bit of a nitpick, Texas is not the South; Texas is where the West begins. But I digress.
What I found astounding about yesterday’s tornadic developments was the intensity.
Blizzard at I-80 and Sunol, Nebraska.
https://i.ibb.co/tZNKhw2/319680162-1192132648382569-7781649563727365236-n.jpg
It is hot in Zambia.
Is it not always hot in the tropics?
Is it not always cold in Nebraska?
studentb, please stop trolling.
Link:
https://gml.noaa.gov/webdata/tmp/surfrad_6395fb0472960.png
From the graph in the link there is measured about 300 W/m2 IR downward radiation at night.
Also the 255K refers to the 240 W/m2 outgoing IR radiation to outer space. And at night too.-
Thus we shall have at night from atmosphere:
300 + 240 = 540 W/m2
It is impossible!
–
https://www.cristos-vournas.com
” Thus we shall have at night from atmosphere:
300 + 240 = 540 W/m2
It is impossible! ”
What exactly do you mean?
*
You write dozens of pages when you try to explain your personal PHI view, but write no more than three lines when you doubt about something.
I think he saying when 300 watts is downwelling, also 300 watts is upwelling [going to outer space] and adding that to average 240 watts per square meter which going into space.
But would say there is on average of 40 watt going directly into space.
There therefore if said
300 + 40 = 340 watt
It is impossible!
We could discuss it.
I’m waiting for Vournas’ answer, and not for anything else.
Bindidon, there is not greenhouse effect on Earth’s surface.
–
Planets are not blackbodies.
–
Solar flux cannot be averaged.
–
Also there is the Planet Rotational Warming Phenomenon.
–
And, of course – you have mentioned it, the Φ -Factor – the Solar Irradiation Accepting Factor (the planet surface spherical shape and roughness coefficient).
–
https://www.cristos-vournas.com
Of course, Vournas.
1. All you doubt about (without proof) automatically doesn’t exist.
2. All you are convinced (without proof) automatically does very well.
That’s what I name ‘Pseudoskepticism’.
Yes, Bindidon, and I forgot mentioning:
–
Most importantly – the Stefan-Boltzmann emission law cannot be applied backwards!
The planet effective temperature is a mathematical abstraction!
–
https://www.cristos-vournas.com
“Bindidon, there is not greenhouse effect on Earths surface.”
If there is no greenhouse effect, explain the tropics.
What a greenhouse effect is, is a more uniform temperature.
The tropics has a more uniform temperature.
That CO2 causes Earth average temperature to be 33 C higher, is wrong.
That greenhouse gases cause Earth become hotter is wrong.
I would say there is not 1 greenhouse effect on Earth but two-
The atmosphere and the ocean.
And the most significant greenhouse effect is the ocean.
To some degree, the tropical ocean couldn’t heat the entire world, if
there isn’t a greenhouse effect.
The “more greenhouse effect, the more the tropical ocean heats the entire world.
What heats the polar region to the most is our cold ocean with an average temperature of about 3.5 C. If the ocean average temperature
was slightly warmer, say about 4 C, the ocean warms the polar region
a lot more.
A 5 C oceans means no polar sea ice in the winter which about a dramatic as it gets, or less difference of ocean is 6 C or warmer, but 6 C ocean means evenually, we aren’t in an Ice Age.
An Ocean of an average temperature of 10 C, probably means we in a greenhouse global climate. So not just not in ice age, but in the warmest climate state that Earth has ever had.
Though over the hundreds of millions of time, the Earth surface changes due to plate tectonic. So. different Earth would have different rules. Therefore, “probably” be in global greenhouse climate.
Since our world hasn’t changed much in last 30 million years and it’s likely our was 5 C and perhaps as warm as about 6 C, we can have pretty good idea of what Earth is like when the average temperature of entire ocean of 5 to 6 C.
There is significant thermal expansion of the ocean when it’s 5 to 6 C. And changes the world a bit.
It also means higher global water vapor, which means there far less deserts in the world.
It means, the sahara desert in grassland and forests and has higher average temperature. And it’s higher average temperature, increases global average temperature AND it warms regions around it.
Or if simply add trillions of tons of water to Sahara desert, it will green, and it have higher average temperature and it warm the rest of world.
But for Nature to green the Sahara Desert, Nature is also doing other greening of deserts. Or if just put water in Sahara desert that water might make the Arabian desert, green.
But when Nature greened the Sahara, it also greened the Arabian desert [and others]. Or you also say, Nature can add more water than human would add to Sahara. Humans might add just enough, Nature could/would add more.
It also seems it would cause more snow fall and more rain fall to Greenland- causing more of Ice sheet to flow into the ocean. And this also be the case with the Antarctica ice sheet- though not much rain
where most ice sheet is.
Given enough time, it cause the Greenland ice sheet to disappear- if you give it say 1000 years.
But it’s fantasy to imagine our ocean could warm to 5 C. Humans can’t do it, and for Earth’s geological activity to do it, would make the “show”- all about this enormous “end of world” type geological activity. Or it less huge, it would take thousands of years, so after centuries of hell, it start having some warming effect upon the ocean- and in meanwhile we left Planet Earth because it’s not nice anymore.
“Most importantly the Stefan-Boltzmann emission law cannot be applied backwards!
The planet effective temperature is a mathematical abstraction!”
Well, I could agree with this.
I don’t think CO2 gas causes, Earth to be 33 C warmer, or that the atmosphere with the CO2 causes 33 C.
But I don’t think many global warming cargo cultist think this true, either.
Or think almost every believer thinks there warming effect related to O3 gas.
But they don’t seem to give specific amount of warming that is due to ozone.
Why do you think that is impossible?
Mid-summer in MS is hot — lows tend to be in the low 20’s C and highs in the low 30’s C. That corresponds to radiation upward from the surface of ~ 450 W/m^2 during the night and ~500 W/m^2 during the day. Both numbers are significantly higher than the downward IR from that chart. (And if this was a warm day, both numbers could be significantly higher!)
So as you say, there is ~ 540 W/m^2 of IR leaving from atmosphere to surface that night, and 450 W/m^2 of flux arriving upward from the surface to the atmosphere. That would be a net IR loss of ~ 90 W/m^2 There will also be convection and evaporation, so the net loss is on the order of a few 10’s of W/m^2. Which makes perfect sense, since the atmosphere cools at night.
Tim,
You are right – the surface cools at night. No amount of playing with W/m2 can make this fact go away.
No radiation “prevented” from leaving the surface – it cooled. All the heat of the day, in fact, although you may not agree with Fourier, Tyndall – or me. Plus a little of the Earth’s internal heat, of course, otherwise the surface would still be molten.
You might be aware that the lowest surface temperature ever measured was only around -90 C, in an area where the Sun doesn’t shine for six months of the year! Due to the “heating” effect of the GHE, perhaps? Maybe a different GHE? I suppose you might claim that the -90 C “should have been” -90 C minus another 33 C due to the GHE. Still only -123 C! Nothing like -273 C (0 K), even after 6 months of night! I might ask you to explain, using W/m2, but you can’t.
Run away, Tim. You can’t even explain measured temperatures, can you?
-The lowest natural temperature ever directly recorded at ground level on Earth is −89.2C (−128.6F; 184.0K) at the then-Soviet Vostok Station in Antarctica on 21 July 1983 by ground measurements.–
[[Vostok Station:
Elevation: 3,489m (11,447ft)]]
“On 10 August 2010, satellite observations showed a surface temperature of −93.2C (−135.8F; 180.0K) at 81.8S 59.3E, along a ridge between Dome Argus and Dome Fuji, at 3,900m (12,800ft) elevation.”
https://en.wikipedia.org/wiki/Lowest_temperature_recorded_on_Earth
So, slightly higher elevation and remotely measured [not a station measurement].
Anywhere on earth it’s colder at 3,489 meter but in cold and dry air
lapse rate is something like 8 C per 1000 meter rather than an average of 6.5 C per 1000 meter.
Say, 3.489 times 8.5 C = 29.6 C colder because of higher elevation
than sea level.
Or adjusted to sea level −89.2 – 29.6 = -59.6 C
Or Ocean average surface is about 17 C.
3.489 times 6.5 C = 22.67 less at 3,489 meter- though probably about
23 – 17 = -6 C Average at 3,489 meter above average global ocean surface.
It is impossible that you have the faintest clue about the topic.
studentb, please stop trolling.
Yes, if the observations dont make sense to Christos, or don’t agree with his theory, then they can be dismissed as impossible.
That’s how his ‘science’ works.
Temperature forecast for the US for December 23.
https://i.ibb.co/9G0zPBK/gfs-T2m-us-38.png
https://i.ibb.co/cy91XwS/gfs-T2ma-us-38.png
This is the forecast of a polar vortex in the lower stratosphere for Christmas.
https://i.ibb.co/6wLvLm3/gfs-z100-nh-f288.png
There is a forecast that the sun will rise tomorrow.
s,
Do you mean assumption, rather than forecast?
You would have to be really stupid to be taking credit for being about as intelligent as a 3 year old!
Of course, that’s about the level of intelligence of delusional SkyDragons who believe in a GHE which heats the Earth. Even a three year old knows that the surface is no longer molten.
Not dummies like you, apparently.
Carry on with your incompetent trolling attempts.
I also forecast that you will repeat yourself.
(I understand – you are an obsessive.)
s,
Do you mean assumption, rather than forecast?
You would have to be really stupid to be taking credit for being about as intelligent as a 3 year old!
Of course, thats about the level of intelligence of delusional SkyDragons who believe in a GHE which heats the Earth. Even a three year old knows that the surface is no longer molten.
Not dummies like you, apparently.
Carry on with your incompetent trolling attempts.
Did you know the Earth’s surfaced cooled around 4.5 billion years ago?
s,
Did you know it has cooled to its present temperature over the last four and a half billion years or so?
The temperature now is less than it was four and a half billion years ago.
This process is called “cooling”. No matter how slow, cooling is not “heating”. There are some idiot SkyDragons who believe the planet cooled, then heated, then cooled, then heated – and so on. They can’t quite explain how this recurrent miracle occurs, but SkyDragons can’t even describe the GHE, which shows the extent of their preference for fantasy over fact.
Anyone who would waste their time writing “Did you know the Earths surfaced cooled around 4.5 billion years ago?” is an example of the typical idiot SkyDragon cultist. That would be you, in this case.
Off you go, now. Try and think of something really silly and irrelevant to hammer out.
Have you seen this?
https://en.wikipedia.org/wiki/Geologic_temperature_record#/media/File:All_palaeotemps.svg
s,
You wrote –
“Have you seen this?”
The address for a no-doubt irrelevant link? Yes, just now.
Any more stupid SkyDragon comments?
Give it your best shot – try to describe the GHE. How hard can it be?
The geologic temperature records is indeed relevant to your favorite squirrel, Mike.
So what are you braying about?
I suspect Sweno is incapable of clicking on a link. Maybe he is using an old man’s ancient device?
An iPad, yes.
Whacky Wee Willy,
You wrote –
“The geologic temperature records is indeed relevant to your favorite squirrel, Mike.
So what are you braying about?”
You idiot. So-called “climate scientists” dont even know the present temperature of “the Earth”! Not even the “surface temperature”. in fact fact, SkyDragons ignore actual surface temperature data, in favour of a nebulous “near surface” air temperature – which is not the air temperature, in any case.
Additionally, “climate scientists” cant actually figure out the location of the “surface”. You may be aware that around 70% of the Earths surface is covered by ocean, which is conveniently ignored by “climate scientists”. Ocean surface temperature is not air temperature, nor the temperature of the water beneath.
So what is the temperature of the Earth, given more than 99% of the Earths mass is hot enough to glow in the visible spectrum (as far as anyone knows)? Nobody knows, do they?
Go on, tell me about fictitious “geologic temperature records” while I have a good laugh!
You really are a stupid gullible SkyDragon, arent you?
Carry on.
Mike Flynn,
What are you braying about?
Check the graph at the top of this page.
And most pages on which you commented here.
For ten years.
Cheers.
Whacky Wee Willy,
You wrote
The geologic temperature records is indeed relevant to your favorite squirrel, Mike.
So what are you braying about?
Then you followed with a really stupid demand –
“Check the graph at the top of this page.”, which has precisely nothing to do with the temperature of the “Earth”, as Dr Spencer goes to some pains to explain. If you check what Dr Spencer wrote, it says “The Version 6.0 global average lower tropospheric temperature (LT) anomaly . . .”.
Maybe you should follow your own directions, and “check the graph”. It may not mean what you think it means, but that is simply because you are stupid.
You idiot. So-called climate scientists dont even know the present temperature of the Earth! Not even the surface temperature. in fact fact, SkyDragons ignore actual surface temperature data, in favour of a nebulous near surface air temperature which is not the air temperature, in any case.
Additionally, climate scientists cant actually figure out the location of the surface. You may be aware that around 70% of the Earths surface is covered by ocean, which is conveniently ignored by climate scientists. Ocean surface temperature is not air temperature, nor the temperature of the water beneath.
So what is the temperature of the Earth, given more than 99% of the Earths mass is hot enough to glow in the visible spectrum (as far as anyone knows)? Nobody knows, do they?
Go on, tell me about fictitious geologic temperature records while I have a good laugh!
You really are a stupid gullible SkyDragon, arent you?
Carry on.
Mike Flynn,
What are you braying about?
Little Willy, please stop trolling.
Presently a lot of land area on Earth is desert and at times when it is colder, Earth had more deserts.
And bring me to a question, how much more deserts.
Which leads to a question, why isn’t Greenland Ice sheet regarded
as a desert. Btw, Greenland does have desert, call Peary Land.
–What Are Deserts?
Deserts cover about a fifth of the Earth’s surface. Deserts have extreme environments. Deserts get between 1 and 15 inches of precipitation per year.–
510 / 5 = 102 million square km
–Polar Deserts
Polar desert are found in the Arctic and Antarctic regions. Like warmer deserts, they also get very little precipitation.–
https://nhpbs.org/natureworks/nwep8f.htm
Total Land area is 148,326,000 km2 and generally said we about 1/3
of land area desert: 148,326,000 / 3 = 49442000 or about 50 million square km.
Do others count ice sheet as desert?
I was thinking about counting ice sheets as deserts, what happens if ice sheet flows into desert, is it a loss of desert?
Or do you count anywhere which gets less 1 to 15″ rain or equal water amount in snow as a desert?
Or only rocky surfaces [and don’t count frozen sea ice or any ocean surface lacking rain/snow lacking 1 to 15″ of rain per year, a
desert?
Take heart from this.
–
gerontocrat. Re: 2022 Sea ice area and extent data
Reply #1037 on: December 13, 2022, 05:18:18 AM
Insomnia means early posting of JAXA data
JAXA ARCTIC SEA ICE EXTENT: 11,414,032 KM2 as at 12-Dec-2022
– Extent gain on this day 84k which is 14 k more than the average gain on this day (of the last 10 years) of 70k,
– Extent gain from minimum on this date is 6,890 k, which is 163 k, 2.3% less than the 10 year average of 7,053 k.
– Extent is 13th lowest in the 44 year satellite record
–
Mr gerontocrat and crew at Arctic sea ice forum were very happy with the compacted ice at 3rd lowest a week ago.
It may well go back down.
But at the moment there are a lot of upset Arctic ice warmists.
–
It has been swinging between 16th lowest and second lowest for 3 years now but tending, with La Nia to be on average 10th lowest.
A cold winter in the north and a cool summer in the south.
If only the temperature gods and Roy get a very low December then the global temperature this year , with the war and oil prices, might knock some sense into people.
7th place roughly in most 11 month global temp sets but a really low December could get it down to 9th or 10th lowest, fingers xed
angech,
It’s all under control. According to NASA in 2011 –
“Scientists say severe winter weather like we had in 2010 is still to be expected from time to time. That kind of weather happens even while man-made greenhouse gases build up in the atmosphere creating a long-term warming trend for the planet. When we look into our future, we definitely see a warmer world.”
They have looked into the future – and are definite that they see a warmer world. Luckily, it’s probably only a projection, not a forecast or a prediction, so nobody can blame idiot SkyDragon cultists for pretending they could predict the future!
Whoops! Gavin Schmidt (self styled “climate scientist”) says climate models predict – at least in the past. Unfortunately, people don’t behave as the models demand.
“Gavin Schmidt says theres nothing really wrong with climate models in fact, theyve done a pretty good job of predicting what has happened. One reason they arent more precise, he says, is people.” – CSMonitor.
The same Gavin Schmidt who used positive feedback in climate models to get an exaggerated warming effect yet could not explain positive feedback.
Western Nebraska
https://i.ibb.co/YtKVnyX/319991287-1597347200697645-8259036571834408353-n.jpg
Zambia
https://www.weatheronline.co.uk/Zambia.htm
The difference between the tropics and Nebraska.
Frost in Ireland, England, France and Germany will not stop. The snow cover will increase.
Strong winds and lots of sunshine are needed.
https://i.ibb.co/SnHbx8D/Zrzut-ekranu-2022-12-14-084959.png
Chililabombwe
https://www.weatheronline.co.uk/Zambia/Chililabombwe.htm
Who knew the tropics were hot?
Who knew Europe was cold in winter?
It was -10C here overnight (Oxford, UK).
I didn’t know that JAXA’s and NSID~C’s sea ice extent numbers would differ by so much on the same day: 2022, Dec 12.
JAXA: 11.414 (Mkm^2) according to angech above
NSID~C: 11.869 [+0.455] according to
https://tinyurl.com/5n77mkna
Nearly half a Mkm^2: that’s a lot.
Bindidon
This is where you shine.
I appreciate the work you do putting up graphs and arguing your point of view.
I will still comment negatively on those that I think are misinforming.
Re the difference in the 2 graphs gerontocrat puts up areas and extents and I notice that there are swings in opposite directions of quite large amounts on the same days.
My concern was first have the put up the right data, massive swings are sometimes human error.
The second is your thoughts on the massive shifts possible in a week in sea ice data.
Obviously some can be scattering or compression due to winds and storms.
Long term trends over 3 to 4 weeks suggest our standard error estimations are way off.
Ice growth or loss is a lot more volatile than most realise.
Grand Solar Minimum Update
https://alaskapublic.org/2022/12/13/arctic-report-card-2022-rapid-climate-change-brings-extreme-events-to-the-north/
Little Willy, please stop trolling.
tim…”Tyson, the debate comes down to choosing between two variations on the definition for orbital motion. Either:
A) orbital motion imposes specific constraints on the orientation of the orbiting object.
b) orbital motion does NOT impose any constraints on the orientation of the orbiting body”.
***
The debate ***FOR YOU*** comes down to those points. You insist on hammering away at intangibles while ignoring the facts.
When we talk about a rotating body, we are talking about one thing only. The body must have angular momentum about a local axis. With a rigid body like the Moon, that means it must rotate 360 degrees about that axis. That rotation has nothing to do with reference frames, it is a physical fact related to physical motion. The body is either rotating about a local axis, or it is not.
If a body like the Moon has that angular momentum about a local axis, it cannot possibly keep the same face pointed at Earth. I have proved that over and over using a radial line rotating about Earth’s centre on a circular orbit and extending through the lunar centre.
If the Moon is rotating on that centre it must break with the radial line to rotate through 360 degrees locally. The part of the radial line through the Moon does not rotate, it only changes orientation with the radial line. That is curvilinear translation without rotation.
It is you spinners who are confused about the meaning of rotation about an axis or a COG. You think a wooden horse bolted to the floor of a carousel and rotating about the axis of the carousel, is also rotating about its local COG/axis. That reveals an ignorance of the meaning of local rotation and that’s why you are all stuck.
As long as you think a ball attached to a string and rotated about someone’s head is also rotating about a local axis, there is no reasoning with you. It’s like talking to someone from Medieval Times who thinks the Earth is the centre of the universe and that the Sun orbits the Earth.
“When we talk about a rotating body, we are talking about one thing only. The body must have angular momentum about a local axis. With a rigid body like the Moon, that means it must rotate 360 degrees about that axis. That rotation has nothing to do with reference frames, it is a physical fact related to physical motion. The body is either rotating about a local axis, or it is not.”
OK — we can frame the discussion that way, too.
Draw that local axis, which is line through the center of the moon and out the two poles. That axis moves in an ellipse around the earth. The moon DOES rotate about that local axis. The moon changes orientation with respect to that axis by 360 degrees every 27.3 days.
Thanks for clearly pointing out how we know the moon does indeed rotate.
“The moon changes orientation with respect to that axis by 360 degrees every 27.3 days.”
Tim, what you have said there is only correct if “orbit without spin” is motion like the “moon on the right”, where one side of the body remains oriented towards some distant star, throughout. That is what you have yet to prove.
See the comment below. The horse is ALWAYS rotating about its local axis at 6 RPM. The horse always has the same angular momentum about its local axis. Independent of how the truck drives.
The moon is always rotating about its local axis and always has angular momentum about its local axis, independent of how the orbit carries it around the earth.
“The moon is always rotating about its local axis and always has angular momentum about its local axis…”
…only if “orbit without spin” is motion like the “moon on the right”, where one side of the body remains oriented towards some distant star, throughout. That is what you have yet to prove.
Come back when you understand the Parallel Axis Theorem.
https://byjus.com/physics/parallel-perpendicular-axes-theorem
No need to come back, I already understand it. Tesla described it this way:
“Still more remote from palpable truth is the equation of motion obtained in the manner indicated in Fig. 4, in which the first term represents the kinetic energy of translation of the body as a whole and the second that of its axial rotation. The former would demand a movement of the mass in a definite path and direction, all particles having the same velocity, the latter its simultaneous motion in another path and direction, the particles having different velocities. This abstract idea of angular motion is chiefly responsible for the illusion of the moon’s axial rotation, which I shall endeavor to dispel by additional evidences.”
We do not see the Moon spin, therefore the Moon spin is an illusion.
Nikola has an intriguing concept of illusion.
No, Tesla visualised the moon’s motion from the same POV as the GIF, as can be seen from his diagrams.
🤦
Before I get the obligatory lecture on “science doesn’t do proof”, allow me to rephrase that to:
“That is what you have yet to provide evidence for”.
“You think a wooden horse bolted to the floor of a carousel and rotating about the axis of the carousel, is also rotating about its local COG/axis.”
Suppose on the back of a truck I mount a MGR horse on bearings so it is free to turn. The truck is parked. I push the horse a gently push so that it spins and its nose points due north once every 10 seconds. (Assume the bearings are frictionless, or I keep nudging the horse so the nose keeps pointing north once every 10 seconds; also ignore the rotation of the earth). The horse has some angular momentum that we will call I.
The horse is rotating on its local axis at 6 rpm.
The horse has angular momentum I about its local axis.
If I start driving the truck north…
* is the horse still rotating on its local axis at 6 rpm?
* is the angular momentum of the horse about its local axis still I?
If I start driving the truck along a winding highway…
* is the horse still rotating on its local axis at 6 rpm?
* is the angular momentum of the horse about its local axis still I?
If I start driving the truck in a circle once every minute…
* is the horse still rotating on its local axis at 6 rpm?
* is the angular momentum of the horse about its local axis still I?
If I start driving the truck in a circle once every 10 sec…
* is the horse still rotating on its local axis at 6 rpm?
* is the angular momentum of the horse about its local axis still I?
In particular, if you ever think the angular momentum has changed, what torque caused that change?
Look at the effort Fraudkerts goes to to pervert reality.
But, the simple ball-on-a-string beats him every time.
Reality always wins.
Reality will never win if you do not do the Poll Dance experiment, Pup.
What are you waiting for?
Look at the non-effort Clint goes to when he has no answers for sound logic and physics.
What he doest seem to get is that when he never has answers, neutral observers can only conclude that HE must be the fraud.
Thanks, Tim:
https://tinyurl.com/the-wooden-horse
sorry this got posted below…
tim…”Suppose on the back of a truck I mount a MGR horse on bearings so it is free to turn”.
***
Tim…old chap…the wooden horse is ***BOLTED*** to the frame of the carousel. Get over it, the bolts prevent it from rotating about its COG.
With a ball on a string, the string tension prevents the ball from rotating about its COG. With a car on a track, the rubber tires prevent the car rotating about its COG. If they fail to grab the roadway adequately, the car does spin out and rotates about its COG. In that case, it is no longer following the track but turning in circles about its COG.
With an airliner circumnavigating the Equator, if it rotates 360 degrees about any axis it will crash.
Come on, Gordo.
Not the airliner again.
It only shows you are a Spinner.
Ask Gaslighting Graham for details.
Get over it, the bolts FORCE it to rotate about its COG. If the horse didn’t rotate about its COG, the nose would keep pointing north. But when the platform starts to spin, the bolts apply a torque about the COG axis that makes the horse rotate. With no bolts (nor other similar fasteners), there is no torque about the COG axis and no change in angular velocity about the COG axis. The nose keeps pointing north and the horse is not rotating.
Don’t be silly, Tim. Replace the wooden horse with a chalk circle in the same position. Is the chalk circle "rotating on its own axis", or simply rotating about the carousel’s axis?
In case you don’t know, the correct answer is "no, it is not rotating on its own axis, it is simply rotating about the carousel’s axis". There is only one axis of rotation for the chalk circle.
“Is the chalk circle “rotating on its own axis”, or simply rotating about the carousels axis?”
That changes nothing about anything I said. Locate the center of the circle. Draw a vector from that point to any point on the circle. If the vector (a) maintains a constant length and (b) changes orientation, then the vector (and the circle) are rotating about that axis.
The only question left is “changes orientation relative to what?”. You are clearly thinking “relative to the rotating platform”. I prefer to start from an inertial frame that is NOT rotating. Working within a rotating frame of reference introduces all sorts of unneeded complications (like Coriolis forces). Much easier to choose an inertial frame. To measure relative to “the direction north” rather than relative to “the direction toward the center of the MGR”.
Tim, you’re still not getting it. To say that the chalk circle is rotating on its own axis, is the same thing as saying that it’s translating in a circle, whilst rotating on its own axis. The translation in a circle is obligatory, if you’re saying that it’s rotating on its own axis.
Whereas if you say that the chalk circle is not rotating on its own axis, it’s the same thing as saying that it’s rotating about an external axis, whilst not rotating about an internal axis. The rotation about an external axis is obligatory, if you’re saying that it’s not rotating on its own axis.
The two visually identical motions:
1) Rotation about an external axis with no rotation about an internal axis.
2) Translation in a circle whilst rotating about an internal axis.
Transcend reference frames, in that way.
However, mechanically, the motion of the chalk circle is best described by 1). That’s what is physically happening, after all.
And so Gordo is a Spinner.
Welcome back, Gordo!
Tim is confronted with an example of a wooden horse securely bolted to the floor of a carousel so that it physically cannot rotate on its own axis, and can only rotate about the axis of the carousel, thus demonstrating that (as Bindidon agrees) “rotation about an external axis with no rotation about an internal axis” is motion like the “moon on the left”.
So, what does he do? He immediately puts the wooden horse on bearings, so that it can rotate on its own axis…
…talk about missing the point.
DREMT is confronted with two scenarios, both where the horse moves EXACTLY the same way. Yet he is certain the MOUNTING and not the MOTION determines if the horse is rotating or not.
[Pretty sure you are thinking too concretely. Confusing a mathematical ‘axis’ with a physical ‘axle’. The horse cannot rotate relative to the axle, since it is firmly attached. But the axle is rotating; it is changing orientation about its axis. So the horse and axle are both rotating about their common axis.]
Pretty sure you are underestimating me, Tim, as always. The motion of the wooden horse can be described in either of two ways:
1) Rotation about an external axis, with no rotation about an internal axis.
2) Translation in a circle, with rotation about an internal axis.
In the mounted wooden horse scenario, 1) is appropriate, since that accurately describes the mechanics of the situation. In your scenario, 2) is appropriate, since that accurately describes the mechanics of the situation.
For the moon, we need to establish if “orbit without spin” is like the “moon on the left” (“rotation about an external axis”) or like the “moon on the right” (“translation in a circle”).
Well-stated, Dremt. We are never going to get Tim or any spinner to accept basic, scientific common sense. However, your explanation may affect someone reading this to think more laterally.
It hard for me to accept that people can pollute the basic physics of rotation about an axis to save face.
Come on, Gordo.
Your airliner example DESTROYS that comment by Gaslighting Graham.
Think.
Thanks Gordon…just ignore Little Willy’s ineffectual yapping. Or ask him to please stop trolling.
Pretty sure you are underestimating 400 years of scientists, DREMT, as always.
“The motion of the wooden horse can be described in either of two ways:
1) Rotation about an external axis, with no rotation about an internal axis.
2) Translation in a circle, with rotation about an internal axis.”
Not quite. Option (1) should more precisely be “with no ADDITIONAL rotation about an internal axis.” Or perhaps “with no rotation relative to the rotating platform”. But the horse IS rotating about its internal axis relative to the ‘fixed stars’, whether you measure from a frame fixed at the center of the MGR or a frame fixed at the COG of the horse.
Draw a vector from (either the center of the MGR or the center of the horse) to the tip of the nose. Those two vectors both have constant lengths and both change orientations (ie both move in a circle around the axis, ie both rotate).
People smarter than either of us have thought about this for 100’s of years. They have all concluded the moon rotates. There is simply no other way to accurately describe the motion that in accordance with conservation of angular momentum.
THIS is “scientific common sense.” THIS is the basic physics of rotation that is in every textbook.
False, Tim. The two options I gave were already "relative to the fixed stars". This is what I can never seem to get across to you guys, and it’s why reference frames do not resolve the moon issue.
“In the mounted wooden horse scenario, 1) is appropriate, since that accurately describes the mechanics of the situation. In your scenario, 2) is appropriate, since that accurately describes the mechanics of the situation.”
Sounds like DREMT is admitting that in the Moon situation, (2) is appropriate, since that accurately describes the mechanics of the Moon, being unbolted to anything and free to rotate on its axis!
Thank God the long blog nightmare is over!
Rather than simply repeating your claim, give a definition of “rotating about an axis”. A set of clear, consistent steps you could perform to determine “rotation about an axis”.
I gave mine — if a vector from some defined point (say the center of the horse) to some defined point on an object (say the nose of the horse) has fixed length and a change in orientation relative to some defined frame, then the object has rotated relative to that frame.
As an intuitive example, suppose I am sitting in a swivel chair. If I am always facing north (ie a vector from the axis to my nose points north), then I am not rotating about the axis of the chair. Period. If at any time I am facing east or west, then I have rotated 90 degrees about the axis of the chair.
If you think I can turn to face east without rotating about the axis of the chair, then provide your definition of “rotation about the axis of the chair” that would say I have not rotated.
So, just to explain to anybody that might be confused…
…the moon debate does not begin and end with me. So, even if I were to one day concede that the moon rotates on its own axis (I’m not going to, but just for the sake of argument):
1) The debate would not be over. Others would no doubt continue to defend the "Non-Spinner" side of the debate.
2) The things that I most regularly argue about would still be correct, namely:
a) The ball on a string is not rotating on its own axis.
b) "Rotation about an external axis with no rotation about an internal axis" is motion like the "moon on the left".
c) The moon issue is not resolved by reference frames.
d) "Revolution/orbit" is defined as "rotation about an external axis".
Note that, for example, Bindidon agrees with me on a) – c), and he’s a "Spinner". So, clearly, those things remain correct no matter what side of the debate you’re on. So I would still continue to argue in support of those points in any case.
The moon debate will most likely never be over, but I have agreed to stop commenting on the issue forever if all of the regular "Spinner" commenters publicly agree with me on b) and c), never to be taken back.
Tim, as I said further upthread, you’re still not getting it.
Perhaps you never will.
A motion visually identical to that of the wooden horse on the carousel can be described in either of two ways…you can say it’s rotating on its own axis, or you can say it’s not rotating on its own axis. Where you argue that the difference comes down to reference frames, I point out the following:
If you say it’s rotating on its own axis, then that is the same thing as saying that it’s translating in a circle, whilst rotating on its own axis. The translation in a circle is obligatory, if you’re saying that it’s rotating on its own axis.
Whereas if you say that it is not rotating on its own axis, it’s the same thing as saying that it’s rotating about an external axis, whilst not rotating about an internal axis. The rotation about an external axis is obligatory, if you’re saying that it’s not rotating on its own axis.
Explaining why the moon issue is not resolved by reference frames is one of the hardest things I think I’ve ever had to explain to anyone. It really is just a "you either get it or you don’t" type affair.
DREMT states a logical truth about motion, that it can be described in different ways.
The Moon is an independent body with no constraint on its rotation. Thus it is best described as rotating on its own axis while translating on an elliptical path around the Earth.
Adding to the force of this argument are several other facts. If the Moon were somehow BEHAVING like a body bolted to a rotating frame, then the frames rotation rate would need to increase and decrease which would cause the Moon’s rotation rate to do likewise, but it doesn’t, and this causes longitudinal libration. and the frame would need to stretch and contract.
The Moon’s rotation is observationally around an axis that is tilted 6.7 degrees. So again this cannot be explained by a ‘bolted on a frame’ model.
To now argue that the Moon is somehow exempt from the above logical truth, and observational facts, would be to admit that logic and facts need not apply, when truth is determined by only belief, in essence that one’s Moon belief is a religion.
Yep, the argument is definitely over.
I thought I had already explained myself perfectly clearly at 11:42 AM, but those I no longer respond to keep chiming in for some unknown reason…
Anyone can argue with themselves and twist themselves into a logical pretzel if they want.
It’s funny, all those complaining about me continuing to discuss the moon issue here only have to concede two points, and I will never discuss it again…
…but of course conceding anything is completely beyond these people.
Well the main issue has always been whether our Moon is rotating on its axis. You conceded that is the proper way to look at it.
So you can now argue on any other topic, but our Moon argument is over.
…but of course conceding anything is completely beyond these people.
…and some of them even go to the extremes of pretending I have conceded an argument when I haven’t. They just simply lie about it. That’s one of the many reasons why I no longer directly reply to such people.
And there we have it…
To now argue that the Moon is somehow exempt from the ONE’S OWN STATED logical truth, and observational facts, would be to admit that logic and facts need not apply.
Because truth is determined only by belief. Their Moon belief is a religion.
…they just simply lie about it. That’s one of the many reasons why I no longer directly reply to such people.
Let us remind people of DREMTs sound logic.
“The motion of the wooden horse can be described in either of two ways:
1) Rotation about an external axis, with no rotation about an internal axis.
2) Translation in a circle, with rotation about an internal axis.”
When Tim “immediately puts the wooden horse on bearings, so that it can rotate on its own axis”
DREMT clearly states that
“In the mounted wooden horse scenario, 1) is appropriate, since that accurately describes the mechanics of the situation. In your scenario, 2) is appropriate, since that accurately describes the mechanics of the situation.”
So the question is whether bodies in ORBIT CAN ROTATE on their own axis. Are they free to do so, or are they BOLTED like a mounted horse to a rotating platform?
Since we can observe, in the solar system, many bodies in ORBIT rotating on their own axes, the answer clearly is YES they CAN ROTATE on their own axis.
And what of the Moon? It is certainly NOT BOLTED to anything. It is an independent body moving in a vacuum.
Then we have no choice to describe the Moon’s motion
2) Translation in a circle, with rotation about an internal axis.”
To argue that the Moon is somehow EXEMPT from this logic is simply dishonest.
…just simply lie about it. Thats one of the many reasons why I no longer directly reply to such people.
To assert that someone has lied, one needs to make clear what the lie was, as I just did in my post.
“To assert that the Moon is exempt from this logic”.
Just for anyone reading who might be confused, this:
a) "Orbit without spin" is like the "moon on the right"
does not follow from this:
b) Objects in orbit are free to rotate on their own axes, or not.
Suggesting that a) follows from b) is a non-sequitur. "Orbit without spin" could be like the "moon on the left", and objects still be free to rotate on their own axes, or not.
That’s why, in my 2:09 PM comment from December 14th that I’m currently responding to, I made sure to write this at the end:
"For the moon, we need to establish if “orbit without spin” is like the “moon on the left” (“rotation about an external axis”) or like the “moon on the right” (“translation in a circle”)."
Certain dishonest folk have been quoting from that comment, but not including the end part, and have been making all sort of illogical jumps from a) to b) that I would not make myself, whilst claiming that what they are saying is all my logic!
You couldn’t make it up…
“a) ‘Orbit without spin’ is like the “moon on the right”
does not follow from this:
b) Objects in orbit are free to rotate on their own axes, or not.”
That is just weird.
If an object is free to rotate on its axis, then it is free to have zero rotation, as the MOR has, or non-zero rotation, as the MOL has.
But it is an observable fact that objects in Orbit are free to rotate on their own axes.
Thats is all we need to know.
“For the moon, we need to establish if ‘orbit without spin’ is like the moon on the left (rotation about an external axis) or like the moon on the right (translation in a circle).”
This is trying to use semantics to evade logic. In this case one’s own logic.
One can either HONESTLY APPLY ones own correct logic equally to all bodies, or go with one’s assertions about a specific body, and contradict ones own logic.
But one cannot have BOTH.
…simply lie about it. That’s one of the many reasons why I no longer directly reply to such people.
” why I no longer directly reply to such people.”
I will simply note the observable fact that DREMT has been replying to my recent posts… I assume because he felt he had a sensible reply.
I will also point out if it wasnt already clear:
This logical reasoning
“When Tim ‘immediately puts the wooden horse on bearings, so that it can rotate on its own axis’
DREMT clearly states that in this scenario
“2) is appropriate, since that accurately describes the mechanics of the situation.”
reminder that 2) is Translation in a circle, with rotation about an internal axis.
So there can be no doubt that this description (2) is appropriate to the moon on the left.
…simply lie about it. That’s one of the many reasons why I no longer directly reply to such people.
FFS ! You lot are getting worse with your obsession about balls on a string etc.
Why don’t you bugger off to some other site?
There you could obsess to your heart’s content and save the rest of us from having to scroll past this rubbish!
Pup tried to bait Joe Postma with his Moon Dragon stuff, sb.
Joe told him off. So here he is.
Gaslighting Graham only tags along, waiting for Gordo or Pup to stir the pot.
Except when he starts comment threads with that crap.
So here we are, Waiting for Roy.
The tears of this world are in equal quantity.
studentb, Little Willy, please stop trolling.
“If a body like the Moon has that angular momentum about a local axis, it cannot possibly keep the same face pointed at Earth”
Except if a body, such as the Moon, rotates once on its axis per orbit of the larger body.
RLH slips in a cheeky last word attempt, that amounts to nothing more than an argument by assertion.
stupidb…”There is a forecast that the sun will rise tomorrow”.
***
This is typical of the addled minds of climate alarmists. They actually think the Sun is revolving around the Earth.
Just as they forecast the Sun will rise tomorrow, they think a trace gas in the atmosphere can cause havoc with global temperatures and climates.
As any true student of science understands, the Sun is not moving wrt the Earth therefore cannot rise or set in the true sense of it. It’s an illusion, and so is the idiocy that a trace gas can significantly warm the planet.
tim…”Suppose on the back of a truck I mount a MGR horse on bearings so it is free to turn”.
***
Tim…old chap…the wooden horse is ***BOLTED*** to the frame of the carousel. Get over it, the bolts prevent it from rotating about its COG.
With a ball on a string, the string tension prevents the ball from rotating about its COG. With a car on a track, the rubber tires prevent the car rotating about its COG. If they fail to grab the roadway adequately, the car does spin out and rotates about its COG. In that case, it is no longer following the track but turning in circles about its COG.
Come on, Gordo.
The rubber of your tires does not prevent you from parking your car.
Think.
But you are on the right track, pun intended – the Moon is more like a car on ice than on asphalt.
Think more about that.
Gordon, old chap, where are the bolts holding the moon rigidly to the earth?
The horse is simply an analogy — and a poor one at that — for the motion of the moon.
* the horse moves in a circle; the moon does not.
* the horse is bolted rigidly to a platform; the moon is not.
(Same for ball-on-string and car-on-track.)
“If [rubber tires] fail to grab the roadway adequately, the car does spin out and rotates about its COG. In that case, it is no longer following the track but turning in circles about its COG.”
Let’s go with this idea. Suppose the tires suddenly lost ALL traction on a flat road. As you point out, the car would be “turning in circles about its COG”. But here’s the thing — with no traction, there is no torque to change the angular momentum of the car. The angular momentum before and after frictions is turned off is the same. So the angular momentum about the COG axis is the same before and after. So angular velocity about the COG axis is the same before and after.
"The horse is simply an analogy — and a poor one at that — for the motion of the moon."
No, it’s simply an analogy for "orbital motion without axial rotation"…and possibly not as good an analogy as the ball on a string.
From the Monckton thread by maguff…
[Bill]orbital angular momentum isnt a real angular momentum”.
***
Bill is correct. Orbital angular momentum of a body like the Moon is referred to as fictitious, or a pseudo quantity. It’s the same as the alleged Coriolis force, which is classified as a fictitious force. That’s because no such force exists although it seems ‘apparent’ that a force is acting.
https://en.wikipedia.org/wiki/Fictitious_force
It’s the same with angular momentum wrt the Moon in its orbit. The Moon has no momentum along the orbital path, only an instantaneous linear momentum that is always trying to move along a tangent line to a curve.
Exactly correct, Gordon.
Moon’s orbit is the result of its linear momentum and gravity. If gravity were turned off, Moon would go off in a straight line.
From Gordon Robertson’s link:
“A fictitious force is a force that appears to act on a mass whose motion is described using a non-inertial frame of reference, such as a linearly accelerating or rotating reference frame.”
Exactly…a fictitious force is a force that ***appears*** to act on a mass…
There is no force acting.
Example, you are the passenger in a car and the driver takes a corner a little too fast. It feels like a force is pushing you against the door but there is no force in that direction.
The only force is the door pushing back on your body. If the door opened, you’d fall out. Your body wants to keep going straight and the car is turning, all that makes you turn is the friction of the seat and the door pushing on you, in essence, guiding you around the corner.
The sensation of something pushing you against the door is fictitious, hence a fictitious force. You could represent it as a real force in a different reference frame but it would not be any more real than in the reality you are in.
It’s the same with the Moon. It’s not rotating about a local axis and no matter which reference frame you use, it’s still not rotating about a local axis.
Fictitious forces are forces we introduce so that we can make calculations inside non-inertial reference frames. They differ from “real” forces in that they are non-contact forces.
You have stated in the past that you don’t understand reference frames, so I’m not going to waste my time further explaining to you how these calculations can be used to model your car example.
There’s nothing in Gordon Robertson’s link about angular momentum.
There was no intention of posting a link about angular momentum. I posted a link to fictitious force, which can be applied to a fictitious angular momentum in the same manner.
Angular momentum of the real kind applies only to solid bodies. If a sphere is rotating about a local axis, every particle making up the body has angular momentum about the axis. That does not apply to the Moon because it has its own linear momentum wherein the linear velocity vector is bent by gravity into an orbital path.
Since the Moon has no natural angular momentum, any reference to such a momentum is fictitious.
You wrote: “Orbital angular momentum of a body like the Moon is referred to as fictitious, or a pseudo quantity.”
And then posted a link to the definition of Fictitious force.
So, where’s the link to your assertion about the Moon’s angular momentum?
Or is this just another of your proofs by assertion?
Tyson, please stop trolling.
What lunar spin deniers still have to explain
1. How is it possible that
– the astronomer Mayer in 1750
and (among many others)
– the mathematicians Habibullin in 1963, Calam in 1976, Eckhardt in 1980, Moons in 1982 etc etc etc
computed for the lunar spin, using
– completely different observation tools
and
– completely different observation data processing methods
periods differing by only 0.000006 days?
Mayers value for the period in his treatise:
27 d 7 h 43 ‘ 11 ” 49 ”’
i.e.
27.321655 days
Recent value:
27.321661 days
*
2. Why did recent all these astronomers and mathematicians, who were busy with the lunar spin, detect and compute what Newton had predicted 300 years ago – namely that gravitational effects would be the major cause of tiny irregularities in the spin?
These extremely small, real irregularities are named today physical librations – in opposition to Moon’s optical, apparent librations (diurnal, longitude and latitude).
*
A good description of such work is given in
Secular variation of the Moon’s rotation rate
Bois, E., Boudin, F., & Journet, A. (1996)
Journal of Astronomy and Astrophysics, v.314, p.989-994
*
Free access given in
https://tinyurl.com/3vjn4wyj
1) Ancient astrologers confused rotation with revolution.
2) Libration is due to orbital motion.
If you’re still confused Bin, go with the ball-on-a-string.
“Keep it simple, stupid.”
The first reply – and very probaly by far the dumbest of all – didn’t wonder me:
” Ancient astrologers confused rotation with revolution. ”
This, as we know, includes the physicist Isaac Newton.
You mean occultist Isaac Newton, Binny.
For weird reasons, occultists and astrologers always fought each other.
Newton stated two facts about the Moon in Principia…
1)the moon moves with linear momentum
2)the moon moves with curvilinear motion.
Add the two plus the fact that the Moon keeps the same face to Earth, and you have Newton verifying the Moon moves with curvilinear translation without local rotation.
I think Newton’s usage of ‘revolution’ supports that. He did not claim the Moon rotates on its axis, he simply stated that the Moon revolves about its axis. It’s obvious the axis he meant was the Earth.
With respect to Meyer et al, they were simply wrong about he Moon rotating. I mean no disrespect to the man, I think he did terrific work mapping out the Moon’s motion to the point it could be used by mariners for locating their longitude.
I have a sneaking suspicion they were using the word rotation in an entirely different manner than it is used today. In the limited amount of Meyer I was able to translate to English, I saw no indication he was discussing the Moon rotating on a local axis.
Isaac Newton’s Principia 1687. Proposition 17, Theorem 15.
“Now, since a lunar day (the moon revolving uniformly about its own axis) is a month long [i.e., is equal to a lunar month, the periodic time of the moon’s revolution in its orbit], the same face of the moon will always very nearly look in the direction of the further focus of its orbit, and therefore will deviate from the earth on one side or the other according to the situation of that focus.”
TM, you’re late to the party.
Bindidon tried that many months ago. So, go back and learn why it doesn’t “prove”: what you believe it “proves”.
There are few novelties in the Moon Dragon Crank Master Argument since Gaslighting Graham injected this website with it 75 months ago, Pup.
That 0:1 spin-orbit lock, tho, was pure gold.
Do the Pole Dance Experiment.
I did not start the moon rotation debate.
” I did not start the moon rotation debate. ”
Aha. But you just restarted it…
https://www.drroyspencer.com/2022/12/uah-global-temperature-update-for-november-2022-0-17-deg-c/#comment-1409139
No, not at all. It had already started again further up-thread before I even wrote that comment.
🤦
Little Willy, please stop trolling.
” Newton stated two facts about the Moon in Principia…
1)the moon moves with linear momentum
2)the moon moves with curvilinear motion. ”
As usual, Robertson confounds his egomaniac nonsense with the reality.
NEVER AND NEVER did physicist Newton write such trivial idiocies in his Principia (which ignoramuses a la Robertson never read).
What Newton indeed stated is what idiot Robertson woefully ignores and discredits, and what everyone can read in Principias’s Book III, Proposition XVII, Theorem XV.
I wrote that often enough on this blog.
What of course was predictable was that the two dumbest, most ignorant lunar spin deniers of course were not even able to discuss the two points I mentioned.
Neither are these primitive deniers able to explain
– why three completely different observation and evaluation contexts (1750, 1963, and since 1976) led to exactly the same result for the lunar spin period
nor are they able to explain
– why recent observations and computations perfectly confirmed what Newton predicted, namely that gravitational forces would influence the lunar spin.
Bin, that’s only relevant to you because you don’t understand ANY of this. You reject reality. And you fail to present anything relevant. For example, where’s your viable model of “orbital motion without axial rotation”?
As usual, you’ve got NOTHING.
Clint R
As always, you are at least 100 % right.
Look at this:
” In the limited amount of Meyer I was able to translate to English, I saw no indication he was discussing the Moon rotating on a local axis. ”
Could we see a better proof of Robertson’s insane mind?
Tobias Mayer’s treatise
https://www.e-rara.ch/download/pdf/913790?name=IV%20Abhandlung%20%C3%BCber%20die%20Umw%C3%A4lzung%20des%20Monds%20um%20seine%20Axe%20und%20die%20scheinbare%20Beweg
is 130 pages long and full of references to what he wanted to prove and has brilliantly demonstrated.
*
But… to understand that, you don’t just have to understand German.
You also need… a healthy, sane, functioning brain.
Show us in the links where Meyer discusses lunar rotation about a local axis. All I saw him discuss was lunar libration.
Come on, Gordo.
Do you accept not to comment for 90 days if you are spoon fed?
Think.
Don’t be stupid, Willard, there is nothing in the works of Meyer related to proof the Moon rotates. I asked the question because Binny keeps insisting there is yet fails to show us what Meyer said about it.
Meyer’s great contribution was mapping the motion of the Moon in its orbit. His work was so good that sailors could use the position of the Moon to determine their longitude. Unfortunately, someone came out with an on board accurate clock that could do the same thing. It worked whether the Moon was visible or not.
Come on, Gordo.
All I need is an official bet.
It should be obvious to anyone commenting here that you did not do the reading.
You are our Master Fabulator.
If you are so sure, what do you have to lose?
Whining Wee Willy,
You wrote –
“All I need is an official bet.”
Or the ability to accept reality. Or a brain?
What are you braying about, Mike?
Little Willy, please stop trolling.
You are such an absolute idiot: the first hint to that is the title of Mayer’s treatise itself.
A Christmas lump of coal for all you climate change narrators.
ken…you do realize that a lump of coal was at one time a traditional gift for Scottish New Year (Hogmanay). The way things are going in Europe with this dumb Ukrainian war, it may soon be revived as a tradition.
There’s a saying in Scotland, ‘Lang mae yer lum reek…wae ither folks’ coal’. Translated, ‘Long may your chimney smoke…with other people’s coal’.
Here you see again the disgusting liar Robertson talking about ‘this dumb Ukrainian war’ which is in reality a cruel Russian war against Ukraine and especially a war against its people through the permanent destruction of the civil energy supply, which coward dictator Putin said to be necessary and unavoidable.
*
Freedom of speech on this blog?
I would rather say
Freedom to support the Russian dictatorship!
Putin claimed from the outset that he had no intention of conquering the Ukraine, just the areas he has captured. He did it on behalf of Russian-speaking Ukrainians in the east who were disenfranchised by armed Ukrainian nationalists ousting a democratically-elected president. The Ukrainian army did nothing to stop it. So, the eastern Ukrainians asked Putin to intervene.
The Russian-speaking Ukrainians did not take kindly to the illegal removal of a president for whom they had voted. I became aware of the situation a long time ago but I could never figure out why there was discontent and what was being done to alleviate it. Turns out the Western media were completely ignoring the truth and failing to report it in the West. In fact, the Western media made it appear as if the eastern Ukrainian rebels were in the wrong.
Since the Russians captured the areas they set out to conquer, the idiot Zelensky has turned into a dictator. He has stopped freedom of the media and introduced sanction that would not be out of place in a banana republic. He alone is responsible for the Ukrainians who continue to die and all he is doing about it is setting up more Ukrainians to die.
It’s pathetic. Zelensky could stop it tomorrow by recognizing the problems of eastern Ukrainians and negotiating in good faith. He’s not getting the land back no matter what fairy tales we are told about an imminent Russian defeat. He is the worst possible leader the Ukraine could have.
Gordon Robertson
Now you seem to not only unable to understand any science at all, now you seem to totally ignore why Ukrainians are fighting Russians. You are a real stupid person, have you read anything of what Russians have done to Ukrainians??? Killing and torturing civilians, raping mothers and daughters. Bombing civilian structures and now depriving average citizens of electricity. Ukrainians are not fighting for Zelensky. They are fighting because Russia is a foul and nasty Nation that needs to go back to its own borders and never be allowed to roam and kill. Putin is a dark soul and total liar and deceiver. That you believe his lies is really sad on your part. I do not know what source of information you use, is it Russia Today or Rense? Russia is a barbaric nasty nation, I am very glad they are being defeated and it is only because of their vile nature.
A weak corrupt US President allows aggression to occur in the world. The UN is gutless, without US support.
Under Obama, Putin invaded Crimea. Putin was quiet during Trump’s administration. Then, when Biden got into office, Putin invaded Ukraine again.
Biden is only good at perverting society. He appoints weirdo purse-snatchers to high positions.
https://www.insider.com/official-sam-brinton-out-of-job-after-accusations-luggage-theft-2022-12
Let’s go Brandon!
“allows aggression to occur in the world.”
This ignores the fact that the US, Europe, and NATO are united with Ukraine in NOT allowing the aggression.
However the far-right wants it to put a stop to that. And Trump did Putin’s bidding by trying to weaken NATO and European-US unity.
Are people here seriously still supportive of an ex-President who stated that he wants to suspend the Constitution?
https://bloximages.chicago2.vip.townnews.com/madison.com/content/tncms/assets/v3/editorial/9/56/956eb80f-0e4f-53b5-8302-ba4b0503841b/63926c81d60be.image.jpg?resize=1476%2C1072
“…in NOT allowing the aggression.”
This ignores the fact that Crimea and large areas of remaining Ukraine are now occupied by Russian aggressors, troll Nate.
You will need to pervert the definition of “aggression”, I guess. Your cult is good at perverting reality.
Do you think stopping the aggression of a large nuclear armed country like Russia, determined to recover its empire, should be easy? But against the odds, the aggressor has already been pushed back considerably.
When countries decided to stop allowing Nazi aggression, beginning in 1940, it took another 5 years to finish the job.
Yes Troll Nate, a weak corrupt US President allows aggression to occur in the world. The UN is gutless, without US support.
Under Obama, Putin invaded Crimea. Putin was quiet during Trump’s administration. Then, when Biden got into office, Putin invaded Ukraine again.
Biden is only good at perverting society. He appoints weirdo purse-snatchers to high positions.
https://www.insider.com/official-sam-brinton-out-of-job-after-accusations-luggage-theft-2022-12
Let’s go Brandon!
“Putin was quiet during Trump’s administration.”
What an ignoramus. Russia was plenty busy fighting against US-backed forces in Syria from 2017 to 2019, all while Donny was president and did nothing about it. Putin wasn’t quiet. Donny was. Let Putin do whatever he wanted in Syria.
Central African Republic Civil War – Russia was involved through Donny’s term. Donny wasn’t interested.
Russia was backing fighters with weapons and money in Ukraine all through Donny’s term. Trump didn’t care. Putin was his mate.
Trump’s general attitude while Putin fought several proxy and actual wars was, “do whatever, man.”
Maybe Robertson is a fan of NY times, they did it for decades.
But Canadians tend to think they have same freedom of Americans.
The Canadian trucker strike, should indicate it’s not true.
I don’t think France would do the same thing.
Perhaps Europeans could tell me, I am wrong?
gb….first, Canadians are Americans, as are US citizens, Mexicans, Costa Ricans, Argentinians, etc. All are occupants of The Americas. Look at a world map, there is no such country as ‘America’. There is the United States ***OF*** America but one of its states, Hawaii, is not in America.
Besides, I have always regarded Canadians as having had more freedom that the US, in areas that are important. It has only been recently that Trudeau has tried to deprive us of that freedom. He has annoyed so many Canadians that a new movement has developed to remove him from office.
Gordo,
You’re delusional if you think Canadians have anywhere close to the same rights as US Citizens. Well, maybe in NY and California. The rest of the country? No.
You can spread your lying nonsense as long as you want, Robertson.
Is there anyone who believes you here?
Why, do you idiot think, did Putin give order to destroy the entire energy and water supply in the Ukraine, just in front of the winter?
If Western Europe and the US hadn’t helped Ukraine since Feb 24, this country would have stopped to exist.
You’re more brainless, more perverted as can be imagined.
And you are a disgusting coward because you perfectly know that no one on this blog will stop you from spewing your lies.
Bunny,
You wrote –
“And you are a disgusting coward because you perfectly know that no one on this blog will stop you from spewing your lies.”
Maybe you could present some facts, and let others make up their own minds?
Or do you just oppose freedom of expression on principle?
Bindion, please be gentle on the demented. They have not long to live on this earth.
studentb, please stop trolling.
If the Pseudomod wasn’t so 100 % one-sided, and had some courage, he would write
” Swenson, please stop trolling. ”
or, alternatively at other places
” Robertson, please stop trolling. ”
” Clint R, please stop trolling. ”
Becoz these three are this blog’s trolliest posters.
They are that, DREMT, and you know that very well.
"Bindion, please be gentle on the demented. They have not long to live on this earth."
Happy that this comment is an example of pure, unadulterated, 100% trolling.
Since Moon’s sidereal rotation period 27,32 days (in reference to the stars) is the same as its orbital around Earth period, Moon definitely does not rotate on its own axis.
–
If Moon rotated on its own axis, Moon’s sidereal rotational period should have been shorter than its orbital around Earth period.
–
https://www.cristos-vournas.com
Vournas
” If Moon rotated on its own axis, Moons sidereal rotational period should have been shorter than its orbital around Earth period. ”
What’s that for a nonsense? Where is your proof for that incredible claim?
*
You are not even able to scientifically contradict hundreds of physicists, astronomers and mathematicians who all proved that.
You move yourself down to the primitive contrarian level of Robertson, Clint R etc etc.
Bunny,
Here’s a snippet from Durham University –
“The Moon’s sidereal orbital period (the sidereal month) is ~27.3 days; this is the time interval that the Moon takes to orbit 360 around the Earth relative to the “fixed” stars.
The period of the lunar phases (the synodic month), e.g. the full moon to full moon period, is longer at ~29.5 days.
At New Moon, the Moon is aligned with the Sun. During the lunar month the Earth orbits (revolves) ~30 around the Sun and the Moon orbits (revolves) ~390 to align with the Sun again.”
You will note that the sidereal and synodic periods are different, with the synodic being longer.
However, you might also note that “orbits” is used interchangeably with “revolves”, which can confuse people who use “revolves” exclusively for circular orbits. To further confuse the issue, a “sidereal rotation period”, is viewed from fixed stars, far enough away that the orbit or revolution lateral displacement is imperceptible, but the fact that all sides of a body not rotating about an internal axis through its center of gravity could be observed, means that sidereal rotation can theoretically be measured. Just like observing, say, a railway engine on a circular track, viewed from outside the circle. All sides can be seen during its revolution, but the engine is not rotating around its centre of gravity, rather revolving around the centre of the circular or elliptical track.
So back to the Moon, the Earth is at the centre of its track, or orbit, and an observer on the Moon, facing the centre, will not see the centre vanishing from view – just like an observer on the engine with his gaze fixed through a window on the centre point about which his engine is revolving, will not see that point moving with respect to the window frame.
All fairly pointless, though, isn’t it? Not a single fact has been changed.
I suppose you find it a diversion from endlessly dissecting the past, which of course tells you precisely nothing about the future. You must love a good meaningless discussion.
Carry on.
Flynnson
You are exactly the same kind of arrogant and ignorant person as are Robertson, Clint R.
You try to explain things you don’t understand: these things begin with the difference between sidereal and synodic periods.
Keep away, Flynnson. Spare us your eternal blathering attitude.
Binny,
Presumably, you are disagreeing with something I said.
However, you haven’t said what you are disagreeing about, nor the basis for your disagreement!
Is that because you have been caught out, and can’t bring yourself to accept reality?
In any case, if I have erred, would you be so good as to point out where, and support your claim? Otherwise, you come across as just another ignorant SkyDragon cultist, being forced to face reality, and not liking it one little bit!
You don’t have to comment if you don’t want to. You don’t even have to read what I write. Are you so stupid that you need me to tell you that you can make your own decisions?
As to your requests/demands/directions – I do as I wish, and I am disregarding your entreaties. There is absolutely nothing you can do about it, either.
By the way, I assume you don’t need me to explain what I quoted from Durham University, in case that is what you are complaining about. Look it up yourself, if you want to know more.
Dementia.
s,
You wrote –
“Dementia.”
Oh, the pain! Oh, the hurt! – not!
Oh, the idiocy of the ineffective attempt by a SkyDragon to troll (or something)!
Is there some reason for your one-word comment?
If you are trying to be gratuitously offensive, you might not realise that I generally decline to take offense, and you have given me no reason to make an exception in your case.
Or are you just plucking random words from a dictionary to show that you can?
What an idiot you are!
Dementia is terrible – no doubt about it.
What shall we engrave on your grave stone ?
Maybe:
“Here lies Swenson
Couldn’t write a sentence
Without vociferous shouting
At the the clouds above him”
s,
You wrote
Dementia.
Oh, the pain! Oh, the hurt! not!
Oh, the idiocy of the ineffective attempt by a SkyDragon to troll (or something)!
Is there some reason for your one-word comment?
If you are trying to be gratuitously offensive, you might not realise that I generally decline to take offense, and you have given me no reason to make an exception in your case.
Or are you just plucking random words from a dictionary to show that you can?
What an idiot you are!
“Oh, the idiocy of the ineffective attempt by a SkyDragon to troll”
Swenson seemingly admits that what he posts regularly, repeated ad-homs, are ineffective attempts at trolling.
With the decrease in temperature in the northern hemisphere, a significant drop in sea surface temperature continues.
https://www.tropicaltidbits.com/analysis/ocean/global.png
As the temperature drops …… the temperature drops.
Brilliant!
You obviously have SFB.
s,
Obviously more brilliant than idiot SkyDragon cultists, who claim that slow temperature drops result in warming!
How stupid is that?
Sad.
studentb, please stop trolling.
Hey,
Have all you hysterical climate change fanatics seen AOC’s new movie? How was it?
Could Life Survive on Frigid Exo-Earths? Maybe Under Ice Sheets
“Our understanding of habitability relies entirely on the availability of liquid water. All life on Earth needs it, and theres every indication that life elsewhere needs it, too.
Can planets with frozen surfaces somehow have enough water to sustain life?”
https://www.universetoday.com/159192/could-life-survive-on-frigid-exo-earths-maybe-under-ice-sheets/#more-159192
I was thinking maybe life near star is unusual.
Maybe instead of star travel, it’s planetary travel.
But I wondering if Earth is energy poor, how energy poor is planet 1000 AU from any star.
Someone said curse of life, is axis tilt and the sexes- maybe they were from another planet.
Anyhow how much greenhouse effect is there per mile of ice.
Gases below the ice.
Lower gravity worlds with thicker ice could have more of that.
Anyhow that would be rather disappointing universe as far as I am concerned- I like the idea of star traveling civilizations.
Moon’s sidereal spin (in reference to the stars) is a sum of Moon’s around Earth orbital and Moon’s around its axis movements.
–
Since Moon’s sidereal spin is equal to the Moon’s around Earth orbital movement, Moon’s axial spin is zero – Moon does not rotate about its own axis.
–
https://www.cristos-vournas.com
Apart from those few you have become a butt-kisser of, no one will believe you, Vournas.
No one.
Bunny,
It’s not a question of belief – it’s a question of fact.
Just because you don’t believe something, doesn’t mean it isn’t true.
If I recollect correctly, you refused to believe that a Watt is a Joule per second. It made no difference – a Watt is still a Joule per second.
Your response to Christos’ statement about the Moon’s motion sums up your opinion of facts with which you disagree –
“Apart from those few you have become a butt-kisser of, no one will believe you, Vournas.
No one.”
No wonder you can’t name even one person who values your opinion.
Carry on rejecting reality.
Really Flynnson? You thought we needed more of your blather?
“blather
noun
long-winded talk with no real substance.
“all the blather coming out of Washington about crime”
Bunny,
Its not a question of belief its a question of fact.
Just because you dont believe something, doesnt mean it isnt true.
If I recollect correctly, you refused to believe that a Watt is a Joule per second. It made no difference a Watt is still a Joule per second.
Your response to Christos statement about the Moons motion sums up your opinion of facts with which you disagree
Apart from those few you have become a butt-kisser of, no one will believe you, Vournas.
No one.
No wonder you cant name even one person who values your opinion.
Carry on rejecting reality.
“Since Moons sidereal spin is equal to the Moons around Earth orbital movement …”
No. They are only on average equal. The moon’s sidereal spin is constant; the moon’s revolution changes, having the greatest angular velocity at perigee and smallest at apogee. By your own criterion, the moon does rotate — slightly forward and slightly backward each revolution. Which mean you now need a theory for why the moon would do that.
It is much easier and much more consistent to consider revolution and rotation as two independent motions.
“It is much easier and much more consistent to consider revolution and rotation as two independent motions.”
Everyone does. The Earth does both, the moon only revolves.
Exactly, Tim.
Do not forget that Moon Dragon cranks never explain how gravity would propel the Moon:
https://tinyurl.com/what-propels-the-Moon
Anybody have any idea what Little Willy is on about?
Gaslighting Graham gaslights a bit more.
Anybody?
Looks like Bill is once again willing to play the red shirt:
https://www.drroyspencer.com/2022/12/uah-global-temperature-update-for-november-2022-0-17-deg-c/#comment-1410818
Gaslighting Graham should take heed.
Take heed of what? I still don’t understand what exactly it is that you’re asking. Maybe Bill will be able to help you.
Gaslighting Graham soldiers on.
Little Willy falsely accuses.
Gaslighting Graham soldiers on.
Little Willy, please stop trolling.
Somewhere upthread, Robertson, the all-time liar, wrote:
” Dont be stupid, Willard, there is nothing in the works of Meyer related to proof the Moon rotates. I asked the question because Binny keeps insisting there is yet fails to show us what Meyer said about it. ”
*
I have shown all these places in Mayer’s treatise often enough.
And I have also shown what a 100 % lying nonsense it is to claim
” All I saw him discuss was lunar libration. ”
because the word ‘libration’ occurs at EXACTLY ONE PLACE in Mayer’s treatise; this is shown by a search in Google Docs’ processing:
https://books.google.com/books?hl=en&output=text&id=EJqRdI1nLI4C&q=libration&redir_esc=y#v=snippet&q=libration&f=false
*
The translation of this single piece of text:
” Finally, Domenico Cassini came on the right track. It occurred to him to explain this phenomenon, which had hitherto been called the libration of the Moon, by the rotation of the Moon on its axis; and this idea was a fortunate one. ”
*
Will it now suffice to translate the headings of Mayer’s chapters, which mainly deal with the rotation of the Moon around its axis?
A. Original German text
13. Bestimmung der Neigung des Mondäquators gegen die Ekliptik, und des Orts der Äquinoxialpunkten
14. Bestimmung der Zeit in der der Mond sich um die Achse dreht
B. Translation
13. Determination of the inclination of the lunar equator in relation to the ecliptic and the location of the equinox points
14. Determination of the time in which the Moon rotates around its axis
*
It is evident that Robertson never did read anything out of Mayer’s treatise.
And his acolytes (Clint R, Pseudomod DREMT, Hunter, Swenson etc) willingly aid him in his endless lies whenever they can.
Even Vournas is now scavenging that little bit of respect for Science he formerly seemed to have.
Mayer’s contribution was in “mapping” Moon’s surface. NOTHING he did was “proof”, or even evidence, that Moon rotated. In fact, his work revealed the Moon was NOT rotating, as he was never able to map the far side.
He “believed” Cassini, as that was the belief of his time. Newton was the first, as far as I know, to understand that gravity would not cause torque on an orbiting body. His work led to the ball-on-a-string as a model of “orbital motion without axial rotation”, which still stands today.
The cult idiots must deny reality to believe Moon rotates.
Ball on a string didn’t work as a model of the Earth/Moon system.
To stop the two flying apart the string would have to be attached at both ends. This would lock the Earth with one face towards the Moon. The two bodies would revolve around each other like a bolas.
Since an observer on the Moon sees the Earth rotating, the balls on a string model must be wrong.
What an odd argument, Ent. Firstly, the ball on a string is not intended to be an exact model of the Earth/moon system, it’s just a model of “orbital motion without axial rotation” – the same side of the body always faces the inside of the orbit. Secondly, you are missing the point. The analogy is not about the body being orbited, which can rotate or not rotate on its own axis regardless of the orbiting body. You may as well argue that the presence of the string prevents the ball from rotating on its own axis, and so it doesn’t reflect real “orbital motion” where the object is free to rotate on its own axis, or not. That would also be similarly missing the point.
The point is, the ball on a string is a model of “orbital motion without axial rotation”. There is no torque acting about the ball’s own axis, because the string acts through the center of mass of the ball. There is instead a torque about the external axis (the one at the other end of the string) and so the ball “rotates about an external axis with no rotation about an internal axis”. That is “orbital motion without axial rotation”.
“Firstly, the ball on a string is not intended to be an exact model of the Em with Earth/moon system,”
unlike Newton’s actual solution to the actual problem with actual gravity, that behaves very differently from a string.
There is no reason to replace actual gravity with a string that misleadingly constrains distance and orientation, unlike gravity.
LOL!
No Nate nobody here believes the moon is held in place by a string!!!
But such an imaginary moon has some stuff in common with our moon. Namely the moon is held in orbit by gravity and gravity is what causes the moon to always face the earth similar but different to how a string does it.
I can’t believe I have to explain that to you!!
It takes courage to say what even Gaslighting Graham very seldom says, Bill.
Pray tell more about how gravity moves the Moon.
Willard why don’t you explain. When I think of a ball on a string I think of tetherball. And its my fist that moves the ball.
Why should I explain what nobody but a few Moon Dragon cranks believe, Bill?
I certainly can live without you providing an alternative physics.
Its always fun when you mount a defense of spinners by using a non-spinner argument. Such humor is what keeps me around here.
Spinners want gravity to provide the angular velocity to the moon but want to deny it to support their idea that the moon spins on its own axis. I believe the argument started out as acknowledging that gravity provided the angular velocity necessary for a orbit to be a rotation. But being aware that Lorb is not an angular momentum but instead is a plug figure to add to the angular momentum of a spin on the moon’s own axis to arrive at the angular momentum of the moon’s orbital motion.
Its a simple case of breaking down a motion conceptually using a formula for a perfect sphere that provides their conceptual view of the MOTR being orbital motion without axial spin. Indeed a perfect sphere would not have any torque applied to create and orbital rotation beyond causing the moon to orbit as a translational motion instead of a rotation.
But the fact is there are no known MOTRs. So all real world objects are brought into orbital rotation by the force of gravity.
Its a clear cut case of elevating form over substance that is in fact a disease of the mind that most academics possess. Exceptions are persons retired from real world jobs that then transition into teaching and a select few academics that can see beyond their own egos.
Moving graduates beyond this phase is what apprenticeships are all about that graduates go through before earning professional certifications.
An apprenticeship is even required of a plumber to move to the level of professional. Willard though thinks he doesn’t need it because he knows how to use a toilet auger. . . .which is typically not far off from the first job a plumber’s apprentice is assigned. . . .assuming of course the plumber professional actually takes on plumbing maintenance jobs.
“Spinners want gravity to provide the angular velocity to the moon”
No we don’t.
Instead of telling us what we believe, stick to what we post.
You’ve given up your soul for a broken toy? Ball on a string doesn’t apply to the moon.
Moon goes around the sun; not the earth. Earth perturbs its transit so that it appears to go around the earth; sometimes the moon is outside the earth orbit around the sun, sometimes its inside.
The moon rotates around its axis. Any fool can see the sun shines on all aspects of the moon as it rotates. The fact that some of you can’t see that is disturbing.
Lumps of Christmas coal for the lot of you.
The moon orbits the Earth whilst the Earth orbits the Sun. So, in a way, the moon orbits the Sun…but in a more accurate way, the moon orbits the Earth whilst the Earth orbits the Sun.
Applying the ball on a string to the Earth’s orbit around the Sun, the Earth moves like the ball on a string whilst also rotating on its own axis 365.25 times per orbit. This is the “Non-Spinner” view.
Applying the “moon on the right” to the Earth’s orbit around the Sun, the Earth moves like the “moon on the right” whilst also rotating on its own axis 366.25 times per orbit. This is the “Spinner” view.
Ken moves to a new level of perversion.
That’s the advantage of not understanding any of the science, but only making stuff up.
Norman, braindead bob, and Bindidon will be impressed.
DREMT
You are very parochial, thinking as though the Earth is the centre of the Universe.
The rest of the scientific community moved on 500 years ago.
I don’t think as though the Earth is the center of the Universe, though, Entropic Man. Carry on eternally bashing the same straw man, if you wish. It doesn’t bother me.
Great point, EM.
You might like:
https://tinyurl.com/space-station-baseballs
“His work led to the ball-on-a-string as a model of ‘orbital motion without axial rotation’, which still stands today.”
Tee hee hee!
“In fact, his work revealed the Moon was NOT rotating, as he was never able to map the far side”
As the Moon rotates once on its axis per orbit around the Earth no surprise there.
Clint R
” Mayers contribution was in ‘mapping’ Moon’s surface. NOTHING he did was ‘proof’, or even evidence, that Moon rotated. ”
You are intellectually unable to understand what Mayer wrote. You didn’t even read anything of all that. But… I did.
And who has understood Mayer also understands why his lunar cartography was so incredibly much more exact and adequate than all similar work made by e.g. Riccioli or Hevelius.
While the latter two used lunar coordinates affected by optical libration effects, Mayer knew how to get rid of such errors.
*
” He ‘believed’ Cassini, as that was the belief of his time. ”
No, Mayer did NOT believe Cassini. He understood what he did, exactly as Newton: that is something fundamentally different.
If you were (1) able to understand German, (2) able to understand at least basic principles of spherical trigonometry, and (3) willing to read Mayer’s treatise, you would understand how deep was Mayer’s criticism against Cassini AND how much more elaborated his work has been.
But fanatical Flatearthists like you will never be willing to read what might make them doubt what’s coming out of their own insane brain.
*
” Newton was the first, as far as I know, to understand that gravity would not cause torque on an orbiting body. ”
No. Newton never wrote anything like that.
” His work led to the ball-on-a-string as a model of ‘orbital motion without axial rotation’, which still stands today. ”
No. Newton never wrote anything like that. Nowhere in his work will you be able to show such a nonsense.
He was on the contrary convinced that Moon rotates about an internal axis: everyone having a sane brain understands what he wrote about the Moon in his Principia.
*
You belong to the people who deny all that. Only persons with an insane mental behavior like yours will believe your nonsense.
Bindidon, I offered to show you the evidence, if you would stop commenting here for 90 days. You rejected the offer.
The price has gone up. Will you stop commenting here for 120 days.
No, you won’t. You reject learning. Trolling is more important to you than reality.
Dear Doctor Spencer
Please could you just do an article on the Moons Atmosphere so that certain parties can have their own comments page which the rest of us can ignore and concentrate on the data analysis you so kindly provide.
Great idea, Mark.
Meanwhile, there is the Dragon Crank honeypot:
https://tinyurl.com/dragon-cranks-honeypot
For some reason our three dragon cranks prefer to pollute all the threads instead.
Dread Santa Claws is going to dump a ton of coal on boring trolls.
No energy shortage for the wicked. Not even the extremely wicked.
Yes, Kennui.
And from from their condo views in their retirement villages Troglodytes will not see the mountaintops getting removed. The circle of life will then be complete:
https://youtube.com/watch?v=QlOmDSqdnAg
Is that still going?
Audits never end, EM.
Somehow the existence of the argument under multiple articles is only the fault of one side of the debate…
Circular ass debates have no ending
https://i.postimg.cc/brsTScRP/think-tank.png
What especially never ends, you asshole, is your endless fecal fixation.
And what also never will end is your absolute cowardice: you post this disgusting stuff ONLY BECAUSE THIS BLOG HAS NO MODERATION.
If you had balls between the legs, you would try to post the same link at Anthony Watts’ WUWT or at Judith Curry’s Climate Etc!
And there, you would experience within one hour what you merit here since longer time.
Suddenly Bindiclown recognised himself as being one of the circular ass debater
This reply, originating from a person mentally aged about 12 years, was 100 % predictable (unlike La Nina’s or SC25’s behavior).
You are exactly the same kind of idiot as all those you laugh about on this blog.
about 12 years, LOL,
Look who is trowing tantrums in the chat-board because somebody posted something funny
no climate catastrophe looming climatologist Dr J Christy debunks the narrative
https://youtu.be/qJv1IPNZQao
👽
Nope, he did not debunk anything. You just heard what you wanted to believe.
It seems to me, that if global temperature lowered by .5 C, it
could count as catastrophic.
If Dr J Christy is correct and it will be warming by .5 C in coming decades that sound nice, but I doubt it will happen.
It seems likely we will return to a period of no warming over the last few decades, but unlikely that last forever- it tends to go up or down, eventually.
I see no reason to change my mind, that we have recovered from the Little Ice Age, but I don’t think we return to LIA conditions within
a century or even two.
.5 C in coming decades ???
According to Low Entropy man we will be at .5 C in two weeks.
https://www.drroyspencer.com/2022/05/uah-global-temperature-update-for-april-2022-0-26-deg-c/#comment-1267697
Probably not. I failed to anticipate the triple dip La Nina.
Grand Solar Minimum Update
https://www.insurancebusinessmag.com/ca/news/columns/everything-we-witness-should-be-a-call-to-action-430596.aspx
Contrarians should consult with their insurer for more details.
Elon Musk’s Unbelievably Simple 12-minute Killer Break Down on Climate Change
https://youtu.be/xKCuDxpccYM
Giving government more money, doesn’t solve anything.
What does a 2 degree increase mean? first C or F.
Second 2 degrees warmer than coldest time in little Ice Age- the coldest time in thousands of years. Or 2 degree warmer [whether F or C] from global average temperature of about 15 C?
For last 40 years we have been increasing by .13 C per decade which if continue for another 40 years: .13 times 4 = 0.52 C.
I would bet that it will continue at .13 C per decade or lower to .12
who think it will rise to .14 C or will continue at .13 C per decade.
It has at times risen to .14 C per decade.
Let’s say it does rise to .14 C per decade:
.14 times 4 = 0.56 C in 4 decades.
If talking about 15 C rising to about 17 C, it seems to suggest that
increasing to .14 C per decade or more is a near certainty.
I am quite old, and global average temperature was said to be about 15 C, and it was going rise to 17 C or warmer, and it didn’t. Also sea levels were going rise by 1 meter, and it didn’t happen.
When do imagine global temperature will rise to 17 C?
Or in terms of sea level, when is going add 1 foot?
Or if you want, 1 meter?
Musk is saying 2 C increase in global temperature. Average of 15 C
to 17 C. He was brainwashed and might remain brainwashed.
It did happen is last 6 years. We have been flat for 8 years- we went from .14 C to .13 C per decades within that short period of time or
the short term trend of a time 6 years ago didn’t happen.
Of course US consumer does and has for decades paid a gasoline tax, which was suppose to support improvement on roads and the roads have worsen. And governments have considering taxing electric cars for their road use. Cigarettes likewise have always to been taxed, but have being taxed, and were promised better health care- that hasn’t happenned. Oil is taxed when taken from the ground, Alaska pay it’s citizens a monthly amount from this taxation. Are talking about something like what Alaska does. Apparently Biden was against more oil mining in Alaska, but want to buy foreign oil. In oil producing countries they sell their gasoline at subsidize price- perhaps Musk should be against that.
Government have wasted trillions of dollar on solar and wind energy and and trillions have given us much electrical power nor reduced CO2 emission.
But what most important is billions of people don’t use much electrical power or use much fossil fuel. And have China burning over 4 billion tons of coal per year rather using more natural gas.
US has lower it’s CO2 emission by using more natural gas.
And Musk is using natural gas for his Starship, or one could say Spacex is transiting from kerosene to Methane. He didn’t need a tax on Kerosene in order to make this transition.
I think Elon is watching TSLA ticker. He is now the second richest in the world. Let’s do a carbon tax, he says. No objectivity there.
Bernard Arnault’s net worth of $172B and Musk is $160.9 billion.
“Bernard Jean tienne Arnault (French:[bɛʁnaʁ ʒɑ̃ etjɛn aʁno]; born 5 March 1949) is a French business magnate, investor, and art collector. He is the co-founder, chairman, and chief executive of LVMH Mot Hennessy Louis Vuitton SE, the world’s largest luxury goods company. Arnault is the richest person in the world.
https://en.wikipedia.org/wiki/Bernard_Arnault
Bernard is not trying to get us to the Moon.
Looks like Elon is getting himself busy:
https://www.cnn.com/2022/12/15/media/twitter-musk-journalists-hnk-intl/index.html
Musk does do many significant attempts, and looks like he going to make the high level rocket launches he wanted this year.
But is having more problems with launching the Starship then he thought would have.
I quite curious whether it will work.
I happen to think making a city on Mars will be much harder.
I have many suggestions regarding the general topic.
I think we have to find out how to make artificial gravity
work and I think you have make lakes on Mars to Mars settlements.
It also seems the Moon could work as test bed for Mars.
Or NASA is largely using the Moon as testbed for Mars exploration
and likewise to seems the Moon can be using as training area
for future Mars settlers- though would depend on whether the Moon
has mineable water.
If Moon has mineable water it allows the Moon to be used for many
things. The Moon is a place to “live” but it place to stay for month or more.
Or as I have said, the Moon is place that people living on Earth, can work, and only need a few people staying on lunar surface.
But related to Mars, a lot people could stay on Moon, before they go to Mars to live.
Or Musk thinks a lot people die trying make Mars someplace to live and if you people first training on the Moon- less could die on Mars,
The simplifier-in-Chief simplified the rulebook:
https://www.theguardian.com/technology/2022/dec/16/twitter-rulebook-elon-musk-banning-journalists
“Twitters rulebook is simpler: dont annoy Elon Musk.”
I don’t do twitter, but if I did, I might annoy Elon.
Willard do you do twitter?
It seems you would like twitter a lot.
I guessing you do, and do a lot of it, so, have you tried annoying Elon?
I imagine a lot people might ask him, why he hasn’t put a greenhouse on Mars, yet.
Or how the shortage of those oil platforms, going?
I would suggest he needs floating breakwaters for his oil platforms.
Or ocean settlements are easier than Mars settlements.
Chihuahua might tell Elon to “go have a sammich” and get banned.
What else is Musk going to say? He sells electric cars for a living, do you expect him to say climate alarm is bs?
Thanks, Tyson.
If only we had a twitter account to track Elons jet excursions:
https://www.rollingstone.com/politics/politics-news/twitter-suspends-account-tracking-elon-musk-private-jet-1234647211/
Perhaps he needs to understand his own guidelines about doxxing first.
(No, Elon, publicly available information does not count.)
Does Elon have jet excursions? He works all the time.
If Elon worked all the time, Troglodyte, his employees could not get things done while he lords on Twitter.
Thank God he has your attention, for who knows what would happen if he did not!
Way above, I see Fraudkerts is attempting more fraud:
https://www.drroyspencer.com/2022/12/uah-global-temperature-update-for-november-2022-0-17-deg-c/#comment-1410757
He’s now trying claim a swivel chair is “proof” Moon is rotating, I guess.
I’ll add his swivel chair to the list of crap the cult has thrown against the wall.
To debunk his crap, just put the swivel chair on the edge of a carousel. As the carousel turns, a rotating swivel chair will present all sides to the center of the carousel. If the chair is NOT rotating, only one side will be visible from the carousel center.
[Tim is already dreaming up a "frictionless axle" for the swivel chair as we speak]…
DREMT,
It won’t do him any good if the frictionless axle passes through the COM. An observer seated in the chair, facing the carousel’s axis of rotation, will continue to face it, regardless of whether the carousel moves or not. Just like an observer on the Moon, looking along a line directed at the Earth’s COM.
It seems that the SkyDragons have given up on global warming, the GHE, and suchlike.
I don’t blame them – it’s hard defending the indefensible.
What are you braying about, Mike?
It is as if you never did any physics in your life.
Life long and prosper.
Wondering Wee Willy,
This might help –
“DREMT,
It wont do him any good if the frictionless axle passes through the COM. An observer seated in the chair, facing the carousels axis of rotation, will continue to face it, regardless of whether the carousel moves or not. Just like an observer on the Moon, looking along a line directed at the Earths COM.
It seems that the SkyDragons have given up on global warming, the GHE, and suchlike.
I dont blame them its hard defending the indefensible.”
If you have any questions – just ask. Ill just laugh in your face, of course, because you are such an incompetent troll!
Try it and see.
Mike, Mike,
What are you braying about?
Wondering Wee Willy,
This might help
DREMT,
It wont do him any good if the frictionless axle passes through the COM. An observer seated in the chair, facing the carousels axis of rotation, will continue to face it, regardless of whether the carousel moves or not. Just like an observer on the Moon, looking along a line directed at the Earths COM.
It seems that the SkyDragons have given up on global warming, the GHE, and suchlike.
I dont blame them its hard defending the indefensible.
If you have any questions just ask. Ill just laugh in your face, of course, because you are such an incompetent troll!
Try it and see.
Mike Flynn,
Copy-paste your comment again.
Whickering Wee Willy,
You wrote –
“Mike Flynn,
Copy-paste your comment again.”
No.
What are you going to do about it? Throw a tantrum, perhaps?
Don’t blame me if you suffer from learning difficulties.
Idiot.
What are you braying about, Mike?
Little Willy, please stop trolling.
When Flynnson posts pointless nonsense, he repeats it 3 times.
He believes he is some kind of wizard, and blather repeated 3 times is transformed, magically, into sensible facts with a point.
I think his wand needs new batteries.
Here we go again, another duplicate comment error with no original showing up.
nate….”The Moon is an independent body with no constraint on its rotation. Thus it is best described as rotating on its own axis while translating on an ellip.tical path around the Earth”.
***
You’re nearly there, Nate, persist! Visualize the translation along an ellip.tical path. There is no need for the Moon to rotate on an axis since doing so would cause the Moon to show all sides to the Earth during one such rotation. The Moon can do that without rotating about a local axis, it can keep the same side pointed at Earth while changing the orientation of the near face wrt the stars.
I agree that the motion of the Moon is different than a ball on a string or a locomotive running around a circular track. The forces are different, however, the overall result is the same. If you have a locomotive running CCW around a circular track, how would rotate it to start it running CW around the track?
You’d need a turntable to ***rotate it*** about its COG. There is no other way whatsoever to rotate the locomotive 180 degrees other than lifting it with a crane. Yet the overall motion of the locomotive is the same as the Moon, both performing curvilinear translation.
By the same token, if you had a car running around a track, and the track was very narrow with walls ether side so the car could not turn either way from straight-ahead, it could not possibly rotate about a local axis, it would be like the locomotive confined to its tracks.
part 2…
“Adding to the force of this argument are several other facts. If the Moon were somehow BEHAVING like a body bolted to a rotating frame, then the frames rotation rate would need to increase and decrease which would cause the Moons rotation rate to do likewise, but it doesnt, and this causes longitudinal libration. and the frame would need to stretch and contract”.
***
Remember, you cannot compare, kinematically, a wooden horse bolted to a carousel and the Moon in its orbit. For one, the wooden horse is driven by the carousel floor but the Moon always has its own constant linear momentum. The Moon’s linear motion is independent of the Earth’s gravitational field but the horse is constrained to follow the carousel floor. In a similar manner, the Moon is constrained to follow an ellip.tical orbit due to gravity, but gravity varies and the Moon is able to stretch the path into an ellipse.
The Moon’s linear velocity does not change. You are confusing speed with tangential velocity. The Moon has a constant linear velocity/momentum and the only way to change a constant linear momentum is by adding a linear force in the direction of motion or opposite to it.
When it is claimed the Moon speeds up, that is incorrect. It simply covers more ground per unit time at the same velocity. That’s because Earth’s gravitational field strength varies slightly over the orbit, allowing the Moon to expand the path into an ellipse.
The ellip.tical orbital shape is created as a resultant between the Moon’s linear velocity and the Earth’s gravitational force. If during the orbital period, the ratio changes, by gravity being slightly reduced, the lunar momentum has more effect and the Moon travels farther.
***
Longitudinal libration is an effect related to the angle of the lunar near face to the Earth at the principal focal point of the ellip.tical path. With a pure, circular orbit, a radial line between Earth and Moon would always coincide. However, with an ellip.tical path, the radial lines only coincide at either end of the major axis.
In-between, a radial line from the Moon’s near-side tangential plane points away from Earth’s centre by a few degrees, allowing us on Earth to see more around the longitudinal edge of the Moon. That is longitudinal libration.
part 3…
“The Moons rotation is observationally around an axis that is tilted 6.7 degrees. So again this cannot be explained by a bolted on a frame model”.
***
There is no such axis, it is defined based on other factors. The Moon has no rotational axis because it doesn’t rotate.
No more than Robertson’s usual egomaniac, absolutely scienceless trash.
The longer Robertson’s posts, the less relevant they will be.
Be 100 % sure that in three days or two weeks or one month, he will again post his mentally insane lies like
” Dont be stupid, Willard, there is nothing in the works of Meyer related to proof the Moon rotates. I asked the question because Binny keeps insisting there is yet fails to show us what Meyer said about it. ”
*
Robertson always ignores when he was proved wrong – regardless what it was about.
Still no proof from Binny that Meyer talks about lunar rotation to any degree.
And here we see the LIAR Robertson full at work.
Thus I repeat what I wrote above.
*
Somewhere upthread, Robertson, the all-time liar, wrote:
” Dont be stupid, Willard, there is nothing in the works of Meyer related to proof the Moon rotates. I asked the question because Binny keeps insisting there is yet fails to show us what Meyer said about it. ”
*
I have shown all these places in Mayers treatise often enough.
And I have also shown what a 100 % lying nonsense it is to claim
” All I saw him discuss was lunar libration. ”
because the word ‘libration’ occurs at EXACTLY ONE PLACE in Mayer’s treatise; this is shown by a search in Google Docs’ processing:
https://books.google.com/books?hl=en&output=text&id=EJqRdI1nLI4C&q=libration&redir_esc=y#v=snippet&q=libration&f=false
*
The translation of this single piece of text:
” Finally, Domenico Cassini came on the right track. It occurred to him to explain this phenomenon, which had hitherto been called the libration of the Moon, by the rotation of the Moon on its axis; and this idea was a fortunate one. ”
*
Will it now suffice to translate the headings of Mayers chapters, which mainly deal with the rotation of the Moon around its axis?
Or will it not, Robertson?
A. Original German text
13. Bestimmung der Neigung des Mondäquators gegen die Ekliptik, und des Orts der Äquinoxialpunkten
14. Bestimmung der Zeit in der der Mond sich um die Achse dreht
B. Translation
13. Determination of the inclination of the lunar equator in relation to the ecliptic and the location of the equinox points
14. Determination of the time in which the Moon rotates around its axis
*
It is evident that Robertson never did read anything out of Mayer’s treatise.
Come on, Gordo.
Mayer.
Not Meyer.
Mayer.
Still waiting for your bet, btw.
Are you a little chicken?
Willard
Naming Robertson a ‘little chicken’: that is as if you would insult all ‘little chicken’s on Earth.
Do they merit that?
Bindidon, your quotes from Mayer only indicate he believed Cassini’s nonsense. We already know your cult believes Cassini’s nonsense. What you need to provide is the science to justify your beliefs. You can’t do that.
The simple ball-on-a-string destroys your cult beliefs. (Even Fraudkerts swivel chair destroys your cult beliefs.)
You’ve got NOTHING.
Similar offer to you, Pup –
You stop commenting for 90 days on this site and I will tell you if Mayer mentions spin.
That or you do the Pole Dance Experiment.
Deal?
Clint R
” What you need to provide is the science to justify your beliefs. ”
Don’t try to kid us with your nonsense.
Firstly, what I became convinced of has nothing to do with ‘belief’.
Furthermore, you perfectly know that you yourself live in a 100 % denial cult within which any real science you don’t understand is woefully denigrated.
Regardless what I post: you will anyway reject it.
Keep ball-on-a-string–ing as strong as you can, Clint R! That’s the very best for you, isn’t it?
Weird Wee Willy,
You wrote –
“Similar offer to you, Pup
You stop commenting for 90 days on this site and I will tell you if Mayer mentions spin.
That or you do the Pole Dance Experiment.
Deal?”
Another “offer”? Another “deal”? Another puerile attempt at being gratuitously offensive?
How are you going with that – are you getting anybody taking you up on your “offers” or “deals”? No?
Hardly surprising. I suppose. Who accord respect to an incompetent, impotent, troll?
Not me, thats for sure!
What are you braying about, Mike Flynn?
Witless Wee Willy,
I assume you are trying to troll, but maybe you really are a slow learner of limited intellect, so –
Wonky Wee Willy,
You wrote
Exactly, Tim.
Do not forget that Moon Dragon cranks never explain how gravity would propel the Moon:
What are you braying about Willy? You must be taking lessons from other SkyDragon donkeys or you are simply so ignorant that you believe the Moon is propelled around its orbit by celestial beings?
Give everyone a laugh how do you explain the Moons motion? How hard can it be? Surely you arent just posing witless gotchas in the true SkyDragon tradition, are you?
Carry on looking stupid.
Bindidon, all of your long, rambling comments, beliefs, and ancient astrologers are destroyed by the simple ball-on-a-string.
That’s why this is so much fun.
Mike Flynn,
What are you braying about?
Perhaps you should copy-paste your comment again.
Everybody will skip it.
Cheers.
Witless Wee Willy,
You wrote –
“Mike Flynn,
What are you braying about?
Perhaps you should copy-paste your comment again.
Everybody will skip it.
Cheers.”
Everybody will skip it?
Well, maybe not you. but thank you for your request that I repost my comment. Here you go –
Wonky Wee Willy,
You wrote
Exactly, Tim.
Do not forget that Moon Dragon cranks never explain how gravity would propel the Moon:
What are you braying about Willy? You must be taking lessons from other SkyDragon donkeys or you are simply so ignorant that you believe the Moon is propelled around its orbit by celestial beings?
Give everyone a laugh how do you explain the Moons motion? How hard can it be? Surely you arent just posing witless gotchas in the true SkyDragon tradition, are you?
Carry on looking stupid.
Copy-paste your comment again, Mike.
Wee Willy Wanker,
No. Why should I?
Because you always do, Mike.
You got nothing else going for you.
Woebegone Wee Willy,
You wrote –
“Because you always do, Mike.
You got nothing else going for you.”
Oh dear, fool. Is that the best you can do, or is it all you have?
You haven’t managed to explain why the Earth managed to cool for four and a half billion years or so, in spite of the mythical GHE during that time! I suppose that’s why you are reduced to pleading with me to answer your questions.
Tough luck, Willy. I do as I wish, when I wish, and how I wish.
Get used to it, nitwit.
Good boy.
Little Willy, please stop trolling.
“It simply covers more ground per unit time at the same velocity. ”
Would you care to rephrase that?
ent…”It simply covers more ground per unit time at the same velocity.
***
It’s a simple statement that should be obvious. First, you need to understand the interaction between the Moon and Earth’s gravitational field. The Moon moves with a constant linear velocity. The only way to increase that velocity is to apply a force in the direction of the velocity vector. Or, you could slow it down by applying a force in the opposite direction.
The curvature of the Earth is such that it drops off 5 metres for every 8000 metres covered. If Earth’s gravity acts on the Moon to accomplish that ratio, the Moon will remain in orbit. In other words, if gravity can cause the Moon to lose 5 metres altitude per 8000 metres covered by the Moon, the Moon will remain in orbit. That’s a circular orbit, however.
To achieve an elliptical orbit, there would need to be a variation in the 5 metres drop in altitude. Since the Moon has a constant velocity, that means gravity has to vary slightly, so that a bit less than a 5 metres drop happens. Then the Moon will travel more in an elliptical orbit.
So, think about s = vt again. v is constant but s is allowed to increase due to a very slightly reduced gravitational force. In other words, as gravity is reduced, the Moon’s momentum has a greater effect and the Moon travels farther, elongating the orbit. Velocity remains constant but distance and time increase.
If the orbit was purely circular that would not happen. There would be no libration either.
Wait, Gordo.
Are you telling me that you swirl the ball on string at constant velocity?
I would like to see that.
Little Willy, please stop trolling.
“It simply covers more ground per unit time at the same velocity. ”
Seriously? Now you even question distance = velocity x time?
tim…what happens with s = vt if v remains constant and time increases? You go farther, right? Distance increases.
I have explained this to you. If the Moon has a constant momentum, and the gravitational field weakens slightly, it allows the Moon to elongate the orbit, meaning it goes farther at the same velocity and takes more time to cover that distance.
I also told you I was talking about an average ‘speed’, not a vector quantity.
angech
You wrote above:
” Long term trends over 3 to 4 weeks suggest our standard error estimations are way off.
Ice growth or loss is a lot more volatile than most realise. ”
But… weren’t you the one who insisted these days on daily differences?
*
Years ago, I only published monthly data and switched to daily due to some people’s interest.
Moreover, you are on this blog the first person mentioning ‘expressis verbis’ sea ice area (aka 100 % pack ice). Most know only about extent data.
*
Here are the monthly time series for NSID~C’s sea ice extent & area data
– in the Arctic
https://drive.google.com/file/d/1V3ES4AgH6e2cJUuYVdDpknvtb7RAeePt/view
and
– in the Antarctic:
https://drive.google.com/file/d/1kZTBwTO3nQrYgxuU46GrJ5xRX1MY4J4Y/view
*
Source
https://tinyurl.com/yc46bp29
https://tinyurl.com/2r2z3fxy
But werent you the one who insisted these days on daily differences?
–
Meh.
I was only pointing out that sea ice is quite measurable in area and extent with satellite data [despite the fact that volume might not be reflected from that data].
–
I am quite happy to be informed by people like yourself who put the effort into looking at these things even though I am philosophically opposed to some of your interpretations of the data.
–
CO2 exists and has been increasing.
I do not care if it is a plant food.
The data collected around the world shows some global warming.
The best amount and extent of data comes from satellites.
GHG mainly H20, exist in the atmosphere.
The climate is variable, multi factorial and dependent in a large part on the heating from the sun.
–
The jury is out on human causation of problems but a verdict has been decreed.
You and I might live long enough to see a turnaround in global warming emphasizing natural variability or a continuation of the current warmth which due to its short nature lacks attribution.
–
Thank you for the references.
angech…”I am quite happy to be informed by people like yourself …”
***
Major mistake, Binny, is a major dumbass on this blog. He fakes graphs to make it appear as if the UAH data is the same as NOAA data.
Solar activity is increasing and index Nino 3.4 is falling.
https://www.tropicaltidbits.com/analysis/ocean/nino34.png
Ren,
The BOM gives 7 predictions.
It used to give 8 but dropped the one showing La Nina high probability 2 years ago.
Strange to think it is going up when they all predict near El Nino in 5 months.
What do you know that they don’t.
Fingers crossed hoping for a 4th La Nina.
Not all models predict El Niňo, Some predictions tun back downward from April or so.
Wonky Wee Willy,
You wrote –
Exactly, Tim.
“Do not forget that Moon Dragon cranks never explain how gravity would propel the Moon:”
What are you braying about Willy? You must be taking lessons from other SkyDragon donkeys – or you are simply so ignorant that you believe the Moon is “propelled” around its orbit by celestial beings?
Give everyone a laugh – how do you explain the Moons motion? How hard can it be? Surely you arent just posing witless gotchas in the true SkyDragon tradition, are you?
Carry on looking stupid.
Mike Flynn,
What are you braying about?
Wee Willy Wanker,
Thank you for your polite request. Here –
Wonky Wee Willy,
You wrote
Exactly, Tim.
Do not forget that Moon Dragon cranks never explain how gravity would propel the Moon:
What are you braying about Willy? You must be taking lessons from other SkyDragon donkeys or you are simply so ignorant that you believe the Moon is propelled around its orbit by celestial beings?
Give everyone a laugh how do you explain the Moons motion? How hard can it be? Surely you arent just posing witless gotchas in the true SkyDragon tradition, are you?
Carry on looking stupid.
Mike Flynn,
Just *what* are you braying about?
Witless Wee Willy,
I typed this slowly, just for you –
Wee Willy Wanker,
Thank you for your polite request. Here
Wonky Wee Willy,
You wrote
Exactly, Tim.
Do not forget that Moon Dragon cranks never explain how gravity would propel the Moon:
What are you braying about Willy? You must be taking lessons from other SkyDragon donkeys or you are simply so ignorant that you believe the Moon is propelled around its orbit by celestial beings?
Give everyone a laugh how do you explain the Moons motion? How hard can it be? Surely you arent just posing witless gotchas in the true SkyDragon tradition, are you?
Carry on looking stupid.
Mike Flynn,
You have not typed your comment.
You simple copy-pasted it.
So what are you braying about?
Witless Wee Willy,
You’ll have to do better than that, you idiot.
Try explaining how the Earth managed to cool for four and a half billion years or so – GHE notwithstanding!
Can’t do it, can you?
Poor Wee Willy – no wonder all your opinions (plus five dollars) will get you a five dollar cup of coffee.
Mike Flynn,
What.
Are.
You.
Braying.
About?
Witless Wee Willy,
Youll have to do better than that, you idiot.
Try explaining how the Earth managed to cool for four and a half billion years or so GHE notwithstanding!
Cant do it, can you?
Poor Wee Willy no wonder all your opinions (plus five dollars) will get you a five dollar cup of coffee.
Copy-paste once more, Mike.
Little Willy, please stop trolling.
Whining Wee Willy,
You wrote –
“Mike Flynn,
You have not typed your comment.
You simple copy-pasted it.”
You idiot – just another unsupported SkyDragon assertion, is it? Oh dear, you are scratching around at the bottom of the barrel, aren’t you? However, if you prefer to be told you are reading something copied and pasted, here you go (I pasted it r-e-a-ll-y, r-e-a-ll-y slooooowly for you) –
Wee Willy Wanker,
Thank you for your polite request. Here
Wonky Wee Willy,
You wrote
Exactly, Tim.
Do not forget that Moon Dragon cranks never explain how gravity would propel the Moon:
What are you braying about Willy? You must be taking lessons from other SkyDragon donkeys or you are simply so ignorant that you believe the Moon is propelled around its orbit by celestial beings?
Give everyone a laugh how do you explain the Moons motion? How hard can it be? Surely you arent just posing witless gotchas in the true SkyDragon tradition, are you?
Carry on looking stupid.
What are you braying about, Mike Flynn?
Whinnying Wee Willy,
What particular form of mental defect leads you to think that either Mike Flynn or myself owe you an answer?
Keep asking, I will keep laughing at you!
Off you go, now!
Mike Flynn,
It is hard to explain to you, for it is called evidence.
You also asked me at least ten times already,
So ask again!
Little Willy, please stop trolling.
Bindidon’s response to something or other –
“What especially never ends, you asshole, is your endless fecal fixation.
And what also never will end is your absolute cowardice: you post this disgusting stuff ONLY BECAUSE THIS BLOG HAS NO MODERATION.
If you had balls between the legs, you would try to post the same link at Anthony Watts WUWT or at Judith Currys Climate Etc!
And there, you would experience within one hour what you merit here since longer time.”
Slightly incoherent, but Binny seems to be of a distinctly sauerkraut disposition at times, so his incoherency is understandable. I suppose Binny is annoyed that he is powerless to censor what anyone says here, and annoyed that Dr Spencer moderates with a light touch, if at all.
I support unfettered free speech, but alas, the laws of the US don’t (nor the UK, nor any other country that I can think of.) I wouldnt be surprised if Dr Spencer lightly censors here and there – in accordance with threats of legal action from “offended” parties, and various authorities.
Neither censorship nor torture have proved effective in the long run, but both are supported by every government in one way or another. Dr Spencer’s blog is a tiny whiff of fresh air in the general miasma of oppression and attempted thought control which surrounds us.
Oh well, if people want to put their thoughts on the Moon’s motion, I can give mine on something else, surely?
Mike Flynn,
If Moon Dragon cranks want to chime in, there is always the honeypot:
https://tinyurl.com/dragon-cranks-honeypot
What are you waiting for, and what are you braying about?
Wee Willy Wanker,
If Mike Flynn wants to respond, I suppose he will.
As for myself, why should I?
Mike Flynn,
Sorry, but I got to ask –
What are you braying about?
Wee Willy Wanker,
If Mike Flynn wants to respond, I suppose he will.
As for myself, why should I?
Mike, Mike,
*You* are Mike Flynn.
So what are *you* braying about?
Weird Wee Willy,
You wrote –
“Mike, Mike,
*You* are Mike Flynn.
So what are *you* braying about?”
I suppose that if you are referring to Mike Flynn, then obviously he is he.
Have you confused yourself?
More relevantly, have you managed to work out how the Earth managed to cool over the last four and a half billion years or so, GHE notwithstanding? No?
That would explain your fixation with Mike Flynn. Avoiding having to face reality, is that it?
Carry on.
You still are copy-pasting comments, Mike.
What are you braying about?
Weird Wee Willy,
You wrote
Mike, Mike,
*You* are Mike Flynn.
So what are *you* braying about?
I suppose that if you are referring to Mike Flynn, then obviously he is he.
Have you confused yourself?
More relevantly, have you managed to work out how the Earth managed to cool over the last four and a half billion years or so, GHE notwithstanding? No?
That would explain your fixation with Mike Flynn. Avoiding having to face reality, is that it?
I do as I wish, whether you approve or not. I don’t need the approval of an idiot, do I?
Carry on.
Copy-paste your comment once again, Mike Flynn.
Little Willy, please stop trolling.
binny is an ignorant Kraut. He whines about moderation then comes on Roy’s site and uses vulgar language.
You can always tell a troll loser by the way he conducts himself. I have referred to Binny as an idiot for years because that’s exactly how he behaves.
I am still waiting for him to show where Meyer proves the Moon rotates on a local axis. I won’t hold my breath. In his paper he refers to a centrifugal force in relation to the Moon’s motion. People like Meyer and Cassini make a blank statement that the Moon rotates on an axis but they provide no proof for their claims.
The amazing part is how a grown man can cry like a little kid. If you happen to contradict Binny, he has a major conniption. He gets so bent out of shape, he simply cannot respond to the point that got him so far out of shape.
Think of your ball on a string.
Centrifugal force is the outward force tensioning the string. Because of its inertia the ball would move away in a straight line without the string.
Centripetal force is the inward force pulling the ball into circular motion.
If the ball is revolving at a constant rate the centrifugal force and centripetal force will be equal and opposite.
The Moon’s orbit is a similar balance between the centrifugal force due to inertia and the centripetal force due to gravity.
Now consider the Earth. The surface is pulled inwards by the centripetal force of gravity. At the Equator the surface is also subject to outward centrifugal force due to Earth’s rotation. This distorts the planet into an oblate spheroid, bulging the Equator and flattening the poles.
Now consider the Moon. It is also an oblate spheroid because it’s rotation exerts centrifugal force on its Equatorial surface.
Because it rotates once an orbit the sun-Earth point has a tidal bulge. That point is moving slower than orbital speed so centripetal force is slightly greater than centrifugal force an there is a net force towards Earth. Similarly the surface furthest from Earth also bulges because there is a slight excess of centrifugal force.
Now consider
Nice try, but…
https://astronomy.com/news/2018/02/the-moons-equatorial-bulge-hints-at-earths-early-conditions
…the moon’s equatorial bulge is twenty times what it should be given that they erroneously think it rotates on its own axis only once per orbit of the Earth. So it doesn’t prove the moon is rotating on its own axis, it only hints that maybe it was once rotating on its own axis, and fast. The bulge that remains now is supposedly a “fossil bulge” from that earlier time.
” … given that they erroneously think it rotates on its own axis only once per orbit of the Earth. ”
Nice try too, but… as usual, you intentionally misrepresent the article you posted the link to.
What was written shows your insinuation / manipulation:
1. ” Although the Moon looks quite spherical from the ground, it is flatter at its poles and wider at its equator, a trait known as an equatorial bulge. This characteristic is common; it’s usually caused by an object’s rotation around its axis. However, it’s been noted that the Moon’s bulge is about 20 times larger than it should be given its rotational rate of once per month. ”
*
2. ” Due to its close proximity to Earth, the early Moon was much hotter and had a higher rotational rate than it does today optimal conditions for a heavy, prominent bulge to form. As the Moon retreated from Earth, its decreased rotation and temperature caused the bulge to gradually reduce in size. ”
*
Conclusion: there is not a bit of a hint that the Moon no longer rotates.
It is what you endlessly try to suggest, while never having been able to scientifically contradict all these hundreds of scientists who computed its rotation period since centuries.
"…as usual, you intentionally misrepresent the article you posted the link to"
I misrepresent nothing, Bindidon.
"…there is not a bit of a hint that the Moon no longer rotates."
I’m not saying that the article hints that the Moon no longer rotates. The article is 100% written from the "Spinner" point of view. I’m not suggesting otherwise. I am not presenting it as evidence that the moon does not rotate on its own axis.
I’m presenting it because it refutes Entropic Man’s argument, and for no other reason.
“The article is 100% written from the “Spinner” point of view.”
Since 99.9999% of articles and peer reviewed publications about the motions of the Moon are written “from the ‘Spinner’ point of view”, you may as well call it the scientific consensus point view, no?
Call it what you want. "Spinner" vs. "Non-Spinner" works fine for names that don’t introduce bias to the debate.
Entropic Man’s point was refuted, and that is all that needs to be discussed in this sub-thread.
“Let’s just wait and see what” Entropic Man “says.”
Meanwhile you may want to re-read your linked article. It may not say what you think it says!
I’ve re-read the article, and I’m happy with what it says, in that what it says refutes Entropic Man’s point.
The moon’s equatorial bulge is supposedly a "fossil bulge" from an earlier time when the moon was rotating on its own axis at a rapid rate. Thus it is a relic from a time that both "Spinners" and "Non-Spinners" would agree that the moon was rotating on its own axis…and because it’s only a relic from that time, it says nothing about whether the moon is currently rotating on its own axis, or not.
Got it!
…which is a "given" that "Non-Spinners" do not agree with, obviously.
…and, that changes nothing about Entropic Man’s point being refuted.
As DREMT has pointed out, the article contains the phrase “fossil bulge”.
TM and Bin, do you deny the article contains the phrase “fossil bulge”?
[GASLIGHTING GRAHAM] Nice try, but.
[ALSO GASLIGHTING GRAHAM] I am not saying the article hints that the Moon no longer rotates.
He means *spins* here, and so tripped up on his own confusing and inconvenient terminology.
The article refutes Entropic Man’s point, and it does not need to provide evidence that the moon does not spin in order to do so.
Of course the paper only reinforces the point that tidal bulges are caused by spin.
So Gaslighting Graham will try to armwave his way out of another misreading.
As Entropic Man agrees, below, the article refutes his point, and it does not need to provide evidence that the moon does not spin in order to do so.
And now Gaslighting Graham misrepresents what EM conceded.
He soldiers on.
No, I misrepresent nothing.
"Well spotted. The anomalous large equilateral bulge is evidence that the Moon once rotated faster than it does now.
It doesn’t help with the disagreement over whether the Moon makes 1 rotation per orbit or 0 rotations per orbit."
Which is exactly what I was saying. EM and I agree. Please stop trolling.
And so Gaslighting Graham gaslights a bit more:
https://www.drroyspencer.com/2022/12/uah-global-temperature-update-for-november-2022-0-17-deg-c/#comment-1411369
While EM holds that the bulge is caused by the spin. He denies it, not without distancing himself from the Moon Dragon cranks position, mind you.
What a great agreement that is!
Moon Dragon cranks still owe themselves an explanation as to how the Moon stopped from spinning completely.
The moon’s equatorial bulge is supposedly a "fossil bulge" from an earlier time when the moon was rotating on its own axis at a rapid rate. Thus it is a relic from a time that both "Spinners" and "Non-Spinners" would agree that the moon was rotating on its own axis…and because it’s only a relic from that time, it says nothing about whether the moon is currently rotating on its own axis, or not.
The slowing of the moon’s rotation to what the "Spinners" think of as 1 spin per orbit and the "Non-Spinners" think of as zero spins per orbit is said to be due to the tidal locking mechanism.
[EM] Because it rotates once an orbit the sun-Earth point has a tidal bulge.
[GG] the [M]oon’s equatorial bulge is twenty times what it should be
[LAPLACE] I understood that reference!
[TYSON] Given its actual spin of one rotation per orbit, yes.
[GG] Of course but look at my if-by-whiskey.
Here’s the damn paper:
https://agupubs.onlinelibrary.wiley.com/doi/full/10.1002/2017GL076278
When Moon Dragon cranks will be able to provide numerical models, scientists will continue to posit that the Moon spins.
…moon’s equatorial bulge is supposedly a "fossil bulge" from an earlier time when the moon was rotating on its own axis at a rapid rate. Thus it is a relic from a time that both "Spinners" and "Non-Spinners" would agree that the moon was rotating on its own axis…and because it’s only a relic from that time, it says nothing about whether the moon is currently rotating on its own axis, or not.
The slowing of the moon’s rotation to what the "Spinners" think of as 1 spin per orbit and the "Non-Spinners" think of as zero spins per orbit is said to be due to the tidal locking mechanism.
[SCIENTISTS] We present the first dynamically self-consistent model for lunar fossil bulge development, in which we consider a viscoelastic Moon that is subject to long-term (~4 Gyr) change of tidal-rotational state and viscoelastic structure (Figure 1). Here we show and discuss the governing equations, the models for lunar mantle rheology and lunar orbital evolution, and our computational method.
[MOON DRAGON CRANKS] Here is a ball and a string.
Entropic Man raised a point, I refuted it. EM agrees that this is the case. Little Willy can’t handle the fact that I was right, so waffles on.
EM brought a point. Gaslighting Graham confirmed it.
Then he pretends this supports Moon Dragon cranks.
Another day in Gaslighting Graham’s trolling.
To confirm Entropic Man’s point, the moon’s equatorial bulge would have had to have been shown to result from its current motion. It does not result from that, it’s a “fossil bulge”, a result of previous motion. So I refuted his point, I did not confirm it. Please stop trolling.
Gaslighting Graham soldiers on, oblivious to the fact that the *actual* tidal bulge has been measured:
https://www.space.com/26246-lunar-tide-seen-from-space.html
Worse, he tries to dismiss the fact that the abnormal bulge explains why the 1:1 spin-orbit lock has been created in the first place.
Just need to remind DREMT that he has conceded that a body moving like the Moon, and is not bolted down and is free to rotate on its own axis, as ALL orbiting bodies are, is appropriately described as:
2) translating in a circle and rotating on its own axis.
https://www.drroyspencer.com/2022/12/uah-global-temperature-update-for-november-2022-0-17-deg-c/#comment-1410294
So I baffled that he is now contradicting his own logic.
"Earth’s gravitational pull is so powerful that it creates a small bulge on the surface of the moon."
Yes, Little Willy. These small tidal bulges are created by Earth’s gravitational pull, so they are not evidence that the moon is rotating on its own axis. They are just evidence that Earth’s gravity has an effect on the moon. The lunar equatorial bulge, on the other hand, could have been evidence that the moon rotates on its own axis, because that type of bulge is usually caused by axial rotation. However, it’s a "fossil bulge", so it only provides evidence that the moon used to rotate on its own axis at a fast rate. It says nothing about whether the moon rotates on its own axis now, or not, and neither do the separate "tidal bulges" you are referring to.
[EM] Because it rotates once an orbit the sun-Earth point has a tidal bulge. That point is moving slower than orbital speed so centripetal force is slightly greater than centrifugal force an there is a net force towards Earth. Similarly the surface furthest from Earth also bulges because there is a slight excess of centrifugal force.
[SCIENTISTS] The same side of the moon always faces Earth, but the bulge does move around a few inches over time, wobbling and following Earth’s pull like a magnet, as the moon shifts slightly during its orbit.
[GASLIGHTING GRAHAM] The lunar equatorial bulge […] could have been evidence that the moon rotates on its own axis, because that type of bulge is usually caused by axial rotation.
Gaslighting Graham just can’t help himself.
Indeed, I just can’t help myself but be correct on this trivial issue.
Gaslighting Graham does not always win, but when he does it’s against past evidence and future.
…I just can’t help myself but be correct on this trivial issue.
Against evidence, past and future.
I am correct, with the evidence, as explained.
DREMT
Well spotted. The anomalous large equilateral bulge is evidence that the Moon once rotated faster than it does now.
It doesn’t help with the disagreement over whether the Moon makes 1 rotation per orbit or 0 rotations per orbit.
It does beg the question of what slowed the Moon’s rotation and whether it is still slowing.
The slowing of the moon’s rotation to what the "Spinners" think of as 1 spin per orbit and the "Non-Spinners" think of as zero spins per orbit is said to be due to the tidal locking mechanism.
It is thought that it will now stay locked at what the "Spinners" think of as 1 spin per orbit and what the "Non-Spinners" think of as zero spins per orbit, indefinitely. It is thought that the orbital period of the moon will increase over time. The "Spinners" think that the moon’s spin rate will continue to decrease over time, but because it is tidally locked to the Earth (and the orbital period is increasing), then it will remain always moving like the "moon on the left" from the tidal-locking GIF.
The "Non-Spinners" would just argue that the orbital period increases, and of course the moon remains not rotating on its own axis whilst this happens.
If Moon were once spinning, it’s stopped now. And we know “tidal locking” would not stop rotation.
If Moon had been rotating against a core in such a way as to cause friction, that would lead to stopping rotation. Friction would sap energy from rotating Moon. That’s somewhat how brakes stop a bicycle. Eventually, Moon would not be rotating.
No guarantees Moon were ever rotating, or that friction was what stopped it, but at least the science is plausible..
EM,
I hope you double check everything Gaslighting Graham tells you. For instance:
https://www.universetoday.com/128350/will-earth-lock-moon/
Good question, btw.
Yes, exactly, Little Willy. Well done.
[GG] The “Spinners” think that the moons spin rate will continue to decrease over time, but because it is tidally locked to the Earth (and the orbital period is increasing), then it will remain always moving like the “moon on the left” from the tidal-locking GIF.
[W] “over the course of tens of billions of years, the Earth will become locked to the Moon, just like Pluto and Charon.”
[GG] Yes, exactly.
Indeed. No contradiction.
🤦
Little Willy, please stop trolling.
Robertson
I only insult those who
– permanently lie and discredit science, like you do all the time;
– repeatedly fill this blog with links to disgusting pictures, like does Eben.
*
” I am still waiting for him to show where Meyer proves the Moon rotates on a local axis. I won’t hold my breath. In his paper he refers to a centrifugal force in relation to the Moon’s motion. ”
Again you repeat your usual nonsense.
I have explained many times that you completely misunderstand what Mayer wrote in his treatise.
This is not only due to your thorough inability to understand German!
The main reason is that UNLIKE MAYER, you don’t know anything about Newton’s gravitation laws.
Mayer used Newton’s gravitation laws ONLY for a proof that Moon’s spheroid shape has a sufficient sphericity to use spherical trigonometry in his calculations.
Nowhere in his treatise is there any place where Mayer put Newton’s laws and Moon’s motion together.
You are such a stupid and ignorant liar, Robertson.
And that is not about to change. You will endlessly repeat your lies on this blog because it lacks any moderation.
response got misplaced to 9:30PM on the 15th.
When you google “Father of global warming”
You get: James Hansen, “The father of ‘global warming’ has died at age 87. Wallace Smith Broecker”, and Svante Arrhenius.
I don’t regard myself an experts on any and all fathers and mothers
of global warming, but as I recall Svante Arrhenius back near the beginning of 20th century, said he thought global warming would be a good thing. Something like 4 to 5 C increase in global warming would
be a good thing.
A question, was Svante Arrhenius wrong about how increasing global temperature by that much [and long before the present time] would a good thing?
There is no question he was wrong about warming effects of CO2.
Also he probably was unaware that we in an ice age.
And was unaware that more than 90% of global warming would warming our cold ocean.
Also he was far more unaware of our ocean- or we say our ocean is largely unexplore, but compared what known about ocean back the turn of 20th century, quite bit has been discovered about the ocean.
We sent craft down to deepest part of the ocean, we sonar a large part of the ocean floor. And we know the ocean floor is comparative young surface [most is less than 200 million years old]. Plate tectonic theory was 50 years from recognize as theory. And the Milankovitch cycles were publish much later. Probably wouldn’t imagined the largest waterfall was under ocean surface [near Greenland]- to mention a few things.
Hindsight is easy.
Somewhere someone is just discovering the arkensneezer effect. Will you patronize them in 120 years time?
EM,
The problem is that nobody has yet discovered the “greenhouse effect”.
Maybe you are right, and somebody will discover it in 120 years, but they might have to call it something else, like “a popular twentieth century SkyDragon delusion”.
You are free to believe anything you like, of course. Just don’t demand that I share your fantasy, nor expect me to pay for it, if you don’t mind.
Carry on proselytizing.
The problem for you is the Greenhouse Effect has been discovered.
We are not aided by people who deny the fact that science clearly indicates a Greenhouse Effect.
The larger problem is getting people who have gotten past whatever obstacles to clear thinking experienced by you, to recognize that CO2 abso~ption spectrum is saturated. It doesn’t matter how much CO2 is added to the atmosphere. Doubling it from its current concentration of 410 ppm to 820 ppm will result in a further reduction of direct thermal radiation to space of 3Wm-2. People of technical common sense understand that 3Wm-2 is too small to have any effect on climate.
Ken, that makes you a “Lukewarmer”. You believe in the GHE, but you don’t believe it is a problem.
Science tells us that CO2 can NOT raise surface temperatures, should you ever get interested in the actual science.
Ken
” Doubling it from its current concentration of 410 ppm to 820 ppm will result in a further reduction of direct thermal radiation to space of 3Wm-2. ”
Source? [NOT: WUWT !!]
Bin, you need a “source” for your own cult’s nonsense?
You don’t recognize what Ken is referring to?
You’ve never seen the bogus equation ΔF = αln(C/Co)?
You’re so braindead you can’t even learn your cult’s nonsense.
You might need to spell out to what Kennui is referring, Pup.
Meanwhile, please rest assured that Luckwarmers only maintain that sensitivity is under 3C.
It has nothing to do with whether there will be consequences:
https://3000quads.com/
Even Roy fumbles that one.
ken…”We are not aided by people who deny the fact that science clearly indicates a Greenhouse Effect”.
***
That is a dumb statement, you are far too influenced by the guy you use as an authority figure. You should branch out and study other scientists.
May I recommend reading the work of Rudolf Clausius, who wrote the 2nd law, contributed to the 1st law, and invented entropy? His works are freely available on the Net and he is light years ahead of your authority figure.
If you understand Clausius and the fundamentals of thermodynamics, you will see why your current authority figure is full of it. A real greenhouse does not warm as claimed by GHE theory, why have you failed to discover that? Infrared energy has nothing to do with real greenhouse warming, it is a byproduct of it.
It cannot possibly warm a real greenhouse. So why are you so hung up on your authority figure’s notion that it can?
Worthless willard joins Bindidon to verify neither understands their own cult’s nonsense. Worthless willard is confusing “forcing” with “sensitivity”. They’re absolutely clueless.
That’s why this is so much fun.
Pup,
I kinda know the luckwarm playbook inside out:
https://contrarianmatrix.wordpress.com/
You have better chances with the Poll Dance Experiment.
Little Willy, please stop trolling.
Ken,
“The problem for you is the Greenhouse Effect has been discovered.
We are not aided by people who deny the fact that science clearly indicates a Greenhouse Effect.”
In that case, you would be able to describe the Greenhouse Effect, but you can’t, can you?
Just asserting that “science clearly indicates”, shows that you don’t understand the meaning of “science”.
When you try to describe the greenhouse effect, you will need to take into account the fact that since its inception, the Earth has cooled. Due to the greenhouse effect, do you think?
Off you go now – maybe you can do what’s never been done. How hard can it be?
History is interesting topic and it’s fair to say it’s easy.
But despite how easy it is, I can’t say I have studied it much,
nor does seem a very popular subject with most people. But what I have read, the greenhouse effect does appear to have started with Arrhenius.
What seems to an interest back in those days was why was Europe warmer than it should be.
And as we know, why Europe is warmer than it should be is due to, let’s call it, the Gulf Stream effect. And seems someone who popularize [wrote and talked about it] was Benjamin Franklin who was
a kind of “rock star” in France. And greenhouses back then were rage in Europe, also.
What interested Arrhenius was glaciation periods which were called ice ages and puzzle why and how did they end. And ending of them, was called by some, global warming.
The truth is the ice age didn’t end, rather we have interglacial periods and glacial periods.
Of course all this was occurring during the Age of Exploration and not as though just European were interested the very distant past, it topic of interest before the Roman empire, in India and later China.
Or in terms of Europe, translating these foreign languages was pretty
significant aspect of it. Though also much interest ancient Egypt, also. Likewise the rise and fall of civilization was and still is a matter of interest. But why term greenhouse effect came a term was interest of how greenhouses worked. Which would have included how use less fuel to heat them.
One might argue sailors discovered the gulf stream effect by sailing and greenhouse effect discovered those which built greenhouses.
Anyhow, Arrhenius thought CO2 was magic sauce which ended Glaciation periods. And that is wrong.
It seems people still wonder how Snowball earth could end.
My answer is, in part, they never happened.
But it is thought glaciers have a runaway effect, and so, snowball earth would this “huge force” stopping ever recovering from it.
But it similar with just glaciation periods- if you get more and more
glaciers, causing more and more cooling, how could it end?
Arrhenius answer was the trace gas, CO2- and it still considered by some to be “part of the answer”.
Good day to everyone!
–
It is a shiny day in Athens, December 16, 2022. It is going to be temperature at late midday +21C. And it continues like this for two weeks now. November also mostly 20C.
–
Very strange high temperatures we have this year in the winter time.
–
https://www.cristos-vournas.com
Just weather.
EM,
Of course it is. And climate is the average of historical weather observations, isn’t it?
No new information there!
christos…”It is a shiny day in Athens, December 16, 2022. It is going to be temperature at late midday +21C. And it continues like this for two weeks now. November also mostly 20C”.
***
What would it cost me to rent an apartment in Athens?
“What would it cost me to rent an apartment in Athens?”
–
Athens is a 4 million densely populated town.
–
You can rent a good apartment of 100m2 (including electricity cost and etc.) for about a thousand euros per month.
–
Now, what would it cost me to rent an apartment in Vancouver?
angech
Thanks for your reply (December 15, 2022 at 6:35 PM) which however partly wonders me.
” I was only pointing out that sea ice is quite measurable in area and extent with satellite data… ”
Did I doubt about that anywhere?
If we go back in our discussion, our differences started with the historical interpretation of the Greenland Ice Sheet by DMI.
You said only satellite data could measure that correctly.
Conversely, I myself don’t doubt about the accuracy of any satellite data.
Simply because in all recent comparisons the correlation of satellite to surface data was very good.
Think for example of the excellent correlation between global tide gauge data and satellite data since 1993: both sources show for this period the same level rise of about 3 mm/yr, despite based on completely different measurements and completely different measurement processing methods.
*
” … even though I am philosophically opposed to some of your interpretations of the data. ”
Which interpretations do you mean?
I report changes in data but don’t name the causes for these changes because I can’t.
Warming is such a complex phenomenon that only stupid people can say ‘It’s the Sun, stupid’ or conversely ‘It’s CO2, stupid’. Especially this ‘No GHE’ blah blah is incredibly incompetent and primitive.
*
And when you look at the dishonesty shown by Robertson in his reply below yours:
” Major mistake, Binny is a major dumbass on this blog. He fakes graphs to make it appear as if the UAH data is the same as NOAA data. ”
you can imagine how far from reality and truth such people can live.
Robertson has been proven wrong so many times but endlessly repeats the same lies – regardless about what he writes.
Even the simplest things – how temperature anomalies have to be compared – he doesn’t (want to?) understand, as is visible here:
https://www.drroyspencer.com/2022/09/uah-global-temperature-update-for-august-2022-0-28-deg-c/#comment-1365217
*
One of my former university professors told me decades ago:
” Who can’t scientifically contradict will soon start to polemically discredit. ”
Yeah. He was ‘plain right’ !!!
Bindidon, that’s all just blah-blah and opinions. That ain’t science. You have NOTHING.
You’ve admitted you don’t have a viable model of “orbital motion without axial rotation”. That means you’re stuck with the ball-on-a-string, whether you like it or not. And that means Moon is NOT rotating.
Now, you need to admit you don’t have a clue about the physics of Earth’s temperature either. Admitting the truth is good for the soul. Otherwise, reality can be a bitch.
You of course overlooked
” Warming is such a complex phenomenon that only stupid people can say ‘It’s the Sun, stupid’ or conversely ‘It’s CO2, stupid’. Especially this ‘No GHE’ blah blah is incredibly incompetent and primitive. “
Wrong again, Bin.
Those are the opinions I’m referring to. I didn’t overlook them.
Opinions ain’t science.
binny…” Who cant scientifically contradict will soon start to polemically discredit. ”
***
I guess you missed your prof’s hint, he was talking about you.
SOI has been steadily positive since 2021, and is now rising again.
https://i.ibb.co/R4cDztf/soi-monthly.png
https://www.longpaddock.qld.gov.au/soi/
Still, the highs are over Greenland, Iceland and the North Atlantic. This favors an increase in the extent of sea ice in the Arctic.
https://i.ibb.co/P93TG7c/r00-Northern-Hemisphere-ts-4km-1.png
In addition to the temperature of the Humboldt Current, La Nina is currently being influenced by the pattern of the northern polar vortex and the decrease in the temperature of the California Current.
https://upload.wikimedia.org/wikipedia/commons/thumb/a/a9/Diagram_of_California_Current_System.png/800px-Diagram_of_California_Current_System.png
https://earth.nullschool.net/#2022/12/20/1200Z/wind/isobaric/500hPa/overlay=temp/orthographic=-107.44,69.50,446
https://www.tropicaltidbits.com/analysis/ocean/cdas-sflux_ssta_global_1.png
Willard December 15 at 10:58 AM
“Contrarians should consult with their insurer for more details.”
https://www.eenews.net/articles/fla-lawmakers-force-homeowners-to-buy-flood-insurance/
Contrarians: If you don’t have a seat at the table, you may be on the menu.
Next, a bill requiring insurance companies to sell flood insurance.
As far as I am aware they will not cover floods.
“As far as I am aware they will not cover floods.”
Yes they will: https://www.progressive.com/flood-insurance/
Some estimates have Florida about 100 feet under water, a couple of thousand years ago.
I own land by a river. Have no problem paying flood insurance. Only fair. Not to mention when I need it one day, I’ll have it.
If you want to fight wars in Iraq, transition to universal health care, or have a house in a flood zone, then expect the masses to help foot the bill, you must pay your share for it. The only thing I ask.
Since Pup and Kennui always put their money where their mouths are, I am sure they will be happy to take the other side of that bet. They sure will make a killing by undercutting all those who mispriced the non existing risk.
Right?
“I am sure they will be happy to take the other side of that bet.”
Going Down To Monte Carlo
Sartre was also the philosopher who became disenchanted with reality and turned to being a socialist purely as a fantasy.
Most philosophers live in a fantasy world in their minds. I guess that’s why you find them so appealing.
C’mon, Gordo:
https://www.drroyspencer.com/2015/07/the-greek-tragedy-will-we-heed-the-warning/#comment-194953
Dis U?
I was not knocking Sartre, merely pointing out that he became a socialist out of a fantasy. There is a big difference between the philosophy of socialism and its practice. Unions turned it into a practical reality but it took bloodshed and the murder of good unionists to support the civil disobedience required to implement the practices.
C’mon, Gordo.
I couldn’t care less if you tried to knock down an old Parisian who fell for Stalin the same way you fall for Vlad.
Read:
https://iep.utm.edu/sartre-p/
Then opine.
Not the other way around.
maguff…”The requirement comes as federal lawmakers and officials are struggling to get more homeowners across the country to buy flood insurance and protect themselves financially against climate change”.
***
More fraud from extreme capitalists trying to help out their buddies in the private insurance scam. Until the Republicans clue into the fact that people are not stupid, and know about such scams, or at least sense them, they will likely never see a majority government again.
Planet Mercury rotates about its own axis.
–
Mercury’s sidereal rotational period: 58,646 Earth days.
Mercury orbits sun in 87,97 Earth days.
Mercury’s diurnal period is 176 Earth days.
–
Our Moon doesn’t rotate about its own axis.
–
Moon’s sidereal rotation period is equal to its around Earth orbital period:
27,32 Earth days.
Moon’s diurnal period is 29,5 Earth days.
–
https://www.cristos-vournas.com
“Our Moon doesnt rotate about its own axis”
Wrong.
rlh…you should be careful with your comments. As someone with a Master’s degree you are making a fool of others with similar degrees.
You have yet to prove the Moon does rotate about a local axis. All you supply is one-liners while coming across as a fool who blindly submits to authority figures.
Come on, Gordo.
We have tons of numerical models in which the Moon spins.
Moon Dragon Cranks have a few half-baked analogies.
Think.
So how come the Sun rises of all points of the Moon then? This proves that it rotates on its axis relative to that at least.
Troll RLH, do you even know what “moon phases” are? What causes them?
This is obviously so far over your head that you will never get it.
Please explain how it comes the lunar diurnal period is 29,53 Earth days?
When Moons sidereal rotation period is equal to its around Earth orbital period:
27,32 Earth days?
–
Where the Moon’s own rotational spin has gone?
–
https://www.cristos-vournas.com
Richard…suppose we have a satellite orbiting the Earth and flying in lock step with the Moon at a lesser orbital altitude. It is imperative that the sat does not rotate about its COG because it has an antenna on its Earth side which must face Earth at all times. Therefore the sat must keep the same face pointed at the Earth.
If the sat rotates about a local axis, communications is lost. It’s the same with the NASA sats from which UAH gets its data. It is imperative that the sat scanner remains on the bottom side of the sat so it can scan the Earth’s surface. If the sat rotates 180 degrees about its local axis, the sat begins scanning cold space.
How do you suppose the sats keep the same side pointed at Earth? No action is required, the sat is put in an orbit where Earth’s gravity pulls it toward Earth at a rate close to 5 vertical metres per 8000 metres in a tangential direction.
That’s the curvature of the Earth. As long as the sat’s tangential velocity carries it about 8000 metres while gravity pulls it down 5 metres, the sat will remain in orbit. It’s a lot more complicated but that’s the basic premise.
C’mon, Gordo:
https://www.quora.com/How-do-deep-space-satellites-keep-their-antennas-pointed-at-the-Earth
Or this.
https://www.forbes.com/sites/quora/2017/10/03/how-does-the-iss-travel-around-the-earth/?sh=69298b79141f
DREMT I am hoping evidence still has meaning to you. It means nothing to the cult figures Gordon Robertson and his arrogant sidekick Clint R.
Read the article. This is factual informtion. In order to keep the International Space Station one side facing the Earth constantly it has rotation added so it rotates at the rate of 4 degrees a minute so it will rotate once per orbit (Just like the Moon).
Clint R can blather on and on about “ball on a string” which is just rotation. No different from a rod rotating around an axis. Ball on the string is just rotation about an axis, not an orbit.
When something orbits, if it does not rotate on its axis all sides will be seen in a complete orbit by the people in the center.
Read the article, think about it and get over this stupid 10,000 plus comments on an issue that was resolved long ago. Scientists are not wrong to say the Moon rotates once per orbit to keep the same side facing Earth. Not sure why this is such a long and stupid back and forth. Facts are facts. The ISS rotates once per orbit to keep the same side facing Earth. Facts. Evidence.
That’s correct Norman.
If we see only one side of Moon then it is NOT rotating.
It’s just like the ball-on-a-string.
See how simple it is?
Clint R
YOU: “If we see only one side of Moon then it is NOT rotating.”
Except when it rotates once per orbit, just like the ISS. If you get a strong telescope and look at the ISS you will see the same side, yet it rotates once per orbit.
You can still do your own test with cans on a a table. One in center and move the other one around it. You will find you HAVE to rotate the can as you move it around the other one to keep the same side facing the center. Before you post, do the test, let me know the outcome.
norman…just reading comments from Robert Frost on Quora. Here’s one…”What we feel is acceleration, or more specifically the forces that result from acceleration. We feel forces. Forces are the product of a mass being accelerated (F=ma)”.
This guy is not qualified to talk about physics. He thinks acceleration causes a force, which is as stupid as one can get. I have no idea how he got employed by NASA with such a crude understanding of the relationship between force and mass.
He has obviously learned from Einstein’s relativity nonsense. Without a force, there can be no acceleration, therefore a force is required to produce an acceleration on a mass.
I can’t emphasize enough how Einstein screwed up by considering acceleration via kinematics while ignoring the forces and masses involved. You simply cannot accurately examine a problem using only kinematics with the presumption that velocity and acceleration are independent variables that produce motion.
Robert Frost is making the same mistake. Luckily he was not involved with the construction of the ISS. It would never have gotten into orbit.
In the other quote you offered, he also messes up. He states….
“The words revolve and rotate are often misused when it comes to the International Space Station and Earth. To revolve involves translational motion, while to rotate involves a change in orientation. Imagine it this way your friend is standing in front of you. If you walk in a circle around your friend, you are revolving. If you do not change your location, but turn around to not face your friend, you are rotating. If you walk in a circle around your friend and constantly turn so that you are continually facing him, you are both revolving and rotating. Thats what the ISS does”.
First, his definition of revolution and rotation are muddled. Revolution and rotation are essentially the same thing as far as the Moon is concerned. Unless the ISS is driven by retros, to rotate at the same time it is performing translation, it is performing translation only. Or, if it was launched with a slight torque so it would rotate at a slow rate, it would translate with rotation. I doubt that is the case.
His mistake comes with his example of a person walking around a friend. For the most part it is correct. If you walk CCW around a friend, you are revolving but, more accurately, you are performing curvilinear translation, as he pointed out. If you stand in place and rotate away from your friend, you are obviously rotating.
It’s the last part that is vague. He thinks the only way you can revolve around your friend is to walk straight ahead while constantly rotating. You could step sideways while face your friend and not have to rotate at all.
In his speed to offer an example, he has negated the actual motion of the Moon, which performs curvilinear translation naturally without having to rotate at all. In other words, you cannot replicate the motion of the Moon accurately by walking on the surface. The lunar orbital motion is totally dependent on the Moon moving in a frictionless space in a gravitational field, a motion which is not available on the surface.
Norman, you get to argue with yourself:
“When something orbits, if it does not rotate on its axis all sides will be seen in a complete orbit by the people in the center.”
When you finish arguing with yourself, give us your model of “orbital motion without axial rotation”.
Otherwise, you’ve got NOTHING.
Please remind me why anyone but Moon Dragon cranks should give you a model without which Moon Drsgon cranks have no leg to stand on, Pup.
Unless you do the Poll Dance Experiment, you and they got Nothing.
Little Willy, please stop trolling.
Moon gets lit by the sun from all sides as it rotates around its axis. Proof enough. Too bad you can’t visualize it; non-thinking entity
One small lump of coal for you. No point in keeping non-thinking entities warm at our cost.
Ken, this is too advanced for you.
Don’t feel bad. You’re not alone.
Ken
You are correct and logical. You will find that logical rational thought and evidence are not important to a few who post here.
ken…”Moon gets lit by the sun from all sides as it rotates around its axis”.
***
Think it through, Ken. The Moon orbits the Earth with the near side always pointed at Earth and the far side always pointed at space. We on Earth call the far side, the ‘dark side’, because we never see it on Earth. However, the Sun sees it and warms it for 14 days. It warms the near side the other 14 days.
This has nothing to do with the Moon rotating on its axis, it is all explained by curvilinear translation. The definition of CT, in part, is that all points on the body must move along parallel lines. That’s exactly what happens with the Moon, all parts move in concentric circles. If that was not the case, the near side would not always point at Earth and the far side at space.
If you consider a car orbiting a track in a CCW direction, if you stand inside the track, you see only the driver’s side (in North America, that is). If you move to the stands, outside the track, you see from the Sun’s perspective and see all sides of the car.
If you had a spotlight shining on the car from the stands at night, the light would illuminate all sides of the car just as the Sun illuminates all sides of the Moon. However, from inside the track, we’d only see the illuminated car when it was on the far side of the track from the stands, just like the Moon.
Come on, Gordo:
https://youtu.be/sNUNB6CMnE8
The spinning of the Moon has been captured by the Lunar Reconnaissance Orbiter,
Just watch it.
Little Willy, please stop trolling.
“it is all explained by curvilinear translation. The definition of CT, in part, is that all points on the body must move along parallel lines. Thats exactly what happens with the Moon, all parts move in concentric circles.”
Our chief science denier says the darndest things!
“Translation:
Translation occurs if every line segment on
the body remains parallel to its original direction during the
motion.
When all points move along straight lines, the
motion is called rectilinear translation.
When the paths of
motion are curved lines, the motion is called curvilinear
translation.”
Line segments on the rotating moon are OBVIOUSLY NOT remaining parallel to the original direction.
https://athena.ecs.csus.edu/~grandajj/e110/Lecture%20Notes%20for%20Sections%2016-1%20-%2016-3.pdf
1. From Roy Spencer’s head post in 2016
https://www.drroyspencer.com/2016/09/the-faster-a-planet-rotates-the-warmer-its-average-temperature/
” Yesterday I showed that the difference in rotation rate between the Earth and the Moon caused the more-slowly rotating Moon to be about 55 deg. colder than the Earth… ”
2. From Christos Vournas
https://www.cristos-vournas.com/
” Earth is on average warmer than Moon not only because of the Earth having 29.53 times faster rotational spin. ”
Shame on you!
binny continues to be an idiot.
I am sorry, it should read “29,53 times”.
–
https://www.cristos-vournas.com
binny…” Yesterday I showed that the difference in rotation rate between the Earth and the Moon caused the more-slowly rotating Moon to be about 55 deg. colder than the Earth
***
Roy proves Christos right and Binny still doesn’t understand.
To spell it out for you, when the Moon is on the far side of the Earth from the Sun, the near-face is illuminated for 14 days. It averages to a certain ‘hot’ temperature. When the Moon moves between the Sun and the Earth, the near-side is now facing cold space, and it drops to a very ‘cold’ average temperature.
If you average the ‘hot’ and ‘cold’ temperatures, the average temperature of the near-face is about -55C, as you say. The average tells you nothing. If you had to survive on the near face you’d be living in temps well above 100C for 14 days then trying to survive in temps more than 100C below 0C for the other 14 days.
As far as the near-face is concerned, there is no rotation about a local axis. The variation in temperature is related to the lunar orbit wherein the near-face orientation wrt the stars is the key issue. The Moon does not have to rotate on a local axis in order that the near-face re-orient through 360 degrees, it’s a property of the orbit.
Robertson
You are denying Roy Spencer’s words:
” Yesterday I showed that the difference in rotation rate between the Earth and the Moon… ”
*
You are in such insane denial that you twist even Roy Spencer’s arguments to fit your egomaniacal narrative.
Roy Spencer clearly stated that the Moon rotates, what Vournas did often enough as well, on this blog !!!
With your post above, you are treating Roy Spencer as if he would be a liar like you.
Why don’t you coward ask he himself what he means about your endless, utter nonsense?
It is… because you perfectly know what he would answer.
*
But… what else after all should we expect from a persistent liar who once insulted on this blog – of course well protected behind his fake name – Andrew Motte, the translator of Isaac Newton’s Principia Scientifica, a ‘cheating son of a bitch’, just because he, Robertson, is so ignorant that he failed in correctly reading Newton’s original Latin text and thus thought Motte mistranslated Newton?
Bin, it is common for people to use “rotation” for “revolution”. We see it here all the time. But, if you understand the basics, you can figure it out from the context. When someone is speaking about day/night on Moon, or comparing day/night periods between Earth and Moon, they are referring to Moon’s orbit, which is “revolution”.
It’s not a major mistake. You’ll get used to it.
Do you have a model of “orbital motion without axial rotation” yet? If not, you know what comes next — You’ve got NOTHING.
We see that according to Clint R, Roy Spencer in person belongs to the people for which it is common to use ‘rotation’ for ‘revolution’.
In other words, Roy Spencer doesn’t have a clue about Moon’s motion.
If megatroll Clint R had some balls between the legs, he would send him a mail explaining how wrong he is!
Bindidon,
You wrote –
“We see that according to Clint R, Roy Spencer in person belongs to the people for which it is common to use rotation for revolution.
In other words, Roy Spencer doesnt have a clue about Moons motion.
If megatroll Clint R had some balls between the legs, he would send him a mail explaining how wrong he is!”
Ah, the combined appeal to authority and a sly attempt to get Dr Spencer to dance to your tune (presumably banning someone you dont like)! Throw in a derogatory sexual innuendo about “balls between the legs” (where else would they be, one might ask), and the intellectual capacity of another pathetic SkyDragon cultist is exposed.
Maybe, if you had the necessary balls, cohones, moral fibre, courage of your convictions, or whatever, you could send Dr spencer a “mail” yourself, demanding that he ban the person who annoys you so much. Maybe you have, and been ignored – who knows?
in the meantime, you might consider why you are so opposed to freedom of thought and expression? Will the Moons motion change even a tiny bit by censoring someoness opinion? I dont think so, but you may have reasons for carrying on like a jackbooted, riding-crop wielding member of a master race.
In the meantime, I will have a good laugh at your impotent posturings, whether you like it or not.
Carry on.
Bin, I understand that you’re fascinated with my balls, but the only ball you need to learn about is the ball-on-a-string.
Otherwise, you’ve got NOTHING.
Helloo again, you blathering stalker!
Do you have something to say?
No?
Ah yes, Flynnson is once more just urging to say something irrelevant.
Bunny,
Your ability to read seems to be more defective by the day – are your jackboots too tight? Have you lashed your testicles with your riding crop accidentally?
In any case, you are obviously trying to comprehend my comment, so I’ll repeat it for you –
Bindidon,
You wrote
We see that according to Clint R, Roy Spencer in person belongs to the people for which it is common to use rotation for revolution.
In other words, Roy Spencer doesnt have a clue about Moons motion.
If megatroll Clint R had some balls between the legs, he would send him a mail explaining how wrong he is!
Ah, the combined appeal to authority and a sly attempt to get Dr Spencer to dance to your tune (presumably banning someone you dont like)! Throw in a derogatory sexual innuendo about balls between the legs (where else would they be, one might ask), and the intellectual capacity of another pathetic SkyDragon cultist is exposed.
Maybe, if you had the necessary balls, cohones, moral fibre, courage of your convictions, or whatever, you could send Dr spencer a mail yourself, demanding that he ban the person who annoys you so much. Maybe you have, and been ignored who knows?
in the meantime, you might consider why you are so opposed to freedom of thought and expression? Will the Moons motion change even a tiny bit by censoring someoness opinion? I dont think so, but you may have reasons for carrying on like a jackbooted, riding-crop wielding member of a master race.
In the meantime, I will have a good laugh at your impotent posturings, whether you like it or not.
Carry on.
The message here is that a dumbass who takes every opportunity to diss the work of Roy is suddenly using Roy to make a point on his own behalf. Typical logic of an idiot.
Does Bindidon regularly diss Roy?
No, you just made that up. It’s what you do.
No, Bindidonk regularly make suck up posts to Dr Roy in hope to fulfill his hopeless dream of becoming a moderator
ken…and others with a problem with comprehension…”Youve given up your soul for a broken toy? Ball on a string doesnt apply to the moon”.
***
The ball on a string was never offered to represent the motion of the Moon. It was only offered as an example of a body that always keep the same side pointed to its axis. The Moon does the same thing and the BOS was only introduced to show how a body can move in an orbit, keeping the same side pointed to the axis, while not rotating about its own local axis.
The Moon’s axis is the Earth and as Dremt continually points out, it is an external axis. The Moon revolves/rotates about the Earth, like it or not. There is absolutely no rotation about a local lunar axis, just like the BOS.
The ball on a string only relates to a ball on a string. Nothing else.
Troll RLH, you got a model of “orbital motion without axial rotation” that works?
Your attempt to use the bicycle pedal assembly caused you to crash into the pavement. Obviously there was permanent brain damage….
“you got a model of ‘orbital motion without axial rotation'”
There is no such thing. Unless it is MOTL.
“There is no such thing.”
What is wrong with you people? Ask yourself the question, how does an object that is orbiting, but not rotating on its own axis, remain oriented whilst it moves? Is it like the “moon on the left”, or the “moon on the right”, from the GIF below:
https://upload.wikimedia.org/wikipedia/commons/5/56/Tidal_locking_of_the_Moon_with_the_Earth.gif
The answer to that question is your personal idea of what is “orbital motion without axial rotation”. It’s that simple. Stop pretending that there is “no such thing” as this completely obvious, self-explanatory concept!
“What is wrong with you people?”
Nothing. It is you who are wrong.
Stop pretending that there is “no such thing” as this completely obvious, self-explanatory concept!
Gaslighting Graham does not always use self explanatory concepts, but when he does he has to call them by their explanations.
*Orbit* has five letters.
According to DREMTs source for that diagram, the moon on the left is a tidally locked body, which
“In the case where a tidally locked body possesses synchronous rotation, the object takes just as long to ROTATE AROUND ITS OWN AXIS as it does to revolve around its partner.”
https://en.wikipedia.org/wiki/Tidal_locking
So that answers the question, definitively. And all other astronomy sources concur.
There is just is no controversy about it. Except within the teeny tiny cult of lunatics that inhabits this blog.
Just a reminder, to whomsoever it may concern, that:
a) "Orbital motion without axial rotation" is motion like the "moon on the right"
does not follow from:
b) Objects in orbit are free to rotate on their own axes, or not.
Claiming that a) follows from b) is a non-sequitur, because "orbital motion without axial rotation" could be motion like the "moon on the left", and objects still be free to rotate on their own axes, or not, separate to that motion.
Just a reminder that one “can each have his own personal idea of what is orbital motion without axial rotation should mean.”
But no one can claim there is actually any controversy about this issue among astronomers, who are the most familiar with the evidence, nor is the definition of Orbit ambiguous on this issue.
Similarly, Flat Earthers can believe the Earth is Flat all they want, but there is no controversy among scientists that the Earth is a sphere.
Orbital motion is DEFINED to be following a path thru space (an orbit) around another body. No rotation rate is specified by that, so that is a separate parameter.
Particularly for people who add the term ‘without axial rotation’, it should be obvious that ‘orbital motion’ by itself does not specify ANY rotation rate, or axis, which must be separately specified, as it is for the Moon.
Anyone who denies that the Moon has axial rotation needs to explain why its rotation rate and axis are listed in all astronomical tables.
Happy that the reminder was a timely one.
*Orbit* has five letters.
Yes.
rlh…”The ball on a string only relates to a ball on a string. Nothing else”.
***
I guess you got your Master’s degree in anthropology or political science. You certainly lack the ability to understand a simple concept.
Does or does the ball not keep the same face pointed at its centre of rotation? Does or does the Moon not do the same?
Duh!!! Come on, Richard, surely you require basic logic to get a Master’s degree.
“surely you require basic logic to get a Masters degree”
You do and I have applied it. You are wrong, plain and simple.
Moon orbit is actually elliptical so it does not keep same side pointed to its axis. It varies by 13 degrees. Ball on string does not apply.
Lumps of coal for you.
Ken, you’re such an amateur. You’re so incompetent you can’t even troll good.
But, that’s why this is so much fun.
ken…although the lunar orbit is elliptical it’s close enough to a circle to consider it as such. The deviation of the near-face from the radial line of a circle is only about 5 degrees, not 13. Even so, when the Moon is at either end of the major axis, the angle drops to 0 degrees.
That 5 degrees or so is enough to see 5 degrees around the longitudinal edge of the Moon. We call that libration.
Close enough is not fact. The orbit is elliptical which BOS is not.
The lunar rotational axis is tilted 6.7 degrees to its orbital axis. Is that also ‘close enough to zero’ not to matter?
This axis only exists and is only detectable by observing the rotation of the body. So if there is no rotation on this axis, that axis is impossible to explain.
But when you have a BELIEF, all contradictions, no matter how big, can be ignored.
https://www.drroyspencer.com/2022/12/uah-global-temperature-update-for-november-2022-0-17-deg-c/#comment-1410676
Come on, Gordo.
What you call an axis is called the barycenter, not the barycenter of the Moon itself, but of the Moon-Earth system.
The axis of the Moon is the line around which it spins:
https://en.m.wikipedia.org/wiki/Orbit_of_the_Moon#/media/File%3ALunar_Orbit_and_Orientation_with_respect_to_the_Ecliptic.svg
It is called *lunar axis* in that diagram.
Read, then pontificate.
…and the barycenter of the moon-Earth system is located within the Earth itself. So you could argue the "orbital axis" is located there.
Poor Gaslighting Graham, can’t even find an expression that would be shorter than “barycenter.”
…the barycenter of the moon-Earth system is located within the Earth itself. So you could argue the "orbital axis" is located there.
Let’s wait and see Gaslighting Graham redefine that one:
https://en.wikipedia.org/wiki/Orbit_of_the_Moon
…barycenter of the moon-Earth system is located within the Earth itself. So you could argue the "orbital axis" is located there.
The Moon’s axis of rotation is inclined by in total 6.7 degrees relative to the normal to the plane of the ecliptic.
…of the moon-Earth system is located within the Earth itself. So you could argue the "orbital axis" is located there.
gb…”When you google Father of global warming
You get: James Hansen…”
***
That’s where Google let’s us down, they present pro-GHE/AGW sources while stifling anything to do with scientists who oppose those theories.
If you dig, you find that Hansen is a physicist who decided, for whatever reason, to pursue astronomy. In particular, he became enamored with the work of Carl Sagan, who was an egotistical pratt. Sagan made popular the notion that the atmosphere of Venus was created by a runaway greenhouse effect and Hansen apparently fell for his theory. His mission became to prove that Earth is headed in the same direction due to anthropogenic emissions.
In 1978, NASA launched the Pioneer probes that returned data indicating the Venusian surface was around 450C. As astronomer Andrew Ingersoll concluded, if that is the case then the surface is far too hot to be the result of GHE effect. Therefore, Sagan and Hansen were dead wrong. Ingersoll went so far as to claim such a high surface temperature would contradict the 2nd law of thermodynamics were it created by a greenhouse effect.
https://agupubs.onlinelibrary.wiley.com/doi/abs/10.1029/JA085iA13p08219?deniedAccessCustomisedMessage=&userIsAuthenticated=false
“If all observations are correct and the probe sites are typical of the planet, the second law of thermodynamics requires that the bulk of the lower atmosphere heating must come from a source other than direct sunlight or a thermally driven atmospheric circulation. Neither the so-called greenhouse models nor the mechanical heating models are consistent with this interpretation of the observations”.
Hansen surely had the Pioneer data and the fact he continued to pursue his stupid greenhouse warming theory, along with his political jargon about anthropogenic warming, suggests strongly that he was using NASA funding to further a political cause.
The head of NASA at the time apparently thought so and tried to fire Hansen. Friends from on high, like Al Gore, intervened and saved Hansen’s job.
“Sagan made popular the notion that the atmosphere of Venus was created by a runaway greenhouse effect and Hansen apparently fell for his theory. His mission became to prove that Earth is headed in the same direction due to anthropogenic emissions. ”
Yes. And seems both suffered from reading too much older science fiction fantasy.
I think it’s cute to say, neither respected the goddess of love.
But Venus was never like Earth. I think Venus at earth distance would be colder than Earth.
Venus absorbs only small fraction of sunlight reaching .72 Au from the Sun, and would absorb far less at 1 AU distance from the sun.
And would guess, the small Mars planet had and has more water than Venus had or has.
Though Hansen once though Methane was the important greenhouse gas, rather CO2. And seems likely to me Venus had a lot methane at some point in it’s history.
If Earth and Venus are sister planets, it’s thought Earth had fair amount methane in it’s early beginning- so Venus could have had as much methane as Earth did.
Anyways, it possible Hansen was trying to do job at NASA- though I never heard him saying it, maybe what he wanted was make solar shade for Earth. Making solar shade could considered a job for NASA.
Anyhow, I think the mystery of Venus is a driving force of global warming cargo cult.
gb…”it possible Hansen was trying to do job at NASA”
***
I am not claiming Hansen was not trying to do a good job, at GISS, however, I think he used his position to politicize eco-lunacy. For example, he was arrested with actress Darryl Hannah for protesting the Keystone Pipeline project.
On another occasion, backed by the idiot Al Gore, he had the crew turn off the air conditioning in a TV studio to make him appear hot and uncomfortable while he broad.cast crap about global warming.
Hansen was far more than a modeler-scientist, he was politically involved in spreading propaganda that had no science to back it.
I think Hansen was bureaucrat with hobbies.
I don’t know if he was competent bureaucrat- but NASA
failed to explore the Moon during his time at NASA- which
does support idea there was not any good bureaucrats at NASA.
“When you google Father of global warming
You get: James Hansen”
I got Hansen, Plass, Arrhenius and Broecker on the first page of hits. Multiple entries for each.
You guys… you don’t read past the first line, do you?
All you get is fathers, when you don’t get a theory
https://www.youtube.com/watch?v=Y6KjY2weu5Q
Elon Musk Clarifies His Priorities as SpaceX Starship 24 Burns Another Static Fire
Quite amusing.
And summary of week in space.
–ELON MUSK, MANAGEMENT GURU? Why the Twitter owners ruthless, unsparing style has made him a hero to many bosses in Silicon Valley. But as Ive called around to C-suite executives and influential investors in Silicon Valley over the past few weeks, Ive been surprised by how many are rooting for Mr. Musk even if they wont admit to it publicly. Mr. Musks defenders point out that Twitter hasnt collapsed or gone offline despite losing thousands of employees, as some critics predicted it would. They see his harsh management style as a necessary corrective, and they believe he will ultimately be rewarded for cutting costs and laying down the law. . . . Tech elites dont simply support Mr. Musk because they like him personally or because they agree with his anti-woke political crusades. (Although a number do.). Rather, they view him as the standard-bearer of an emergent worldview they hope catches on more broadly in Silicon Valley.
Its basically a worldview in which companies are run by the people who own and manage them, not by some blue-haired twentysomething in HR a belief that the people who build and run important tech companies have ceded too much power to the entitled, lazy, overly woke people who work for them and need to start clawing it back.–
Posted at 12:41 pm by Glenn Reynolds
https://instapundit.com/
I think Musk is providing huge educational value to people he is allowing to leave twitter.
And they could move on to a much more rewarding life.
Plus helping other CEOs a lot.
You have a knack for finding incoherences in the world, gb:
https://www.usatoday.com/story/opinion/2018/12/03/twitter-facebook-social-media-bias-political-poison-blogosphere-instapundit-column/2183648002/
–Glenn Reynolds Retweeted
Larry Correia
@monsterhunter45
Dec 14
We could fire half the government employees and the only thing anybody would notice is it would free up a lot of parking.
Quote Tweet
Rep. Jim Jordan
@Jim_Jordan
Dec 13
.@elonmusk fired half the staff at Twitter. The app is working great. Maybe better than ever?
Imagine if the federal government did the same.–
I always liked, Imagine, even though the song sucks.
Glenn quit twitter long before I did.
But I am wondering, if I give another try [even if I am inherently fumdementally religiously oppose to it- but it’s possible it might become better. And Twitter was always funny].
Elonh Musk just banned the accounts of a bunch of journalists who were covering Twitter. The free speech guru doesn’t even respect the 4th Estate.
The 4th Estate has always had trouble with reality (see “yellow journalism”). But since the 1950’s the US media has been on a downhill slide. They nitpick those on the Right, while ignoring corruption and perversion on the Left.
We even see the same kind of corruption and perversion right here. There are people here that even attempt to pervert reality.
Psst, Pup:
https://techcrunch.com/2022/12/15/elon-musk-suspends-mastodon-twitter-account-over-elonjet-tracking/
Try to rationalize that one.
Best of luck!
Worthless willard unknowingly provides a good example of the corruption of the media. Why are they only tracking Musk?
Pup has not clicked on the link and it shows.
Perhaps he does not that every single airplane in the US of A are tracked and that ALL THIS INFORMATION IS A MATTER OF PUBLIC RECORD.
There is no bottom for Dragon cranks.
That’s my point, silly. They are only reporting Musk’s.
Sad Pup, not only ignoring everything about SCIENCE, but also ignoring the basics of the law about doxing.
So much fun!
I don’t think suspended is same as banned.
A permanent suspension is called a ban. You can also say “permaban” to make sure. But now it seems that “permanent” does not mean anything anymore.
No wonder you like the guy, bg:
https://twitter.com/elonmusk/status/1604009105563484160
Either Elon is an idiot, or he’s a crook.
–No wonder you like the guy, bg:
https://twitter.com/elonmusk/status/1604009105563484160
Either Elon is an idiot, or hes a crook.–
https://www.marketwatch.com/investing/index/djia
Click on last month
https://tinyurl.com/36m4dwhz
Click on last month.
https://tinyurl.com/44xybbtp
click on last month
https://tinyurl.com/27sw5xsj
click on last month
Google: value of SpaceX
–around $140 billion
SpaceX is offering insider shares at $77 a piece, raising the value of the company to around $140 billion, Bloomberg reports, citing anonymous sources. It’s a big leap for the U.S.’ most valuable private company, which was last estimated at $127 billion in July, according to data provider PitchBook.5 days ago–
{It’s not public [nor is twitter} other search hits:
–SpaceX value rises to $140bn–
–SpaceX stock is up significantly this year in private market trades–
–The Valuation Game: SpaceX Soars as Elon Musk Slips to No. 2–
–Elon Musk’s SpaceX valuation $100 billion – CNBC
https://www.cnbc.com 2021/10/08 elon-musks-spac…
Oct 8, 2021 The new valuation of $100.3 billion, up from $74 billion in February, means SpaceX has achieved a rare status as a private company: a $1 billion…–
Etc
Oh, there is twitter stock {I don’t follow these things}:
https://www.investing.com/equities/twitter-inc
$53.70
{Oh also, click on month}
Come on, gb.
Elon makes 50B as a CEO of a company he did nothing for in six months except shitposting and his investors are unhappy:
https://fortune.com/2022/11/09/elon-musk-tesla-investors-stock-share-sale-twitter-acquisition/
And he is dumping TSLA stocks like a madman because he is looking for cash.
Besides, the point is that *this* is why the stock is tanking, not the Fed.
The only reason this buffoon has any luck is because of lemmings like you.
Ruin is a certainty. The only question is when. Unless he stops doubling down all the time.
I never betted for or against the guy. But now I am tempted.
TSLA is a tech company, gb. Its index is the NASDAQ. Look for QQQ.
If you look for its fair value, you should see numbers ranging from 50 to 200 bucks. Which means that Elon relied on the lemming effect to attract marks like you. He is just an ordinary troll.
60B per year is a lot for a mere troll, and the main shareholders are getting tired that he spends his time quarrelling instead of doing his job. I would argue that it is a good thing, for that means he leaves engineers alone and the less he does the better for the company. But then I am not a shareholder.
In any event, expect shorting activities to increase.
–The only reason this buffoon has any luck is because of lemmings like you.
Which means that Elon relied on the lemming effect to attract marks like you.
He is just an ordinary troll.
I never betted for or against the guy. But now I am tempted.
In any event, expect shorting activities to increase.–
You realize shorting is giving insurance.
Elon might appreciate your help.
But as you should be aware, due my posting habits, I am interested
space exploration. And global satellite market tied to this silly interest, could you somehow short Starlink specifically?
SpaceX owns starlink and it’s not public, but it seems there could be ways of shorting it- but don’t know enough about it to tell you how you might do it.
For example:
gbaikie
December 18, 2022 at 12:41 AM
https://www.youtube.com/watch?v=dEDo6ZY1u5Q
SpaceXs INSANE New Starship LEAKED by Elon Musk!
18 meter diameter and 100 engines and taller.
Obviously, not coming soon.
http://www.transterrestrial.com/2022/12/16/try-try-again-6/#comments
But I am mostly interested in when Starship does it’s first
test launch, though “INSANE New Starship” idea is interesting.
And lately I have wondering how one stop a starship tearing up
the pad. And 100 engines seems like you only launch it from the ocean,
> Elon might appreciate your help.
For a stan, gb, you don’t know Elon much:
https://www.wired.com/story/what-are-short-sellers-and-why-does-elon-hate-them/
What Are Shorts and Why Does Elon Hate Them?
Do even read what you post?
“Short selling is the opposite. Short sellers (or shorts) believe a companys value, and therefore its stock price, is going to go down. They borrow, or rent, sharestypically from large corporate investors, like 401K managersand immediately sell them. Then they wait, hoping for the price to drop so they can buy them back, return them, and pocket the difference.
Heres a hypothetical. A short seller would borrow 10 shares of, say, an electric car company, valued at, say, $420, for a total cost of $4,200, which they then sell. If that company runs into problems producing its new product and gets a ton of bad press, or if the CEO of that company starts badmouthing regulators on Twitter, thus exposing the company to lawsuits, the shares could fall to, say, $300. Then the short seller buys back the 10 shares for $3,000 and returns them to the owner. The short seller pockets $1,200, minus rent theyve paid while theyve held the shares. (Investment plans make a substantial amount of money renting out shares like this.)”
So, if you short, you are a believer in the company.
Musk probably understands this, though he might not want to pay for the insurance. Though article quite clear, his beef is with a government bureaucracy called the SEC or as Elon calls it:
Shortseller Enrichment Commission.
I would not try to fight a bureaucracy- but I am not Elon Musk.
He is obviously a madman- but maybe his good looks allows him to get away with it.
The ladies seem to like him.
I know what is short selling, gb.
You did not know that Elon always hated short sellers, right?
He really has no clue about how any of this works.
Just like a slot machine guy who won 3 times in a row and thinks they are a genius.
The Fed does not make the TSLA stock crash, his insider selling does.
Hence why he dId nod declare his buys of TWTR.
Which is illegal, BTW.
–I know what is short selling, gb.
You did not know that Elon always hated short sellers, right?–
So the theory is that you and I know what short selling is, and richest guy in the US, doesn’t?
I think Elon likes the freedom of speech and that is one reason why he left Africa. And he was angry that SEC was limiting his speech.
Second richest, gb, third if we count Vlad.
And no – my claim was that Elon has no idea how trading works.
Read his tweet about the fed.
Elon made money by investing, btw, not by trading.
“Second richest, gb, third if we count Vlad.”
Is the french guy living in US?
Vlad isn’t.
But you right, richest people are dictators.
One should say the richest people who are taxed.
Of course Musk was richest person who paid the most taxes
in a year.
DREMT has the right idea that we can each have our own personal idea of what is orbital motion without axial rotation should mean. Everyone one should be able to recognize and understand the two basic ideas. Moon on left or moon on right. MGR horse that always points forward or always points north.
The deeper question is ‘which model is better at predicting how real moons move?’ This cannot be answered by debate (no matter how hard people try). This cannot be answered by merely claiming one is ‘obviously better’.
This can only be done with actual data. The better model will better match the universe (which also means fitting in with other theories that have proven effective at predicting the motions of the universe).
I can think of a few obvious tests to help judge which is better.
1) What does your model predict for libration. Not just approximately, but exactly.
2) What would your model predict if the central force stopped (eg we could turn of gravity or cleanly, instantly break the string).
3) What does your model predict for angular momentum? (For example a uniform ball of mass M and radius R mounted rigidly a distance r from the center of a merry-go-round turning (omega) radians per second.
If you don’t know what your model would predict and/or what the true data show, then you are just offering an opinion.
tim…”The deeper question is which model is better at predicting how real moons move? This cannot be answered by debate (no matter how hard people try). This cannot be answered by merely claiming one is obviously better”.
***
You are talking philosophy and thought experiments, the rest of us non-spinners are talking scientific fact.
The scientific fact is that it’s impossible for the Moon to keep the same face pointed at Earth and still rotate about a local axis. You are trying to bypass that fact by waffling over the definition of rotation.
So, how does one arrive at the scientific fact? It’s done by laying out a form of freebody diagram and observing. We place the Earth at 0,0 on an x-y plane. It doesn’t matter if it is rotating or not. Then we place the Moon along the x-axis at a convenient number of units, say 5. We draw a circle through the Moon’s centre at 5,0 to represent a circular orbit for the COG.
We draw another circle at the side of the Moon closest to the Earth symbol at 0,0 and another at the far side. We now have three concentric circles representing orbital paths for the near side, the COG, and the far side. We let the Moon orbit the Earth and note that the near side, the COG and the far side are all moving in parallel at all times, making it impossible for the Moon to rotate about a local axis at the same time.
That is an undisputable truth. There is no way around it. We are looking at curvilinear translation without rotation.
“You are talking philosophy and thought experiment”
No! I am talking *science* . How does the *actual* moon move? What model(s) might explain that motion accurately?
You go on to present one possible definition for ‘rotate’, which is commendable. But it fails immediately. You claim “We draw a circle through the Moons centre at 5,0 to represent a circular orbit for the COG.” But the moon does NOT follow a circular orbit. Everyone knows that
You would need to try again, for an actual elliptical orbit. Because in an elliptical orbit, different points on the moon do NOT follow parallel paths — *that* is indisputable fact.
In fairness, Tim, what you are talking about is usually discussed by philosophers of science, eg:
https://plato.stanford.edu/entries/scientific-underdetermination/
In cases where theories are underdetermined by observation, scientists usually go for other criterias, like simplicity or fruitfulness.
Usually scientists do not need to state such obvious facts.
I tried to tell that to Gaslighting Graham in my very first comment to him, but he preferred to play dumb and to continue to troll instead. And now he even tries to suggest I might disagree with what you just said.
Gaslighters will gaslight, I guess.
"And now he even tries to suggest I might disagree with what you just said."
If you have ever agreed with this:
"DREMT has the right idea that we can each have our own personal idea of what is orbital motion without axial rotation should mean. Everyone one should be able to recognize and understand the two basic ideas. Moon on left or moon on right."
You’ve done a fantastic job of pretending otherwise. Like, "going to the extent of arguing with me for days on end" type of a job.
And so Gaslighting Graham reveals never had any idea what is a silly semantic game.
Or what *indeterminacy* means.
Perhaps he does not even recall my first comment I made regarding that silly pet topic of his?
Ah well.
Perhaps in future Little Willy can avoid spending days arguing against someone he is going to later pretend he agreed with all along.
Perhaps one day Gaslighting Graham will realize that redefining words does help him being right.
…in future Little Willy can avoid spending days arguing against someone he is going to later pretend he agreed with all along.
Perhaps one day Gaslighting Graham will realize that redefining words does help him being right.
…future Little Willy can avoid spending days arguing against someone he is going to later pretend he agreed with all along.
Perhaps one day Gaslighting Graham will realize that redefining words does help him being right.
…Little Willy can avoid spending days arguing against someone he is going to later pretend he agreed with all along.
Perhaps one day Gaslighting Graham will realize that redefining words does help him being right.
Willy can avoid spending days arguing against someone he is going to later pretend he agreed with all along.
Gaslighting Graham might one day realize that he accepts all the numerical models that exist pending his redefinitions.
…Willy can avoid spending days arguing against someone he is going to later pretend he agreed with all along.
Alternatively, Gaslighting Graham could simply acccept that he has no business trying to one up physicists until he study physics properly.
…perhaps in future Little Willy can avoid spending days arguing against someone he is going to later pretend he agreed with all along.
Meanwhile, Gaslighting Graham can surely try to retreat to his PST mode.
He is not there yet.
There is no retreat in a PST. Sometimes, somebody just has to be the adult, and bring the pointless back and forth to a close.
” somebody just has to be the adult”
DREMT sez YOU FIRST.
“The scientific fact is that its impossible for the Moon to keep the same face pointed at Earth and still rotate about a local axis”
That is in no way a fact. All you’re doing is asserting that the geocentric frame of reference is the correct one. As soon as your frame of reference is heliocentric or inertial the Moon spins.
IOW, Newton would say the Moon spinning. The Newtonian frame of reference for celestial mechanics is not the Earth.
“As soon as your frame of reference is heliocentric or inertial the Moon spins.”
Not at all. The only way the moon spins is if “orbital motion without axial rotation” is like the “moon on the right”. The consideration of whether “orbital motion without axial rotation” is like the MOTL or the MOTR goes beyond reference frames, which is why the moon issue is not resolved by reference frames.
The Moon is not like MOTL so it spins on its axis as it orbits the Earth.
Actually, for you, the Moon does not spin because you believe that it does not spin.
You reject all the evidence from gyroscopes, coriolis forces, centrifugal and Centripetal forces, weight variation with latitude, frames of reference, etc because they conflict with your belief.
Not at all. The only way the moon spins is if “orbital motion without axial rotation” is like the “moon on the right”. The consideration of whether “orbital motion without axial rotation” is like the MOTL or the MOTR goes beyond reference frames, which is why the moon issue is not resolved by reference frames.
It took till the 1850s to show whether the Earth rotated inside the universe or the universe rotated around the Earth.
Since then a number of tests have been developed to show that the Earth rotates on its axis. Note that these tests, some of which I listed above, are measuring forces and effects which would only occur on a rotating Earth and would not occur if the Earth did not rotate. They are also local Earth surface effects which do not require an external reference point and would work just as well in the back of a lorry with no windows.
Can you show that the local experiments which show rotation would show no rotation if done on the lunar surface?
Can you show that the tests can differentiate between an object that is only rotating about an external axis and one that is rotating about an external axis and rotating about an internal axis? For example, would the tests lead you to conclude that Mt. Everest is rotating on its own axis, at a rate of once per day, just because the Earth is rotating on its own axis? I know that in the case of gyroscopes, for instance, they could lead you to that erroneous conclusion.
“The only way the moon spins is if ‘orbital motion without axial rotation’ is like the ‘moon on the right'”.
As this is what actually happens it is obviously correct.
What an argument, RLH. What an argument. Here’s a counter-argument, at exactly the same level as yours:
"Orbital motion without axial rotation" is like the "moon on the left". As this is what actually happens it is obviously correct.
“Not at all. The only way the moon spins is if orbital motion without axial rotation is like the moon on the right. The consideration of whether orbital motion without axial rotation is like the MOTL or the MOTR goes beyond reference frames, which is why the moon issue is not resolved by reference frames.”
Rotation is a change in orientation. For determine that you need a reference frame. From the point of view of the Earth, the sun orbits the planet. That’s the geocentric view. And that was a view actually held by some in the past.
To understand that the Earth orbits the sun you need a different reference frame.
—————————————————————–
Here’s an experiment you can easily do. You can do it easily in your mind, too.
1. Stand and rotate on the spot, a single complete rotation lasting exactly 10 seconds.
2. Place a chair in the middle of a room and circumnavigate it once in exactly 10 seconds, facing only one wall throughout the orbit.
3. Now do 1 & 2 at the same time.
Will you keep the same side of you facing the chair over the 10 seconds? Or not?
barry, you don’t understand the motions involved. A rotation is a change in orientation, but a change is orientation is NOT a rotation. A train on an oval track is changing direction, but it is NOT rotating on its axis. The ball-on-a-string is changing direction, but it is NOT rotating. If the ball were rotating, the string would wrap around it.
Walking around a chair while always facing the same wall is “revolving” PLUS “rotation”. Notice that the person in the chair would see all sides of the person walking. Walking normally around the chair would be simulate revolving, or orbiting.
You don’t understand the motions involved, and you can’t learn.
Pup,
By your logic the train is going in a straight line,
Using that kind of geometry for celestial bodies would be quite clumsy.
Not as clumsy as Moon Dragon cranks are in general, but still.
Do the pole dance experiment.
barry, reference frames do not resolve the moon issue, and I’ve gone to the ends of the Earth to explain why, in hundreds of previous comments. That you weren’t paying attention isn’t really my fault.
“The ball-on-a-string is changing direction, but it is NOT rotating.”
Well then it cant be a good model for our Moon, since everyone of sound mind, even DREMT, agrees that it is ROTATING.
"The ball-on-a-string is changing direction, but it is NOT rotating…"
…on its own axis. I’ll just add that, for clarity, in case anyone obnoxious gets themselves all "confused". The ball on a string is rotating about an external axis, but not rotating on its own internal axis (as Bindidon, RLH, and other "Spinners" agree).
“Walking around a chair while always facing the same wall is ‘revolving’ PLUS ‘rotation’.”
No.
If you are always facing the same wall, you are not rotating. If you stand on the spot and I ask you to rotate a full rotation, you will see all four walls slide by as you do so.
The error is to always see the chair/Earth as the frame of reference.
From the POV of the Earth, the sun revolves around the Earth.
But we know that’s not true, due to expanding the frame of reference to the fixed stars (or the nearest ‘fixed’ star).
A person sitting in the chair would see all sides of the person facing one wall while circumnavigating the chair. To that viewer the other person is rotating.
But to anyone outside the chair’s frame of reference, the walker is not rotating while they move. And if the chair circumnavigator rotates WRT the walls, anyone outside the chair’s frame of reference will see them rotating.
And they will be rotating on their inner axis, plus orbit.
barry, what is the perspective that you see when you look at the "moon on the left"/"moon on the right" GIF?
Answered that below.
https://www.drroyspencer.com/2022/12/uah-global-temperature-update-for-november-2022-0-17-deg-c/#comment-1412155
You actually did not answer the question that I asked, but I will try to get you to do so down-thread. Thanks.
barry,
When viewed from the Moon, with the Earth high in the lunar sky, the Earth neither rises nor sets.
So, from the viewpoint of the Moon, it does not spin with respect to the Earth. From the viewpoint of the Earth, the Moon obviously does not spin – presenting the same face at all times.
By one definition, from outside the Moon’s orbit, it must rotate, otherwise all sides of the Moon could not be seen, could they? On the other hand, when viewed from within or without the Moon’s orbit, from a position above the Moon’s poles, only one side of the Moon can be seen – so it is not rotating, is it? Well, yes, it does – sort of. Physical librations have been measured, and one of them shows the Moon nodding back and forth around the axis of its orbital path. Is that rotating about an internal axis or not?
From a recent paper –
“The determined amplitudes reach 1.296′′ in longitude (after correction of two close forcing terms), 0.032′′ in latitude and 8.183′′ 3.306′′ for the wobble, with the respective periods of 1056.13days, 8822.88days (referred to the moving node), and 27257.27days. The presence of such terms despite damping suggests the existence of some source of stimulation acting in geologically recent times.”
Oh well, someone might figure it out sometime.
“So, from the viewpoint of the Moon, it does not spin with respect to the Earth. From the viewpoint of the Earth, the Moon obviously does not spin presenting the same face at all times.”
Yes. I completely agree with that statement.
From the viewpoint of the Earth, the sun obviously revolves around the Earth.
From the viewpoint of the Moon, the universe rotates around the Moon.
It’s all about which reference frame you pick.
I’m going to repeat a thought experiment from above. See if it intrigues you.
——————————————————————
1. Stand and rotate on the spot, a single complete rotation lasting exactly 10 seconds.
2. Place a chair in the middle of a room and circumnavigate it once in exactly 10 seconds, facing only one wall throughout the orbit.
3. Now do 1 & 2 at the same time.
Will you keep the same side of you facing the chair over the 10 seconds? Or not?
test
barry…”Place a chair in the middle of a room and circumnavigate it once in exactly 10 seconds, facing only one wall throughout the orbit”.
***
Barry, you need to do this scientifically, not as a thought experiment. That’s how Einstein got screwed up about time dilation.
Be sure to read part 2) following this part.
1)The first point to note is that you cannot replicate the motion of the Moon by walking a circular path. To do that, you have to introduce a false rotation to mimic the motion of the Moon, which always has a linear velocity. The interaction of the Moon’s linear momentum with the Earth’s gravitational field produces the orbit. It is simply not possible to replicate that motion by walking a circle. However, you can demonstrate the aspect of keeping the same side pointed at the centre albeit through manually inducing a rotation. I’ll cover that in part 2).
Place the chair at 0,0 on an x-y coordinate system. Locate yourself along the +ve x-axis at +5. You are going to following a circle with radius = 5 going CCW, so you are facing north. Therefore, your left shoulder is facing the chair.
According to you, you start walking along the circular path from 3 o’clock (east) while rotating yourself CW so you are still facing north (12 o-clock) at the y-intercept at 90 degrees. However, you will have to do some fancy stepping to accomplish the 90 degree rotation. You can’t do it by walking straight ahead.
Already, your left shoulder is not facing the chair, it is pointing 90 degrees from where the chair is located.
To continue rotating CW you must now walk backwards to 9 o’clock while still rotating CW. At 9 o’clock your left shoulder is now pointed 180 degrees from the chair.
You continue around the circle, still walking backwards, till you reach the 6 o’clock (south mark). After that you can start walking relatively forward till you reach the 3 o’clock position again.
I don’t understand the point you are trying to make but you have essentially rotated yourself through 360 degrees during the orbit. However, you have not kept your left shoulder facing the chair.
I have not looked at MOTR recently but I don’t think the action is the same as you have described. I don’t recall the MOTR Moon rotating at all. It’s like a gondola car on a Ferris wheel.
2)Try it another way. Starting out with your left shoulder facing the chair, at 3 o’clock, try to replicate the motion of the Moon. It moves in a straight line and over 8 km, gravity draws it off its path by about 5 metres. At no time during that process is it rotating about a local axis. It is always moving straight ahead at any instant.
To replicate that motion, you need to walk a step then re-orient your body. However, you need to rotate to do that whereas the Moon does not. That’s the key to understanding the lunar motion.
Replace the chair with a proper axle that will rotate. Attach a hook to the axle to which we can attach a rope. At the other end, we put on a harness with a hook for the other end of the rope. The harness has shoulder straps that prevents it rotating on our body. Attach the harness to the rope and start walking at 5,0.
Now we are like a ball on a string. As we walk in a circle the axle allows us to walk freely but we cannot rotate because the harness won’t allow rotation about our vertical axis. Yet, we always keep the same side pointed at the axle.
This motion is curvilinear translation, just like the Moon.
“curvilinear translation” is just word salad created by you. Other people call it an orbit, which does not require (though it may have) any rotation. The 2 motions are independent of each other.
Now you’re getting it, RLH. The two motions are separate from one another. There’s "orbital motion", or "orbit", or "orbit without spin", or "orbital motion without axial rotation" (all meaning exactly the same thing), which is motion like the "moon on the left". Then there is "axial rotation". You have to keep the two motions separate from one another.
So, for example, motion like the "moon on the right" is "orbital motion" as well as axial rotation, once per orbit, in the opposite direction to the "orbital motion".
We’ll get you up to speed with the absolute basics of this argument in no time.
“orbit without spin” is like MOTR.
Well, that’s what you’ve got to provide evidence for.
” Theres “orbital motion”, or “orbit”, or “orbit without spin”, or “orbital motion without axial rotation” (all meaning exactly the same thing)”
This is the fundamental logical failure. Obviously they dont mean exactly the same thing. Otherwise there would be no need to add ‘without spin’ or ‘without axial rotation’.
‘Orbit’ or ‘orbital motion; says NOTHING about spin or rotation, just as it says nothing about the color of the planet.
The evidence for this is that Earth orbits: it has orbital motion.
The fact that Earth has orbital motion does NOT mean it is without axial rotation!
Troll Nate, the fact that you can ramble in circles does not mean you know anything about the issue here.
Where’s your model for OMWAR (orbital motion without axial rotation)?
“The first point to note is that you cannot replicate the motion of the Moon by walking a circular path. To do that, you have to introduce a false rotation to mimic the motion of the Moon…”
But it’s not a false rotation. It’s simply a rotation.
Your attempt to argue that facing the same wal is a rotation is simply done by making the frame of reference be the chair. Thus, you argue, if the shoulder turns from its orientation WRT the chair, it must be rotating.
But if you base the coordinate system on the 4 walls of the room, then the North wall-facing orbiter is certainly not rotating with respect to them.
In celestial mechanics you will not be able to explain much outside the Earth/Moon system with the frame of reference you are using.
The frame of reference you are using would mean that the Sun orbits the Earth.
And in order to explain why this is not so, you will have to abandon the frame of reference you are using to postulate the Moon does not rotate.
barry, what is the perspective that you see when you look at the "moon on the left"/"moon on the right" GIF?
Can’t remember which is which, but the Moon that maintains its orientation WRT to the borders of the page is not rotating, and the Moon that behaves like our own Moon is rotating WRT the same reference frame.
Here you go, barry:
https://upload.wikimedia.org/wikipedia/commons/5/56/Tidal_locking_of_the_Moon_with_the_Earth.gif
Now, base a coordinate system on the 4 walls of your computer screen. What sort of reference frame are we looking at with this GIF? Inertial or non-inertial?
For the purpose of argument the 4 sides of my monitor are an inertial reference frame, analogous to the fixed stars.
(In reality any FOR on the surface of the Earth is non-inertial, as it undergoes acceleration WRT the fixed stars. That’s why it is invalid to use a geocentric FORF to explain celestial mechanics. Geocentrism just couldn’t explain the motion of the planets in our solar system)
"For the purpose of argument the 4 sides of my monitor are an inertial reference frame, analogous to the fixed stars."
Well done, barry. I would agree.
Now, what is being argued, is that motion like the MOTL represents "orbit without spin". So that’s motion like the MOTL representing "orbit without spin", wrt an inertial reference frame. It’s not being argued that motion like the MOTL represents "orbit without spin" wrt a "geocentric" reference frame. It’s being argued that motion like the MOTL represents "orbit without spin" wrt an inertial reference frame.
The "Spinners", on the other hand, think that motion like the MOTR represents "orbit without spin". So that’s motion like the MOTR representing "orbit without spin", wrt an inertial reference frame.
Axial rotation then has to be kept separate from these motions. So, if "orbit without spin" is like the MOTL, axial rotation must be kept as a separate motion from that. Or, if "orbit without spin" is like the MOTR, axial rotation must be kept as a separate motion from that.
Do you understand yet why reference frames do not resolve the moon issue, or do I need to continue?
No, your remarks there don’t address the point about reference frames or make any kind of argument. Summing up what you said:
1. Agreed on inertial reference frame
2. Axial rotation and orbit are separate matters
3. MOTL is not spinning
4. MOTR is spinning
2, 3 and 4 are assertions, not arguments. I agree with 2, not 3 and 4.
The MOTL is clearly spinning with the FOR being the monitor screen. It changes its orientation to that reference frame constantly. It fulfils the geometric definition of rotation. We can prove this by applying point 2.
2. Axial rotation and orbit are separate matters
So simply stop the orbit of both Moons while maintaining the inertia of their axial movement WRT the monitor frame. The MOTL is now rotating on the spot, and the MOTR is not rotating.
Because orbit and rotation are separate, I’ve simply removed the orbit from the equation, revealing what each Moon is doing WRT an inertial frame.
This is the same proof as my example above walking around a chair. If in a room you rotate on the spot for 10 seconds = 1 rotation, and then orbit a chair for one orbit = 10 seconds, and then you do both at the same time, you will keep one side of you facing the chair the whole time.
As long as the rotation period is measured WRT the 4 walls, our inertial reference frame, this will remain true.
To argue otherwise is to abandon the inertial reference frame.
OK, you are still not getting it. Let’s try a different tack.
As Bindidon agreed upthread:
https://www.drroyspencer.com/2022/12/uah-global-temperature-update-for-november-2022-0-17-deg-c/#comment-1409168
“Rotation about an external axis with no rotation about an internal axis” is motion like the MOTL.
Do you agree (it’s been settled in about a dozen different ways already, but we can go through the motions again if you must)?
…also, this video might help:
https://youtu.be/ey1dSUfmjBw
It shows:
1) One axial rotation per orbit, in the same direction as the orbit.
2) Orbit without spin.
3) One axial rotation per orbit, in the opposite direction to the orbit.
All from the “Non-Spinner” perspective, where “orbit without spin” is as per the MOTL.
The error in the video is that the Earth is the frame of reference, not the universe, which is the inertial frame of reference.
The narrator even says it:
“…we can observe that the reference arrow on the moon is always pointing to the Earth’s centre both when it is at rest and also when it is orbiting the Earth which means that it is not rotating.”
The entire video is premised on the Earth being the frame of reference. The centre of the coordinate axes is the centre of the Earth.
2) Rotation about an external axis, with no rotation about an internal axis, is motion like the “moon on the left”.
Disagree, as explained in various ways just above.
MOTL and MOTR orbit the Earth at the same rate – one rotation takes 4 seconds. Let’s take the MOTL with a starting position at 12 o’clock, or North. We put a marker on the Moon’s surface at the Northern most point in our GIF.
1 second: that marker has moved 90 degrees and is now facing the Western border of your monitor
2 seconds: the marker now faces South
3 Seconds: the marker now faces East
4 seconds: the marker faces North again
In 4 seconds the marker has seen every point on the compass.
The monitor borders is the frame of reference, we agree.
Now let’s maintain that momentum relative to the monitor borders, but discontinue the orbit.
The MOTL is no longer orbiting, but the marker will still face every point on the compass in 4 seconds.
And because we are agreed that orbit and rotation are separate, you cannot argue that stopping the orbit changed anything, or you would have to contradict yourself.
“motion like the MOTL represents ‘orbit without spin'”
Just because you say it does not make it correct.
“”2) Rotation about an external axis, with no rotation about an internal axis, is motion like the “moon on the left”.
Disagree, as explained in various ways just above.”
So you disagree with Bindidon on this one. OK. Well, we can settle this one quite easily. Using this:
http://www.shodor.org/interactivate/activities/Transmographer/
Rotate an object around point 0,0 forty-five degrees at a time. It will move as per the MOTL, and it does so in only one motion (you can also rotate the object around its own internal axis, but that is a separate function of the transmographer).
Point settled.
“The entire video is premised on the Earth being the frame of reference”
Absolutely not, barry, as he continually refers to what can be observed from outside the moon’s orbital path, throughout. The entire apparatus is presenting the moon’s motion to you from the same perspective as the GIF.
What is happening with the video is that “orbit without spin” is being constrained to be motion like the MOTL. Axial rotation is then being kept separate from that motion. Having the moon mounted on a rigid, rotating arm keeps “orbit without spin” as a rotation about an external axis, the axis in question being located within the Earth. With the moon motor switched off (and thus with zero rotation about an internal axis) the moon moves as per the MOTL.
This is a further proof that “rotation about an external axis with no rotation about an internal axis” is motion like the MOTL, in case you needed it.
You could set up a similar apparatus to show the situation from the “Spinner” perspective. Using an XY Plotter, you could mount a small fake moon on the end of the pen. You could program the XY Plotter to move the moon in a circle, around a fake Earth in the center of the circle, at the press of a button. You could attach a motor to the moon so that it rotates around an internal axis at the press of another button.
Due to the way the XY Plotter functions, if you just pressed the orbit button, but not the internal axis rotation button, the moon would move like the MOTR. You could describe this motion as “translation in a circle” if you were a “Spinner”. If you were to press both buttons, and the moon motor rotated the moon in the same direction as the orbital motion at a rate of once per orbit, you would get motion like the MOTL.
So the difference between the two contraptions has nothing to do with reference frames. The difference is simply, how is “orbit without spin” engineered? This is the same with the moon issue, generally. The issue is not resolved by reference frames, it is a question of “what is orbit without spin”? Is it like the MOTL (rotation about an external axis) or like the MOTR (translation in a circle)?
Let me know if this has helped.
Exactly, Barry.
Little Willy agrees with barry, thus disagreeing with Bindidon. However, Bindidon is correct on this occasion, as I explained.
Gaslighting Graham *still* relies on his silly 1+1 trick:
His transmographer emulates orbit and spin at the same time.
In the skies, gravity does not pull the Moon so that its orientation should remain fixed like he pretends. It wobbles and spins as she orbits.
I await a response from barry, the only person I’m interested in talking to, on this sub-thread. Not wasting my time on another interminable back and forth with an ineducable buffoon.
Everyone awaits a numerical model of the Earth-Moon system that would satisfy Moon Dragon cranks for Newtonmas.
“Rotate an object around point 0,0 forty-five degrees at a time. It will move as per the MOTL”
We all understand what ROTATE means. Stop pretending that means ORBIT, which is we have all seen is defined differently from rotation.
Here is orbital motion:
https://youtu.be/uMdVWc_a-lc?t=79
Sounds like we have another one who agrees that "rotation about an external axis with no rotation about an internal axis" is motion like the MOTL, barry. You’re up against some tough competition, whenever you should return to the debate…
Again, for those who recognize contradictory logic.
As conceded by DREMT, for an independent body free to rotate on its own axis (ie not fixed to a rotating platform), and moving like the MOTL, it is appropriate to describe its motion as
‘(2) translation in a circle and rotating on its own axis’
SO it is odd that he keeps contradicting himself.
Whilst we wait for a response from barry, I guess another timely reminder might be appropriate:
https://www.drroyspencer.com/2022/12/uah-global-temperature-update-for-november-2022-0-17-deg-c/#comment-1411960
Some people are just not good at following simple logic, even their own.
Both Tim’s and DREMT’s horses were on a rotating MGR, and both moving like the MOON ON THE LEFT.
The only difference was that DREMTS was bolted to the MGR while Tim’s was on a frictionless axel and thus free to rotate on its axis.
DREMT stated:
“The motion of the wooden horse can be described in either of two ways:
1) Rotation about an external axis, with no rotation about an internal axis.
2) Translation in a circle, with rotation about an internal axis.”
DREMT stated that for Tim’s horse:
“In your scenario, 2) is appropriate, since that accurately describes the mechanics of the situation.”
The ONLY difference was that Tim’s was FREE TO ROTATE ON ITS OWN AXIS.
Just as is the case for all planets, the Moon, and the moon on the left.
https://www.drroyspencer.com/2022/12/uah-global-temperature-update-for-november-2022-0-17-deg-c/#comment-1410294
Seems like that timely reminder was indeed appropriate, though some people simply cannot learn from it. Instead they lie about Tim’s scenario, which was actually a wooden horse mounted on the back of a truck on a frictionless axle, physically pushed so that it was literally, unarguably, rotating on its own axis. Then the truck was driven in a circle at the same rate the wooden horse was rotating on its own axis.
It’s a similar story to the XY Plotter scenario that I already wrote about in my 5:42 AM comment. Some people obviously don’t actually read my comments, or even Tim’s comments, properly, they just skim them and pick up on a few words that trigger them into bitchy little responses. Oh well, failures that I no longer directly respond to will be failures that I no longer directly respond to.
Basically, the issue will always come down to "what is orbit without spin" – is it motion like the MOTL, or motion like the MOTR? Really, really, simple stuff.
“Tims scenario, which was actually a wooden horse mounted on the back of a truck on a frictionless axle, physically pushed so that it was literally, unarguably, rotating on its own axis. Then the truck was driven in a circle at the same rate the wooden horse was rotating on its own axis.”
Some people work extremely hard to NOT recognize the exact SAME MOTION as the horse mounted on a rotating MGR and the moon on the left, can be produced in different ways, which was precisely the Tim’s POINT. He sez:
“DREMT is confronted with two scenarios, both where the horse moves EXACTLY the same way. Yet he is certain the MOUNTING and not the MOTION determines if the horse is rotating or not.”
As they previously recognized:
“Tim is confronted with an example of a wooden horse securely bolted to the floor of a carousel so that it physically cannot rotate on its own axis, and can only rotate about the axis of the carousel, thus demonstrating that (as Bindidon agrees) ‘rotation about an external axis with no rotation about an internal axis’ is motion like the moon on the left.
So, what does he do? He immediately puts the wooden horse on bearings, so that it can rotate on its own axis”
I love it when stalkers I no longer respond to underestimate my intelligence, and get completely the wrong idea of what I meant. They then start acting like I didn’t understand something that I quite obviously did, and in fact even wrote about in my 5:42 AM comment, with the XY Plotter scenario. They just can’t help themselves, and that’s one of the many reasons why I stopped directly responding to them.
“Using an XY Plotter, you could mount a small fake moon on the end of the pen. You could program the XY Plotter to move the moon in a circle, around a fake Earth in the center of the circle, at the press of a button. You could attach a motor to the moon so that it rotates around an internal axis at the press of another button.”
This is a point I made long long ago. The simplest way to satisfy the definition of orbit is to follow an orbital path in exactly the way an XY plotter does it. It moves the pen in a circle without rotating the pen. And BTW this is exactly the way children draw circles.
It never made a bit of sense to argue that having the pen move in a MORE complicated way, ie moving in a circle whilst rotating on its axis, which clearly requires the engineer to program an EXTRA ROTATIONAL motion, is somehow one motion that is SIMPLY ORBITING.
Then to argue that the MOR is the one that has the EXTRA rotational motion is completely ridiculous and self serving, when in fact that motion requires the pen to be moved with the simplest programming of a single motion.
And let me point out that having ORBITAL motion on elliptical orbits be defined as moving the pen on an elliptical path the simplest way an XY plotter would do it, again makes the most sense.
Whereas having the pen reproduce ORBITAL MOTION by moving on an elliptical path whilst turning to orient along the path, would be needlessly complex, and would not produce the correct motion of the Moon in any case!
If only entire comments, and even whole discussions, could be read and understood, before stalkers interjected. Then again, it would be so much better if they just got the message, and stopped butting in, in the first place.
Did DREMT make this statement?:
“2) is appropriate, since that accurately describes the mechanics of the situation.”
?
He certainly did. Now perhaps he’d like to undo it.
He has had many opportunities to do so, or to explain it away, but he has not done so.
Just a reminder, to whomsoever it may concern, that:
a) "Orbital motion without axial rotation" is motion like the "moon on the right"
does not follow from:
b) Objects in orbit are free to rotate on their own axes, or not.
Claiming that a) follows from b) is a non-sequitur, because "orbital motion without axial rotation" could be motion like the "moon on the left", and objects still be free to rotate on their own axes, or not, separate to that motion.
And let me further point out that some people may say that having an object ROTATE around an external point is simple and ONE MOTION.
Indeed so.
Astronomy and physics has sought to describe motion in the simplest and most useful way possible. And early on it was motion of the planets that they sought to describe.
Having an object simply ROTATE around a point will NEVER EVER produce an elliptical orbit. And trying to use this method will needlessly complicate describing planetary orbits and rotations.
THUS, physicists and astronomers found that simplest and the most useful way of describing planetary motion was to describe orbital motion as movement of the COM on a path, like the way an XY plotter pen is moved, and to SEPARATELY describe ROTATION of planets around any axis passing through the COM.
Again, I would simply challenge the non-spinners to show us a different way that is both simpler and more useful.
If they can’t, then they SHOULD acknowledge that what Astronomy has been doing for 400 years is likely the BEST approach.
Once again, it sounds like we have another one who agrees that "rotation about an external axis with no rotation about an internal axis" is motion like the MOTL, barry. You’re up against some tough competition, whenever you should return to the debate…
“Just a reminder, to whomsoever it may concern, that:
a) “Orbital motion without axial rotation” is motion like the “moon on the right”
does not follow from:
b) Objects in orbit are free to rotate on their own axes, or not.
Claiming that a) follows from b) is a non-sequitur”
Just a reminder that describing a motion IDENTICAL to the motion of the Moon on the Left as
“2) Translation in a circle, with rotation about an internal axis.
“since that accurately describes the mechanics of the situation.”
And The ONLY difference in that mechanics was that it was FREE TO ROTATE ON ITS OWN AXIS,
which the moon on the left, MOL, certainly satisfies!
Thus one has, perhaps inadvertently, describe the motion of Moon on MOL as
2) Translation in a circle, with rotation about an internal axis.
Having done so, then it certainly does follow that the MOR must be described as
“without axial rotation”
And the above lengthy discussion about why Physics and Astronomy defines ORBIT the way it does certainly reinforces the fact that the MOR would be described as
“Orbital motion without axial rotation”
Again, one can make up their OWN DEFINTIONS of things, but if they are not useful in the real world and science and physics and astronomy don’t use the same definitions then, really, what is the point?
“Once again, it sounds like we have another one who agrees that “rotation about an external axis with no rotation about an internal axis” is motion like the MOTL”
Actually NOT, nor did the poster of this comment.
They agreed that the MOTL motion CAN BE DESCRIBED in two possible ways, but the mechanics of the situation, and what physics and astronomy require for describing planetary motion, calls for it to be described as
2) Translation in a circle, with rotation about an internal axis.
or
“orbital motion with axial rotation”
Some people need to get their story straight.
It was indeed a timely reminder, but ignorant stalkers simply lack the intelligence to understand that my point refutes theirs, and they think that if they just keep repeating their point indefinitely, they somehow win something. That is one of the many reasons I stopped responding to them directly.
People claim that others who refute their arguments simply ‘don’t understand’ their arguments, but in reality their argument was simply not convincing.
And yet they will falsely claim it is ‘settled’ in their favor.
Thats how we recognize thoroughly dishonest trolling.
…was indeed a timely reminder, but ignorant stalkers simply lack the intelligence to understand that my point refutes theirs, and they think that if they just keep repeating their point indefinitely, they somehow win something. That is one of the many reasons I stopped responding to them directly.
Again, I would simply challenge the non-spinners to show us a different way of describing planetary motion in general, that is both simpler and more useful than what astronomy has been doing for the last 400 years.
If they could do that, and show that it works, THAT would be a convincing argument.
But sadly such an argument will never be made.
…indeed a timely reminder, but ignorant stalkers simply lack the intelligence to understand that my point refutes theirs, and they think that if they just keep repeating their point indefinitely, they somehow win something. That is one of the many reasons I stopped responding to them directly.
And let me simply point out that these are clearly stated arguments that no one offered any rebuttal for:
https://www.drroyspencer.com/2022/12/uah-global-temperature-update-for-november-2022-0-17-deg-c/#comment-1413413
https://www.drroyspencer.com/2022/12/uah-global-temperature-update-for-november-2022-0-17-deg-c/#comment-1413417
https://www.drroyspencer.com/2022/12/uah-global-temperature-update-for-november-2022-0-17-deg-c/#comment-1413439
Thats how we recognize convincing arguments.
…a timely reminder, but ignorant stalkers simply lack the intelligence to understand that my point refutes theirs, and they think that if they just keep repeating their point indefinitely, they somehow win something. That is one of the many reasons I stopped responding to them directly.
“and they think that if they just keep repeating their point indefinitely, they somehow win something.”
The irony and morony seems lost on people…
…timely reminder, but ignorant stalkers simply lack the intelligence to understand that my point refutes theirs, and they think that if they just keep repeating their point indefinitely, they somehow win something. That is one of the many reasons I stopped responding to them directly.
DREMT,
I’ve replied downthread.
https://www.drroyspencer.com/2022/12/uah-global-temperature-update-for-november-2022-0-17-deg-c/#comment-1413805
Yes, barry. Without taking on board a single thing that I tried so hard to explain to you, I noticed.
https://www.drroyspencer.com/2022/12/uah-global-temperature-update-for-november-2022-0-17-deg-c/#comment-1411897
barry and Ent, where’s your model of “orbital motion without axial rotation”. You need a model that works. Just throwing crap against the wall ain’t science.
Braindead cult idiots need to learn these issues are about science. Real science is based on reality. False religions are based on false beliefs.
Science says:
* Moon orbits, it does NOT rotate.
* Ice cubes can NOT boil water.
* Earth does NOT have a “real 255K surface”
Reality is a bitch, huh?
Here is a game, Pup:
You show me your Moon Dragon crank numerical models of the Earth-Moon system.
In return, I show you numerical models in which the Moon spins.
For every model you got that I cannot match, I disappear for one month.
For every model I got you cannot match, you disappear for one month.
What do you say?
Worthless willard, where’s your model of “orbital motion without axial rotation”?
You don’t have a clue, so you’re allowed to ask a responsible adult.
Your sammich, Pup.
Grow up and make it.
When will you admit that you got not numerical model of the Earth-Moon system that meets Moon Dragon cranks’ requirements?
Still no model, worthless willard.
But keep trolling. You’re impressing your other braindead cult idiots.
Your loss, Pup.
Don’t count on me to get you out or your hole.
At least you understand that without the model you’re asking for Moon Dragon cranks like you got NOTHING?
But please, continue digging.
The reason you have to keep trying to pervert reality is because you’ve got NOTHING, worthless willard.
Not at all, Pup.
The reason why I don’t give you a numerical of the Earth-Moon system in which the Moon spins is because you’re a coward.
Do the Pole Dance Experiment.
“Science says:
Moon orbits, it does NOT rotate”
Wrong. Science says exactly the opposite. The Moon both orbits the Earth and rotates.
“DREMT has the right idea that we can each have our own personal idea of what is orbital motion without axial rotation should mean. Everyone one should be able to recognize and understand the two basic ideas. Moon on left or moon on right.”
Are you paying attention, Little Willy?
As Willy claims, he has his own personal notions on reality.
C’mon, Gordo.
Here you go:
https://www.drroyspencer.com/2022/12/uah-global-temperature-update-for-november-2022-0-17-deg-c/#comment-1412097
Fraudkerts, where’s your model of “orbital motion without axial rotation”?
Endless rambling ain’t science, it’s fraud.
MOTR
That’s not a model, though, RLH, that’s just a motion. Good to see you putting Little Willy straight, though. He’ll eventually take it onboard that "Spinners" see "orbital motion without axial rotation" as motion like the MOTR, as I explained to him at great length, but he insisted I was wrong, even though I was obviously right, once again.
MOTR is a model of what would happen if the Moon did not rotate once on its orbit of the Earth.
It’s a motion, not a model. You need something like the "ball on a string", but for motion like the MOTR. I’m sure you can think of something.
Ball on a string has nothing to do with orbits which are elliptical, not circular.
So come up with a model for “orbital motion without axial rotation”, then…
A Moon Dragon crank model of the Earth-Moon system would actually be a good idea!
Your eternal silence on this issue might be a good idea, since you’ve never actually added one single point of any substance on it that hadn’t already been raised by someone else before you.
Gaslighting Graham soldiers, trolling this website for more than 75 months about an issue for which he has no numerical model.
But time to troll he has plenty!
Little Willy, please stop trolling.
Tim,
You are letting your imagination run away with you again.
1. The Moon’s orbit and physical librations as observed are not perfectly regular. Exact predictions are impossible. From NASA – “The rotation rate of the Moon is pretty steady. However, the orbiting motion of the Moon is not steady–at some times it advances faster than average, some times it is slower. The result is pretty similar to the above example of uneven rotation, and that is a second kind of libration.” Pretty steady, not steady, pretty similar, uneven rotation – exact prediction?
2. How do you test the prediction? Turn off gravity? Good luck with that!
3. It doesn’t matter how big the M or R is. If it takes the same time to complete one revolution about the axis of its orbit, r has no effect on the number of radians per second covered.
However, you might want to look at the spinlauncher. The rocket shaped payload presents the same side to the centre of the launcher, as it is spun up in a vacuum chamber, to some thousands of gs. When released, the payload maintains orientation, and does not rotate around its centre as it leaves the launcher. Why should it?
If you can find anybody at all who claims they can model all of the Moon’s various motions exactly, it is highly likely, if not completely certain, that they are more than a little delusional. As Feynman said “It doesn’t matter how beautiful your theory is, it doesn’t matter how smart you are. If it doesn’t agree with experiment, it’s wrong.
Mike Flynn,
What are you braying about?
1) That entire article you quote is assumes that the moon DOES rotate on it’s axis, and at a very steady rate. The “above example” that you think supports your claim was shot down as incorrect! (“No, this does not happen.”)
2) It is easy to break a string. It is easy to pull a pin or release a magnet to remove the centripetal force. It is easy to observe the subsequent motion. Not for the moon, bot for myriad similar cases. It would be astonishing beyond belief to think that circular motion due to gravity (and gravity alone) follows a different set of rules than all other circular motion.
3) You can come back when you have a comment about angular momentum. So far all you have done is agree that when (omega) is assumed to be steady, then (omega) is steady.
Finally, it is not about necessarily be *perfect* in a prediction (no measurements or theories are perfect), it is about being ‘close enough’. You are basically arguing “hey the experts are off by 0.001 degrees and I am off by 1 degree. Since neither is perfect, either one is just as good as the other.”
tim f…”It would be astonishing beyond belief to think that circular motion due to gravity (and gravity alone) follows a different set of rules than all other circular motion”.
***
There is a different set of rules for motion in a gravitational field. There is nowhere in a terrestrial environment that you can replicate the momentum of the Moon as it interacts with Earth’s gravitational field.
You can apply Newton’s laws in part but not fully, since there is virtually no acceleration involved. The curvature of the Earth is such that 5 metres of elevation is lost for each 8000 metres of tangential direction. That 5 metres of movement is enough to maintain the Moon at a relatively constant altitude but not enough to move the Moon out of its orbit.
The Moon does not accelerate vertically over that 8000 metres, the tangential velocity is so high there is virtually no time to establish an acceleration. Besides, the gravitational field is not strong enough to accelerate the Moon vertically, it’s just barely enough to move the Moon 5 metres toward Earth for every 8000 metres of tangential motion.
What kind of circular motion in a terrestrial environment can replicate lunar motion? Normally, circular motion in a terrestrial environment involves rigid bodies attached physically to an axle. It’s done in a magnetron (radar/microwave ovens) with electrons, where the electrons are forced to orbit inside a magnetron cavity. I can’t think of any other environments like that of the Moon-Earth although I’m sure they exist.
“Besides, the gravitational field is not strong enough to accelerate the Moon vertically, its just barely enough to move the Moon 5 metres toward Earth for every 8000 metres of tangential motion.”
There is a change in velocity (direction). Therefore there is acceleration. Gravity DOES accelerate the moon. To say otherwise it to deny the definition of “acceleration” as given in every textbook since the time of Newton!
“There is a different set of rules for motion in a gravitational field.”
I am not sure what difference you mean. Force is still mass x acceleration. Torque is still rxF. acceleration is still dv/dt. Energy and momentum and angular momentum are still conserved. Those rules of mechanics are the same.
Gravity is simply one specific force to which the rules are applied.
Tim,
Earlier you wrote –
“I can think of a few obvious tests to help judge which is better.
1) What does your model predict for libration. Not just approximately, but exactly.”
Are you now redefining “exactly” to mean “close enough”, which of course you will determine to suit your purposes.
It’s about as silly as you saying “You are basically arguing . . . “, when I am not arguing at all. If you quote what I wrote, and then state some factual reasons for any disagreement, you might establish some credibility.
Indeed, it is easy to break a string. If a released body starts to rotate about its COM, some outside force has caused it. Refer to Newton – or the spinlauncher, if you want something recent and practical.
As to angular velocity, you tried to obfuscate the issue by M, R, and r – no doubt trying to appear more knowledgeable than you are. Others will notice that angular velocity does not depend on M, R, or r.
You are just looking like a SkyDragon who has been caught out talking nonsense yet again.
“Are you now redefining ‘exactly’ to mean ‘close enough’?”
Models can give exact predictions. But the agreement with measurements is never exact. Nothing was redefined. In this case, there were scientific predictions that predicted librations that agreed with measurements to with in seconds of angle. The “non-spinners” have never (as far as I can recall) even made numerical predictions for libration.
“As to angular velocity … ”
The original issue was angular momentum. Not angular velocity.
You are just looking like well-meaning fellow who doesn’t *quite* understand what is going on.
Tim,
Maybe you are incapable of reading what you wrote, which was –
“I can think of a few obvious tests to help judge which is better.
1) What does your model predict for libration. Not just approximately, but exactly.”
Notice the word “exactly”. Or does “exactly” only apply to others, when you are dictating what others must do to satisfy you?
As to angular momentum, yes, your statement was –
“3) What does your model predict for angular momentum? (For example a uniform ball of mass M and radius R mounted rigidly a distance r from the center of a merry-go-round turning (omega) radians per second.” I have no mindreading ability, so I wrongly assumed you really meant other than what you wrote. I apologise.
By your definition, the object is mounted rigidly some distance away from a centre of rotation, and therefore not rotating about an internal axis. In the case of the Moon, one answer is approximately 2.9 x 10^34 kgm^2/s, but I guess you were meaning something else, and just kept it secret.
Here’s something easy for you – provide a description of the GHE consistent with the fact that the Earth is cooler now than when the surface was molten.
How hard can it be?
.
John Tillman thank you for the information.
Comparing more than five decades of solar evolution and activity proxies. From top to bottom: (a) the total (black) and hemispheric sunspot numbers (northred, and bluesouth); (b) the latitude-time variation of sunspot locations; (c) the Oulu cosmic-ray flux; (d) the Penticton F10.7 cm radio flux; (e) a data-motivated schematic depiction of the Suns 22 years magnetic activity cycle; and (f) the variability of the Oceanic Nio Index (ONI) over the same epoch. The black dashed lines mark the cycle terminators.
https://agupubs.onlinelibrary.wiley.com/cms/asset/92b6010a-0f33-4c89-b777-5c1f193b5e0c/ess2782-fig-0004-m.jpg
Based on the mSEA of the past 60 years, an enduring warm pool in the central and western Pacific at solar minimum (ONI has been consistently positive since early 2018, even though it never got so warm to become a fully fledged strong El Nio event) was not unexpected, and we expect a rapid transition into La Nia conditions later in 2020 following the sunspot cycle 24 terminator. Given the warm waters, we project a particularly active Atlantic hurricane season in 2021, and maybe even 2020, depending on exactly when the terminator and ENSO transition occurs this year.
https://agupubs.onlinelibrary.wiley.com/doi/10.1029/2020EA001223
We are not the first scientists to study how solar variability may drive changes to the Earth system, Leamon said. But we are the first to apply the 22-year solar clock. The result five consecutive terminators lining up with a switch in the El Nino oscillation is not likely to be a coincidence.
In fact, the researchers did a number of statistical analyses to determine the likelihood that the correlation was just a fluke. They found there was only a 1 in 5,000 chance or less (depending on the statistical test) that all five terminator events included in the study would randomly coincide with the flip in ocean temperatures. Now that a sixth terminator event and the corresponding start of a new solar cycle in 2020 has also coincided with an La Nina event, the chance of a random occurrence is even more remote, the authors said.
https://www.sciencedaily.com/releases/2021/04/210405075853.htm
The reason there is correlation, Ireneusz, is because as solar activity increases the heliosphere expands. It acts as a shield to cosmic rays from interstellar Space. Thus fewer cosmic rays reach Earth when the Solar activity (sun spots) increases. We now know that cosmic rays assist cloud formation, so less cloud coverage of course leads to warmer temperatures and vice versa. Carbon dioxide has nothing to do with climate change and nobody can prove it does, least of all the CEO of the CSIRO in Australia who did not even have any document explaining the false method used by climatologists to quantify surface temperatures.
You just revealed my secret how I predicted superdeveloping La Niňa
La Niňa supermodelz
https://youtu.be/5P2JKJ-XSdU
The sun is singing and playing with our clouds
Dr Roy gets a special mention on this important page that all should read … unless you enjoy being fooled here:
http://www.climate-change-theory.com/climate-blog-errors
Well deserved.
https://www.space.com/james-webb-space-telescope-science-breakthrough-of-2022
The engineering was fascinating. I love that space exploration can be done with robotics. Keeping humans out of space craft greatly reduces both the cost and the nonsense. Killing space travelers is NOT science.
JWST verified that an “atmosphere” will cool. Also verified was low energy photons cannot warm a surface with greater mean molecular vibration frequency.
That’s science.
“Also verified was low energy photons cannot warm a surface with greater mean molecular vibration frequency.”
Sure, microwave ovens can’t work!
Just one more in a long line of Clint brain farts.
Troll Nate, microwave ovens have been explained to you before. But, you’re braindead. You can’t learn.
Just observe that there are no microwave ovens in the atmosphere. That should be simple enough for you….
Your ‘physics’ theory fails to agree with experiment, so its wrong. End of story.
Troll Nate, your imagination fails to agree with reality. The atmosphere contains NO microwave ovens. Not even close….
Your stated physics ‘theory’ makes no mention of only working in the atmosphere. In fact youve claimed it works in space!
“Also verified was low energy photons cannot warm a surface with greater mean molecular vibration frequency.”
So if I take microwave photons, they are much much lower in energy and frequency than the mean energy and mean (IR) frequencies of photons emitted by surfaces with molecules vibrating at room temperature, like water. I can shine those microwave photons at a room temperature cup of water, then that surface SHOULD NOT WARM according to your stated theory.
I have done that experiment. The surface of the water DOES WARM.
Your theory is proven wrong. End of story.
So you need to revise your ‘theory’, explain when and how it works, what it predicts, and back it up with experimental evidence.
Or you can just stop making up fake physics.
Your choice.
I am trying to understand the reason for justifying the costs. Optical telescopes are essentially useless for more than taking pretty pictures at a distance. The resolution is 0.1 arc-seconds, not much better than the most powerful telescope on Earth looking at the Moon.
According to the webb site (no pun) NASA claims…
“The longer wavelengths enable Webb to look much closer to the beginning of time and to hunt for the unobserved formation of the first galaxies…”
According to NASA, the humungous cost is justified over an error in the perception of time. No telescope looks at time, or periods earlier in time, they gather light, and that’s it. The light may have started out a long time ago but what is seen is not in the past, it’s right now at the telescope lens.
It amazes me that highly qualified engineers at NASA fail to grasp such a basic concept. They can’t even grasp that it’s impossible for the Moon to keep the same side pointed at Earth while rotating on a local axis.
I recently commented on a NASA educator who thinks acceleration causes force. He quoted f = ma but obviously fails to grasp that a force causes an acceleration of a mass, not the other way around.
Gordon Robertson, you just can’t accept the reality that you need NASA more than NASA needs you!
From our time machine:
In case you’re curious how little NASA values your opinion: https://moon.nasa.gov/inside-and-out/top-moon-questions/
TM,
Appealing to the presumed authority of NASA is maybe not the smartest thing you could do.
Even you do not believe everything NASA says, so you a being a wee bit precious.
NASA’s opinion carries the same weight as yours, mine, or anybody else’s. For example, the opinion of the National Science Foundation, for many years, was that melting sea ice would raise global sea levels! A wrong opinion, but firmly held, in spite of that old Greek, Archimedes, and his archaic and out of date principle!
Go on now, be a completely gullible SkyDragon, and tell me that you unquestionably accept that every NASA opinion is factual!
Can’t do it, can you? Afraid of looking like an idiot, perhaps?
It’s all right – NASA say lots of things which demonstrate how completely clueless they are in many areas. Even space exploration – Feynmans concluding remarks about NASA (in relation to the Rogers Commission) are worth noting. He said “For a successful technology, reality must take precedence over public relations, for Nature cannot be fooled.”
Believe as you wish – it makes precisely no difference to a single physical fact.
“NASAs opinion carries the same weight as yours, mine, or anybody elses”
Following this line of Flynnson reasoning, if his kid has cancer, the opinions of her doctors on her treatment would carry the same weight for him as that of his auto mechanic, his plumber, Clint, and Gordon!
“The light may have started out a long time ago but what is seen is not in the past, its right now at the telescope lens”
What is the time that the light started out on its journey?
Yet another Duplicate Copy error with the original not showing…
rlh…”curvilinear translation is just word salad created by you”.
***
In Principia, Newton called it curvilinear motion. Are you going to quibble between motion and translation?
The only difference between curvilinear and rectilinear is the former applies to a curved path and the latter refers to a straight line motion between A and B where all parts on the body move in parallel and at the same speed.
Note: think carefully before you confuse angular speed with tangential velocity.
Are you trying to tell me there is no equivalent on a curved path? Put A and B on a curved path. The only difference is that rectilinear translation requires motion in a straight line and curvilinear translation requires motion on a curved path.
If you had a body moving along a level surface, all parts would move in parallel unless the body was rotating at the same time. That is rectilinear translation. Do you dispute that?
Bend the surface slightly so the body ***at each instant*** has all parts moving in parallel. Same thing as rectilinear translation. You can bend the surface into a circle and as long as all parts are moving in parallel at each instant, the body is performing curvilinear translation.
That’s the distinction between the two: with rectilinear there is no need to reduce motion to an instant by instant scenario, but with curvilinear there is that requirement.
There is nothing out of the ordinary about that scenario since curves are defined by their instantaneous tangential direction wrt to the x- or y-axis. That is the basic of differential calculus.
Since the tangent line changes orientation instant by instant any curve has to be defined on a radial line that is found by creating a circle whose arc coincides with the curve at that instant. That requirement is absent with rectilinear motion.
And therein is a vital clue to the Moon’s motion. Since, on a curve, the tangent line is constantly changing orientation with each point on the curve, so the Moon’s tangential plane for the near side is always changing orientation instant by instant wrt the stars.
You are mistaking that instantaneous re-orientation of the tangential face for rotation about a local axis.
Look really closely and it become obvious. In fact, if you slow down MOTL by stripping the gif file of its images, and observing them one by one, it is blatantly obvious.
ps. to strip the MOTL gif, use the free Irfanview viewer. It has a feature for stripping individual frames from a gif file.
“Are you going to quibble between motion and translation?”
A motion maybe a translation, maybe not. Rotation about an axis is not a translation.
“Curvilinear motion is defined as motion that occurs when a particle travels along a curved path”
A path describing the center of an object is not the same as a rotation about an axis.
It’s the sun stupid, nicely exposing the shysterin of the IPCC
https://youtu.be/zerKxwHSXK0
Nowhere in Newton’s Principia could we ever find a nonsense like ‘curvilinear motion’, let alone ‘curvilinear translation’.
Nowhere in any of your comments do we find your model of “orbital motion without axial rotation”, Bin.
You’ve got NOTHING.
Apart from a few stubborn, uneducated contrarians like you, Robertson, the Pseudomod, Hunter and a few others: NO ONE needs your stoopid model of ‘orbital motion without axial rotation’.
NO ONE.
The reason you have to keep trying to pervert reality is because you’ve got NOTHING, braindead bindidon.
Quick question, Pup:
https://www.reddit.com/r/ElonJetTracker/comments/znsjeo/great_question_for_elon_musk_here/
Is this doxing?
Sorry worthless willard, but stalking ain’t science.
Grow up.
Here’s more science, Pup:
https://www.marketwatch.com/investing/fund/tslq
I’d give you a lump of coal but you’d probably try to eat it.
C’mon, Gordo.
Tim said that Gaslighting Graham has every right to entertain his own concepts.
Up to a point, of course:
https://tinyurl.com/dragon-cranks-honeypot#comment-1386552
Only problem is when cranks redefine concepts in such a way that nobody understand them anymore.
So Gaslighting Graham is using the same trick all over again.
In fact it’s always the same trick.
Pingback:
https://www.drroyspencer.com/2022/12/uah-global-temperature-update-for-november-2022-0-17-deg-c/#comment-1411965
Little Willy is still confused about back-radiation. Very funny.
Gaslighting Graham gaslights a bit more.
You gaslight. I don’t.
Gaslighting Graham gaslights a bit more.
Little Willy, please stop trolling.
Wee Willy Wanker is rather less of the master baiter he imagines himself to be, and more of the masturbator he really is.
Hence his “Oh! Oh! Oh!” from time to time, I guess.
Whacky Wee Willy,
You quoted –
“It is certainly possible to redefine DLR and backradiation as not to imply any thermal property. But thats not how the concepts are usually understood. So the enigma is easily solved. Sky Dragon cranks can deny that backradiation exists, when comprised as thermal infrared radiation downward. They can accept that backradiation exists if we (can) remove the thermal properties.”
Any radiation at all implies thermal property, you fool. Radiation is energy.
Who cares what facts people deny? It makes no difference to the facts, and one fact is that you can’t even describe this GHE, much less explain the role which you believe it played in the Earth being cooler now than when it was molten.
Dancing about trying to appear intelligent won’t change anything, but at least it shows what sort of dummies can be found amongst the SkyDragon ranks.
You’re a fool, but at least you are both incompetent and impotent, so nobody cares much. If you feel like producing evidence to the contrary, go your hardest. I enjoy a laugh at the expense of some dimwit thinking that fantasy is superior to fact.
Carry on.
https://www.drroyspencer.com/2022/12/uah-global-temperature-update-for-november-2022-0-17-deg-c/#comment-1412421
Mike Flynn,
What are you braying about?
No! Ho! Ho!
Yet another disappearing duplicate comment…
willard…”It is certainly possible to redefine DLR and backradiation as not to imply any thermal property”.
***
The issue here is doing science by redefining basic truths. Tim is a master at that, if something in science does not meet his definition, he redefines the parameters to make them fit his argument.
Clausius wrote the 2nd law, but at the time no one knew anything about the relationship between EM/IR radiation and electrons in matter. It’s a shame that Clausius knew nothing about electrons because he was a brilliant scientist who would have been brilliant in any era.
In his era, and even up to the era of Planck and Einstein, no one knew that heat could not be transferred through the atmosphere as heat. It first had to be converted to EM/IR then back again at a destination. It appears that many scientists today have not moved beyond the 19th century, still caught up in the anachronism that heat can be transferred directly as a so-called ‘thermal radiation’ (aka heat rays).
I have no argument that DLR/backradiation exists in the form of EM/IR, it is simply not a transfer mechanism for thermal energy per se. However, as Clausius claimed, with his non-existent vision of EM/IR, heat transfer by radiation must obey the 2nd law.
The reason he knew that is obvious. All energy must be transferred, by its own means, from a higher energy potential to a lower energy potential. Since DLR/back-radiation in the atmosphere is between a lower energy potential (cooler atmosphere) and a higher energy potential (hotter surface), then no energy can be transferred from the cooler atmosphere to the hotter surface.
However, there are misinformed scientists, still living in the 19th century, believing heat is transferred by heat rays, who talk about thermal radiation. The term thermal radiation is an oxymoron since neither term has anything in common with the other. Heat and radiation have absolutely nothing in common. Heat is the kinetic energy of atoms whereas electromagnetic energy is an electric field orthogonal to a magnetic field with absolutely no ability to carry heat.
It’s very interesting that heat can converted to EM/IR, then back again, if the target is cooler than the source, but its vital to understand that heat by its own means cannot be transferred from a cooler source to a hotter target.
To get around the obvious, some modern scientists have invented a concep.t based on a summation of energies, electromagnetic and heat. Since the bulk of energy moving between surface and atmosphere is favoured by the movement from surface to atmosphere, they label that direction as positive. Then they claim the 2nd law is not contradicted if that energy movement is positive.
Of course, that is nonsense. The 2nd law does not deal with energy per se but specifically with heat transfer. The law is also very specific, stating clearly that HEAT can never be transferred, by its own means, from a colder body to a warmer body. Therefore, the transfer of heat from a colder atmosphere to a warmer surface contradicts the 2nd law.
Bohr confirmed that in 1913 when he issued his insight into the relationship between electromagnetic energy and the electrons in atoms. It is simply not possible for electrons already at a higher energy level in lieu of a higher temperature, to accep.t EM/IR from a colder source. Therefore, heat from a cooler atmosphere cannot be transferred as DLR/backradiation.
Come on, Gordo.
My point was not about backradiation.
It was about semantics.
Especially, it was about cranks who like to entertain idiosyncratic concepts. They can, but then they reap what they sow. Up to a point.
Just like when they waste their lives harping about an energy balance toy model and cannot even balance it properly.
Moon Dragon cranks are playing the same silly game.
It is about time you grow out of it, no?
Little Willy is ineducable.
Gaslighting Graham is gaslighting.
Little Willy, please stop trolling.
There is compelling evidence referred to above that it is solar activity which establishes natural climate cycles on Earth.
IT IS UTTERLY DESPICABLE THAT MODERATORS FOR THIS BLOG CENSOR MY DISCUSSION OF SUCH IMPORTANT RESEARCH.
Roy banned you, Dug.
https://www.brainkart.com/article/Centrifugal-Force-due-to-Rotation-of-the-Earth_34534/
This test would distinguish between rotation around an external axis and rotation around an internal axis.
From the article at the link…
“The centrifugal force appears to act exactly in opposite direction from the axis of rotation”.
What is it…appears to act, or acts?
There is no force applied opposite to that of gravity. If anything, the centrifugal aspect is a fictitious force like Coriolis.
“There is no force applied opposite to that of gravity. If anything, the centrifugal aspect is a fictitious force like Coriolis. ”
As you say, centrifugal force is a fictional force.
When you appear to measure centrifugal force you are measuring inertia. It is, however a convenient fiction because it is much more intuitive than trying to understand the full effect of inertia on a rotating or orbiting object.
So a ball on a string, which Bindidon agrees is not rotating about an internal axis, wouldn’t experience centrifugal force?
Beware of the pathetic fallcy. Forces act on all parts of the system, but the only part which can experience anything is the person holding the string.
So if the ball on a string was large enough that somebody could stand on the surface of the ball, they would not experience centrifugal force?
(You seem to be completely missing the point I made).
People standing on the ball all experience centrifugal force tending to push them radially outwards from the centre of revolution. Unless attached in some way they will fall off.
People on the surface of the Moon experience a centripetal force of gravity pulling them towards the centre of the Moon and a smaller centrifugal force pushing them outwards from the Moon’s axis of rotation.
More evidence that the ball on a string is not a good analogy for the physics of the Earth/Moon system.
So make the ball on a string as big as the moon…
…people on the surface of the [ball on a string] experience a centripetal force of gravity pulling them towards the center of the [ball] and a smaller centrifugal force pushing them outwards from the [center of revolution].
“people on the surface of the [ball on a string] experience a centripetal force of gravity pulling them towards the center of the [ball] and a smaller centrifugal force pushing them outwards from the [center of revolution]. ”
Yes, but that is not what people on the Moon experience.
The Moon is in orbit. The inward centripetal force attracting the Moon towards the barycentre and the reaction, the outward centrifugal force, cancel out. People on the Moon (and on the Earth) experience no forces due to the Moon’s orbital motion.
That’s because you think of "orbital motion", or "orbit without spin" as being like the MOTR.
…but if you think of "orbital motion" or "orbit without spin" as being motion like the MOTL, then your people on the moon are indeed experiencing a centrifugal force from the orbital motion. Just like those on the giant ball on a string.
These conversations really do get silly…
The silliness comes from the mismatch between your physical model of the Earth/Moon system and how it actually operates.
The ball on a string is not a physical model of the Earth/moon system. It’s a model of "orbit without spin".
” The ball on a string is not a physical model of the Earth/moon system. ”
Indeed. Please explain this to Gordon and ClintR.
They agree, and have said so many, many times.
Hopefully you understand now why your point is refuted, anyway. You can now do your disappearing act, only to reappear a little later to make exactly the same debunked points as if nobody ever corrected you.
“You can now do your disappearing act, only to reappear a little later to make exactly the same debunked points as if nobody ever corrected you.”
Learn from DREMT. He and the TEAM have perfected this technique.
“You can now do your disappearing act, only to reappear a little later to make exactly the same debunked points as if nobody ever corrected you.”
…which nobody could ever accuse me of doing, since I always stick around in any discussion to the bitter end. Quite well known for it.
Either Gaslighting Graham whines about always being rebutted or he whines that people stop responding,
Double binds are powerful gaslighting gimmicks.
I whine about nothing…I just make accurate observations about others.
“Hopefully you understand now why your point is refuted, anyway. You can now do your disappearing act, only to reappear a little later to make exactly the same debunked points as if nobody ever corrected you. ”
You haven’t refuted my point.
I envy you the freedom to hang around this blog all day. Do you have no life?
I refuted your point.
Your physics is in error.
People on the Moon share its orbit and are acted on with the same gravitational force. They and the Moon are in free fall with respect to the Earth. They do not experience a net centrifugal force for the same reason that astronauts in the ISS are not pushed against the wall of the station furthest from the Earth.
One minute (at 2.22 PM for instance) you’re saying people on the surface of the moon experience a "smaller centrifugal force pushing them outwards", the next minute you’re saying people on the moon do not experience a centrifugal force! Make up your mind.
Pay attention.
There are two different centrifugal forces which might affect people on the surface of the Moon.
The first is the centrifugal force which is the reaction to the centripetal force of gravity due to the Earth and Moon’s joint mass holding them in orbit. These cancel out, leaving Moon and people in free fall around the Earth. It is not experienced by people on the Moon’s surface.
The second is the centrifugal force due to the Moon’s rotation. This acts outward perpendicular to the Moon’s axis of rotation. This reduces the weight of masses on the surface, most strongly at the Equator and reflects hanging pendulums.This is experienced by people on the surface of the Moon.
” I always stick around ”
Pulleez, there is a very good reason this argument never ends..
The entire basis of some people’s repeated false claims of arguments being ‘settled’ is that ‘nobody’ posted any contradictory facts.
Yet they have been posted, regularly, but simply ignored, such as:
Contradictory definitions of Orbit.
Contradictory definitions of Rotation.
One’s own sources clearly contradicting non-spinner beliefs.
Contradictory observations of Lunar axial tilt
Non-spinner contradictory statements
No answer when asked to account for axial tilt and libration with non-spinner models.
on and on..
“The first is the centrifugal force which is the reaction to the centripetal force of gravity due to the Earth and Moon’s joint mass holding them in orbit. These cancel out, leaving Moon and people in free fall around the Earth. It is not experienced by people on the Moon’s surface.”
Right…so there is a centrifugal force due to the orbital motion, like I said in my 2:29 PM and 3:17 PM comment. That means you agree that “orbit without spin” is as per the MOTL.
“which nobody could ever accuse me of doing, since I always stick around in any discussion to the bitter end.”
Good example of that here.
Some people think that ‘not responding’ to contradictory facts and truths when convenient, is ‘sticking around in the discussion to the bitter end’.
Can anyone else hear that annoying sort of squawking drone that keeps interrupting me whenever I’m trying to talk to someone else?
People forget that they just posted something that required an immediate debunking ” nobody could ever accuse me of doing, since I always stick around in any discussion to the bitter end.”
Just part and parcel of always being the ‘victim’.
Odd…I can still hear it.
Rightso there is a centrifugal force due to the orbital motion, like I said in my 2:29 PM and 3:17 PM comment. That means you agree that orbit without spin is as per the MOTL.
The outward force has nothing to do wit rotation. There is no string keeping the Moon aligned with the Earth.
Without the Earth the Moon’s centre of mass would follow a straight geodesic. Their mutual gravity is what pulls the Moon into a curved geodesic. In accordance with Newton’s Third Law the effect of inertia generates a fictional centrifugal force which balances the centripetal force but is not measurable directly.
“The outward force has nothing to do wit rotation”
Exactly. The outward force is due to “orbit without spin” being like the MOTL. I’m glad we’ve settled that you are a “Non-Spinner”.
Rightso there is a centrifugal force due to the orbital motion, like I said in my 2:29 PM and 3:17 PM comment. That means you agree that orbit without spin is as per the MOTL.
The outward force has nothing to do wit rotation. There is no string keeping the Moon aligned with the Earth.
Without the Earth the Moon’s centre of mass would follow a straight geodesic. Their mutual gravity is what pulls the Moon into a curved geodesic. In accordance with Newton’s Third Law the effect of inertia generates a fictional centrifugal force which balances the centripetal force but is not measurable directly.
This is the problem for the non-spinners. All the physical tests show that the Moon rotates relative to the inertial reference frame. It is only the parochial viewpoint from the Earth’s surface which gives the illusion that the Moon does not rotate.
The only way the moon can be rotating on its own axis is if “orbit without spin” is as per the MOTR…but if “orbit without spin” was like the MOTR, there would be no centrifugal force from the “orbital motion”. You have already agreed that there is centrifugal force from the “orbital motion”. So you must agree that “orbit without spin” is as per the MOTL.
Making you a “Non-Spinner”.
If needed they just make it up…
Can still hear something…weird.
Nice find, EM!
How come? I just explained why it’s not a nice find.
Actually Gordon found it, though real and fictional forces have been discussed here before.
…and they don’t settle the issue.
For once Gordo is useful.
…at not settling the issue.
Somewhere upthread, Swenson wrote in a reply to barry:
” Physical librations have been measured, and one of them shows the Moon nodding back and forth around the axis of its orbital path. Is that rotating about an internal axis or not? ”
He then pasted a paragraph:
From a recent paper –
” The determined amplitudes reach 1.296” in longitude (after correction of two close forcing terms), 0.032” in latitude and 8.183” × 3.306” for the wobble, with the respective periods of 1056.13 days, 8822.88 days (referred to the moving node), and 27257.27 days.
The presence of such terms despite damping suggests the existence of some source of stimulation acting in geologically recent times. ”
*
What Swenson wrote is correct – except that what he refers to is not ‘rotating about an internal axis’ but rather is sort of smallest wobbling irregularities appearing within Moon’s rotation about is internal (polar) axis.
It can be found in the paper
The Moon’s physical librations and determination of its
free modes
N. Rambaux, J. G. Williams
https://hal.archives-ouvertes.fr/hal-00588671/document
*
These librations are called ‘physical’ in contrast to the better known ‘optical’ librations, which are only apparent, as they are an illusion created by Moon’s motion combination (orbiting + rotating).
Newton, who perfectly understood the influence of Earth’s and Sun’s gravitational forces on the Moon, was already aware of such a physical libration, which nowadays is named ‘forced’, in contrast to the ‘free’ physical libration (possibly due to Moon’s inhomogeneous mass distribution, or to huge asteroid impacts).
Lagrange and Laplace were able to mathematically distinguish Moon’s forced and free physical librations.
*
Who is interested in a review of the long way between Cassini and today’s evaluations of Moon’s motion using Lunar Laser ranging, might read a paper written by the astronomer Karol Karol Kozieł (Cracow, Poland)
On the development of our knowledge of the motion of the moon around its centre of mass
https://tinyurl.com/2ffp8nnt
*
or a paper written by Rizvanov and Rakhimov at (Kazan Observatory, Russia)
History of development of selenodesy and dynamics of the Moon in Kazan
http://selena.sai.msu.ru/Symposium/kazan.pdf
**
Of course, for the world-renowned specialists in ‘curvilinear translation’, ‘ball-on-a-string’, ‘MOTL/MOTR’ and other ‘theories’, this is of no use.
If you only manage to invoke few more smart people you will win the flat Moon circular debate
Try harder Bindinito try harder
What you’ve already won, babbling Edog, is the Maximum Redundancy Grand Prize: the difference between your replies and emptiness is infinitesimal.
Blinny is AWN, Angry White Nazi.
If you know anything about psychology you can easily see from his postings that Bindidong is mentally ill with all the traits of a narcissist.
If you just google it and look it up you will see it too
Anderson
I have some experience with people naming others ‘Nazi’, especially with those living in the US.
Mostly they themselves belong to the ultra right wing white supremacist pack, and that seems to be true for you as well.
Et pour finir, Anderson, sachez que je ne suis pas blanc mais… café au lait, comme l’on dit chez nous.
Stephen proves Godwin’s Law.
AND… he resorts to the weakest of arguments: Reductio_ad_Hitlerum
No wonder when it comes from a guy who describes bloodthirsty South American dictators like Pinochet or Videla as ‘Leftists’ – even though they were responsible for the murder of tens of thousands of very real Leftists.
Bindidon,
You wrote –
“What Swenson wrote is correct except that what he refers to is not rotating about an internal axis but rather is sort of smallest wobbling irregularities appearing within Moons rotation about is internal (polar) axis.”
You have the better of me. You tell me that I am not referring to “rotating about an internal axis”, but rather “rotation about is [sic] internal [ . . . ] axis”. That’s clear – not!
I assume that when you say “but rather is sort of smallest wobbling irregularities”, you are trying to appear diminish the truth of what I wrote – because you dont want to accept that I might actually know more than you.
Play with semantics all you like. Denigrate as much as you wish. It makes no difference to me, or any physical fact. Nobody knows why the Moon exhibits some of its measurable motions, and there are many different speculations, none of which offer a complete answer to observed fact. Rather like SkyDragons speculating that hotter thermometers are due to some yet unexplained mechanism involving CO2, H2O, and other gases.
You might have been better off stopping after you wrote “What Swenson wrote is correct . . .”.
Others will no doubt have their own opinions. I only discover I’m wrong after I thought I was right!
Oh! Swenson is flynnsoning again.
Look at how this guy turns and turns and turns what we reply – until he apparently looks having been right.
Contrarianism at its best.
No, Flynnson: you were NOT right in your reply to barry.
Because physical librations are NOT a kind of rotation.
They are, whether or not that fits your contrarian mind, irregularities within a rotation.
Two fundamentally different things.
And when you arrogantly write in your usual 5 o’clock tea English
” Nobody knows why the Moon exhibits some of its measurable motions, and there are many different speculations, none of which offer a complete answer to observed fact. ”
it is evident that like all other lunar spin deniers, you never and never would be able to scientifically disprove those who analyzed Moon’s motions since centuries. You just show off.
*
Doesn’t matter to me. Keep blathering as long as you want!
binny…”Somewhere upthread, Swenson wrote in a reply to barry:
Physical librations have been measured, and one of them shows the Moon nodding back and forth around the axis of its orbital path. Is that rotating about an internal axis or not? ”
***
Not clear to me who wrote the quote. There is no movement back and forth, the motion is apparent not real.
I have explained this in detail in several posts. The apparent motion is due to the orbital effect in an elliptical orbit.
A radial line can be determined for any body moving along any continuous curve by finding a circle with an arc-length that coincides with the curve at a particular point. The radial line of the circle is also that radial line for the curve at that point.
On an elliptical orbit like that of the Earth, that radial line coincides with the radial line of a pure circular orbit at either end of the major axis. In between those points, the radial line from the Moon’s near face varies in angle from that of a pure circle. It is that varying angle that is longitudinal libration.
The Moon’s near face does not rotate physically, it simply points in different directions due to orbital motion. Therefore, we can see more around the edge of the Moon at different parts of the orbit.
To see this on an ellipse, draw lines from each focal point to the lunar location. The bisector of the angle formed is the radial line. See how it points in different directions during the orbit.
Robertson
You reply is so dumb in comparison to what Newton, Mayer, Lagrange, Laplace, and last not least: Koziel wrote.
Like my lady’s uncle Kurt behaved a decade ago, you continuously behave like a person more and more attacked by dementia.
Look at your recent reply to angech:
https://www.drroyspencer.com/2022/12/uah-global-temperature-update-for-november-2022-0-17-deg-c/#comment-1411064
” Major mistake, Binny, is a major dumbass on this blog. He fakes graphs to make it appear as if the UAH data is the same as NOAA data. ”
*
Did you once more forget what I wrote?
https://www.drroyspencer.com/2022/09/uah-global-temperature-update-for-august-2022-0-28-deg-c/#comment-1365217
When will you start learning, Robertson, instead of endlessly repeating your egomaniac nonsense?
Comet impacts could bring ingredients for life to Europa’s ocean
” The discovery comes from a study led by researchers at The University of Texas at Austin, where researchers developed a computer model to observe what happens after a comet or asteroid strikes the ice shell, which is estimated to be tens of kilometers thick.
The model shows that if an impact can make it at least halfway through the moon’s ice shell, the heated meltwater it generates will sink through the rest of the ice, bringing oxidants – a class of chemicals required for life – from the surface to the ocean, where they could help sustain any potential life in the sheltered waters.”
https://www.spacedaily.com/reports/Comet_impacts_could_bring_ingredients_for_life_to_Europas_ocean_999.html
Could be horrible stinking creatures in Europa’s ocean.
Yeek!
barry…”Your attempt to argue that facing the same wal is a rotation is simply done by making the frame of reference be the chair”.
***
Barry…I laid it out for you in detail but you are obviously unable to understand and respond to my explanation. Hence, you offer a red-herring argument about reference frames.
How come the Sun sees all sides of the Moon, but the Earth only one? Are they not 2 sperate and independent reference frames?
“How come the Sun sees all sides of the Moon, but the Earth only one…”
…because the moon is “orbiting” (motion like the MOTL).
So you agree that an orbit without a rotation is MOTL.
Sorry, meant MOTR (Moon on the right in the gif).
No, RLH. "Orbit without spin" is as per the MOTL.
Richard,
Have you noticed that Graham seems to suggest that the Moon on the right is not orbiting?
Yup.
MOTR is "orbiting" (motion like the MOTL) as well as rotating on its own axis, once per orbit, in the opposite direction to the "orbiting".
Richard,
Have you noticed that, according to Moon Dragon crank logic, a 1:1 spin-orbit lock implies that we see all the sides of the Moon?
What the "Spinners" see as a "1:1 spin-orbit lock" the "Non-Spinners" see as the object not rotating on its own axis, whilst orbiting.
Richard,
Have you noticed how Gaslighting Graham is redefining what it means for a system to be in a spin-orbit lock?
No, it’s just the "Non-Spinner" way of looking at it, Little Willy.
Compare and contrast:
[WIKI] In the case where a tidally locked body possesses synchronous rotation, the object takes just as long to rotate around its own axis as it does to revolve around its partner.
[GG] MOTR is “orbiting” (motion like the MOTL) as well as rotating on its own axis, once per orbit, in the opposite direction to the “orbiting”.
The tidal locking mechanism just results, over time, in motion like the MOTL, Little Willy. The physics behind that mechanism is not affected if you interpret movement like the MOTL as being comprised of one motion or two. Your confusion on this issue is endless, and amusing. Thanks for all the chuckles.
Compare and contrast:
[GASLIGHTING GRAHAM] The physics behind that mechanism is not affected if you interpret movement like the MOTL as being comprised of one motion or two.
[WIKI] Tidal locking between a pair of co-orbiting astronomical bodies occurs when one of the objects reaches a state where there is no longer any net change in its rotation rate over the course of a complete orbit.
No net change from zero (as the "Non-Spinners" see it), over the course of a complete orbit, is no net change from zero.
[GASLIGHTING GRAHAM] The physics behind that mechanism is not affected if you interpret movement like the MOTL as being comprised of one motion or two.
[WIKI] Rotational frequency (also known as rotational speed or rate of rotation) of an object rotating around an axis is the frequency of rotation of the object. Its unit is revolution per minute (rpm), cycle per second (cps), etc.
…and, no net change from zero (as the "Non-Spinners" see it), over the course of a complete orbit, is no net change from zero.
[GASLIGHTING GRAHAM] The physics behind that mechanism is not affected if you interpret movement like the MOTL as being comprised of one motion or two.
[WIKI] Rotational frequency can measure, for example, how fast a motor is running. Rotational speed is sometimes used to mean angular frequency rather than the quantity defined in this article. Angular frequency gives the change in angle per time unit, which is given with the unit radian per second in the SI system.
…and, once again, no net change from zero (as the "Non-Spinners" see it), over the course of a complete orbit, is no net change from zero.
[GASLIGHTING GRAHAM] The physics behind that mechanism is not affected if you interpret movement like the MOTL as being comprised of one motion or two.
[WIKI] In physics, angular frequency “ω” (also referred to by the terms angular speed, circular frequency, orbital frequency, radian frequency, and pulsatance) is a scalar measure of rotation rate.
…and, once again, no net change from zero (as the "Non-Spinners" see it), over the course of a complete orbit, is no net change from zero. You can keep gaslighting, Little Willy, but my response is not going to change.
Gaslighting Graham has yet to find a numerical model of the Earth-Moon model in which the physics posit zero spin velocity.
Those we got has a Moon spin of about 16.7 km/h.
Worse, he claims that the physics would not change if that was any different.
For, you know, changing the angular momentum or velocity of an object has no physical effect.
What the Moon Dragon cranks keep trolling about would not change the physics at all.
And so Gaslighting Graham gently gaslights a little more.
No net change from zero (as the "Non-Spinners" see it), over the course of a complete orbit, is no net change from zero. Sorry you are too stupid to understand.
In the Moon Dragon crank universe, speed and acceleration are the same.
For their physics, it makes no difference. Once an object stops accelerating, it has no speed.
Little Willy just desperately makes stuff up, as usual.
Gaslighting Graham has yet to demonstrate how a *non-net change from zero* would work in his favorite Moon Dragon crank model.
One thing is sure – it cannot work as a physical quantity, for he just said it was not a physics problem.
Once again…the tidal locking mechanism just results, over time, in motion like the MOTL, Little Willy. The physics behind that mechanism is not affected if you interpret movement like the MOTL as being comprised of one motion or two. Your confusion on this issue is endless, and amusing. Thanks for all the chuckles.
Some days people argue one way:
“The physics behind that mechanism is not affected if you interpret movement like the MOTL as being comprised of one motion or two.”
and other days the other way:
“In your scenario, 2) is appropriate, since that accurately describes the mechanics of the situation.”
Then they fail to recognize the contradiction. Thats how we recognize trolling.
There’s that annoying squawking drone sound again…
Exactly, Nate.
More amazing is that Gaslighting Graham does not even realize that a complete tidal lock is not represented by his pet GIF!
Little Willy, please stop trolling.
As the Sun’s magnetic activity (solar wind force) increases after the previous magnetic activity cycle ends, La Nina develops.
https://i.ibb.co/gjNwXTC/magbfly.png
My days are getting colder, but it seems there is no chance of snow
near Christmas. If only there was some global warming to cause some snow- when you want it. It’s in a forecast for snow in Kiev.
It seems if there was science in global warming, someone could predict Venus’ surface temperature if at 1 AU distance.
I think I try different approach.
So if on Venus rocky surface [anywhere] it would be high pressure and very hot, but in balloon at an elevation with 1 atm pressure, there seems there should wider difference of air temperature depending on where you were on planet in regards the blazing hot sunlight.
Or when sun was at zenith the sunlight is around 2500 watts per square meter and if in place with no sunlight, it should be a lot cooler. And if in place where there hasn’t been for more than a month, cooler than if sun recently dropped below the horizon.
Or one thing if have surface temperature which has fairly uniform temperature, but expecting it 50 km up, seems a bit unreasonable.
“In that case, you would be able to describe the Greenhouse Effect, but you cant, can you?”
No worries, Ken. Swenson has had that question answered quite clearly. By Tyndall, no less.
https://www.drroyspencer.com/2022/11/canadian-summer-urban-heat-island-effects-some-results-in-alberta/#comment-1402815
Tyndall showed that the GHE is based on physical facts not ‘magic insulation’ that Swenson imagines.
And what was Swenson’s response? He had no answers, rebuttal, or even his usual dismissive ad-hom response.
He became MUTE, and ran away.
So you see, the evidence is clear that he has no interest in having you or anyone answer that question.
For trolls like Swenson, the science facts are irrelevant.
This is another good example of the cult finding something they believe they can twist to fit their beliefs. Troll Nate quotes Tyndall, but does not understand the quote. So he tries to twist the quote to fit his cult’s nonsense.
Tyndall agreed that the atmosphere acts as insulation. But he went on to explain that solar flux was different from Earth flux. He gave the example that solar flux could penetrate water, but IR cannot.
Nate’s still trying to claim ice cubes can boil water, which is exactly what Fraukerts bogus math would indicate.
Clint suggests a rebuttal was forthcoming, but looks like he forgot to include it..
Reality rebuts your nonsense, troll Nate.
Reality has not chosen Dragon cranks to speak for Her, Pup.
Do the Poll Dance Experiment.
Reality says you’re an incompetent, immature worthless troll, willard.
Grow up.
Growing up means one realizes that She is big enough to speak for Herself, Pup.
So *you* grow up.
Cheers.
Little Willy, please stop trolling.
The standard troll Clint ‘rebuttal’ is just ad-homs, and no substance.
Where’s the beef?
Q: Google, What is the context of this Richard Feynman quote, “For a successful technology, reality must take precedence over public relations, for Nature cannot be fooled.”?
A: The context was Feynman’s participation in the commission investigating the causes of the Challenger disaster. He was particular[ly] critical of the decision-making process that led to the decision to launch that day, despite warnings from the engineers who knew the system best. Evidence from previous missions had shown that the joints between the sections of the solid rocket boosters were allowing hot gasses to escape and that the problem was worse in cold weather, but their recommendation to postpone the launch was ignored.
Exactly TM. Reality always wins.
* Moon is NOT rotating.
* Ice cubes can NOT boil water.
* Earth does NOT have a “real 255K surface”.
Reality and science say that the Moon rotates during its orbit of the Earth.
Troll RLH, without a viable model of OMWAR, you’ve got NOTHING.
You’re failed model of a bicycle pedal assembly has BOTH motions — revolving AND rotating. You don’t understand any of this.
My offer is still on the table, Pup.
For every numerical model of the Moon-Earth system you provide for Moon Dragon cranks, I match it with one from Team Science or I stop commenting for one month.
If in return you fail to match the numerical models I provide, you do the same.
What are you waiting for?
Worthless willard, you’re such a child.
This discussion isn’t even about a “numerical model of the Moon-Earth system”
You’re trying to throw crap against the wall, but you’re so immature you don’t even know which wall to aim at.
Grow up.
Dearest Pup,
Unless and until Moon Dragon cranks come up with a numerical model of the Earth-Moon system, there is no discussion to be had.
Do yourself a favour and find some.
Seasons greetings!
"Unless and until Moon Dragon cranks come up with a numerical model of the Earth-Moon system, there is no discussion to be had."
So you will butt out of all moon discussions, then? Great!
Gaslighting Graham gaslights a bit more.
…but you said that there was no discussion to be had until you get your "sammich"…
Gaslighting Graham pretends there is a discussion.
All we got is rolling from Dragon cranks.
They cannot grok a basic zero balance model.
They cannnot grok a simple two plate model.
They cannot grok a basic concept of spin-orbit lock.
Almost 76 months of trolling.
No Moon model. No energy balance model. No plate model.
They really got NOTHING.
…oh, you were just lying again, then.
Gaslighting Graham gently gaslights a little more.
Sure, Little Willy. Everything is "gaslighting".
And Gaslighting Graham gently gaslights a little more.
Little Willy, please stop trolling.
rlh…”Reality and science say that the Moon rotates during its orbit of the Earth”.
***
Unfortunately, for you, you are unable to supply evidence to back your claims.
Evidence of the Moon’s rotation abounds. Where is your evidence to the contrary?
The Lunar Reconnaissance Orbiter (LRO) spent the first three years of its mission in a low circular polar orbit. During this phase it completed one polar orbit in a little less than two hours.
The orientation of this orbit remained fixed in space, relative to the stars, while the Moon slowly spins on its axis beneath it as they travel together around the Earth, allowing LRO to scan the entire surface of the Moon every two weeks.
LRO’s ground track showing the path of this orbit on the surface of the Moon: NASA/Goddard Space Flight Center Scientific Visualization Studio.
TM, like the rest of your cult you don’t even understand the issue. The issue is NOT about rotating RELATIVE TO THE STARS. The issue is about ACTUAL axial rotation.
The ball-on-a-string rotates RELATIVE TO THE STARS. But, it is NOT rotating on its axis.
I bet you will make this same mistake again….
Here, Pup:
https://www.youtube.com/watch?v=XVriF4-z3cE
What do you got?
NOTHING.
Child willard, like TM and the rest of your cult, you don’t even understand the issue. The issue is NOT about rotating RELATIVE TO THE STARS. The issue is about ACTUAL axial rotation.
The ball-on-a-string rotates RELATIVE TO THE STARS. But, it is NOT rotating on its axis.
I bet you will make this same mistake again….
LRO is looking straight at the Moon, Pup:
https://www.youtube.com/watch?v=H6_WbCodXB4
Do the Pole Dance Experiment.
Yes Willard, when viewed from the Moon, the Earth will always remain in about the same spot in the sky, it will not move across the sky.
There is only one model for that: the Moon spins on its axis so that as it orbits the Earth, it always presents the same face to the Earth.
See TM, you’re still making the same mistake.
You can’t learn.
Exactly, Tyson.
Little Willy doesn’t actually agree with you, Tyson. Not if he is going to stick with comments he made previously, anyway. You said “there is only one model for that”, but actually Little Willy has always said before that there is another model, and that the two are equivalent.
Gaslighting Graham gently gaslights a little more.
Little Willy, please stop trolling.
Earth has different surfaces.
The most significant surface is ocean surface [covers 70% of Earth’s surface and it has average temperature of about 17 C]
Total land surface is about 30% and has average temperature of about
10 C.
And when you average ocean and land surface you get average global surface temperature of about 15 C
What cause the global average surface air temperature is the larger and warmer ocean surface.
And contrast between Land and Ocean surface, is that land surface can have large swings in daily air temperature- it heat up a lot during the day, and cool down a lot during the night- this can greater in desert region with little water vapor in the air. Or dry desert can get hot during the day and cold at night. But ocean surface has very little variation in daily temperature- less 1 C difference, whereas any land surface with any amount sunlight, vary a lot more.
One could also mention other surfaces, such as the ocean with polar sea ice which can act like a land surface- can have large difference
in daily temperatures- or polar ice can have very cold air temperature like land can.
One could also say clouds act as surface, and clouds cover large areas of Earth surface- global coverage of clouds varies and not as quantifiable compared land and ocean- though roughly, more cloud area than 30% of the surface.
Our Moon does not rotate about its axis.
–
No moon in solar system rotates about its own axis. They all have stopped rotating long time ago, and now none of them rotates anymore.
–
They were rotating once upon a time, yes, but after a long period of rotating they stopped rotating about their own axis.
–
Planets were rotating faster – gradually they rotate slower and slower, and in the future, all planets, one by one also will stop rotating about their own axis.
–
https://www.cristos-vournas.com
Vournas
Tell us when you will become able to scientifically contradict, for example, the information shown in Wiki concerning
– Pluto and its moon Charon:
https://en.wikipedia.org/wiki/Charon_(moon)
– Jupiter and his Galilean moons (Io, Europa, Ganymede, Callisto):
https://en.wikipedia.org/wiki/Galilean_moons
Bindidon:
“Vournas
Tell us when you will become able to scientifically contradict, for example, the information shown in Wiki concerning”
–
What do you mean?
None of them moons rotate about their own axis.
–
https://www.cristos-vournas.com
Bindidon doesn’t understand ANY of this, so he throws out two links that do nothing to support his nonsense.
It’s called “grasping at straws”.
Clint R, the ignorant troll, wasn’t even able to discredit me… let alone would he be able to scientifically contradict what I write!
All he is able to is to write
” You have NOTHING! “
Bin, there’s no need for me to discredit you. You do that so well by yourself.
Without your links you can’t understand and your insults, you’ve got NOTHING.
Here, Pup:
https://www.youtube.com/watch?v=0Ayz0m13VVc
What do you got?
NOTHING.
Yes child willard, that’s how Moon appears relative to the fixed stars.
But, that ain’t the issue being discussed here.
Grow up.
No, Pup.
That was a Rsti recipe.
You’re a lousy troll.
Exactly, you’re a child with no understanding of the science.
🤦
Little Willy, please stop trolling.
Vournas
Do you now belong to the dumb deniers like Clint R?
Or are you unable to read simple English texts?
Χρειάζεστε μια ελληνική μετάφραση του αγγλικού κειμένου;
*
1. Charon
– Synodic rotation period: synchronous
– ” Charon’s slow rotation means that there should be little flattening or tidal distortion, if Charon is sufficiently massive to be in hydrostatic equilibrium. ”
2. Jupiter’s Galilean moons
” Callisto has an ancient, heavily cratered and unaltered ice surface and the way it rotates indicates that its density is equally distributed, suggesting that it has no rocky or metallic core but consists of a homogeneous mix of rock and ice. This may well have been the original structure of all the moons.
The rotation of the three inner moons, in contrast, indicates differentiation of their interiors with denser matter at the core and lighter matter above. ”
*
Vournas, vous tombez chaque jour un peu plus bas dans mon estime.
Vournas
Tell us when you will become able to scientifically contradict, for example, the information shown below
1. Charon (Pluto)
https://solarviews.com/eng/charon.htm
Rotational period (days): 6.38725
Orbital period (days): 6.38725
2. Callisto (Jupiter)
https://solarviews.com/eng/callisto.htm
Rotational period (days): 16.68902
Orbital period (days): 16.68902
*
Do you need some more examples?
Bindidon:
Callisto: Orbital period (sidereal) 16.6890184 d
https://en.wikipedia.org/wiki/Orbital_period
Callisto: Synodic rotation period synchronous
https://en.wikipedia.org/wiki/Callisto_(moon)#:~:text=Callisto%20%28%2F%20k%C9%99%CB%88l%C9%AAsto%CA%8A%20%2F%29%2C%20or%20Jupiter%20IV%2C%20is,Callisto%20was%20discovered%20in%201610%20by%20Galileo%20Galilei.
Vournas
Why do you send these links?
https://en.wikipedia.org/wiki/Callisto_(moon)#Orbit_and_rotation
” Like most other regular planetary moons, Callisto’s rotation is locked to be synchronous with its orbit.
The length of Callisto’s day, simultaneously its orbital period, is about 16.7 Earth days. ”
What don’t you (want to?) understand here?
” Like most other regular planetary moons, Callistos rotation is locked to be synchronous with its orbit.”
–
Like most other regular planetary moons, our Moon included! They do not rotate about their own axis. They stopped rotating long-long time ago.
–
Bindidon, when moon’s sidereal rotation period with respect to the stars is equal to its orbital period, then moon does not have any axial rotation on its own (local) axis.
–
https://www.cristos-vournas.com
christos…”Bindidon, when moons sidereal rotation period with respect to the stars is equal to its orbital period, then moon does not have any axial rotation on its own (local) axis”.
***
Here is something from Newton…in Principia…
Page 541 of 594
“In like manner is the moon revolved about its axis by a motion most equable in respect of the fixed stars, viz., in 27d.7h.43′, that is, in the space of a sidereal month;”
so that this diurnal motion is equal to the mean motion of the moon in its orbit: upon which account the same face of the moon always respects the centre about which this mean motion is performed, that is, the exterior focus of the moon’s orbit nearly;”
***
This clarifies, in my opinion, that Newton is talking about the Earth as the Moon’s axis.
*******************
Newton continues…
“and hence arises a deflection of the moon’s face from the earth, sometimes towards the east, and other times towards the west, according to the position of the focus which it respects; and this deflection is equal to the equation of the moon’s orbit, or to the difference betwixt its mean and true motions;
and this is the moon’s libration in longitude: but it is likewise affected with a libration in latitude arising from the inclination of the moon s axis to the plane of the orbit in which the moon is revolved about the earth;
for that axis retains the same position to the fixed stars nearly, and hence the poles present themselves to our view by turns, as we may understand from the example of the motion of the earth, whose poles, by reason of the inclination of its axis to the plane of the ecliptic, are by turns illuminated by the sun. To determine exactly the position of the moon’s axis to the fixed stars, and the variation of this position, is a problem worthy of an astronomer”.
****************
Christos…I don’t know how well this will translate to Greek. The text contains references to Old English, which has been translated to Latin, then back to New English.
Newton is obviously talking about a re-orientation of the near face of the Moon, not to an actual rotation of the Moon on a local axis. It is obvious from the description above that he regards the Earth as the axis about which the Moon revolves. The axis is not a local axis.
Come on, Gordo.
Isaac takes the pain to distinguish the diurnal motion of the Moon and its orbit.
You mangle them up together in your Moon Dragon crank hallucinations.
Read again.
Little Willy, please stop trolling.
Yesterday, Blubbering Binny, claimed there is no reference to curvilinear motion in Newton’s Principia. I counted at least 20 references and probably double that amount, or more.
Take note, RLH, Newton thinks curvilinear translation exists.
Page 80 of 594
“Definition V
A centripetal force is that by which bodies are drawn or impelled, or any way tend, towards a point as to a centre.
Of this sort is gravity, by which bodies tend to the centre of the earth magnetism, by which iron tends to the loadstone; and that force, what ever it is, by which the planets are perpetually drawn aside from the rectilinear motions, which otherwise they would pursue, and made to revolve in curvilinear orbits”.
Can’t be more explicit than that…”…the planets are perpetually drawn aside from the rectilinear motions, which otherwise they would pursue, and made to revolve in curvilinear orbits”.
***************************
Page 397 of 594
“PROPOSITION IV. THEOREM IV.
That the moon gravitates towards the earth, and by the force of gravity is continually drawn off from a rectilinear motion, and retained in its orbit”.
*****************************
Page 111 of 594
“COR. 4. The forces by which bodies, in spaces void of resistance, are drawn back from rectilinear motions, and turned into curvilinear orbits…”
*******************************
Page 148 0f 594
“Wherefore if one rectilinear figure is to be transformed into another, we need only transfer the intersections of the right lines of which the first figure consists, and through the transferred intersections to draw right lines in the new figure. But if a curvilinear figure is to be transformed, we must transfer the points, the tangents, and other right lines, by means of which the curve line is defined”.
*********************************
Page 399 of 594
“PROPOSITION V. THEOREM V.
That the circumjovial planets gravitate towards Jupiter; the circumsaturnal towards Saturn; the circumsolar towards the sun; and by forces of their gravity are drawn off from rectilinear motions, and retained in curvilinear orbits”.
***
Note….”…and by forces of their gravity are drawn off from rectilinear motions, and retained in curvilinear orbits”.
Funny that Newton knew about curvilinear motion/translation in the 1600’s yet textbook authors today cannot describe it correctly.
*********************************
Page 518 of 594
“Whence it was that the planets came to be retained within any certain bounds in these free spaces, and to be drawn off from the rectilinear courses, which, left to themselves, they should have pursued, into regular revolutions in curvilinear orbits…”
C’mon, Gordo.
Appealing to “regular revolutions in curvilinear orbits” makes you a Spinner.
Welcome aboard!
Robertson
I always admit when I was wrong, and this time I do as well.
BUT…
*
1. Surprisingly, by accident of course, you suddenly do not claim about a possibly wrong translation of Newton’s ‘old Latin’ into some ‘old English’ or the like.
Andrew Motte, whom you once disgustingly discredited as a ‘cheating SOB’, because you dumbass dared to think he would improperly translate Newton, suddenly translated, by miracle of course, everything perfectly.
The reason why you suddenly accept Motte’s translation manifestly is due to the fact that Newton’s original Latin text now contains things you agree to.
*
2. However, this doesn’t change anything to the fact that Newton clearly stated that our Moon rotates about an interior axis, what you always tried to deny with completely stupid and stubborn pseudo-arguments.
Thus, Robertson: if you agree to Newton’s work whenever it fits your egomaniac narrative, you then should agree to his work when it doesn’t fit it !!!
*
Here is Andrew Motte’s translation you permanently deny:
Principia Scientifica, Book III
PROPOSITION XVII. THEOREM XV.
That the diurnal motions of the planets are uniform, and that the libration of the moon arises from its diurnal motion.
The Proposition is proved from the first Law of Motion, and Cor. 22, Prop. LXVI, Book I.
Jupiter, with respect to the fixed stars, revolves in 9h.56′; Mars in 24h.39′; Venus in about 23h.; the Earth in 23h.56′; the Sun in 25 1/2 days, and the moon in 27 days, 7 hours, 43′.
These things appear by the Phænomena.
The spots in the sun’s body return to the same situation on the sun’s disk, with respect to the earth, in 27 1/2 days; and therefore with respect to the fixed stars the sun revolves in about 25 1/2 days.
But because the lunar day, arising from its uniform revolution about its axis, is menstrual, that is, equal to the time of its periodic revolution in its orb, therefore the same face of the moon will be always nearly turned to the upper focus of its orb;
but, as the situation of that focus requires, will deviate a little to one side and to the other from the earth in the lower focus; and this is the libration in longitude; for the libration in latitude arises from the moon’s latitude, and the inclination of its axis to the plane of the ecliptic.
This theory of the libration of the moon, Mr. N. Mercator in his Astronomy, published at the beginning of the year 1676, explained more fully out of the letters I sent him.
*
In Footnote e (76) you see what is unequivocal but what you always denied:
” Quoniam enim Luna circà axem suum uniformiter revolvit eodem tempore quo circà Tellurem periodum suam absolvit ”
Translation:
” For the Moon uniformly revolves around its axis in the same time as it completes its period around the Earth ”
*
No one can ignore, distort or erase what Newton wrote.
Neither Robertson nor Clint R nor Pseudomod DREMT nor Hunter nor (recently) Vournas nor anyone else !!!
Yes Bin, Newton clearly was referring to with respect to the fixed stars.
” Yes Bin, Newton clearly was referring to with respect to the fixed stars. ”
*
Yes Clint R, and you clearly still do not understand what that means.
Your cultish belief lets you claim that when somebody describes a motion ‘with respect to the fixed stars’, the motion then is not the same as ‘with respect to Earth’.
The motion keeps the same, Clint R…
What differs is not the motion, it is the motion’s period:
” The spots in the suns body return to the same situation on the sun’s disk, with respect to the earth, in 27 1/2 days; and therefore with respect to the fixed stars the sun revolves in about 25 1/2 days.
When you observe the Sun’s rotation about its axis as viewed from Earth, you must take into account that while you observe the Sun, Earth moves along its orbit around the Sun, what does not modify Sun’s rotation at all, but very well the rotation’s period.
*
You, Robertson, the Pseudomod DREMT and Swenson have been explained that many times since years.
But you all the time ignore the explanation, and come back with your unchanged mind.
Yes Bin, “relative to the fixed stars” means relative to the fixed stars.
Got a model of “OMWAR” yet?
binny…”But because the lunar day, arising from its uniform revolution about its axis, is menstrual, that is, equal to the time of its periodic revolution in its orb, therefore the same face of the moon will be always nearly turned to the upper focus of its orb;”
I just replied to Christos above with another quote from Newton in which Newton reveals the lunar axis is the Earth and not a local axis. Revolution about an axis is not the terminology one would use to describe a rotation about an axis.
I’ll repeat the reply here for your benefit.
“Here is something from Newtonin Principia
Page 541 of 594
In like manner is the moon revolved about its axis by a motion most equable in respect of the fixed stars, viz., in 27d.7h.43′, that is, in the space of a sidereal month;
so that this diurnal motion is equal to the mean motion of the moon in its orbit: upon which account the same face of the moon always respects the centre about which this mean motion is performed, that is, the exterior focus of the moons orbit nearly;
***
This clarifies, in my opinion, that Newton is talking about the Earth as the Moons axis.
*******************
Newton continues
and hence arises a deflection of the moons face from the earth, sometimes towards the east, and other times towards the west, according to the position of the focus which it respects; and this deflection is equal to the equation of the moons orbit, or to the difference betwixt its mean and true motions;
and this is the moons libration in longitude: but it is likewise affected with a libration in latitude arising from the inclination of the moon s axis to the plane of the orbit in which the moon is revolved about the earth;
for that axis retains the same position to the fixed stars nearly, and hence the poles present themselves to our view by turns, as we may understand from the example of the motion of the earth, whose poles, by reason of the inclination of its axis to the plane of the ecliptic, are by turns illuminated by the sun. To determine exactly the position of the moons axis to the fixed stars, and the variation of this position, is a problem worthy of an astronomer.
****************
ChristosI dont know how well this will translate to Greek. The text contains references to Old English, which has been translated to Latin, then back to New English.
Newton is obviously talking about a re-orientation of the near face of the Moon, not to an actual rotation of the Moon on a local axis. It is obvious from the description above that he regards the Earth as the axis about which the Moon revolves. The axis is not a local axis”.
*******
This phrase clarified matter…
“so that this diurnal motion is equal to the mean motion of the moon in its orbit: upon which account the same face of the moon always respects the centre about which this mean motion is performed, that is, the exterior focus of the moons orbit nearly…”
From Britannica…
“diurnal motion, apparent daily motion of the heavens from east to west in which celestial objects seem to rise and set, a phenomenon that results from the Earth’s rotation from west to east. The axis of this apparent motion coincides with the Earth’s axis of rotation…”
Newton appears to be saying this. If you are on the Moon, the apparent motion of the stars in the sky will make it appear as if the Moon is rotating on a local axis.
ps. on top of that, Newton claimed the Moon is moved off a rectilinear motion into a curvilinear motion by Earth’s gravity. He knew the Moon’s motion was curvilinear motion, and motion is just another word for translation.
If he knew that, with his background and intelligence, he would surely not visualize the Moon as rotating on a local axis, given that he knew the Moon kept the same face toward Earth.
binny…”Quoniam enim Luna circ axem suum uniformiter revolvit eodem tempore quo circ Tellurem periodum suam absolvit ”
***
Google translator has become so reliable that I had no problem sending an email to a manufaturer in Mainland China. I apologized in advance in case the translation was bad. The lady replied claiming it was a good translation which she had o problem understading.
When I enter your Latin phrase into Google, here’s what I get…
“For the moon rotates uniformly on its axis at the same time as the earth completes its period”.
That makes no sense whatsoever.
I am trying to say that a lot is lost in the translation from Old English, to Old Latin, to New Latin, to New English. So, we need to look at other claims made by Newton, and when we do, it becomes clear that he was referring to Earth as the axis of the Moon.
If we regard Earth as the external lunar axis, everything begins to make sense. For one, Dremt will likely be very happy since he has been claiming that all along. For another, Newton’s claims about curvilinear motion makes eminent sense.
At no time does Newton claim curvilinear motion with rotation. The guy was far too intelligent not to notice that a body like the Moon could not perform curviliner motion while keeping the same face pointed at the Earth, and still rotate about a local axis.
> Google translator has become so reliable that I had no problem sending an email to a manufaturer in Mainland China.
🤦
Little Willy, please stop trolling.
Robertson
It is clearly visible that you keep as dishonest as usual.
You continue to brazenly misrepresent Newton who clearly wrote:
For the Moon uniformly revolves around its axis in the same time as it completes its period around the Earth
*
No one can ignore, distort or erase what Newton wrote.
Neither Robertson nor Clint R nor Pseudomod DREMT nor Hunter nor (recently) Vournas nor anyone else !!!
You are a liar, Robertson, and you will never change.
binny…”No one can ignore, distort or erase what Newton wrote”.
***
You do a good job of distorting it.
No, Robertson: I post Newton’s wording exactly as it is.
You on the contrary post your private opinion about what he wrote.
You are and keep dishonest, whatever you write about.
You always know when Bin is in meltdown. He starts calling everyone that understands science a “liar”.
That’s why this is so much fun.
Bindidon says:
”You continue to brazenly misrepresent Newton who clearly wrote:
For the Moon uniformly revolves around its axis in the same time as it completes its period around the Earth
*
No one can ignore, distort or erase what Newton wrote.”
LOL! no one can erase the Bible either. So if like Nate you have reduced your argument to a religious one, i am ok with that.
Why are you reducing the auditing sciences to religion, Bill?
Because Bindidon didn’t offer a science argument! obviously! are you having a bit of difficulty in separating science an religion?
Why are you throwing you the auditing sciences under the religolous bus, Bill?
You are as confused as you are garbled.
Bill, Bill,
The whole idea of the auditing sciences is to check receipts.
You now dismiss this activity as religolous.
This is not a good idea for an auditor to do that.
Is this slow enough for you?
Well that just shows how much you know about auditing Willard. Never stops you though huh?
What if the auditee has no receipts? Never thought of that huh?
Actually a significant portion of my auditing career involved such audits. We called it forensic auditing. No formal documentation so it amounted to running down clues.
So an auditor might look at Bindidon’s claim and see if that supports his case. He might try to determine if 1) did the scientist actually say exactly what the auditee claims; 2) did the famous scientist ever consider what Tesla considered? 3) did the famous scientist ever devise an experiment or logical proof to distinguish the right answer from the wrong answer?
Well actually the answer to all those questions appears to be NO and to be real science the answer to them all needs to be YES.
Perhaps Bindidon has a source to support answers to any of those questions. But after a over a year of the spinner nonsense they have even answered a single one of the questions to the satisfaction of any professional auditor.
For example, the quote he attributes to Newton is not the quote I read. . . .it seems to be considerably embellished to suit Bindidon’s case. Is Bindidon fraudulently representing what Newton actually said? He is if he embellished the quote. If he didn’t he should have proof.
Same for the other conditions for science, except I haven’t seen the proponents even claim if any of the other conditions are true.
As DREMT has pointed out that believing the moon on the right represents orbital motion without rotation produces a conflict in science where the orbital motion is still assigned an angular momentum. Nate is aware of that. But he can’t classify the orbital motion in a way that it would still have angular momentum, though he has claimed there are such motions. But as DREMT showed Madhavi classifies the motions in a way that leaves no room for the existence of Nate’s motion. A rotation must meet certain conditions. If it does it is a rotation and there is angular momentum. If it doesn’t it isn’t a rotation and does not have angular momentum. Where Nate gets confused is you can have motions that involve two motions. One with angular momentum and the other without. But that doesn’t resolve the conflict resulting from believing the moon on the right is such a combination of motions.
So the spinner position is in conflict with its own science.
So in this case the auditee has no science. If it aint science and its a belief, its religion.
Here we have cases of folks who doesn’t know what science is.
y’all think its whatever a scientist says. IMO, thats elevating a scientist to the God level. Why not pick Tesla’s viewpoint instead? Why not simply acknowledge that all experts from time to time say stupid stuff.
Of course you are ignorant enough of the topic, any topic, to pick who ever you want to pick and think it is science and you don’t even want to know if there are any receipts.
I got this great bridge opportunity Willard. You don’t want to miss out on it.
“As DREMT has pointed out that believing the moon on the right represents orbital motion without rotation produces a conflict in science where the orbital motion is still assigned an angular momentum. Nate is aware of that.”
Bill is just a habitual liar. He cannot seem to resist INVENTING things that his opponents have never said or he imagines they believe.
“But he cant classify the orbital motion in a way that it would still have angular momentum, though he has claimed there are such motions.”
False. I have clearly stated that orbital motion has angular momentum. We discussed this in detail and I explained why orbital angular momentum is both valid and useful, and you seemed to get it.
Nate says:
‘Angular momentum is a mathematical construct of mass, velocity and position. No part of it is more real than any other.’
Bill sez: “Thats true”
and
“I agree that relying on Lorb +Lspin = Lmoon gives a pretty good approximation of the angular momentum”
https://www.drroyspencer.com/2022/11/canadian-summer-urban-heat-island-effects-some-results-in-alberta/#comment-1410658
Now you manage to get it all confused all over again and return to your prior erroneous intuitions.
This illustrates again that it is pointless to discuss technical physics with you Bill. You cannot get it straight, cannot wrap your mind around it, cannot retain what youve managed to learn, but you persist in believing that you are competent enough in this area to correct physicists.
Socrates said it:
“I am wiser than that man. Neither of us probably knows anything worthwhile; but he thinks he does when he does not, and I do not and do not think I do”
In modern parlance: stick to Auditing, and stop man-splaining physics to people who actually understand it.
“So an auditor might look at Bindidons claim and see if that supports his case. He might try to determine if 1) did the scientist actually say exactly what the auditee claims”
Did you check? No. Bindidon previously showed the source.
“2) did the famous scientist ever consider what Tesla considered?”
Which part? Tesla came 200 y later. The problem is that Tesla was not a physicist and not aware of what Newton said and demonstrated on the subject of the Moon..
“3) did the famous scientist ever devise an experiment or logical proof to distinguish the right answer from the wrong answer?”
Yes lots of proofs and observations in the Principia. If the Auditor wants to go through them he is welcome to, but he might need technical help from a physicist.
Nate you are just obfuscating. You need to take a position on the matter first as outlined by DREMT.
Is orbital motion without axial rotation as the moon on the left or the moon on the right?
You can’t continue to obfuscate by switching back and forth playing a game with the equation of an orbiting uniform sphere.
So take a position and lets see if we have agreement or not.
My position on this issue has been clear and consistent for years.
.
The word receipt might not mean what you make it mean, Bill.
Here the receipt is a text. You kept harping that looking at the text was a religious thing. So you are in effect arguing that auditing is a religious thing.
And of course every text analyst knows about forensics:
https://classics-at.chs.harvard.edu/an-experiment-on-platos-gorgias-as-an-introduction-to-textometry/
If you want to know what Newton said, reading Newton remains the best bet. You could also read what otters said of him. Heck, even fragments could do:
https://www.nli.org.il/en/discover/humanities/newton-manuscripts
I hope you deploy a sounder logic and a more sociable persona in professional contexts, for your act here sucks so bad it makes me cringe.
Nate says:
My position on this issue has been clear and consistent for years.
———————-
Perhaps it has been. I just haven’t seen it. I don’t come close to reading all the posts in here.
So instead of making excuses just answer the question. Is it the moon on the left or the moon on the right?
Bill displays great forensics skills once again.
Willard says:
If you want to know what Newton said, reading Newton remains the best bet. You could also read what otters said of him. Heck, even fragments could do:
https://www.nli.org.il/en/discover/humanities/newton-manuscripts
———————-
Well I put Bindidons quote of Newton in the search bar and it came up ”No records found.”
And what are you going to do about that, Bill.
You are the Master Forensics Guy.
Show us the way.
Auditors like to depend upon the cooperation of the auditee. Such cooperation reduces the expense of an audit by probably something around an order of magnitude over forensic auditing. For forensic auditing of Bindidon’s claim it will cost you money. For Bindidon he can prove his credibility easily by cooperating if he can prove his credibility.
“So instead of making excuses just answer the question. Is it the moon on the left or the moon on the right?”
Discussed ad nauseum throughout the current comments. I have no desire to follow up with you, as you should have gathered from this:
https://www.drroyspencer.com/2022/12/uah-global-temperature-update-for-november-2022-0-17-deg-c/#comment-1414533
Nate says:
Discussed ad nauseum
—————–
No it hasn’t! We both apparently agree that orbital motion has an angular momentum.
But, you haven’t answered if orbital motion WITHOUT axial rotation is as the moon on the left or the moon on the right.
Non-spinners say it is the moon on the left. What say you? Stop obfuscating and just answer the simple question.
Forensics is mostly adversarial, Bill.
You should know that:
https://nagel-forensics.com/investigating-cryptocurrency-fraud/
But as a token of appreciation for your tangible efforts, here is a hint:
Read the title of the page you pretend to have searched.
Thats probably not true. Generally forensic auditing is not adversarial. Sometimes it is. It may seem so to outsiders because the adversial audits get all the press, like CAGW, and the moon rotating on its own axis.
More often forensic auditing is just about myth busting or to put records in order to facilitate future management. But even that might seem adversarial but it really isn’t as there is no responsibility claimed or possessed by the so called adversaries. Its just a hobby of theirs to cling to myth.
The page I searched was:
https://www.nli.org.il/en/discover/humanities/newton-manuscripts
Read the title of the page again, Bill.
In fact reading the URL would do.
Report.
Every single government and every single bank on this planet uses auditing forensics in an adversarial manner, btw. Best of luck trying to minimize that!
“Discussed ad nauseum
No it hasnt!”
‘moon on the left’ 40 hits
‘MOTL’ 175 hits
Nate can’t commit to an answer.
I guess he doesn’t know. apparently he can’t find a moon he wants to support.
Bill, ever the master-baiter at work.
You and I have discussed this at length before.
Well looks like you just examined 215 hits and couldn’t find a single one where you answered the question. What else does anyone need to know?
Willard says:
”Every single government and every single bank on this planet uses auditing forensics in an adversarial manner, btw. Best of luck trying to minimize that!”
When do banks use forensic auditing in an adversarial manner? they lack power to do so. For a private entity to use forensic auditing it can only be a self audit which by definition is NOT adversarial. Its possible such an audit will elevate to a criminal prosecution but thats where the bank would hand over what they learned about themselves to the government.
“Well looks like you just examined 215 hits and couldnt find a single one where you answered the question. What else does anyone need to know?”
No, but you are the one so interested, yet couldnt be bothered to look.
Meanwhile, try your hand:
https://www.drroyspencer.com/2022/12/uah-global-temperature-update-for-november-2022-0-17-deg-c/#comment-1415654
and you may get an answer.
Nate says:
”The people of the Moon colony are tired of the freezing cold darkness they experience half of the time, so they decide to STOP the Moons rotation.
They then realize that stopping its orbital motion would be a horrible mistake, because then the Moon would then fall out of orbit and crash headlong into the Earth.
Luckily they realize that its ROTATION and ORBITAL MOTION are INDEPENDENT MOTIONS, so ONE MOTION can be stopped without affecting the other!”
———————–
Thats stupid! First, stopping a rotation requires the identical torque required to start a rotation. So you have erred by assuming you actually stopped something rather than added an additional motion.
Second, its even dumber because if you did what you suggest here from your cherry picked point of reference of a distant star the damned moon would still be dark half the time.
So your only alternative to achieve your objective would be to create a new motion where the moon rotated in time with the earth’s orbit around the sun.
Despite your little experiment completely failing to accomplish anything towards its stated objective it does appear that you are selecting the moon on the right.
But, third, you have failed to consider that you would have to perpetuate the torque on the moon to counter the orbital torque applied from earth’s gravity, i.e. continue to induce a new motion.
You are so absorbed into your educational cocoon here you have managed to inculcate yourself into believing in unreal orbiting perfect spheres where all you have to do is exert some temporary torque to stop a motion.
An experienced physicist, like an engineer, would quickly realize that he needs a nail, bolt, rivet, or something like that to hold the moon on its orbit around the sun, or galaxy, or whatever he wanted it to rotate around. . . .and that would stop the orbit around the earth.
So go ahead Dude and continue believing in Easter Bunny physics if you want to.
“So your only alternative to achieve your objective would be to create a new motion where the moon rotated in time with the earths orbit around the sun.”
Thats a good point Bill! You should post it over there.
But it does miss the point of the exercise to show that the Moon’s rotation and orbit are independent motions.
Both the MOTR and MOTL have orbital motion. The Moon’s rotation has no effect on the ability of the moon to stay in its orbit, and conversely the orbital motion has nothing to do with the Moon’s rotation.
“Thats stupid! First, stopping a rotation requires the identical torque required to start a rotation. So you have erred by assuming you actually stopped something rather than added an additional motion.”
Weird. Point?
“But, third, you have failed to consider that you would have to perpetuate the torque on the moon to counter the orbital torque applied from earths gravity, i.e. continue to induce a new motion.”
No worries for several million years. The effect of the tidal-locking torque is evidently teeny tiney.
“You are so absorbed into your educational cocoon here you have managed to inculcate yourself into believing in unreal orbiting perfect spheres where all you have to do is exert some temporary torque to stop a motion.
So go ahead Dude and continue believing in Easter Bunny physics if you want to.”
Even on XMAS you can’t stop with the ad-hominem attacks.
Reminds me again why I try to stop engaging in discussions with you Bill.
Nate says:
”But it does miss the point of the exercise to show that the Moons rotation and orbit are independent motions.”
No evidence about that has been presented Nate.
You are essentially saying that because you can induce an independent spin all rotations must possess independent elements.
Actually, with the right physical input one could cause a chalked circle on a steel deck to rotate independently as well.
You are just so inculcated by the tools you were taught that you believe them to be the true reality of the moon’s orbit.
But the motion of the moon isn’t independent as it is all induced by the same force a force that both bends the path of the moon and stretches the moon at the same time inducing it into what is ‘by definition’ a rotation.
————————–
Nate says:
”Both the MOTR and MOTL have orbital motion. The Moons rotation has no effect on the ability of the moon to stay in its orbit, and conversely the orbital motion has nothing to do with the Moons rotation.”
The MOTR has two motions Nate. It has an orbital rotation plus an independent spin. But since the likelihood of a independent spin actually perfectly cancelling an orbital rotation has never been observed one has to question if anything has been actually cancelled.
You can see that the orbital rotation via the single extra sidereal rotation. From your perspective the earth rotates 366 times but only 365 of them are observed from the sun, thats because one of the rotations is around the sun and it is manifested by about one degree per day.
And as spinners keep erring they reject that motion as a rotation when it is there plain and easy to count.
If you observe the earth’s orbit from a distant star perpendicular to the earth’s orbit you can plainly see the rotation is about 23 degrees away from the pole. It appears that axis rotates around the latitude line due to the independent spin of the earth. But if there were no independent spin the axis would remain in one position on that latitude line as the rest of the earth rotated around it in time with the orbit as with the MOTL.
In fact it isn’t even on the same axis! It is just an optical illusion that it is. The sidereal rotation is actually about 23 degrees different.
Consider looking at Uranus’s rotation from a distant star. Here the axis of the additional rotation is much easier to see as you see Uranus’ axis at near perpendicular to its axis of rotation around the sun.
You see Uranus revolving every 17 hours like a ball rolling away from you, yet it has that one extra sidereal rotation where it hardly appears to revolve at all because of the spinner viewpoint that an orbit isn’t a true rotation. But for Uranus the axis perpendicular to the orbit the axis appears to move around the latitude line on Uranus near its equator and if Uranus had no independent spin that rotation would still be there from any random star except the sun. the only way to end it would be to end the orbit or create a perfect mask of an independent rotation in the opposite direction.
———————-
Nate says:
””First, stopping a rotation requires the identical torque required to start a rotation. So you have erred by assuming you actually stopped something rather than added an additional motion.”
Weird. Point?”
The point is to stop something all you need to do is exert a temporary force. But that doesn’t work for the moon.
You only have two choices for the moon. One is to stop the orbit and the other is to create and independently maintain a rotation that visually cancels out the sidereal rotation of the orbit.
———————–
Nate says:
””But, third, you have failed to consider that you would have to perpetuate the torque on the moon to counter the orbital torque applied from earths gravity, i.e. continue to induce a new motion.”
No worries for several million years. The effect of the tidal-locking torque is evidently teeny tiney.”
Yep the same kind on nonsense evidence as the cause of climate change. . . .namely you dreamed it up and handwaved away natural facts as being not worthy of discussion.
What you are failing to process is you never stopped any rotation at all, all you did was visually mask it. If you want to stop that sidereal rotation you have to stop the orbit. What you are dealing with here is the ”cloud of particles” problem. Gravity is independently affecting every particle of the moon differently, thats why gravity stretches the moon. You are so sold on the idea that gravity has to stop independent spin in order for a sidereal rotation to exist that you can’t see it always exists.
Tidal locking means removal of independent spin and that can take a long time. And because independent spin has greater angular momentum than what is required to the particles of the moon to change relative position it dominates that part of the motion but doesn’t eliminate it because the axis will precess.
You have to actually reject your Easter Bunny physics where you confound ‘concepts’ and ‘tools’ as actually being reality. The Easter Bunny brought you those tools like they were colorful eggs from an Easter Bunny. One grows up and learns otherwise from experience that the tools are tools and reality is reality. Academics constantly fall into this trap. Professionals can’t afford to.
And as long its just for fun discussion there is no embarrassment. Embarrassment only arrives when reality arrives.
Have you ever heard of check kiting, Bill? You will never guess how that works. Nowadays banks do not even need humans to flag them up.
Alternatively:
https://www.cnn.com/2022/12/06/politics/trump-organization-fraud-trial-verdict/index.html
Consider this my Xmas gift to you.
“The MOTR has two motions Nate. It has an orbital rotation plus an independent spin. But since the likelihood of a independent spin actually perfectly cancelling an orbital rotation has never been observed one has to question if anything has been actually cancelled.”
One has to question your sanity. You believe that this unobservable thing must be there. Perfect example of religion, Bill, a cultish belief that can never be falsfied!
Willard I have no idea what this has to do with anything being discussed here.
Well you have to agree Nate that:
1) to create a motion one needs a force;
2) once a motion has been started its velocity will continue until a force is applied to stop.
3) to stop a motion one needs a force;
4) Once a motion is stopped it won’t restart with a new force.
So your alleged stopping of the rotation of the moon in orbit is simply creating a motion opposed to a current motion, its two motions, needs its own force, and to prove that its more than you give credit for the stopping of the alleged independent motion does actually stop it because the instant the force is ended the moon continues to rotate.
So two things are abundantly clear for your alleged stopping of the moons rotation. There are two separate forces, thus two motions. Once you abandon your alleged motion stopping force the moon continues to rotate. The only way to stop the moon from rotating is to remove it from orbit but then it will just rotate around another object. To stop that you must stop all motions of the moon like by bolting in someway to some location in the universe. If you don’t it will fall and begin rotating again.
We agree there are practical and useful conceptual reasons to regard the moon’s rotation as a separate motion from its orbit. But their zillions of such realities in science like trying to understand the function of a single type of a cell in a living body when without the cell type the body can’t live.
and we can agree to disagree. I have no ambition to drag you away from your fairy tale physics. I am just going to stick with the practical reality. fact is that when you strip away all other forces and momentums associated with the moon except those of gravity of earth that causes it to look like the MOTL; you are left with the simplest sustainable reduction of orbital motion and by selecting cherry picked points of view to dispute that, while possibly being more practical, just means you haven’t looked at the situation completely.
Bill,
“So your alleged stopping of the rotation of the moon in orbit is simply creating a motion opposed to a current motion, its two motions, needs its own force, and to prove that its more than you give credit for the stopping of the alleged independent motion does actually stop it because the instant the force is ended the moon continues to rotate.”
This is gibberish. I can’t make heads or tails of it.
You have some special knowledge of tidal locking that astrophysics doesn’t have, or are you just making it up?
Below you are claiming experiments that prove you are correct. But that is just bullshit. You can’t produce any evidence of an experiment.
Bill,
You don’t think Newton’s laws were tested? You don’t think the orbits and spins of planets can now be accurately predicted based on these laws?
You are essentially saying using established physics to understand planetary motion is BAD. Which is just weird.
But then you try to argue WITH physics. Angular momentum, torques, etc.
“Once you abandon your alleged motion stopping force the moon continues to rotate. The only way to stop the moon from rotating is to remove it from orbit but then it will just rotate around another object. ”
Here you are just making up out of whole cloth what you think will happen without any logic or facts.
How is that better then using physics?
Astrophysics investigations of the tidal locking of various moons have estimated that for our Moon it required millions of years. The Moon after all is a MASSIVE body with Massive moment of inertia. can’t change its spin on a dime.
Neither you nor I have special knowledge to the contrary.
So for you to simply assert otherwise is not a valid argument. It is speculation, that just so happens to support your beliefs (which are looking more and more like religion.
Evidence that the tidal locking time can be estimated with physics, as opposed to speculation:
https://en.wikipedia.org/wiki/Tidal_locking#Timescale
Nate says:
”You dont think Newtons laws were tested? You dont think the orbits and spins of planets can now be accurately predicted based on these laws?”
Nate there is no law that says the moon spins on its own axis. If you can find one post it. Stop making stuff up from thin air it is reflecting very badly on your credibility.
———————
Nate says:
”Once you abandon your alleged motion stopping force the moon continues to rotate. ”
Here you are just making up out of whole cloth what you think will happen without any logic or facts.”
Once again you are in denial of physics. The force of gravity stretches the moon and provides the force that makes the orbital motion a complete rotation. Are you denying there is a force of gravity to cause the moon to rotate as the moon on the left?
———————-
Nate says:
”Astrophysics investigations of the tidal locking of various moons have estimated that for our Moon it required millions of years. The Moon after all is a MASSIVE body with Massive moment of inertia. cant change its spin on a dime.” and ”Evidence that the tidal locking time can be estimated with physics, as opposed to speculation:”
I never claimed it could change on a dime Nate. You are bring up irrelevant points.
The question becomes a much more nuanced one than you appear to comprehend. A moon with no spin as seen from a distant star is a moon with no rotation at all, period.
When the moon begins its orbit trajectory it will no longer have zero rotation. Such an object starting with zero rotation may have a long entry process which is a spiral shaped entry gradually reducing its orbit radius. It can be practical to claim final orbit radius long before it occurs because of final adjustments being proclaimed ‘immaterial’.
But the MOTR is in conflict with the rotational concepts as expressed by Madhavi and many others without a second force exactly eliminating some rotational angular momentum of the orbit.
It is clear to me that orbital motion without axial rotation is as the moon on the left. I don’t think any of the spinners have come up with a better argument. I won’t argue that final orbit can be declared materially complete long before it actually is complete, but we make such declarations all over the place in physics and entirely across the spectrum of Newtonian physics as shown by Einstein.
So you can cling to the precepts of the mythical God’s of physics if you want but all it shows is you learned physics by brute rote force rather than analytically. . . .which is an extremely common outcome of our educational factories where volume of production is valued much more than quality of production.
“The point is to stop something all you need to do is exert a temporary force. But that doesnt work for the moon.
You only have two choices for the moon. One is to stop the orbit and the other is to create and independently maintain a rotation that visually cancels out the sidereal rotation of the orbit.”
“Once you abandon your alleged motion stopping force the moon continues to rotate.”
I had said:
“No worries for several million years. The effect of the tidal-locking torque is evidently teeny tiney.”
You:
“Yep the same kind on nonsense evidence as the cause of climate change. . . .namely you dreamed it up and handwaved away natural facts as being not worthy of discussion.”
“What you are failing to process is you never stopped any rotation at all, all you did was visually mask it. If you want to stop that sidereal rotation you have to stop the orbit.”
Weird, made up nonsense with no evidence offered.
Now you try to wind it back:
“I never claimed it could change on a dime Nate. You are bring up irrelevant points.”
Typical Bill.
Nate say:
”I had said:
No worries for several million years. The effect of the tidal-locking torque is evidently teeny tiney.”
I already answered that question. Bringing an orbiting object up to full rotation is something that is not complete until tidal locking is achieved. If it takes millions of years it takes millions of years but for our moon and the only object we are talking about it is a ‘fait d’acompli’.
“If it takes millions of years it takes millions of years”
Hence, for the Moon Colony, this
“But, third, you have failed to consider that you would have to perpetuate the torque on the moon to counter the orbital torque applied from earths gravity, i.e. continue to induce a new motion.”
was a great big red herring.
that is completely garbled. Makes no sense at all.
They are YOUR quotes, so if they are garbled you know who to blame.
The point is this started with YOU complaining that the Moon Colony’s effort to STOP the rotation would not work layered with lots of insults.
You stated
“Thats stupid! First, stopping a rotation requires the identical torque required to start a rotation. So you have erred by assuming you actually stopped something rather than added an additional motion.”
Weird.
“But, third, you have failed to consider that you would have to perpetuate the torque on the moon to counter the orbital torque applied from earths gravity, i.e. continue to induce a new motion.
You are so absorbed into your educational cocoon here you have managed to inculcate yourself into believing in unreal orbiting perfect spheres where all you have to do is exert some temporary torque to stop a motion.
An experienced physicist, like an engineer, would QUICKLY REALIZE that he needs a nail, bolt, rivet, or something like that to hold the moon on its orbit around the sun, or galaxy, or whatever he wanted it to rotate around. . . .and that would stop the orbit around the earth.
So go ahead Dude and continue believing in Easter Bunny physics if you want to.”
NOW you begrudgingly agree that it could be stopped for millions of years. IOW it would work!
This is par for the course in discussions with you, Bill.
You express your feelings with excess certainty, arrogance and lots of insults, as if they were obvious facts, then by the end of the discussion most of it is in the trash bin.
Yet you never seem to learn.
You guy are so stupid it hilarious
Lets say your uncle gave you a merry go round that comprises a 40 foot solid steel disk with a motor driven axle in the center. The motor has reduction gears to turn the merry-go-round at 3 rpm.
But you also want to put a horsey on the merry go round that rotates in a circle. So carefully design this and weld a vertical steel axle on the deck. Put a horsey on the axle with bearings and a sprocket drive. Then because you want the horsey to also rotate at 3rpm you install a small motor with reduction gears to drive the sproket drive at 3 rpm.
Now since you regard yourself as an engineering genius you sit back proudly and regard your creation since you now a both a merry-go-round and a horsey that will rotate at 3rpm./ Wow we are really impressed here. ROTFLOAO!
Agreed, Bill.
You have no idea and it shows.
” If it takes millions of years it takes millions of years”
Ok Bill so your initial opinions on this exercise are were wrong.
What to do?
Switch to something new! The MGR.
Pulleeez..
Keep it up, Bill, you’re winning so far!
sez our most dishonest troll.
…it up, Bill, you’re winning so far!
Dr Roys Emergency Moderation Team says:
”Keep it up, Bill, youre winning so far!”
Yep I can tell they have gone full throttle ad hom!
“So if like Nate you have reduced your argument to a religious one, i am ok with that.”
Bill just keeps on lying.
Quote me saying any such thing, Bill.
Oh Nate I agree you can’t distinguish between a science argument and a religious one. for you they are one and the same as long as they come up with the result you want.
I realize that the last post might not be clear to you.
I said you made a religious argument. Your response was you never said you made a religious argument. I agree with your response but note that it was 100% unresponsive to what I said.
Only a loser keeps making up bullshit that their opponent never said.
That qualifies you as one.
Nate are you a moron? You didn’t say your argument was a religious argument. I said your argument is a religious one. Are you now trying to argument you didn’t have an argument? Well we can agree on that because your argument has absolutely nothing to do with science. If you believe it does please provide a source.
OK Bill, whatever.
But I have a pretty good idea of what is a science argument and what is a religious argument.
Whereas I don’t think you do.
Define a religious argument and science arguments, and then we will see.
Sure a religious argument is where you say Newton said.
A Science argument is where you can point to what Newton did to establish some science.
In case one you are elevating Newton to the God level. In number 2 you can establish that the scientific method was used to support the comment.
This ignores the fact that is experimentally tested. Newtons laws tested and verified countless times. But can still be falsified any time. Physics is not about the scientists, it is about the facts. It
Religion is a set of beliefs that are never tested and are generally not falsifiable.
When I’m using physics and you label that religion, that’s just silliness, and trolling, and reflects the weakness of your arguments.
Now you are just spewing bullshit Nate
You really dont seem to know the difference between science and religion. That explains a lot.
Spew some science Nate or you won’t know. All we know here is you don’t back up your stuff. You claim Newton ran some tests to determine the moon spins on its own axis but you can’t find a single one.
“You claim Newton ran some tests to determine the moon spins on its own axis but you cant find a single one.”
Quote me saying any such thing.
Astronomy has observed the Moon’s rotational axis. The one tilted 6.7 degrees that you guys deny exists.
Your religious beliefs empower that denial.
Nate says:
”Astronomy has observed the Moons rotational axis. The one tilted 6.7 degrees that you guys deny exists.
Your religious beliefs empower that denial.”
So where is the physics law that says an axis must be perpendicular for an object to rotate?
the fact is there are many rotations affecting orbital rotation because there are more than two objects in the universe exerting rotational forces on the moon. Are you going to follow your own logic here Nate and declare that no rotations are occurring with a spinning top because of precessions of the axis?
Ultimately where all that is headed is a complete denial that objects can rotate around an external axis and that chalked circles on a solid rotating disk are actually rotating on their own COM axis.
You have no consistency in your arguments and they fly in the face of the facts.
“So where is the physics law that says an axis must be perpendicular for an object to rotate?”
Uhhhh?
The point is the orbital axis and the rotational axis are not the same.
This is pretty basic.
a. The orbital motion is elliptical around an orbital axis and has variable speed.
b. The rotation is around an axis tilted 6.7 degrees to the orbital axis, and aligned with a fixed point among the stars..
You guys offer no model to explain this as ONE MOTION.
Nate says:
The point is the orbital axis and the rotational axis are not the same.
This is pretty basic.
a. The orbital motion is elliptical around an orbital axis and has variable speed.
b. The rotation is around an axis tilted 6.7 degrees to the orbital axis, and aligned with a fixed point among the stars..
You guys offer no model to explain this as ONE MOTION.
========================
Its one motion because:
a) the angular momentum which is the key rotational value remains the same.
b) Lunar precessions results in the mean axial direction to be perpendicular to the ecliptic.
So there is your explaination. After all you guys use means all the time and often use them when it is inappropriate to use means such as in calculating Lorb.
So no sensible model for it being ONE MOTION. Just declared ‘truth’.
IOW religion.
“a) the angular momentum which is the key rotational value remains the same.”
The angular momentum is a key orbital constant for any orbit, including Earth’s.
“b) Lunar precessions results in the mean axial direction to be perpendicular to the ecliptic.”
Same goes for the Earths axis.
And? You guys agree that the Earth has Spin and Orbit.
Makes perfect sense that a precession is enabled by a tilted orbit which changes the orientation of the vector of gravity or from the superior angular momentum of an independent spin as would be the case for earth which has independent spin and near zero orbital tilt from which the orbital rotation creates a very slow precessing motion.
After all it doesn’t hardly take any force at all for a spinning top to start precessing.
So you raise two properties of the Moon that supposedly show that the Moon has no independent spin.
These are immediately shot down, as another body with independent spin has these same properties.
End of story.
But no. Lets throw a different desperate, wrong idea at the wall and see if it sticks!
“earth which has independent spin and near zero orbital tilt from which the orbital rotation creates a very slow precessing motion.”
Wrong and ignorsant, The Earth’s orbit DEFINES the ecliptic plane. Its tilt is DEFINED to be zero. But yet it precesses due to interaction with other planets which are orbiting in OTHER planes tilted wrt the Earths.
Both the Moon and and Earth’s Orbital axis and Spin axis have this type of external interaction (torque) that produce precession of them. These precessions can be predicted with Newton’s laws, IOW established physics.
So still no daylight between the Earth’s and Moon’s properties are identified.
Again, there are simply no facts or logic to support the feeling that the Moon’s orbit and spin are somehow ONE MOTION, other than to sustain a BELIEF invented by a cult, that is not falsifiable.
You just reject the notion of a rotation around an external axis that is well established as possessing an angular momentum much greater than that of spin angular momentum.
So you selectively look at the particles of the moon having for example two particles on opposite sides of the moons closest and furthest from earth would switch positions by a distance of 2,159 miles in relationship to each other.
If the moon had linear momentum it would have zero angular momentum because of the lack of an angular velocity and all the angular momentum the moon had would be this switching of position across a relatively short distance.
But in fact over the course of an orbit there is an angular velocity that is manifested in angular momentum and these particles traveled different distances and possess far more angular momentum than in your linearly traveling moon.
You would have the particles traveling in a circle of a diameter of only 2,159 miles and being in possession of equal angular momentum.
But in fact they are respectively traveling
in ellipses of 240,080 and 237,920 miles. They do not possess equal angular momentum. And they individually possess around 125,000 times of the angular momentum than you allow for.
Conceptually breaking down the moons motion into a linear orbit actually comes close to the correct answer because the ‘relative motion’ of the particles have a mean difference approximating such ‘relative’ motion to each other, but this only works for a perfect sphere which the moon is not.
Also, the difference is NOT evenly apportioned between the particles on opposite but equidistant from the center of the moon.
Your formula only works for a perfect sphere. It also only works for a moon traveling a straight path while revolving in a general plane motion (2 motions).
However a tidal locked moon is NOT in possession of 2 motions and no allowance for linear motion is necessary because there is none. So it isn’t a general plane motion as you claim.
Fact is these particles are in possession of vastly more angular momentum than you claim (while realizing you kludge the problem with linear momentum in an attempt to make up the difference), and their angular momentum is not equal to one another which demonstrates further the kludge you are using.
“You just reject the notion of a rotation around an external axis that is well established as possessing an angular momentum much greater than that of spin angular momentum.”
Nope, and weird.
“If the moon had linear momentum it would have zero angular momentum because of the lack of an angular velocity and all the angular momentum the moon had would be this switching of position across a relatively short distance.”
So now you are switching your position on this issue for the 6th time.
Hopeless.
“However a tidal locked moon is NOT in possession of 2 motions and no allowance for linear motion is necessary because there is none. So it isnt a general plane motion as you claim.”
Assertion without evidence. You tried but failed to make the case.
Consider the MOTR and MOTL, both have the motion required to keep them in the Orbit.
Of the two, which has the MINIMAL motion? IOW which has the minimum amount of kinetic energy? Which has the minimum amount of angular momentum?
The MOTR has the kinetic energy of a point mass, M, moving at the orbital speed, V, K = 1/2 M V^2. It has angular momentum of a point mass moving at orbital speed at distance R from the axis, L = MVR.
The MOTL has the same K as the above point mass, PLUS an additional amount due to Spin around its axis, 1/2Iw^2, where I = moment of inertia, and w = V/R, is the angular velocity.
The MOTL has the same angular momentum as the above point mass, PLUS and additional amount due to Spin around its axis, S =Iw.
So as you can see, the MOTR has the minimal amount of energy and angular momentum needed to be in orbit. It has the minimal orbital motion.
It makes no sense to claim that the MOTR somehow contains an unobservable rotation in addition to its orbital motion.
By the Madhavi definition of rotation, only the MOTL has rotation.
And keep in mind that both of these have a circular orbit and rotation in the same plane. Whereas the real Moon has non circular orbit and out-of-plane rotation (spin on a tilted axis) .
Nate says:
”However a tidal locked moon is NOT in possession of 2 motions and no allowance for linear motion is necessary because there is none. So it isnt a general plane motion as you claim.”
Assertion without evidence. You tried but failed to make the case.
———————————-
so do you claim it is in posssession of 2 motions as in a general plane motion.
all the next several paragraphs of yours aside indeed have forces to both keep them in orbit and tidal lock the orbiting moon as does anything rotating on an external axis that doesn’t have additional power source or momentum to permanently or temporarily resist the force that eventually forces tidal locked moons into a true rotation around an external axis.
Your desire is to proclaim 2 motions: a curvilinear translation plus a rotation on a COM.
Then a second later you say: ”It makes no sense to claim that the MOTR somehow contains an unobservable rotation in addition to its orbital motion.”
So what is it Nate a single motion or 2 motions? It should not change its nature based upon a concept you have never ever observed. Fact is the MOTR is a Unicorn. . . .never ever seen. So how could I be claiming the MOTR is real much less possessing an unobserved rotation. What you would have with the MOTR would be 2 motions with forces offsetting each other. If all you have is the force of gravity the MOTR can’t exist beyond and infinitesimal moment of less than a blink of the eye. Meanwhile you readily acknowlege that the earths motion around the sun is comprised of two motions as you can see it is. As the earth slows its rotation on its COM it eventually it becomes one motion which is a single rotation. From a distant star you can see that rotation. You just want to confound it as 2 rotations. Its just bad math, bad logic, and extrapolating from the concepts you learned in physics class to roughly estimate angular momentums of rotating perfect spheres.
“Then a second later you say: ‘It makes no sense to claim that the MOTR somehow contains an unobservable rotation in addition to its orbital motion.’
So what is it Nate a single motion or 2 motions?”
It is absolutely clear that I am saying the MOTR has one motion, orbital motion.
“Fact is the MOTR is a Unicorn. . . .never ever seen.”
Why do we care? To measure any quantity, like rotation, we need to know what 0 is. It is the reference point. And nothing prevents it from existing except your lack of imagination.
Nate says:
It is absolutely clear that I am saying the MOTR has one motion, orbital motion.
———————
which would be a curvilinear translation with no angular momentum. So does the orbital angular momentum magically appear the minute the moon gets a independent rotation?
Nate says:
December 27, 2022 at 5:38 PM
Fact is the MOTR is a Unicorn
”Why do we care?”
We shouldn’t care as it doesn’t exist. It only exists for UFO freaks and conspiracy theorists, and 3 year old that think the Boogie Man lives under the bed. So we are in agreement.
”To measure any quantity, like rotation, we need to know what 0 is. It is the reference point. And nothing prevents it from existing except your lack of imagination.”
You don’t need that according to Einstein. It just a tool used by your 2nd grade teacher trying to teach you how to count how many ducks were in the picture before introducing you to subtraction.
No ducks means no ducks. Here you want to pretend the MOTR has no rotation but its a bit more complicated than counting ducks because the only way the MOTR could exist is with 2 rotations. Obviously you can see thats a legitimate case. You just want to wave it away and go for an impossible situation as you suggest you dremt up in your imagination.
“which would be a curvilinear translation with no angular momentum. So does the orbital angular momentum magically appear the minute the moon gets a independent rotation?”
Bill you KEEP oscillating between getting/not-getting angular momentum!
In this case you are back in the not-getting it mode again.
What happened to this Bill?
“I agree that relying on Lorb +Lspin = Lmoon gives a pretty good approximation of the angular momentum”
This ongoing confusion does not help your cause!
“Here you want to pretend the MOTR has no rotation but its a bit more complicated than counting ducks because the only way the MOTR could exist is with 2 rotations.”
Again, rotation of a rigid body is well defined (see Madhavi) and measurable. The MOTR, as depicted has none.
Again, curvilinear translation is well defined (see Madhavi) and measurable. The MOTR has curvilinear translation.
Your claimed two cancelling rotations of the MOTR are not observable.
One could equally well claim it has 12 cancelling rotations and 6 cancelling translations.
These are good examples of beliefs that are not FALSIFIABLE.
That makes it religion, Bill. AFAIK the two cancelling rotations was a belief dreamed up your cult leader, DREMT.
Bill, in this video:
https://youtu.be/ey1dSUfmjBw
From about 3:58 onwards, people can watch a demonstration of how movement like the MOTR can be comprised of two motions, in case they have somehow got themselves confused into believing it was something I made up. It’s just the absolute basics of the “Non-Spinner” position, so anybody that is confused by this clearly never understood the moon issue from the beginning. They probably will argue it has something to do with “reference frames”, rather than realising that it is just a question of keeping axial rotation separate from the correct concept of “orbital motion”.
Anyway, just thought that might help your current discussion proceed more smoothly. Keep on keeping on!
“the MOTR can be comprised of two motions”
TRUE. It CAN ALSO be comprised of 12 cancelling motions.
Neither is an observable fact nor falsifiable.
Can Bill or anyone else point out how this hypothesis could be tested and falsified if it failed the test?
Hence one requires a religious belief to accept this notion as a fact.
And people seem to have forgotten how many FALSE statements and misrepresentations in this video have been identified.
Oh yes, I forgot to say, Bill…there’s a mistake at about 0:40 where he says the axial rotation is diametrically opposite to the orbital motion, when in fact the axial rotation is in the same direction as the orbital motion. Other than that, the video provides an accurate portrayal of the "Non-Spinner" position, showing clearly how the motions appear when axial rotation is kept separate from the correct concept of "orbital motion".
And many more errors and misrepresentations.
But one can find videos supporting all sorts of kooky beliefs, like free energy from water and a Flat Earth, etc.
The ability to find such videos that contradict 400 years of science does not prove that science wrong.
Oh well.
Meanwhile the truth of ones argument is easily discovered:
Can anyone point out how this hypothesis, of the MOTR consisting of two cancelling rotations, could be tested and falsified if it failed the test?
Thus far no one can.
Of course, Bill, nobody’s saying that the video proves the "Non-Spinners" correct, it just correctly shows the motions from the "Non-Spinner" perspective, should there somehow be people out there that still do not properly understand it. Which I’m getting the impression that there are, believe it or not…
And Flat Earther videos show the Flat Earther perspective…
…should there somehow be people out there that still do not properly understand it. Which I’m getting the impression that there are, believe it or not…
https://www.drroyspencer.com/2022/12/uah-global-temperature-update-for-november-2022-0-17-deg-c/#comment-1418725
Dr Roys Emergency Moderation Team says:
”Of course, Bill, nobodys saying that the video proves the “Non-Spinners” correct, it just correctly shows the motions from the “Non-Spinner” perspective, should there somehow be people out there that still do not properly understand it. Which Im getting the impression that there are, believe it or not”
I agree. One cannot explain the real world without making certain assumptions. Understanding of course that an explanation itself isn’t the real world. It is an imperfect symbolization of the world. Thus is the case of what a rotation is.
The only thing I am after is consistency and Nate and the spinners around here to a man are inconsistent. The primary inconsistency of Nate is he says yes there are rotations on external axes and then he goes and breaks the moons orbital angular momentum into a translation of a ‘point mass’ combined with a rotation of the moon on its own axis which Madhavi would call a general plane motion and be comprised of essentially two motions.
So yes that linear momentum calculation for the translation is equal to the difference between the angular momentum of the moon spinning on its axis alone in space and the angular momentum of a moon orbiting a planet. But just because its a good plug figure between the two situations doesn’t give a physical reality to the conceptual division of the orbital motion.
So the whole debate is over form (form of the equations) and physical reality (and object with dimensions rotating on an external axis).
Now if Nate could prove the existence of the moon as a point mass I would go yeah you are right Nate. But we know thats wrong and merely a mathematical figure to switch between two different motions. So Nate continues to elevate form over substance because that is what his daddy taught him.
OK so astronomers have decided to say yes the moon rotates on its own axis but they lack a logic for it and why its different than a rotation on an external axis held by scientists in other disciplines.
Which leads to inconsistency because a point mass cannot have an angular momentum on its own axis as ‘r’ always is equal to zero.
Conceptually its fine. But lots of things can be broken down conceptually. A ‘point mass’ is such a thing that has no physical analog in the real world.
I agree with you about spinner understanding. Its probably been more frequent than a daily occurence over the past year in here where a spinner has misrepresented the non-spinner position in an effort to make a point in favor of their point of view.
So if you want to believe in a rotation on an external axis as Nate claims he does. He should be able to give a better explanation than ”thats how my Daddy does it”
Now that kind of explanation around here for rotations on an external axis has indeed been a unicorn. Madhavi has a definition to distinguish that. Astronomers seem to have no flipping idea why they treat it that way.
Nate says:
”The ability to find such videos that contradict 400 years of science does not prove that science wrong.”
Depends upon how much you demand for proof.
At 3:58 of the video the MOTR is demonstrated with the moon being held tidal locked to the orbit (an analog of the force of gravity on an elongated moon) and then to make it look like the MOTR he must provide a force with his finger to rotate the moon on its own axis.
Now there is never negative proof. But this is a reasonable explanation for the motion of the MOTR being two motions.
Perhaps you could show us a demonstration where the guy doesn’t need to apply a force on the moon to rotate it against the force of gravity from the orbital motion. We will await your demonstration Nate.
Nice double accounting, Bill.
I hope you keep that kind of thing for your extracurricular activities.
Have you seen Tim’s confusion, Bill? He agrees that the movement of the MOTL can be described as “one motion”, he calls that motion “simple rotation”…but he has also said that there has to be rotation about an internal axis if there is rotation about an external axis! So that’s two motions, not one. The poor guy is so lost that he still thinks he’s in a position to “teach”!
“combined with a rotation of the moon on its own axis which Madhavi would call a general plane motion and be comprised of essentially two motions.”
So you see it is not just me saying these things. It is literally all of science and engineering that defines the MOTR motion as curvilinear translation.
There is no rotation present in the rigid body that is the MOTR.
Yet you claim there is.
The truth in your argument should be easy to demonstrate:
Can anyone point out how this hypothesis, of the MOTR consisting of two cancelling rotations, could be tested and falsified if it failed the test?
If you cannot, then your belief is not science. It is akin to religion.
I notice both you and DREMT have completely evaded this question. It is obvious that you have no answer.
“At 3:58 of the video the MOTR is demonstrated with the moon being held tidal locked to the orbit (an analog of the force of gravity on an elongated moon) and then to make it look like the MOTR he must provide a force with his finger to rotate the moon on its own axis.”
It is misguided to derive any truth about our Moon from the mechanical device in this terrible video.
Again, you forget that you have agreed that tidal locking of the Moon likely required millions of years. It is like the Moon is mounted on the arm, but also on a bearing with a miniscule amount of friction.
IOW the Moon is not rigidly held in alignment with the Earth as video portrays it. The fact of libration proves this true. That and the tilted rotational axis are inconvenient facts ignored by the video.
Nate says:
”So you see it is not just me saying these things. It is literally all of science and engineering that defines the MOTR motion as curvilinear translation.”
Thats possible but you haven’t show us an example of any licensed engineer to PhD scientist that explicitly makes the case and explains why he thinks that is the case and why it is different than a rotation on an external axis. Until you do you have provided zero support for your claim above.
Nate says:
”There is no rotation present in the rigid body that is the MOTR.
Yet you claim there is. The truth in your argument should be easy to demonstrate: Can anyone point out how this hypothesis, of the MOTR consisting of two cancelling rotations, could be tested and falsified if it failed the test? If you cannot, then your belief is not science. It is akin to religion.”
Of course you are talking about the appearance of a non-existent imaginary moon drawn and animated on paper being manipulated like a cartoon. I sure didn’t believe cartoons when I was a child. . . .do you still believe in them?
The video actually shows a real mechanical device and demonstrates how one can achieve the appearance of a non-rotating moon by using two rotations, one on an external axis and one counter-rotation on the moons axis.
The ball is in your court to find a video that does what you want it to do without 2 motions but has a rotation occuring on an external axis.
You can have no motions indeed.
But if you actually understood the non-spinner position regarding rotations on an external axis as having the particles of the object rotating on an external axis running in concentric ellipses and NOT swapping paths as the object moves 180 degrees around the object as defined by Madhavi leaves the non-spinner position actually explicitly supported by science. Yes there are astronauts that speak to your position but so far have not defined how such a motion is different from that described by Madhavi.
Scientists say translations don’t have angular momentum and indeed the translation formula used to calculating the angular momentum of a sphere rotating on an external axis doesn’t have an angular velocity term in the formula for Lorb. . . .such that Lorb is not an angular momentum.
Yet Lorb+Lspin is an angular momentum of a value far different that Lspin. So the MOTR has been mathematically reduced and able to be portrayed only as a non-mechanically induced motion employing cartoon (imaginary) technology that goes totally unexplained as a real motion. It instead simply relies upon a narrow minded view of the situation, of those who want translations to have angular momentum without having an angular velocity parameter.
So we will await the specifications of the mechanical means of acheiving your spinning and orbiting moon that doesn’t employ two motions.
Why would you need Nate to make you a an impossible burger, Bill?
The Moon has a complex motion. Even Graham agrees with that.
You do recall how Holy Madhavi characterizes complex motion, hopefully.
Willard says:
”Why would you need Nate to make you a an impossible burger, Bill?”
Sheeesh Willard I don’t need for Nate to do anything! Nate needs to make an impossible burger to have any defense for his claimed scientific position.
And you are certainly welcome to do so also if you feel the need to making any kind of case for same.
“Scientists say translations dont have angular momentum”
No. They don’t. Translation perpendicular to a radial distance R from a point has angular momentum around that point.
“Yet Lorb+Lspin is an angular momentum of a value far different that Lspin.”
And you see you are contradicting yourself a few lines later. It seems you will never wrap your mind around this physics.
“Thats possible but you havent show us an example of any licensed engineer to PhD scientist that explicitly makes the case”
Just stop forever moving the goal post.
Madhavi is a PhD. and teaches the course to Engineering students and explicitly makes the case. Others similar textbooks have been posted here. Feel free to find your own PhD engineering source that agrees with you.
We know you wont.
“Scientists say translations dont have angular momentum”
False. A translation of mass m, perpendicular to a radial vector r to a point, p will have angular momentum L = mvr around point p.
We have been over this many times. You seem unable to wrap your mind around it.
“and indeed the translation formula used to calculating the angular momentum of a sphere rotating on an external axis doesnt have an angular velocity term in the formula for Lorb. . . .such that Lorb is not an angular momentum.
Yet Lorb+Lspin is an angular momentum of a value far different that Lspin.”
This is just you contradicting yourself and being all confused.
“Yet Lorb+Lspin is an angular momentum of a value far different that Lspin. So the MOTR has been mathematically reduced and able to be portrayed only as a non-mechanically induced motion employing cartoon (imaginary) technology that goes totally unexplained as a real motion. It instead simply relies upon a narrow minded view of the situation, of those who want translations to have angular momentum without having an angular velocity parameter.”
Gobbledegook.
“So we will await the specifications of the mechanical means of acheiving your spinning and orbiting moon that doesnt employ two motions.”
This is nonsense, I have never said the MOTR is spinning and orbiting.
I await your test that could prove that the MOTR has a hidden rotation or falsify it.
Nate says:
So we will await the specifications of the mechanical means of acheiving your spinning and orbiting moon that doesnt employ two motions.
This is nonsense, I have never said the MOTR is spinning and orbiting.
I await your test that could prove that the MOTR has a hidden rotation or falsify it.
—————————–
Nate the moon that you claim is both spinning and orbiting is the MOTL!!
So we are awaiting your demonstration of the MOTL employing two motions. 1)orbital motion, plus 2)spinning motion.
Concentrate man you are totally confused. But its obvious you are confusing yourself and can’t produce the demonstration.
to aid you Nate in your confusion.
The MOTR was demonstrated to be 2 motions in the video of the mechanical model by DREMT above. If you want to try to demonstrate that as a single motion that would be nice also.
“So we will await the specifications of the mechanical means of acheiving your spinning and orbiting moon that doesnt employ two motions.”
You are asking me to explain something I have never claimed about the MOTL or the MOTR!
Read your own damn question, Bill, and figure out what is wrong with it.
Meanwhile, you are still evading my question.
“I await your test that could prove that the MOTR has a hidden rotation or falsify it.”
As yourself why you are evading?
Yourself will tell you that you have no sensible answer.
And yet you soldier on insisting that there IS a hidden rotation, that can never be detected or falsified.
Now explain to us how that is science and not religion.
The video reminds me of my grandfather clock. When I look around back I see there are dozens of mechanical motions involved in producing the one rotation that simply describes the motion of the minute hand on the front.
You could claim there are two hidden rotations in the MOTR which kinematics describes as simply curvilinear translation. Someone else could claim there are 12 hidden motions involved.
For the MOTR, unlike for my grandfather clock, these claims are not testable by science.
its only not testable by science because you haven’t yet figured out how to build a testable device that could produce the MOTR with less tha two motions. we have tested the theory it can work with 2 motions as DREMT provided the video of that demonstration. i will choose to go with that until you can show me how it can be done with one motion.
“out how to build a testable device that could produce the MOTR with less tha two motions.”
Your arguments are becoming increasingly absurd.
This is a MOTION of a body in orbit, not a device.
That MOTION is observable, and it is observed to have no rotation, only translation.
You guys claim, without a shred of evidence, that it has two hidden rotations because that would fit your feelings about what you think the Moon should be doing. But these are not observable. Not testable. Not science. Just your feelings.
To represent planetary orbits, which are in general elliptical, as a rotation, which is circular, would be needlessly complex, and this is why Astronomy DOES NOT DO THIS.
To represent the Moon’s elliptical orbit and its spin on a tilted axis, as a singular rotation around a single external axis MAKES NO SENSE!
And thus Astronomy DOES NOT DO THIS.
Oh well. Find a new issue.
Nate says:
”out how to build a testable device that could produce the MOTR with less tha two motions. Your arguments are becoming increasingly absurd. This is a MOTION of a body in orbit, not a device.”
——————-
Your argument is collapsing. DREMT produced a video of a mechanical device showing ways the MOTR could be replicated. Yes it is a device but physics is about mechanics. . . .you know real and not imaginary physics?
And you come up with the weak reply above. ROTFLMAO!
————————–
Nate says:
That MOTION is observable, and it is observed to have no rotation, only translation.
You guys claim, without a shred of evidence, that it has two hidden rotations because that would fit your feelings about what you think the Moon should be doing. But these are not observable. Not testable. Not science. Just your feelings.
————————-
Our point of view has nothing whatsoever to do with feelings. We realize that science cannot prove non-existence of a mechanical process to produce the MOTR. But you believe in it without a mechanical demonstration of how it works with real dynamics and then adhere to it as proof when you say nothing can be proved. . . .here: https://www.drroyspencer.com/2022/12/climate-sensitivity-from-1970-2021-warming-estimates/#comment-1420560
So your post here and there does prove you are a lying troll.
Nate says:
”To represent planetary orbits, which are in general elliptical, as a rotation, which is circular, would be needlessly complex, and this is why Astronomy DOES NOT DO THIS.”
You could have said that a year ago when I said astronomy does it for convenience not because of fact. If ‘science’ did it as fact they would have a paper supporting your position. Instead they simply do it without explanation for the reason you just admitted to.
Nate:
”To represent the Moons elliptical orbit and its spin on a tilted axis, as a singular rotation around a single external axis MAKES NO SENSE! And thus Astronomy DOES NOT DO THIS. Oh well. Find a new issue.”
The discussion wasn’t about what astronomy did for convenience Nate. The discussion is about how objects can rotate around external axes without spinning on their own axis and it will be a rotation that will appear to be a rotation from distant star. The fact the moon as part of a larger solar system and galaxy has some influences from that as well doesn’t detract from the fact you have now admitted to. I have said many many times arguing this point was silly. But it started out with you guys insulting the genius Tesla on the matter which got me started.
Bill, indeed your intuitive feelings are not science, and you havent made the case that they have any use. Astronomy will never ever substitute your intuitions for the science developed over the last 400 y that works well.
Its like you are saying violin makers have been doing it wrong all this time, but for convenience, they won’t listen to me and change!
Its not because of convenience that Astronomy represents planetary motion the way they do. The current approach developed over centuries because it was both useful and PHYSICALLY motivated.
For example, Newton SOLVED his physics laws to find the equations for orbital PATH in 1680. He worked it out for a POINT MASS first, which has NO ORIENTATION or ROTATION possible!
http://www.mnealon.eosc.edu/NewtonianMechanics.htm
And yet, his solution worked for the orbits of planets because, as he proved, the COM of spheres reacts to gravity the same way as a point mass. The rotation of these planets does not impact the orbit and can be treated as an independent parameter.
“But it started out with you guys insulting the genius Tesla on the matter which got me started.”
Not at all, just pointing out flaws in his arguments and failure to account for astronomical facts. Doesn’t detract at all from his accomplishments in electronics.
I hope you are not suggesting that because he is an accomplished inventor, and authority figure, he must be infallible!
As people from your Team have noted:
“Science is not about authority figures and accepting their proselytizing, it is about thinking for oneself and proving a point. “
Nate says:
Bill, indeed your intuitive feelings are not science, and you havent made the case that they have any use. Astronomy will never ever substitute your intuitions for the science developed over the last 400 y that works well.
Its like you are saying violin makers have been doing it wrong all this time, but for convenience, they wont listen to me and change!
————————————
I don’t recall anybody saying astronomers were ‘doing’ anything wrong beyond some who pontificate about the underlying nature of something that has nothing to do with what they are ‘doing’.
The same could be said of climate scientists pontificating about the nature of climate for which they are doing nothing but complaining and wishing somebody else would fix a problem that hasn’t been established to even exist.
Nate says:
”But it started out with you guys insulting the genius Tesla on the matter which got me started.”
Not at all, just pointing out flaws in his arguments and failure to account for astronomical facts. Doesnt detract at all from his accomplishments in electronics.
—————————
You claim to have pointed out a flaw but you just conceded it isn’t a flaw unless of course you pointed out another flaw in a post I didn’t see. But feel free to say what flaw(s) you pointed out and how you established you were correct.
“You claim to have pointed out a flaw but you just conceded it isnt a flaw”
Nope. Now you are just trolling and baiting..
“some who pontificate about the underlying nature of something”
Exactly what you guys are doing with your two unobservable cancelling rotations!
Yes, math involves proofs, science usually not.
But science is still empirical. It still involves experiment/observation to test theory.
Both things can be true.
So you can have a theory of planetary motion that says the MOTR is two cancelling rotations. But if you cannot propose a test for this theory, then its not science.
Nate says:
”So you can have a theory of planetary motion that says the MOTR is two cancelling rotations. But if you cannot propose a test for this theory, then its not science.”
one can propose a simple logic test.
If all the conditions (e.g. gravity and linear momentum) is present to produce a rotation and a rotation is not apparent. It must be because of the presence of another physical condition.
We can see this to be true for all non-tidal locked moons appearing to possess rotations independent of their orbital rotation and this is commonly accepted as an explanation.
It is logical that such a rotation could make a moon with a second rotation on its internal axis that was in perfect time with the orbit could make that moon look like it is neither rotating on an external axis (as defined in kinematics of having its particle moving concentrically as opposed to in parallel) nor rotating on its internal axis.
However sighting such a moon would be an incredibly rare event since both speed of the rotation and direction of the rotation would need to match up to the orbital rotation over extraordinarily long periods of time to match the centuries that our moon has been observed.
So really the only question left is why spinners are so susceptible to suggestion by authority that they actually believe what they have been told without having received a single shred of evidence when simple kiss logic so strongly suggests otherwise.
It is amazing indeed how gullible you are. i suspect it must be a loyalty exam question or something like a secret response for club members to identify each other.
“If all the conditions (e.g. gravity and linear momentum) is present to produce a rotation and a rotation is not apparent. It must be because of the presence of another physical condition.”
What physical conditions are those?
The planets have gravity and linear momentum and orbits that match Newtons predictions. And they have independent spin. No other physical conditions are needed to have these properties.
“So really the only question left is why spinners are so susceptible to suggestion by authority that they actually believe what they have been told without having received a single shred of evidence when simple kiss logic so strongly suggests otherwise.”
Any engineer knows what a rotation is. Ask an engineer to use a rotation to predict the Moon’s position and orientation exactly 1 week from now. They could divide 1 week by the orbital period and multiply that fraction by 360 degrees to find the rotation angle. They could apply a rotation by this angle around the barycenter to the Moon’s current position and orientation.
But they will predict a position and orientation of the Moon that will be VERY far off the mark!
Why? Because the Moon has an elliptical orbit. Its distance from the barycenter varies, its orientation changes at a different (constant) rate than its (variable) orbital rate. And the Moon axial tilt. Its orientation changes uniformly around a different axis than the orbital axis.
The observed motion of the Moon is a very poor match to a ROTATION model. KISS says ROTATION is the wrong model!
The only question is why non-spinners are so susceptible to the suggestion that a Rotation is a good model for the Moon’s motion, without having received a single shred of evidence?
Nate says:
All this time you have been claiming it is TWO cancelling rotations that produce zero net.
Now you suddenly are claiming to observe it rotating?!
——————————-
Of course I am Nate I am observing it rotating around an external axis! What are you observing?
Nate denies that the moon rotates around the earth!
As I said, any engineer knows what a rotation is. But apparently not you.
Define rotation, as you see it.
Nate does deny that the moon rotates around the earth.
This would be your opportunity to support your assertion by defining ‘rotation’. So go ahead.
What does my definition of rotation have to do with your denial that that the moon rotates around the earth.
You haven’t given us your definition of a rotation. We have given you dozens of sourced definitions of rotations and you simply reject them all without providing a single definition of your own sourced or unsourced.
Bottom line:
Nate denies that the moon rotates around the earth!
So why you would expect anyone to believe your classification of an orbit as a ROTATION, a word that you are completely unable to define?
With no alternative definition of rotation forthcoming from you or DREMT, we’ll simply have to go with the standard one, again as stated by Madhavi:
“Rotation about a Fixed Axis. In this motion, the particles forming the rigid body move in parallel
planes along circles centered on the same fixed axis.”
and
“the plate shown in Fig 2(b) is in rotation, with all its particles moving along concentric circles.”
The MOTR clearly does not satisfy this definition. It cannot be a ROTATION.
Madhavi also states
“the plate shown in Fig 2(a) is in CURVILINEAR TRANSLATION, with all its particles moving along parallel circles”
The particles in the MOTR are doing exactly that, for example a point on the top of the Moon is moving around a circle centered on the upper part of the Earth, while a point on the bottom of the moon is moving around a point on the lower part of the Earth. The two circles are PARALLEL but displaced by 1 Moon diameter.
The MOTR clearly does satisfy the definition of CURVILINEAR TRANSLATION.
Lets hope that this puts this claim to rest.
And just so nobody gets confused:
https://www.drroyspencer.com/2022/12/uah-global-temperature-update-for-november-2022-0-17-deg-c/#comment-1422455
You were specifically talking about the MOTR being a ROTATION.
“My observation is the moon on the right is rotating around the earth. You are trying to classify it as a lineal motion without any angular velocity which it clearly has. You need to apply Feynmans test to your observation.”
Nate says:
”the plate shown in Fig 2(a) is in CURVILINEAR TRANSLATION, with all its particles moving along parallel circles”
The particles in the MOTR are doing exactly that, for example a point on the top of the Moon is moving around a circle centered on the upper part of the Earth, while a point on the bottom of the moon is moving around a point on the lower part of the Earth. The two circles are PARALLEL but displaced by 1 Moon diameter.
The MOTR clearly does satisfy the definition of CURVILINEAR TRANSLATION.
Lets hope that this puts this claim to rest.
——————————
You are demanding perfection in that the moon is influenced by multiple celestial bodies that it is rotating around in addition to its rotation around the earth.
What you fail to consider here is the axial and orbital precessions of the moon places the mean path of the bottom and top on the same line over time. . . .like a gyroscope. So on average the paths are not parallel.
If perfection is your standard then you rule out all rotations on external axes.
Of course I have pointed this out to you previously and you continue to ignore it.
“You are demanding perfection”
Hee haw!
A perfectly flimsy excuse for your loss on this argument, Bill.
The MOTR is PLAINLY not changing its orientation, and thus plainly not rotating.
Nate says:
”Hee haw!
A perfectly flimsy excuse for your loss on this argument, Bill.”
So you are going to try to claim you won the argument while forfeiting and foregoing even making an argument?
Pitiful!
I agree that the MOTR could be considered to be curvilinear motion.
I also realize that defining motion is generally done without references to forces.
However, engineers like to look a little deeper into any such matters and are never satisfied in just being inculcated by their Daddy without reasons.
This is especially true for licensed engineers working on engineering contracts as having a stupid teacher is never an adequate excuse for failure.
Academics never have such pressures and many are simply satisfied with being inculcated without any deeper understanding.
Certainly the MOTR being a designed as a graphic on a computer it isn’t possible to look deeper because it is only a symbolic motion.
However, if you understand the MOTR to be a celestial object subject to gravity an engineer would determine it was an orbital rotation around an external axis and would eventually become a MOTL via the forces of gravity. Some astronomers do also.
Thus to get to the motl, gravity would have to either bring an existing rotation to an end or take a moon with zero rotation and bring it into full rotation whereby it would become the MOTL.
However if one takes the engineering of this down to very small movements for a moon with zero beginning rotation; one would realize that an object entering orbit actually doesn’t have a final orbit until it is the MOTL.
So like DREMT I see how all this could be viewed in multiple ways.
However, if one is going to recognize rotations on external axes they by demand need to be imperfect as nothing in this world is perfect so perfection of the orbit (i.e. lacking any disturbance of any nature) can’t be a condition for a rotation in the real world, only in the imaginary academic sense could rotations exist.
Further all we can do is educate you that yes engineers and some astronomers at least recognize an orbit as a rotation on an external axis.
It seems we are done here..
maguff…”The orientation of this orbit remained fixed in space, relative to the stars, while the Moon slowly spins on its axis beneath it as they travel together around the Earth, allowing LRO to scan the entire surface of the Moon every two weeks”.
***
Duh!!!
Is the LRO orbiting the Moon or not? Obviously it is. Is the LRO using lunar co-ordinates to orient itself. No. The LRO uses a gyro to orient it to the stars. Therefore its motion is independent of the Moon’s motion.
So, the LRO orients itself in space and it is orbiting the Moon, which keeps the same face pointed at Earth. Therefore the Moon is not rotating about a local axis, it is performing curvilinear translation.
NASA is thoroughly confused about this and I realize my critique of them falls on deaf ears simple because they represent an authority figure. However, the other day I posted a quote for a NASA engineer on Newton II. He claimed acceleration cause the force in f = ma.
That is absolute rubbish and the thinking is a product of the new physics based on Einsteinian relativity bs. A force is required to accelerate a mass, end of story, even if a NASA engineer thinks otherwise.
NASA engineers are also thoroughly confused about lunar motion. They cannot figure out that a body, like the Moon, orbiting the Earth, while keeping the same face pointed at the Earth, is performing curvilinear translation WITHOUT rotation about a local axis.
The Moon is not rotating below the LRO, it is simply re-orienting wrt the stars. NASA admitted that to me but they failed to grasp my point that a body not rotating about a local axis can suddenly begin rotating when viewed from a different reference frame.
wrt the LRO, since it is oriented independently to the stars, it sees the same view of the Moon as the stars. That means, as the Moon re-orients, the LRO sees it as rotating on a local axis, and it is not.
> So, the LRO orients itself in space and it is orbiting the Moon, which keeps the same face pointed at Earth.
🤦
To hear me talk about the LRO, one might think I was skeptical about it. Not so. I think it’s very clever how they use gyros to orient it wrt the stars rather than to an inertial system based on the Moon.
“…rather than to an inertial system based on the Moon.”
The Moon is not an inertial reference frame.
MOTR is an inertial reference frame. MOTL is not.
Both the MOTL and the MOTR are presented wrt the exact same reference frame.
The MOTL rotates compared to the image frame, the MOTR does not.
What you said at 8:02 AM was wrong, what I said at 8:12 AM was right.
Gordon Robertson at 4:38 PM
LRO orbits the Moon in a polar orbit the orientation of which is fixed wrt the stars. That’s not so hard to understand is it?
Becasue its orbit is fixed, and the Moon rotates beneath it, it’s able to scan the entire surface of the Moon every two weeks.
This is not a secret mission either. You can follow the orbiter in near real-time by going to the tracker’s website… http://lroc.sese.asu.edu/about/whereislro
“That’s not so hard to understand is it?”
…and everybody does.
“Becasue its orbit is fixed, and the Moon rotates beneath it, it’s able to scan the entire surface of the Moon every two weeks.”
Because its orbit is fixed, and the moon changes its orientation due to its “orbital motion” beneath it, it’s able to scan the entire surface of the moon every two weeks.
Gaslighting Graham gently gaslights a little more.
Little Willy, please stop trolling.
maguff…”Becasue its orbit is fixed, and the Moon rotates beneath it, its able to scan the entire surface of the Moon every two weeks”.
***
The Moon does not have to rotate under the LRO, all it has to do is change orientation wrt the stars to which the LRO is fixed. Curvilinear translation will accomplish that nicely.
Come on, Gordo.
The LRO does a polar orbit.
Think.
Little Willy, please stop trolling.
Earlier, Nate the Nutter tried to associate Professor John Tyndall with a “Greenhouse Effect” which Tyndall never mentioned.
Tyndall, quite correctly, surmised that the Earth’s atmosphere keeps the surface from getting as hot as the airless Moon, and conversely, prevents the surface from becoming as cold as the Moon.
Tyndall mentions “thus wrapping the earth like a warm garment, and protecting its surface from the deadly chill which it would otherwise sustain.”
Not even a “warm garment” necessary – Tyndall realised that insulators work in both directions, unlike SkyDragon nutters like Nate, and insulators do not create heat – merely impede its rate of transmission.
Tyndall likewise accepted that the Earth had cooled from a molten state, and disagreed with Lord Kelvin’s estimate of the rate of cooling, and hence its extrapolated age, on the basis of geologic evidence.
Neither Tyndall nor Kelvin were aware of radioactivity, nor of radiogenic heat.
Nate the nitwit is probably aware of both, but still rejects the reality that the Earth has cooled since it was molten, and that nobody has described the GHE in any way that reflects reality.
Tyndall was also unaware of the SkyDragon cult, and its aims of world domination. Otherwise, when he wrote –
“This is the society that now strives for universal power; it is from it, as Monsignor Capel graciously informs us, that we are to learn what is allowable in science and what is not!” – he could have been describing the ravings of the GHE true believers!
For “Monsignor Capel”, substitute the nearest SkyDragon cultist bleating “The Science is settled!”.
Nitwits like Nate will just keep rejecting reality, just like Monsignor Capel in Tyndall’s time.
swenson…”Tyndall mentions thus wrapping the earth like a warm garment, and protecting its surface from the deadly chill which it would otherwise sustain.”
***
Mind you, it doesn’t hurt that the Sun shines every day. Without solar input, the insulating effect of the atmosphere wouldn’t do much good.
swenson…”This is the society that now strives for universal power; it is from it, as Monsignor Capel graciously informs us, that we are to learn what is allowable in science and what is not! he could have been describing the ravings of the GHE true believers!”
***
Or the so-called Holy Inquisition.
Troll Swenson tries to undo Tyndalls thorough debunking of his ‘magic insulators’.
Of course he does that far away from my post and doesn’t bother to quote Tyndall or me.
This allows him to misrepresent freely, both Tyndall and me.
”
Not even a warm garment necessary Tyndall realised that insulators work in both directions, unlike SkyDragon nutters like Nate, and insulators do not create heat merely impede its rate of transmission.”
So let’s quote Tyndall and compare to Swensons spin of it.
“But the aqueous vapour takes up the motion of the ethereal waves, and becomes thereby heated, thus wrapping the earth like a warm garment, and protecting its surface from the deadly chill which it would otherwise sustain.
BTW, he showed same for CO2 molecules.
He continued:
It might however be urged that, inasmuch as we derive all our heat from the sun, the selfsame covering which protects the earth from chill must also shut out the solar radiation. This is partially true, but only partially; the suns rays are different in quality from the earths rays, and it does not at all follow that the substance which absorbs the one must necessarily absorb the other. Through a layer of water, for example, one tenth of an inch in thickness, the suns rays are transmitted with comparative freedom; but through a layer half this thickness, as Melloni has proved, no single ray from the warmed earth could pass. In like manner, the suns rays pass with comparative freedom through the aqueous vapour of the air: the absorbing power of this substance being mainly exerted upon the heat that endeavours to escape from the earth. In consequence of this differential action upon solar and terrestrial heat, the mean temperature of our planet is higher than is due to its distance from the sun.
Clearly Swenson missed a lot!
Tyndall clearly explains the GHE principle that Swenson so often demands.
But for a troll like Swenson, facts like these must be distorted and denied.
Here we all can see how poster Christos Vournas changed his mind wrt Moon’s rotational spin.
*
1. On May 5, 2022 at 11:59 AM
he posted the following comment:
https://www.drroyspencer.com/2022/05/uah-global-temperature-update-for-april-2022-0-26-deg-c/#comment-1271066
which starts as follows:
” N = 1 rotation /per day, is Earths sidereal rotation spin
cp.earth = 1 cal/gr*oC, it is because Earth has a vast ocean. Generally speaking almost the whole Earths surface is wet.
Earth is on average warmer than Moon not only because of the Earth having 29,53 times faster rotational spin.
Earth also has a five (5) times higher average surface specific heat (for Earth cp.earth = 1 cal/gr*oC, it is because Earth has a vast ocean; and for Moon cp.moon = 0,19cal/gr*oC its soil is a dry regolith).
Earth is warmer than Moon not because of Earths very thin atmosphere trace greenhouse gasses content. Earth is warmer because its surface has 155,42 times higher the (N*cp) product than Moons surface.
Earth(N*cp) /Moon(N*cp) = (29,53/1)*(1/0,19) = 155,42 ”
[ Vournas uses the Roman comma instead of the English period to denote the decimal point. ]
Thus when Vournas claims that Earth’s rotational spin is 29.3 times faster than Moon’s, we can admit that Moon has, according to Vournas, a rotational spin – at least until May 5, 2022 at 11:59 AM!
Because if, at the moment he posted his comment, he would have been convinced that the Moon does not spin about its axis, he then very certainly would not have written what he wrote above.
Right?
*
2. On December 18, 2022 at 9:22 AM
he posted the following comment:
https://www.drroyspencer.com/2022/12/uah-global-temperature-update-for-november-2022-0-17-deg-c/#comment-1412495
with as contents:
” Our Moon does not rotate about its axis.
No moon in solar system rotates about its own axis. They all have stopped rotating long time ago, and now none of them rotates anymore.
They were rotating once upon a time, yes, but after a long period of rotating they stopped rotating about their own axis. ”
**
This is simply dishonest and unscientific.
And it is simply impossible to discuss with dishonest and unscientific persons.
Bin, you just don’t get it. This is so far over your head that it would take years for you to understand it. You should stop your trolling nonsense and just try to learn here. Ask responsible questions, as necessary, and try to move away from you invalid beliefs.
When someone is talking about day/night on Moon, they are referring to its ORBIT. Moon’s orbit is what produces its day/night. Moon is NOT rotating on its axis. The ball-on-a-string reveals that. But, you reject that simple analogy. If you were more than just a braindead cult idiot, you would realize you have no model of “orbital motion without axial rotation”. You have NOTHING. You rely on misinterpretations of Newton.
Your false beliefs are like a house of cards, collapsing all around you. And, instead of facing reality, you lash out at those that understand science. That’s the exact behavior of a cult. A cult attacks those that don’t share their cult beliefs.
Your cult can’t handle reality. Just look at the last couple of days — barry is trying to re-define “walking”; Nate is trying to claim a microwave oven is “proof” that “cold” can warm “hot”; Fraudkerts is trying to invent a swivel chair that doesn’t swivel!
Your cult is in a mess. Reality always wins.
I repeat Vournas’ sentence for the dumb Clint R:
” Earth is on average warmer than Moon not only because of the Earth having 29,53 times faster rotational spin. ”
Even for a guy as Clint R, it should be evident that
– if Vournas had meant Earth’s and Moon’s orbit, he wouldn’t have mentioned ‘spin’, but ‘orbit’ instead;
– mentioning the ‘orbit’ instead of the ‘spin’ would have been 100 % nonsense in Vournas’ post because the orbits don’t play any semantic role.
But Clint R doesn’t look at such tiny details.
Bin, this has been explained to you before. Moon’s synodic day is 29.53 Earth days.
If you didn’t understand that, CV made it even clearer: Our Moon does not rotate about its axis.
You didn’t get it then. You don’t get it now. And, you won’t get it in the future. You’re braindead.
Our Moon rotates about its axis, once per orbit of the Earth.
Polly want a cracker?
Only people who think that the Moon does not rotate about its axis once per orbit of the Earth are crackers.
rlh…”Our Moon rotates about its axis, once per orbit of the Earth”.
***
Still awaiting your proof, Richard, as to how the Moon manages to rotate on a local axis while keeping the same side pointed at Earth. Surely the logic that helped you get a Master’s degree could help you work that one out.
As the Moon rotates once on its axis per orbit of the Earth, it keeps the same side of the Moon towards the Earth and a continuously different face towards the fixed stars.
Once more, I repeat Vournas’ sentence for the troll Clint R:
” Earth is on average warmer than Moon not only because of the Earth having 29,53 times faster ROTATIONAL SPIN. ”
If Vournas had meant Moon’s orbit, he VERY CERTAINLY would not have written ROTATIONAL SPIN, but ORBITING.
And I repeat: only the difference in ROTATIONAL SPIN makes sense in Vournas’ temperature calculations. The difference in ORBITING SPEED is for Vournas irrelevant.
Do you get it now? NO?
Then go to
https://www.cristos-vournas.com/
and look at the comparisons between
– Earth and Moon
– Earth and Mars
– Earth and Jupiter’s moon Europa
Do you see there any reference to ‘orbiting’ ?
Why should Vournas be talking about Earth’s, Mars’ or Europa’s rotational spin, but suddenly about Moon’s orbiting?
*
Similarly, why should Newton, when he writes in his Principia
” Jupiter certainly revolves with respect to the fixed points in 9.56 hours, Mars in 24.39 hours. Venus in about 23 hours, the Earth in 23.56 hours, the Sun in 25 1/2 days, and the Moon in 27 days, 7 hours 43′. ”
speak about the rotation periods for Jupiter, Mars, Venus, Earth, the Sun – but suddenly speak about Moon’s orbiting period?
*
Something else to say than ‘You have NOTHING’ ???
Bin, you resort to incoherent rambling because you’ve got NOTHING.
Keep it SIMPLE, stupid. The simple model of “orbital motion without axial rotation” indicates Moon is NOT rotating on its axis.
Easy peasy….
binny…” Earth is on average warmer than Moon not only because of the Earth having 29,53 times faster ROTATIONAL SPIN.
***
Duh!!! We know the Earth has a rotational spin.
GRAND SOLAR MINIMUM UPDATE
https://www.cbsnews.com/news/severe-storms-south-tornadoes-hail/
“To determine exactly the position of the moons axis to the fixed stars, and the variation of this position, is a problem worthy of an astronomer”. – Sir Isaac Newton.
Beyond Sir Isaac at the time. The supposed “axis of rotation” of the moon was indeed a problem worthy of an astronomer!
For example –
“Presently, the lunar spin pole and orbit pole co-precess about the ecliptic pole, in a stable situation known as a Cassini state.” – 2007.
However, the “spin pole” does not mean that the Moon is presently spinning around it! Even the present obliquity of the nominal “spin pole” may not been the same in the past. All a bit complicated, and research indicates that the Moon’s composition is not homogenous, and a still-molten core is rotating with respect to the mantle. It seems that the core itself is irregular in shape and density, but nobody knows for sure.
An exact model for the Moon’s physical motions? Good luck with that! About as easy as modelling the chaotic movements of the Earth’s atmosphere.
” An exact model for the Moons physical motions? ”
*
Oh, look!
Flynnson is doing his very best to help these poor lunar spin deniers save face…
Nice.
So, according to the 5 o’clock tea genius Flynnson, the fact that astronomer Mayer in 1750, and today’s astronomers got almost identical results (0.000006 day difference) for the lunar rotation period, and this despite
– completely different observation instruments
and
– completely different methods for processing observational data
is a non-sequitur based on sheer coincidence.
*
Well done, genius Flynnson!
You are absolutely unbeatable at throwing sand in our eyes.
binny…”Mayer in 1750, and todays astronomers got almost identical results (0.000006 day difference) for the lunar rotation period”
***
I am still waiting for your reference where Meyer states that.
And I am still waiting for you to accept the bet, Gordo.
Also, Mayer.
M-a-y-e-r.
” I am still waiting for your reference where Meyer states that. ”
*
This is now the definite proof that you forget everything – except of course the trash you pick out of contrarian blogs, or out of your egomaniac, unscientific thoughts.
I posted references to Mayer’s text numerous times, Robertson.
Here is a snapshot out of page 168
https://drive.google.com/file/d/1Lf5eVBfj1gDUiw3gXd8f8jF1cTsOuwxl/view
of his treatise
https://www.e-rara.ch/download/pdf/913790?name=IV%20Abhandlung%20%C3%BCber%20die%20Umw%C3%A4lzung%20des%20Monds%20um%20seine%20Axe%20und%20die%20scheinbare%20Beweg
you never were able to accurately translate anything of, and claimed lots of tremendous nonsense instead, like in e.g.
” BTW … if you read through Binny’s authority figure Meyer, the latter talks about a centrifugal force acting on the Moon. That’s when I dismissed him as a serious physicist. ”
Mayer of course never talked about that; he proved Moon’s sufficient sphericity by using Newton’s differential equations for gravity!
*
In the snapshot we can read and translate his very last correction to Moon’s rotation period (the Vernal Point is not fixed, moving at 50 arcsec/yr), giving as final result
27 days, 7 hours, 43 minutes, 11 seconds, 49 sixtieths of a second
giving, in decimal day form
27.321655 days
Most recent value for Moon’s rotation period (calculated by independent sources using Lunar Laser Ranging):
27.321661 days
Difference:
0.000006 days or 0.52 seconds
*
But I’m losing precious time here, as you will never be able to refrain from your mix of arrogance and ignorance, and hence again will reject and discredit all that, exactly like you persistently distort what Newton wrote concerning the Moon in Book III Prop XVII Th. XV.
“However, the ‘spin pole’ does not mean that the Moon is presently spinning around it!”
Oh you mean the one motion that DEFINES a spin pole, and tells us where its located, is not happening??!!
That would be quite a feat!
It is evident that for lunar spin deniers, LRO can’t give a proof of that spin.
Simply because they guess that despite LRO’s fixed orientation to the very same point in space, the images it captures from Moon’s surface do not show a rotating celestial body, but simply one ‘changing its orientation’. Yeah.
This was the reason why I sent in July a mail to the JWST team, asking them for the possibility to observe a fixed point on the Moon (for example, crater Mösting A, or one of the retroreflectors, which have been observed by numerous astronomers, leading to a more and more accurate computation of Moon’s forced and free physical librations).
Since JWST itself is in the vicinity of Earth’s L2, hence at a point in space fixed to 99.99999 % wrt the Moon’s orbit, it should then have been possible for the telescope to follow these points on Moon, and hence to provide us with data allowing a mathematician to exactly compute whether or the followed points are rotating while orbiting.
Unfortunately, the JWST team replied with
” Hello, our Moon is too bright for us to observe! ”
I then answered with
” I understand what you mean.
But then… if there was really a bit of idle time for this celestial
body spin affair: what about Pluto and Charon?
They are in final synchronous rotation, what would make the proof of
Charon’s spin even more interesting than our Moon’s. ”
*
Who knows? Maybe the team finally finds some idle time:
https://www.space.com/james-webb-space-telescope-kuiper-belt-objects
” The mysterious Kuiper Belt, home to former planet Pluto and its moon Charon, will be a subject of study for the powerful observatory. ”
*
Wait and see.
But to be honest, I have no doubt that this blog’s lunar spin deniers will find some way to again distort reality, and to continue their denial story :- )
Bin, keep grasping at straws.
After failing with the JWST team, the next step he will be trying to contact extraterrestrials to back him up in his chatroom circular ass debate troll fight.
👽👽👽👽
… says the coward babbling Edog, who is himself this blog’s worst circular ass debate troll.
rlh…”How come the Sun sees all sides of the Moon, but the Earth only one? Are they not 2 sperate and independent reference frames?”
***
If you view a car doing laps on a track, and you view the car from inside the track, you will see only one side of the car. If you move to the grandstand, outside the track, you will see all sides of the car.
The heck with reference frames, they are useless to the average viewer.
So changing reference frames changes what is seen then.
We’re still in the same reference frame just changing out view angle.
Wrong. At the center, a fixed view angle (depending of size) will only see 1 part of the Moon’s surface. In order to see all of it, you need always to face it, i.e. rotate. That is not the same reference frame at all, as one is fixed and one is in motion/rotation.
maguff…”…when viewed from the Moon, the Earth will always remain in about the same spot in the sky, it will not move across the sky”.
***
Well, yeah. The Earth is located nearly at the mid-point of a near-circular orbit. However, as the Moon orbits, the background stars will change.
Note, however, that the Earth will appear to rotate every 24 hours, because it does. From Earth, the Moon does not appear to rotate at all, because it doesn’t.
That’s a non sequitur if I ever saw one.
You still have not provided any evidence in support of your non-spinner thesis.
Because there is no evidence supporting your position you keep recycling opinions, feelings, value judgments, and beliefs.
It’s pure entertainment at this point.
Note that the night sky as viewed from Earth changes almost every night by a degree or two. That’s because the Earth is orbiting the Sun and the view angle changes yearly with orbital position and daily with rotation.
I am too tired tonight to work out what the Moon would see of the stars if it rotated or did not rotate. Maybe someone else is fitter and more ambitious.
https://www.quora.com/On-the-moon-which-star-is-the-pole-star-The-moons-axis-is-not-aligned-with-Earths-so-north-is-a-different-direction-there/answer/Lucas-Curtis?ch=10&oid=361821502&share=863a3dd1&srid=ueivfz&target_type=answer
TM, like the rest of your cult you just keep throwing crap against the wall, hoping something will stick. You understand NOTHING of what you’re doing.
For example, could you describe the change in angle of the bogus Moon axis on the opposite side of Moon’s orbit?
No, you wouldn’t have a clue.
I love Elon. “The ones who want power least deserve it.” This quote perfectly describes the leftist Climate Cult.
Elon? …Boooooooooooooooooo!
[ALSO ELON] I am the Chief Twit.
As always, I anticipate that the genial troll Clint R will reject reality.
Reality is that the inclination of Moon’s polar axis with respect to both the lunar and the terrestrial ecliptic (the planes encompassing their respective orbits) keep fixed – when we talk about short time periods like e.g. 10,000 years.
This axis’ inclination, however seems to have changed over very long periods (say some 100,000,000 years); this probably was due to changes within Moon’s interior mass distribution, themselves possibly originating from the gravitational torque exerted on the Moon by Earth and Sun.
Clint R very certainly will start a research project about all that.
Sorry Bin, but that’s all WRONG.
Moon’s bogus “rotational axis” changes drastically every two weeks! (That’s one of the reasons we know Moon is NOT rotating.)
And gravity can NOT produce a torque on Moon.
This is all WAY over your head, so don’t even try to understand.
” Sorry Bin, but thats all WRONG.
Moons bogus rotational axis changes drastically every two weeks! ”
Yeah.
Show us that, troll Clint R, instead of claiming without any valuable proof.
*
The inclination of the lunar spin axis has been computed since centuries, but you reject all that without being even able to scientifically explain why.
That is like trying to explain that Earth is flat or was created some 6,000 years ago or so despite all hints showing different.
The inclination of the lunar spin axis has been WRONG for centuries, Bin.
But this gives us a good opportunity for you to show your expertise on the issue. What is the change in angle of the imaginary spin axis, based on the angles give by your cult, between the high and low points of Moon’s orbit?
You can’t answer, because you’re a complete phony with NO knowledge of the subject. Prove me wrong — give us the answer.
Or, don’t comment here for 60 days and I will give you the answer.
Your choice. Either way, it’s “put up or shut up” time.
” The inclination of the lunar spin axis has been WRONG for centuries, Bin. ”
You are babbling and dodging all the time.
Will you now FINALLY give us a PROOF for your claim?
That’s correct, Bin. The lunar “spin axis” nonsense has been WRONG for centuries.
So this gives us a good opportunity for you to show your expertise on the issue. What is the change in angle of the imaginary spin axis, based on the angles give by your cult, between the high and low points of Moon’s orbit?
You can’t answer because you’re a complete phony with NO knowledge of the subject. Prove me wrong — give us the answer.
Or, don’t comment here for 60 days and I will give you the answer.
Your choice. Either way, it’s “put up or shut up” time.
You are still babbling and dodging all the time, instead of giving us a PROOF for your claim.
It becomes evident that like Robertson, you can’t prove anything of what you write on this blog.
Bin, the “evidence” is that you can’t answer the simple question. The proof comes after you suspend yourself for 60 days:
What is the change in angle of the imaginary spin axis, based on the angles give by your cult, between the high and low points of Moon’s orbit?
You cant answer because you’re a complete phony with NO knowledge of the subject. Prove me wrong — give us the answer.
Or, don’t comment here for 60 days and I will give you the answer.
Your choice. Either way, it’s “put up or shut up” time.
(This is your last chance before the price goes up.)
Not anymore:
Elon Musk
@elonmusk
20h
Should I step down as head of Twitter? I will abide by the results of this poll.
Yes
57.5%
No
42.5%
Some might say Elon bought twitter to do a job [and would nice if
got paid for his services] and the job is almost done.
https://www.youtube.com/watch?v=cHvFstIJsew
Episode 1962 Scott Adams: Let’s Talk About January 6 And My Audition For CEO Of Twitter
Scott is clueless about religion.
Other than Scott not understanding religion- the rest was pretty
good.
I would be happy if someone could point out a theory of greenhouse effect.
I might be very surprised if we were not in 33.9 million Ice Age and in last few million years has been the coldest.
A lot things I post about, I want to wrong about.
Or I think global warming would be better, than global cooling-
make argument it’s not, and make me happy.
Then he should do the job he set out to do and not ask dumb questions.
Gordon-
His self assessment, is he saving all life on Earth.
And twitter was seem as immediate issue, he doesn’t want
to be a twitter CEO for years.
He might own twitter stock for a long time- depending on who ever takes over.
Jack wanted Elon to take over, Jack might take back his job, or
maybe something more exciting will develop.
maguff…”The closest bright star to the Moons north celestial pole is called Al Dhih…”.
***
I was not talking about the alleged lunar pole view, I was talking about what a person standing about mid-latitude and looking out toward Earth would see re the stars.
Obviously, if that person was looking at Earth from such a position, he/she would see the Earth rotating and a changing vista of stars as the Moon moved in its orbit.
Since the Moon orbits the Earth, a person mid-latitude would see along the Earth-Moon orbital plane. He/she would see the Earth about mid-frame and background stars when the near side was pointed away from the Sun. During that 14 days it would get mighty cold and the observer would see the background stars appearing to move past the Earth. He/she should be able to view a 180 degree panorama till the Sun appeared and wiped out the view.
Another person on the other side of the Moon would be looking in the opposite direction and moving in parallel with the observer on the near side. That person would never get to see Earth, which proves the Moon is not rotating on a local axis.
No.
The Moon revolves anticlockwise in its orbit as the Earth rotates anticlockwise on its axis.
Because of this any point on the Earth, perhaps the Greenwich meridian, takes more than 24 hours to return to the centre of the Earth’s disc as seen from the Moon.
The Moon moves around its orbit at 13 degrees/day. To complete one day as seen from the Moon, the Earth must rotate 373 degrees in 373/360 * 24 = 24 hours 52 minutes.
ent…”The Moon moves around its orbit at 13 degrees/day. To complete one day as seen from the Moon, the Earth must rotate 373 degrees in 373/360 * 24 = 24 hours 52 minutes”.
Correct, if you change rotate to re-orient. However, the Moon is not rotating about a local axis. That’s the illusion. It is re-orienting in space due to gravity easing it off its natural linear path.
Newton repeats that several times in Principia. Planets have a natural rectilinear velocity which is converted to curvilinear motion by Earth’s gravitational field. He actually uses the word curvilinear.
It’s ironic that Newton knew that in the 1600s yet modern textbooks are thoroughly confused about curvilinear translation. It completely explains the motion of the Moon, which keeps the same side facing Earth while re=orienting through 360 degrees per orbit.
Your method cannot explain the phenomenon. Try it and get back to us with proof.
Entropic man
You are right. A look at the source shows the evidence:
Newton’s Principia ( 3rd edition, 1726)
Book III, Prop. XVII, Theor. XV:
https://tinyurl.com/ycokq9ys
Planetarum motus diurnos uniformes esse, et Librationem Lunae ex ipsius motu diurno oriri.
Translation:
The planets’ daily movements are uniform, and Moon’s libration arises from its daily movement.
And what he means with ‘daily movement’ clearly has to be understood as ‘rotation about an own axis’:
” Jupiter utique respectu fixarum revolvitur horis 9. 56′, Mars horis 24. 39′. Venus horis 23. circiter, Terra horis 23. 56′, Sol diebus 25 1/2, et Luna diebus 27 7 hor. 43′. ”
Simply because when Newton mentions Earth, he writes : Terra horis 23. 56′, what certainly does not mean its orbit around the Sun.
Thus, with ” et Luna diebus 27. 7. hor. 43′ “, he can’t suddenly mean Moon’s orbit around Earth.
In the footnote, he writes:
” Quoniam enim Luna circà axem suum uniformiter revolvit eodem tempore quo circà Tellurem periodum suam absolvit … ”
Translation:
For the Moon uniformly revolves around its axis in the same time as it orbits around Earth…
Bin, why try to confuse this with quotes you don’t understand?
Keep it simple, stupid.
The simple ball-on-a-string clearly indicates “orbital motion without axial rotation”. One side of the ball always faces the inside of its orbit.
Just like Moon.
binny…”The planets daily movements are uniform, and Moons libration arises from its daily movement.
And what he means with daily movement clearly has to be understood as rotation about an own axis:”
***
Not so. Newton explained what he meant. In different parts of the orbit, as the Moon points progressively and slightly away from its radial position at perigee and apogee, the near face is re-orientated a few degrees. At those two positions, either end of the major axis, a radial line from the Moon is identical to that in a circle. In between, the radial line points away from the Earth’s centre, allowing us to see a few degrees around the longitudinal edge.
As we no-spinners have stated over and over, libration is a property of the elliptical orbit and any apparent physical rotation is an illusion. Newton agrees with that.
Come on, Gordo.
There are many types of libration.
Besides, you believe that an orbit is a translation, so you are part of Team Science.
Welcome back!
willard…not a belief, a fact. Glad you spinners are coming around to the science.
The only type of libration with which we are concerned is longitudinal. We non-spinners are trying to edumacate you spinners into the facts of science and why we can see around the longitudinal edge of the Moon a few degrees without the Moon rotating on an axis.
Come on, Gordo.
Geometry is a matter of definition, not factuality.
Perfect!
We can now leave Robertson and Clint R alone in their contest for the stupider, bolder manipulation of Newton’s Principia.
We finally leave their illusory world of ball-on-a-string, MOTL/MOTR, curvilinear translations, and other ‘academic exercises’.
Case definitely closed (not for the deniers of course).
Bin, in your broken English, does that mean you’re leaving? Does that mean you are taking the offer to learn, after a 60-day suspension?
https://www.drroyspencer.com/2022/12/uah-global-temperature-update-for-november-2022-0-17-deg-c/#comment-1413183
Perfect!
Distribution of water phase near the poles of the Moon from gravity aspects
https://www.nature.com/articles/s41598-022-08305-x
Abstract
“Our Moon periodically moves through the magnetic tail of the Earth that contains terrestrial ions of hydrogen and oxygen. A possible density contrast might have been discovered that could be consistent with the presence of water phase of potential terrestrial origin.
…”
Anyhow it’s theory.
“Also from that Nature article:
Back of envelope calculation suggested several thousands of cubic kilometers of water phase may have accumulated this way into the subsurface of the Moon over the past 3.5 billions of years.”
Thousands of cubic km of water is trillions tons of water, earlier estimate due to water from impactors, estimated 6 billion tons in polar region. and of that total having millions of tons of mineable water.
This seem to suggest it’s possible there is trillions of tons mineable lunar water. A problem with it, is suggest the water could from at significant depth. Which isn’t problem in terms of mining, but would be harder to find it, instead of within couple meters of surface it could be tens of meters below the surface.
Also it thought there is significant amount frozen CO2 on the Moon, and this theory would explain how CO2 gets to lunar polar regions, or methane.
But anyhow we don’t know if there is mineable lunar water, and my view is NASA should not spend much time in the Moon, before sets sights in sending crew to Mars.
I think NASA look mostly in south pole but also the north pole and look at near surface for water. If they don’t find what they consider might mineable lunar water. They should start Mars crew exploration and consider a plan B of lunar exploration drilling deeper holes.
And if US Congress will fund plan B, do it, while also exploring Mars.
If NASA finds near surface mineable lunar water, they should find a few sites where there is mineable water and be able to suggest which site might have the most mineable lunar, then they start crew exploration of Mars [and if or when US Congress funds a lunar base, then do that, while they also exploring Mars].
Guest essay by Alan Longhurst From Dr. Judith Currys Climate Etc.
“The pattern of warming of surface air temperature recorded by the instrumental data is accepted almost without question by the science community as being the consequence of the progressive and global contamination of the atmosphere by CO2. But if they were properly inquisitive, it would not take them long see what was wrong with that over-simplification: the evidence is perfectly clear, and simple enough for any person of good will to understand.
In 2006 NASA Goddard published two plots showing that the USA data[1]did not follow the same warming trend as the rest of the world. Rural data numerically dominate the USA archive, while urban data massively dominate almost everywhere else. Observations began very early in the USA being introduced by Jefferson in 1776 and that emphasis had already then been placed on providing assistance to farmers.”
https://wattsupwiththat.com/2022/12/18/urban-night-lighting-observations-challenge-interpretation-of-land-surface-temperature-observations/
gb…”But if they were properly inquisitive, it would not take them long see what was wrong with that over-simplification….”
***
They have no interest in looking deeper. There are idiots out there bent on saving a planet that has no need to be saved. This nonsense about climate change and global warming is nothing more than a misdirection to offer a justification for idiocy.
True- and we in an ice age.
They are far worse than mere idiots.
–Veteran US diplomat Henry Kissinger believes the time is approaching for a negotiated peace in Ukraine. The time is approaching to build on the strategic changes which have already been accomplished and to integrate them into a new structure towards achieving peace through negotiation, Kissinger wrote in The Spectator magazine. A peace process should link Ukraine to Nato, however expressed. The alternative of neutrality is no longer meaningful, he added.
Ukrainian presidential aide Mykhailo Podolyak dismissed the comments as amounting to appeasing the aggressor and said there could be no deal involving ceding territory.–
https://www.theguardian.com/world/2022/dec/19/russia-ukraine-war-at-a-glance-what-we-know-on-day-299-of-the-invasion
gb…”Veteran US diplomat Henry Kissinger believes the time is approaching for a negotiated peace in Ukraine”.
***
They can’t negotiate because the minute Zelensky tries he will be dead meat. He’s a sock-puppet for Ukrainian nationalists, who hate everyone but white Ukrainians.
Opinion, noted.
But every and all negotiations tends to take forever- the war will not end within couple months.
But a real process of negotiations, would lessen the harm in this war.
I saw an article a while back claiming the recent Ukrainian offensives has been to grab back as much land as possible before a settlement. I think they know they are not getting the land back.
Having said that, the Ukrainians in the west seem to have gone too far. The Russians are apparently now amassing for a major offensive and the aim could be punitive for all the stupid missiles fired at Russia by the Ukraine. We can thanks the West for that. We insist on sticking our noses where they don’t belong and end up getting innocents harmed.
I am no fan of war, or what the Russians are doing. Neither am I a fan of what the Ukrainians have been doing to their own people under the guise of democracy. The Ukraine was not rated the most corrupt country in Europe for no reason.
Biden family and lots of others, aren’t making it less corrupt.
https://www.youtube.com/watch?v=deK98IeTjfY
Ammunition shortages in Ukraine – production, supply, & are Russia or the West running dry?
Short answer Russia and Ukraine use a huge amount artillery rounds, neither are going to run out in the coming year {or even if this continues for years}.
[Though Russia has been using a lot more artillery rounds then Ukraine and it might have reduce the amount it’s using- but would still to using more than Ukraine. And could have short term shipping problems- though also some doubt of quality- and/or lack information about how usable it’s vast reported stockpile is.
But the news saying running out- and basically, not true.]
I am no fan of war, or what the Russians are doing.”
Glad to hear it, Gordon.
But to say you are not a fan of what the Russians are doing is a 180 degree change in your stance all year.
“so he throws out two links that do nothing to support his nonsense”
So the Moons of other planets have nothing to do with Moon/Earth and their orbits/rotation?
So taking something out-of-context, and twisting/distorting it, is how you pervert reality?
That ain’t science.
You don’t use or acknowledge science.
Or reality.
False accusations ain’t science either, RLH. A false accusation is a tactic used by trolls.
You don’t want to be just another worthless troll, do you?
You are the troll, not me.
Fine RLH. You troll and I’ll ignore you.
I said that you are the troll, not me.
rlh…you can’t do science using one-liners, Richard. Commit yourself to a scientific explanation and let us see how much you understand science.
What science like yours which does not acknowledge that gravity is of any importance?
rlh…intentionally misinterpreting people is another tactic used by those with no substantial argument to offer.
I have, over and over, pointed out that gravity redirects the linear momentum of the Moon, a relatively massive body. All I have claimed is that gravity cannot accelerate the Moon toward Earth. It moves it about 5 metres for every 8000 metres moved by the Moon but it cannot dislodge the Moon from its orbit.
If there was any acceleration along a radial line toward Earth, the Moon would need to lose altitude. So, the motion is not acceleration, it’s more a constant vertical velocity that is so minimal, the Moon can move 8000 metres and only lose 5 metres altitude, However, by then, the curvature of the Earth has lost 5 metres and the Moon maintains the same altitude.
Magic!!!
An acceleration is in a particular direction, if that changes then so does the direction of acceleration.
Gordon, he has you there.
ken…please elaborate as to exactly what rlh has.
I have never claimed that gravity is of no importance. In fact I defend gravity against the claims of idiots that gravity, a force, is not really a force, but some kind of space-time anomaly.
Gravitational force = f = mg, where g = the acceleration of a mass due to gravitational force. Also, F = (G.m1.m2)/r^2
There are some things to be considered before both apply and Newton acknowledged both of them. One, the force has to be able to move the mass before it is true. Two, the magnitude of the force diminishes with the distance squared.
The Moon is simply too far away for the Earth to produce a vertical acceleration on it but not so far that it cannot re-direct the linear momentum of the Moon into a curved path.
No claim there that gravity is not important. Without it, we’d have no weight and nothing could orbit the Earth.
“The Moon is simply too far away for the Earth to produce a vertical acceleration on it but not so far that it cannot re-direct the linear momentum of the Moon into a curved path”
So now GR says that gravity does not have a reduction in d^2.
SOI has remained stably positive since July 2021, and is now rising again.
https://i.ibb.co/prCPNDb/soi30.png
I wonder if Bindiclown still hoping
https://www.drroyspencer.com/2022/05/uah-global-temperature-update-for-april-2022-0-26-deg-c/#comment-1294434
Oh the babbling Edog again!
No hope anymore, the Globe globally sinks in the global La Nina.
And then… comes the Glooohbal Cooohling, Grrrand Solaar Minnnimummm ahead, I tell you.
OMG.
Too bad you don’t know lanina from latrina
Here is a recap of Bindiclown nino forecasting in one picture
https://i.postimg.cc/mgBq4Jf0/bwf.png
There is only one clown here, babbling Edog, and that’s you.
But let me add that you belong to the worst kind of clown I ever experienced: the bad boy ‘clowns’.
At last we have a normal December temperature 6 – 11C in Athens today (yesterday it still was 22C).
christos…you must have global warming in Athens, all we have in Vancouver, Canada is global cooling.
Binny,
“Viscoelastic deformations within the inner core and melt and growth at the surface of a tilted inner core, both neglected in our model, should reduce this amplitude. If the inner core is larger than approximately 200 km, it may contribute by as much as a few thousandths of a degree on the observed mantle precession angle of 1.543” – The Cassini State of the Moon’s inner core.
I don’t believe that any of the 18th century authorities to which you appeal were aware of the different possible Cassini states possibly involved, nor of the nutation of the Moons theoretical spin axis.
I say theoretical, because an object like a model of the terrestrial globe may have a clear axis of rotation, 23.5 or so, while sitting perfectly still upon your desk.
As I have pointed out before, to an observer on the Moon, looking at the Earth high in the lunar sky, the Earth does not rise or set. If you consider this to show that the Moon is rotating with respect to the Earth, you are perfectly free to do so. You may also claim, as you do, that dissecting the past will enable experts to predict the future. Be prepared for people to think you are a deranged SkyDragon cultist. They are perfectly free to do so, aren’t they?
It’s called freedom of thougt.
Flynnson
Your stupid and arrogant blathering about ‘the 18th century authorities’ to which I allegedly would appeal, doesn’t impress, let alone would it interest me.
And your further, thoroughly redundant blathering
” I say theoretical, because an object like a model of the terrestrial globe may have a clear axis of rotation, 23.5 or so, while sitting perfectly still upon your desk.
As I have pointed out before, to an observer on the Moon, looking at the Earth high in the lunar sky, the Earth does not rise or set. If you consider this to show that the Moon is rotating with respect to the Earth, you are perfectly free to do so. ”
belongs to the most riduculous sentences I’ve read in the last years.
All the bullshit you write on this blog has NOTHING to do with what astronomers have observed since centuries.
Binny,
You can choose to be unimpressed, bored, annoyed or whatever you like. Maybe someone will care – who knows?
You don’t agree with facts, and you are perfectly free to disagree with anything you like. Once again, someone may value your opinion.
Your opinions won’t change a single fact, and it is noticeable that you haven’t challenged anything I have said, on a factual basis.
Ah, the miracle of the SkyDragon cultist beliefs – opinion outweighs fact, every time!
Carry on.
Regardless what the crazy little, permanently ankle biting dachshund writes about me (who should care about such subcutaneous aggressivity after all), I see that NOAA’s forecast for Nino3+4 currently is far away from any La Nina end.
We only need to compare today’s NOAA picture
https://i.postimg.cc/9FMy2ncQ/nino34-Mon191222.png
to the oneI saved about 4 months ago
https://i.postimg.cc/43bYV6X0/nino34-Mon150822.png
For Jan & Apr 2023, the current forecast is clearly lower than that in mid August.
Duh.
https://www.youtube.com/watch?v=YZc3BB1IfZE
SpaceX Starship 24 FINAL Test Complete, Triple Falcon 9 Frenzy, China Launch Failure, Soyuz ISS Leak
Weekly update by Matt Lowne
Arctic blast this week brings the coldest Christmas in nearly 40 years for millions
https://www.cnn.com/2022/12/19/weather/christmas-week-forecast-cold-snow-wxn
Unfortunately, I am just getting cold weather- without snow, for Christmas.
Grand solar minimum forecast – Solar Cycle 26
https://youtu.be/5c0h3QVtdAQ
So, not much difference.
–Elon Musk Retweeted
Business profile picture SpaceX @SpaceX
Starlink now has more than 1,000,000 active subscribers thank you to all customers and members of the Starlink team who contributed to this milestone —
I thought would get 1 million before end of year.
As guess should have over 2 million by summer of 2023 and be in black by end of 2024.
Of course keeps adding more satellites [or spending] and even if starship works, will still will adding after 2024. And there uncertainty about how starship can perform.
It seems unlikely [less than say, 30%] the test launch happens before Christmas, but give it, say, 80% chance before my birthday [Jan 22].
Hmm, I wonder what chances are it never launches- never attempted and or doesn’t clear the tower?
As mention before, it would better to have launch site [in the ocean] where large rockets can be tested.
And as I have said for decades, don’t really need a large rocket to explore the Moon or mine lunar water on the Moon. But it seems need something like starship to explore Mars.
Gordon Robertson December 19 at 1:50 PM
“The Moon does not have to rotate under the LRO, all it has to do is change orientation wrt the stars to which the LRO is fixed. Curvilinear translation will accomplish that nicely.”
So, all you’ve done is substitute change orientation for rotate. I would expect more from someone who has told us that he “…took a course in organic chemistry…”, remember? https://www.drroyspencer.com/2018/07/summer-causes-climate-change-hysteria/#comment-311679
If true then, think back to the portion of the course on Molecular Symmetry, where you would have learned that a change of orientation is the result of rotation(s) https://sites.cns.utexas.edu/jones_ch431/rotations.
That said, my description of the LRO orbit stands:
The LRO orbit plane remains nearly fixed wrt the stars at an inclination of approximately 90 degrees relative to the lunar equator. This orientation allows it to scan 100% of the Moons surface every two weeks as the Moon rotates beneath it.
Q.E.D.
You’re ineducable.
Q.E.D.
[DREMT] 1) Rotation about an external axis, with no rotation about an internal axis, is motion like the “moon on the left”.
[Wikipedia] Tidal locking… results in the Moon keeping the same face turned toward Earth, as seen in the left figure… If the Moon were not rotating at all, it would alternately show its near and far sides to Earth, while moving around Earth in orbit, as shown in the right figure. https://en.wikipedia.org/wiki/Tidal_locking
[DREMT] You’re ineducable.
That’s right, Tyson, “rotation about an external axis with no rotation about an internal axis” is motion like the MOTL. As Bindidon and Nate agree. So when Wikipedia mentions that in their opinion the MOTL is the one that is rotating on its own internal axis, they must mean something other than “rotation about an external axis” for “orbital motion”. Let’s see if you’re capable of learning, and can answer what that motion is?
“…they must mean something other than…”
What are the odds that their words don’t mean exactly as they say?
There is no such thing as rotation about an external axis. There are only orbits which require 2 bodies (or more).
See, Tyson? You haven’t learned a thing. You are not even able to read properly. The correct answer was “translation in a circle”.
Gaslighting Graham gently gaslights a little more.
See, DREMT? You haven’t learned a thing.
The odds that these words don’t mean exactly as they say are nil…
Yes, you are unable to read, Tyson, as I said.
They don’t say the MOTL is rotating about an external axis and rotating about an internal axis. They imply it is “in orbit” whilst rotating about an internal axis. Since we know (it’s just basic kinematics) that “rotation about an external axis with no rotation about an internal axis” is motion like the MOTL, they cannot mean “rotation about an external axis” by “in orbit”. It can only mean “translation in a circle”.
“Spinners” would describe motion as per the MOTR as “translation in a circle”. Thus they think the MOTL is “translating in a circle, whilst rotating about an internal axis”.
There is no such thing as rotation about an external axis using gravity.
See, Tyson? “Spinner” RLH doesn’t even think it’s possible to describe “orbital motion” as a “rotation about an external axis”. He’s definitely on the “translation in a circle” side of the fence.
Read what I said DREMT.
I did. Now read what I said.
TM, linking to things you don’t understand ain’t science. You need to help Bindidon. He doesn’t understand any of this either:
What is the change in angle of the imaginary spin axis, based on the angles give by your cult, between the high and low points of Moon’s orbit?
https://www.drroyspencer.com/2022/12/uah-global-temperature-update-for-november-2022-0-17-deg-c/#comment-1413183
It’s time for you cult idiots to put up or shut up.
Here is how we stup up a real bet, Pup:
https://www.drroyspencer.com/2022/12/uah-global-temperature-update-for-november-2022-0-17-deg-c/#comment-1411920
Do the Poll Dance Experiment.
Little Willy, please stop trolling.
“Youre ineducable.
Q.E.D.”
To the contrary. An education in physics has given Nate, Tim, Tyson, Bindidon and Willard enough knowledge to understand the physics of rotation. They understand that the evidence shows that the Moon rotates and that your parochial Earth centred view only gives the illusion that the Moon is not rotating.
Perhaps you, CilntR and Gordon Robertson should study, or at least revisit, kinematics and dynamics before embarrassing yourselves further.
The moon issue is not resolved by reference frames, as Bindidon agrees:
https://www.drroyspencer.com/2022/12/uah-global-temperature-update-for-november-2022-0-17-deg-c/#comment-1409168
Pseudomod
(1), (2), (3) correct but do NOT contribute in any valuable way to the discussion.
(4), (5), (6): all plain wrong.
Stop manipulating the blog with things that I see no reason to disagree with, but are of no use in the discussion.
Entropic Man suggests that reference frames resolve the issue, and that you are one of a group of people he considers educated in physics enough to understand the issue properly. So pointing out to him that you agree with me, and disagree with him, on reference frames seemed to be the obvious thing to do.
Gaslighting Graham gently gaslights a little more.
Little Willy, please stop trolling.
Pseudomod
For the very last time, before you continue to manipulate the blog about what you insinuate I would mean.
You wrote:
” The moon issue is not resolved by reference frames, as Bindidon agrees”
I have always agreed upon the evidence that a rotating celestial body always rotates, independently of the point in space from which it is observed, and independently of the reference frame used to describe its motion.
*
I suspect you to misuse what I agree upon, with the intention to suggest that a celestial body rotating wrt a reference frame RF1 wight very well not rotate wrt another reference frame RF2.
This would be utterly wrong.
Your suspicions are wrong, Bindidon. What we agree on, regarding reference frames, is as you describe.
“…to suggest that a celestial body rotating wrt a reference frame RF1 wight very well not rotate wrt another reference frame RF2.”
No, and in fact that is what the people I am arguing against claim.
Gaslighting Graham gently gaslights a bit more.
Here is a simple refutation of his absolutist standpoint:
https://en.wikipedia.org/wiki/Rotating_reference_frame#/media/File%3ACorioliskraftanimation.gif
To refute my standpoint, you would first have to understand it. You don’t.
Poor Graham. Forever misunderstood.
Never mind. He gently gaslights a bit more.
I know you don’t understand my standpoint. You calling it "absolutist" and linking to what you did was a good proof of that.
There are a group of people who think the moon issue is resolved by reference frames. These people argue that the moon does not rotate on its own axis wrt a "rotating reference frame", but that it does rotate on its own axis wrt "an inertial reference frame". They think that’s the end of it.
Those people are wrong. So when I say that the moon issue does not resolve reference frames, that’s what I mean. I’m not saying that reference frames aren’t necessary. I’m not "dissing" them.
It’s as Bindidon said. Some people:
"…suggest that a celestial body rotating wrt a reference frame RF1 wight very well not rotate wrt another reference frame RF2.
This would be utterly wrong."
"So when I say that the moon issue does not resolve reference frames"
should say:
"So when I say that the moon issue is not resolved by reference frames".
Gaslighting Graham gently gaslights a little more:
Here is a little puzzler for him and other Moon dragon cranks:
https://fr.m.wikipedia.org/wiki/Charon_(lune)#/media/Fichier%3APluto-Charon_System.gif
Is it the MOTR or the MOTL?
MOTL (obviously).
🤦
I suppose you think it’s the MOTR! You will always take up the opposing viewpoint to whatever I say, no matter how ridiculous that makes you look.
🤦 🤦
Little Willy, please stop trolling.
All WRONG, Ent.
Orbital motion is a different animal than Kinematics or Kinetics. None of you cult idiots knows anything about the relevant sciences. Orbital motion without axial rotation is well described by the simple ball-on-a-string. One side always faces the inside of the orbit. Just like Moon.
Take the challenge that Bin runs from:
https://www.drroyspencer.com/2022/12/uah-global-temperature-update-for-november-2022-0-17-deg-c/#comment-1413183
You do not know how to set up a real bet, Pup.
Here is how we do it:
https://www.drroyspencer.com/2022/12/uah-global-temperature-update-for-november-2022-0-17-deg-c/#comment-1411920
Do the Pole Dance Experiment.
Ball on string only works when the central point is fixed. Earth is moving so Ball on String does not apply to earth-moon, though you could argue Ball on String works earth-moon barycenter with sun as center.
Moon rotates on its axis with respect to the sun. No reasonable way to argue otherwise.
Ken entertains us once more with a display of his ignorance of the issue.
* He believes Moon orbits Sun.
* He believes the ball-on-a-string is a model of Moon.
* He believes rotating with respect to Sun means actual axial rotation.
* He believes barycenter has something to do with axial rotation.
Ken is a perfect example of a braindead cult idiot posing as an anonymous troll. He knows NOTHING, and can’t learn.
It’s too bad he doesn’t troll more. He’s much funnier than the rest.
I don’t believe the moon orbits the sun. I know it orbits the sun. So says the diagram of the Earth-Moon Transit around the Sun. We’ve known this to be true since the days of Galileo.
Do try and keep up.
Not even coal for you this Christmas.
Thanks for confirming your ignorance, Ken.
That’s why you are so humorous.
And that’s why this is so much fun.
ken…”Ball on string only works when the central point is fixed. Earth is moving so Ball on String does not apply to earth-moon, though you could argue Ball on String works earth-moon barycenter with sun as center”.
***
Far too complicated. The BoS was introduced by us spinners as an example of an orbiting body that keeps the same face pointed to its external axis. The whole point of the BoS is the string preventing the ball rotating on its local axis. Even at that, spinner continued to argue the ball is rotating about a local axis.
So, we introduced a wooden horse on a merry-go-round with the horse bolted to the floor of the carousel. Still, the spinners insisted the horse was rotating about its COG even though the bolts prevented it rotating as such.
No pleasing some people.
Gordon, I expect you to correct your comment above, staring with The BoS was introduced by us spinners”
Get it all corrected and then stop just spewing crap. You don’t understand all of the science, but you have a great understanding of reality. Like gbaikie, who you have corrected, you people with common sense need to learn why you’re correct, before your long rambling spews.
When have I been corrected by anyone on this board.
I imagine I would remember this happy moment.
But been a long time, I could have forgotten it, and I would enjoy
being reminded of it.
On the subject of reference frames non-spinners are dismissive, or in the case of Gordon Robertson we must “Forget the idiocy of reference frames”.
However, they appeal to change of orientation rather than rotation to explain tidal locking of the Moon.
But orientation, let alone change of orientation, depends on a frame of reference. I’m not even talking about Newtonian inertial reference frames, just basic navigation.
An object that is “rotating about an external axis whilst not rotating about an internal axis” moves like the MOTL. Hence it changes its orientation wrt an inertial reference frame, but is not rotating on its own internal axis.
Right on, Tyson.
One reason why Moon Dragon cranks diss frames is that they have no numerical models to offer.
What use would be a way to measure things useful to trolls like Gaslighting Graham?
"…Moon Dragon cranks diss frames…"
So Bindidon is a "Moon Dragon crank"?
Now, back to my point:
An object that is “rotating about an external axis whilst not rotating about an internal axis” moves like the MOTL. Hence it changes its orientation wrt an inertial reference frame, but is not rotating on its own internal axis.
maguff…”But orientation, let alone change of orientation, depends on a frame of reference”.
***
I have an advantage on you here, I spent hundreds of hours solving engineering physics problems, and not once did we employ a frame of reference.
First of all, orientation on an x-y plane is relative to the x- or y-axes. That’s on a freebody diagram. In the real world, there is no x-y plane so we need to conjure another reference point. We created a huge x-y-z coordinate system based on distant stars with the Earth’s N-S pole pointed at Polaris.
From that we derived a celestial equator, and we ended up with the same thing as an x-y-z coordinate system. The point you need to get is that the coordinate system has point 0,0,0, centred in Earth. Therefore, no reference frame is required since it is understood.
An FoR is only required with relative motion. You can call an x-y coordinate system a frame of reference but why bother when you are dealing with motion in the same frame?
The Moon orbiting about the Earth requires no reference frame since both bodies are moving in real time in the same physical space. There is no reference frame involved unless you want to get stupid and imagine one.
For example, the Sun appears in the East in the morning and disappears in the West in the evening. The idea that it is rising and setting, then moving across the sky, is due to an illusion related to relative motion. That’s a human mental problem, not reality.
That’s not the case with the Moon. When we see it moving across the sky, that’s exactly what is going on. The motion is split up over 14 days. However, when we see the stars behind it moving east to west, it’s the same apparent relative motion as the Sun. We have to understand, however, that the Earth rotates faster than the Moon orbits, therefore we have to make allowances for that to compute lunar motion day after day.
The solution is to use an x-y coordinate system with a freebody diagram. I don’t call that a reference frame because that holds no interest for me. I don’t care about relative motion between Earth and Moon, although, if you are really anal, you could insist on it. Fortunately, none of our engineering profs found that necessary during problem sets or exams because they figured we had the intelligence to understand that.
If you lay out an x-y plane to mimic the Earth-Moon orbital plane, you place the Earth at the origin. If you wanted to be seriously stupid, you could place the Moon at 0,0 and have the earth orbit the Moon in a zany sci-fi manner.
Again, relative motion is not an issue, so we don’t need the Earth rotating. We can place the Moon along the positive x-axis, connecting it with a radial line from Earth centre to Moon COM. That way, we can use a polar coordinate system if we like. Or both that an an x,y coordinate system.
There you have it, you can fill your boots, adding vectors to represent instantaneous motion…whatever. No need for a reference frame, just deal with the real-time issues.
If you want to get silly and complicate the problem out of hand, you can use a different reference frame, with the stars as your basis of relative motion. Why would you want to do that on Earth, where we live?
The entire problem as posed here on Roy’s blog was whether the Moon rotates on a local axis. We can deal with that entirely by using an x-y coordinate system to represent the Earth-Moon orbital plane. No other frame of reference is required…unless…a person has an interest in obfuscating the problem in such a manner that the results using an x-y plane are cast in doubt.
If the Moon rotates on a local axis, that would become totally apparent on an x-y plane, but it is not. Rather, what we see using an x-y plane is that all points on the Moon are moving in parallel orbits around the Earth. That describes curvilinear motion without local rotation.
In your zeal to prove the non-spinners wrong, you spinners have created a parallel universe in which the definition of local rotation has been made dependent on reference frames which don’t exist in reality.
We have already defined rotation about a local axis in physics and it is not dependent on a reference frame.
"First of all, orientation on an x-y plane is relative to the x- or y-axes. That’s on a freebody diagram. In the real world, there is no x-y plane so we need to conjure another reference point. We created a huge x-y-z coordinate system based on distant stars with the Earth’s N-S pole pointed at Polaris.
From that we derived a celestial equator, and we ended up with the same thing as an x-y-z coordinate system. The point you need to get is that the coordinate system has point 0,0,0, centred in Earth. Therefore, no reference frame is required since it is understood."
So, Tyson, or Entropic Man…a coordinate system centered on the Earth with the x-y-z axes pointing at distant stars would be what type of reference frame? Inertial, or non-inertial?
Gordon Robertson
738 words! The first thing an Engineer learns is to write concisely, conveying meaning using the fewest words possible without sacrificing clarity. But I digress.
You said: “… In the real world, there is no x-y plane…”
Let’s say you’re tasked with designing a system that will slide a shipping container up an inclined steel ramp 25 ft in length and onto a dock 10 ft above the ground. The container weighs 2,000 lbs. Might not a reference frame be useful in solving this problem?
Rhetorical. The answer is yes. The only question remaining is choosing the most convenient reference frame for ease of calculation and clarity.
maguff…”Lets say youre tasked with designing a system that will slide a shipping container up an inclined steel ramp 25 ft in length and onto a dock 10 ft above the ground. The container weighs 2,000 lbs. Might not a reference frame be useful in solving this problem?”
***
Why would you need one? It is understood that the ramp and dock are in the safe inertial reference frame, so why do you need to state that? Look at any engineering or architectural drawing. The only reference you’ll see to a reference frame is the standard N-S-E-W compass points if required. On certain drawings they state elevation as well and state what it is referenced to.
We had certain trick questions thrown at us on engineering exams. During lectures they’d throw things at us repeatedly like ‘that is obvious by inspection’. If you saw a similar question on an exam you could get full marks for stating the solution is obvious by inspection. That would save you half an hour you could use elsewhere.
****************************
“738 words! The first thing an Engineer learns is to write concisely…”
***
No one ever told us to spare words, we were told to make sure your drawing and explanation conveyed the proper meaning. In fact, we were told a drawing should stand on it’s own merit, that no one should have to struggle to find the meaning. That comes down to using descriptive titles and adding lots of detail notes in your drawings.
Besides, I need to spoon-feed you spinners since your comprehension is seriously lacking.
On a major construction site, there is a full set of drawings available along with a book of specifications. They don’t spare words in the specs, they will go into as much detail as required.
“Why would you need one?”
For starters, you need to calculate the net force in the direction of the ramp. Friction opposes this force and is itself a function of the weight of the container which is directed downward.
I personally would align my axes so that the x-axis coincides with the ramp. There’s enough information to calculate friction in terms of the x-direction component of weight.
“The only reference you’ll see to a reference frame is the standard N-S-E-W compass points…”
Precisely my point; you cannot calculate an orientation without a reference frame. Given an initial orientation in your chosen reference frame, you can rotate an object to a new orientation by any angle between 0 and 360 degrees. Note that unlike orientation, rotations are not limited to 360 degrees.
“No one ever told us to spare words…”
Talk [or write] less but say more. That’s what I say.
Come on, Gordo.
Even if was true, your fib would only show that engineers work with the implicit frame of the Earth.
We are talking about a problem that pertains to celestial mechanics.
Think.
willard…”Even if was true, your fib would only show that engineers work with the implicit frame of the Earth.
We are talking about a problem that pertains to celestial mechanics”.
***
We did many problems involving celestial mechanics. One of them involve a spacecraft approaching Mars and needing to go into orbit about Mars. We had to calculate, given a certain spacecraft velocity, how long retros would need to be fired to slow it enough to go into orbit around Mars.
Why would we have needed to define a reference frame for that? We have a spacecraft moving relative to Mars and we need to put it in orbit around Mars.
I created a bit of a fuss with a TA who had a Ph.D in engineering. I pointed out that given the velocity of the spacecraft and its position, it would be well past the point of going into orbit by the time the retros were fired.
The TA had no idea how to approach the problem either so he took me to see an engineering prof. The prof laughed, he saw the problem immediately. He told me such a question was geared to first year engineers who were not expected to notice such things and simply to apply the pertinent equations.
If the same spacecraft wanted to transmit a message to Mars from a considerable distance to another spacecraft orbiting Mars at considerable speed, a reference frame would likely be required. In fact, that is the situation with GPS satellites. Due to their speed and the fact the sats use a different time system than the land stations, corrections have to be made to the signals to synchronize them. That situation may require reference frames.
It’s hilarious that some scientists think this is evidence of time dilation.
In fact, any situation where one references frame is moving relative to another requires measures to interconnect the two. For the longest time, no one could figure out what was going on with Mercury. It seemed to stop in its orbit, move backwards, then continue forward.
I don’t understand why scientists did not twig onto the reason more quickly, Obviously, when Mercury is viewed from Earth, it is moving with a relative velocity. There are points in the orbits of both where Mercury appears to be moving backwards when viewed from Earth. The reason it does is the same reason the Sun appears to move across the sky. It’s an illusion related to relative motion.
Come on, Gordo.
Kinematics comes from Celestial mechanics.
Every time you open your mouth to pontificate about technical stuff you reveal you never studied it:
https://medium.com/@zackfizell10/reference-frames-every-aerospace-engineer-should-know-db10638b6d7a
Read. More.
So, Tyson, or Entropic Man, or Little Willy…a coordinate system centered on the Earth with the x-y-z axes pointing at distant stars would be what type of reference frame? Inertial, or non-inertial?
Gaslighting Graham gently gaslights a little more.
Now even asking a question is "gaslighting".
When I read such a nonsense like
” What is it you fail to understand about my Earth-centred x-y plane that clearly shows all parts of the Moon moving along parallel orbital paths? Perhaps you can explain how such a situation can be construed as having the Moon rotate about a local axis at the same time. ”
I ask myself why the Ignoramus can’t think of what would happen if the Sun wasn’t the fireball we have now, but was a giant planet instead, and the Ignoramus would stay on that planet, and would look at Earth orbiting it.
Would he then say:
” What is it you fail to understand about my Sun-centred x-y plane that clearly shows all parts of the Earth moving along parallel orbital paths? Perhaps you can explain how such a situation can be construed as having the Earth rotate about a local axis at the same time. ”
Dumb, dumber, dumbest…
Bindidon…from a Sun-centered x-y plane all parts of the Earth would not be moving along parallel orbital paths…because the Earth rotates on its own axis. The paths would be criss-crossing over each other continuously in the case of the Earth.
I think you have missed Gordon’s point somewhat.
Think of the Earth/moon system seen from the same POV as the MOTL/MOTR GIF (an Earth-centered x-y plane, in other words). All parts of the MOTL, which moves as per our moon, follow concentric orbital paths. The orbital paths of all the different particles comprising the MOTL are a set of concentric circles. If the moon was rotating on its own axis, those paths would criss-cross. That’s what Gordon is saying.
dremt…”If the moon was rotating on its own axis, those paths would criss-cross. Thats what Gordon is saying”.
***
Exactly. If you followed a rotating radial line running from Earth’s centre right trough the lunar centre, the portion of the radial line inside the Moon would be rotating inside the radial line.
Pseudomod
I think YOU have missed MY point somewhat.
” … because the Earth rotates on its own axis. ”
This is exactly what you wouldn’t know when staying on the cold, dark, giant planet, Pseudomod.
Viewed from that Sun planet, there is NO difference between
– Sun and Earth
– Earth and Moon.
If you still don’t (want to?) understand such a simple analogy, then we don’t need to continue.
Keep denying strong then!
You’re completely and utterly wrong, Bindidon, on this occasion. Even located actually on the Sun planet itself, rather than viewing the situation from above like with the MOTL/MOTR GIF, you would still actually see the Earth rotating on its own axis…see Gordon’s comment here:
https://www.drroyspencer.com/2022/12/uah-global-temperature-update-for-november-2022-0-17-deg-c/#comment-1413682
Pseudomod
You still did not understand what I meant above.
Suppose you land on the giant, cold planet Sun, coming with a spaceship from another solar system.
You have tools on board helping you – don’t ask how they do, it doesn’t matter here – to detect all planets orbiting Sun, and all moons orbiting planets.
But except Sun, on which you stay, you can’t observe any other body’s rotation anywhere – unless you move with the spaceship to the body, and measure its rotation by observing how fast a distant star moves around you.
*
Would you then say, before moving to this Earth you see orbiting around Sun:
” What is it you fail to understand about my Sun-centred x-y plane that clearly shows all parts of the Earth moving along parallel orbital paths? Perhaps you can explain how such a situation can be construed as having the Earth rotate about a local axis at the same time. ”
No: you couldn’t say that because you don’t know it.
*
And by analogy, you couldn’t say, b>before moving to this Moon you see orbiting around Earth you stay on
” What is it you fail to understand about my Earth-centred x-y plane that clearly shows all parts of the Moon moving along parallel orbital paths? Perhaps you can explain how such a situation can be construed as having the Moon rotate about a local axis at the same time. ”
It is exactly the same situation.
There is NO REASON to simply state that planets rotate but moons don’t – just because one of these moons shows the same face to you while orbiting.
*
One day, we will obtain a sequence of high definition pictures of our Moon, made from a point distant from Moon, and showing you that a fixed point on it does not follow a path based on a 100 % orbital motion.
LRO does that already, but it seems to me you don’t believe in the data because LRO orbits Moon.
Probably you wouldn’t even believe in the result of any computation of LRO data proving Moon’s spin.
I hope you will be honest enough to accept the same computation when based on a distant observation of the Moon.
Poor old Binny, all he can do is quote authority figures while failing to understand even the simplest scientific explanations.
If I was on a planet replacing the Sun, and observed the Earth, I’d see it complete 365 1/4 complete rotations per orbit. Of course, I’d need to keep moving around the planet to make all my observations. I would be able to see all sides of the Earth for each rotation.
…unless Bindidon means you wouldn’t be able to see the Earth at all, due to lack of Sunlight? I don’t know…otherwise I can’t understand how he’s got himself so confused. Bizarre.
Poor old Robertson, who isn’t able to understand simple statements.
But… Pseudomod isn’t much better.
Right, so it was that you were unable to see the Earth. That explains it.
ent…”Perhaps you, CilntR and Gordon Robertson should study, or at least revisit, kinematics and dynamics before embarrassing yourselves further”.
***
What is it you fail to understand about my Earth-centred x-y plane that clearly shows all parts of the Moon moving along parallel orbital paths? Perhaps you can explain how such a situation can be construed as having the Moon rotate about a local axis at the same time.
Come on, Gordo.
Do you live in a universe with an elliptical geometry?
Think.
willard…if you understand calculus, trig, and vector calculus, you have no problem transferring circular geometry to elliptical geometry. I have laid it out for you several times and received no response from you, or comments on the math.
Come on, Gordo.
If you do not know that the universe cannot revolve around the Moon, there is little to do about you.
In fairness, there might not be anything to do about Dragon cranks in any event.
Little Willy, please stop trolling.
“Little Willy, please stop trolling”.
***
And do try to stop being a dolt.
Come on, Gordo.
You want me to recall your blunder about reference points in engineering?
You made so many blunders in this thread alone it is hard to understand how you can keep a straight face.
Think.
#2
Little Willy, please stop trolling.
TM, I see you are confused about “tidal locking” also. That indicates you know NOTHING about the science being discussed.
Take the challenge offered to Bindidon and Ent:
https://www.drroyspencer.com/2022/12/uah-global-temperature-update-for-november-2022-0-17-deg-c/#comment-1413183
If you can’t answer the question, take a 60-day break from commenting here, and I will provide the answer so you can learn something. As an added bonus, I will explain why tidal locking does not work for Moon.
Don’t miss this special offer. It won’t last long.
Pup,
Here is how we set up a real challenge:
https://www.drroyspencer.com/2022/12/uah-global-temperature-update-for-november-2022-0-17-deg-c/#comment-1411920
Put up or do the Poll Dance Experiment.
Little Willy, please stop trolling.
If coal was $400 per ton in the US, would there be any future of coal?
It would depend on price of natural gas, but the present price of natural gas, has reducing amount coal use in the US- it’s main reason US CO2 emission has lowered over the decades. And US coal has been $100 per ton or less. And seem if US was 4 times the price, coal use
would more quickly disappear- unless natural gas get a lot more expensive.
China has been importing more coal and using more coal and they have paying about $400 per ton for more than 6 months.
I think China has been at peak coal for more than year.
It seems best way to reduce Global Co2 levels, is to have much cheaper natural gas.
Rather than ocean methane hydrates it seems we will start with land
methane hydrates”
DNR Approves Methane Hydrate Drilling
Aug 11, 2022 | News, Oil & Gas
https://www.akbizmag.com/industry/oil-gas/dnr-approves-methane-hydrate-drilling/
Alaska may be sitting on a motherlode of an alternative form of fossil fuel, depending on the outcome of an international intergovernmental research effort.
Forecast for North America, night to 22.12.22
https://www.wetteronline.de/?pid=p_city_local&sid=Pictogram&diagram=true&fcdatstr=20221222&daytime=night&iid=namk
Denver, CO at -26 C: that’s 30 (thirty) C below our current night temperature.
No wonder:
https://images.ctfassets.net/4ivszygz9914/c0673ba6-2394-43d6-94f9-2e6c04e679a1/e10391ed5730ca1dfb400c71e2c443be/b818f558-8fd8-43bf-82f9-50635b4829c9.jpg?fm=webp
“What is the change in angle of the imaginary spin axis, based on the angles give by your cult, between the high and low points of Moons orbit?”
What does this even mean???
The moon has a very well-defined north pole and south pole and equator. The “spin axis” is a line that goes “up and down” through the poles, perpendicular to the plane of the equator (like the earth’s axis goes through the poles). This axis is tilted about 1.54 degrees from the ecliptic (similar to how the earth is tilted about 23.4 degrees from the ecliptic). The axis precesses slowly, but the angle (1.54 degrees) does not change noticeably with respect to the ecliptic (or to the stars) — and certainly not within one orbit.
And what are the “the high and low points”? Do you mean high and low above the ecliptic because the moon’s orbit is tilted? Do you perhaps mean “near” and “far” points (perigee and apogee)?
tim..”The moon has a very well-defined north pole and south pole…”
***
Defined is the operative word. The Earth does not require a defined N-S pole since it is apparent about which axis it is rotating.
I don’t know how they defined a N-S pole for the Moon. I suppose they could have started with the Earth-Moon orbital plane and drawn an axis perpendicular to it. Then they may have noted that the Moon is tilted a few degrees away from that based on its orientation to the plane.
Then again, does that not tilt the lunar equatorial plane to the orbital plane?
You seem to be claiming the N-S plane is based on a true lunar rotation abut that axis, yet you have supplied no proof that is the case. Where’s the proof that the Moon is rotating about such an axis?
I mean, how does it do that and still keep the same face pointed at the Earth.
I thought it was 1.5 degree relative to the Sun
Hmm:
“The Moon’s actual motion is extremely complicated:
it orbits the Earth in an elliptical orbit,
tipped at an angle to the Earth’s own orbital plane (the ecliptic);
and its orbit is constantly being perturbed
by the gravitational influence of the Sun.”
http://star-www.st-and.ac.uk/~fv/webnotes/chapt10a.htm
Hmm Earth orbital plane is called 0, but it’s not- no planet is as far as know.
Wiki:
“Earth’s orbit is an ellipse with the Earth-Sun barycenter as one focus and a current eccentricity of 0.0167. Since this value is close to zero, the center of the orbit is relatively close to the center of the Sun (relative to the size of the orbit).”
Venus:
“about 3 24′
The inclination of the Venusian orbit to the plane of the Ecliptic (the Ecliptic is the projection of the Earth’s orbit onto the celestial sphere) is about 3 24′.
“Although all the planets and asteroids follow elliptical orbits around the Sun (obeying Keplers First Law), these orbits do not all lie in the same plane they are usually tilted with respect to each other. As Earth-bound humans, we have adopted the plane in which the Earth moves around the Sun (the ecliptic) as our reference plane for the Solar System. With this convention, the Earth has an orbital inclination of zero degrees, and the orbital inclinations of other Solar System bodies are measured relative to this (for example, Mars has an orbital inclination of 1.85, Mercury: 7.00 and Pluto: 17.15).”
https://astronomy.swin.edu.au/cosmos/O/orbital+inclination
“I dont know how they defined a N-S pole for the Moon. ”
Easy! When you stand at the north pole (whether on earth or the moon), one star remains straight overhead, and no stars ever rise or set. When you stand at the equator (whether on earth or the moon), all stars rise vertically.
Now you know. You’re welcome.
Fraudkerts, Earth has TWO poles. Earth has a magnetic pole and a rotational pole perpendicular to its equator. Moon only has a pole perpendicular to its orbit around Earth.
But your cult believes Moon has a “rotational pole”. So answer the simple question:
https://www.drroyspencer.com/2022/12/uah-global-temperature-update-for-november-2022-0-17-deg-c/#comment-1413183
Of course, you can’t, because you’re a FRAUD.
“Earth has TWO poles. Earth has a magnetic pole and a rotational pole perpendicular to its equator”
That makes 4 including North and South.
Have there been many people standing at the moon’s “North Pole”, looking for a pole star, then, Tim?
The South pole of the Moon is in Shackelton crater.
https://upload.wikimedia.org/wikipedia/commons/thumb/a/ac/Lunar_south_pole_summer_annotated.jpg/1024px-Lunar_south_pole_summer_annotated.jpg
How does Astronomy that? Because the Moon is observed to rotate around that point.
“The rotational axis of the Moon passes through Shackleton, near the rim.”
And, like on Earth, it is, on average, the coldest, darkest place.
Again, if ANY OF YOU GUYS can offer a shred of evidence that Astronomy is getting this wrong, and has not observed this, please show it now.
If not, then it is clear that your claims are not fact based.
Has any of the TEAM stood at the Earth’s North pole and looked up to see the pole star not moving?
No.
And yet they don’t seem to have any doubt that science has figured out where the North Pole is.
For the Moon, they have their skin in the game, which requires them to doubt that science has figured out where the poles are, without having any evidence to support this.
That’s how we recognize trolls.
We hope they will standing in South pole soon, and also at the lunar North pole a bit later.
“Moon only has a pole perpendicular to its orbit around Earth.
But your cult believes Moon has a ‘rotational pole’. So answer the simple question:”
The Moon’s pole is NOT perpendicular to its orbit according to every available astronomy source.
But Clint declares his own alternative facts, as usual without offering diddly squat to back them up.
But then he demands people answer his indecipherable question.
Yet he refuses to even try to clarify it, when politely asked.
Showing that he really has no interest in posing coherent answerable questions, much less finding the truth.
He is showing that his only interest here is to try to humiliate people, with juvenile tactics: ‘See, you can’t answer my question!’ as trolls tend to want to do.
Fraudkerts, you can’t answer the simple question so you throw your slime against the wall. That’s why you are such a fraud.
Agree to not comment here for 120 days, and I will explain the answer to the simple question.
I won’t hold my breath….
Hey, Pup:
https://www.drroyspencer.com/2022/12/uah-global-temperature-update-for-november-2022-0-17-deg-c/#comment-1413542
I will expand the challenge to you, Pup.
Answer the easy question or stop trolling here for 60 days to get the answer.
Like with the rest of your cult, I won’t hold my breath…
There’s already a challenge on the table, Pup:
https://www.drroyspencer.com/2022/12/uah-global-temperature-update-for-november-2022-0-17-deg-c/#comment-1413748
That and the Pole Dance Experiment.
Little Willy, please stop trolling.
The incompetent troll police somehow missed this egregious trolling:
“Fraudkerts, you cant answer the simple question so you throw your slime against the wall. Thats why you are such a fraud.”
#2
Little Willy, please stop trolling.
Incompetent, and extremely corrupt troll police.
#3
Little Willy, please stop trolling.
We will award them first prize at the ‘last word’ game.
But they are losing the main argument about the Moon.
#4
Little Willy, please stop trolling.
dremt…”See, Tyson? Spinner RLH doesnt even think its possible to describe orbital motion as a rotation about an external axis. Hes definitely on the translation in a circle side of the fence”.
***
The Moon-Earth orbital motion is unique. There is no way it would work with any air resistance at all because the Moon would lose momentum due to drag and lose orbit. Therefore there is no way to compare it to any motion in a terrestrial environment.
If the Moon was attached to Earth by a mechanical means, we could claim it is rotating about the Earth as an axis. Although it is not attached to Earth via gravity, it’s not a stretch, IMHO, to visualize the Moon as rotating about the Earth as an external axis.
Some scientists talk about the Moon having an angular momentum about the Earth even though it does not in a technical sense. To have an angular momentum it would have to be attached mechanically to the Earth and be impelled somehow. As it stands, the Moon is impelled by its own linear momentum and the gravitational field serves to redirect the Moon’s linear momentum into a curvilinear motion. At least, Newton described as such.
Since there is no good way to describe that motion, what’s wrong with claiming the Moon is rotating about Earth as an external axis? We claim a Coriolis effect exists even though it doesn’t. We readily define other actions in physics as a fictitious forces. The notion of the Moon having Earths as its axis is far more accurate than claiming a fictitious force is acting when there is no force acting at all.
And why do we refer to a gun with a rotating barrel as a ‘revolver’? The barrel does revolve but it also rotates about an axle. The names takes away from the true nature of the gun, and that’s to fire bullets.
Whatever would we do without semantics?
“If the Moon was attached to Earth by a mechanical means, we could claim it is rotating about the Earth as an axis”
That would be an internal axis to the pair of bodies.
…but an external axis to the moon itself, which is the point.
> Whatever would we do without semantics?
Science, Gordo. Of the empirical kind.
Come on.
You do not even do semantics properly anyway.
Little Willy, please stop trolling.
Oh look… suddenly, the Moon rotates again, like Mars and Earth:
https://www.drroyspencer.com/2022/12/climate-sensitivity-from-1970-2021-warming-estimates/#comment-1413558
From https://www.cristos-vournas.com/
1. N.earth = 1/1 rotation per day, is Earths rotation spin
2. N.moon = 1/29.53 rotation per day, is Moon’s rotation spin
3. N.mars = 1/1.028 rotation per day, is Mars’s rotation spin
Vournas tries to butt-kiss the lunar spin deniers, by denying Moon’s spin, but he can’t erase anything out of his own blog :- )
binny…The first language of Christos is Greek. I have tried to use Google to translate English to Greek and it’s tough. I think Christos does remarkably well but I don’t expect him to get his English perfect.
We all make exceptions for you as well. Ho about cutting him some slack instead of digging through old posts trying to trip him up?
Robertson
Don’t try to kid us with Vournas’ or my native tongue.
Better try to understand my reply to Clint R:
https://www.drroyspencer.com/2022/12/uah-global-temperature-update-for-november-2022-0-17-deg-c/#comment-1414077
He CLEARLY use on his blog rotation and not orbiting numbers to demonstrate his rotational warming phenomenon.
But you will deny that because you deny ANYTHING that does not fit your egocentric narrative.
Bindidon still doesn’t understand CV is referring to “with respect to Sun”.
Most people familiar with orbital motions can understand CV, but poor Bin is lost in space. He’s just another braindead cult idiots trolling here.
See my reply downthread (the correctness of which you certainly will deny as usual, , like Robertson).
https://www.drroyspencer.com/2022/12/uah-global-temperature-update-for-november-2022-0-17-deg-c/#comment-1414077
maguff…”I personally would align my axes so that the x-axis coincides with the ramp. Theres enough information to calculate friction in terms of the x-direction component of weight”.
***
An x-y coordinate system is not needed for this problem. Simply created a freebody diagram with external forces replace by vectors. You can then create a vector diagram with included angles.
See Ross Mckikttrick;s data on Canadian Historical Temperatures going back as far as 1888. Less thanb a 1 degree rise over most of Canada. For Canadian Stations located next to the border with the US, temperaturesactually droped several degrees . See first 10 pages of Ross Mckittrick report. Found on googleat Historical Canadian Temperatures;
Marion Schneider
AlbuquerqueNew Mexico
DREMT,
“Rotate an object around point 0,0”
So your coordinate axes are in the centre of the Earth.
“forty-five degrees at a time. It will move as per the MOTL, and it does so in only one motion”
This is tying rotation to orbit, which agreed were separate.
In case I mistook you, you replied to RLH later on, when he said, “How come the Sun sees all sides of the Moon, but the Earth only one…”
You replied.
“because the moon is orbiting (motion like the MOTL).”
You are tying the Moon’s rotation to its orbit.
Same in the video. When the arm is locked the moon keeps one face to the Earth, but spins relative to the frame in which the apparatus sits – the nominal inertial frame of reference.
It always ends up being the same thing. The Moon is rotating relative to the fixed stars, and not rotating from the POV of the Earth.
It’s all about frame of reference.
I wonder if you will address my argument that you overlooked upthread.
Both moons orbit the earth in our GIF over 4 seconds.
We put a marker on the surface of the MOTL at the Northern most point in our GIF.
1 second: that marker has moved 90 degrees and is now facing the Western border of your monitor
2 seconds: the marker now faces South
3 Seconds: the marker now faces East
4 seconds: the marker faces North again
In 4 seconds the marker has seen every point on the compass.
The monitor borders is the frame of reference, we agree.
Now lets maintain that momentum relative to the monitor borders, but discontinue the orbit.
The MOTL is no longer orbiting, but the marker will still face every point on the compass in 4 seconds.
And because we are agreed that orbit and rotation are separate, you cannot argue that stopping the orbit changed anything, or you would have to contradict yourself.
Rather than doubling down on things you have already said, I am curious how you would refute this argument (and not a different one).
“This is tying rotation to orbit, which agreed were separate.”
No, barry, it’s rotating an object about an external axis, with no rotation about an internal axis. We’re not even getting onto the subject yet of whether an orbit is a “rotation about an external axis” or “translation in a circle”. This is just a demonstration for you that rotation about an external point (at 0,0) moves an object like the MOTL, in one single motion. That settles that argument. Agree?
“The monitor borders is the frame of reference, we agree.
Now lets maintain that momentum relative to the monitor borders, but discontinue the orbit.”
Lol, barry, your whole argument there is dependent on the orbit and axial rotation being separated the way you want them to be. If you “discontinue the orbit”, and you define “orbit” as a “translation in a circle”, then you are left with your object still rotating on its own axis. But, if you define “orbit” as a “rotation about an external axis”, then you are left with your object not rotating on its own axis when you stop the “orbit”.
There is no such thing as rotating about an external axis, only about an internal axis.
You can use the transmographer to rotate an object around a point that is external to the object. So, you are wrong again.
You can only rotate about an internal axis to the group of objects that contain it.
You are wrong, again.
Of course an object can have an external axis of rotation, Richard.
What you might mean is that one can consider the system as a whole as an object, Im which case the axis of rotation becomes internal to the system.
The trick here behind Gaslighting Grahams word game is to shift from object to system, like when he defines an orbit as involving a rotation that moves the Moon as she orbits.
“Of course an object can have an external axis of rotation, Richard”
What forces constrain that rotation? About what point do they operate? All axis are internal to the group of objects that contain them.
There is no force in geometry, Richard. Read what you said again. Notice how Gaslighting Graham responded.
I understand what you are trying to say. Gaslighting Graham is not here for any meeting of the mind. He is only here to troll about Dragon crank stuff.
I understand what RLH is trying to say, too…but it changes absolutely nothing about any of the arguments. It is a complete non-point. Just like most of what RLH says on the matter…
Gaslighting Graham gaslights a little more.
Little Willy, please stop trolling.
“This is just a demonstration for you that rotation about an external point (at 0,0) moves an object like the MOTL, in one single motion. That settles that argument. Agree?”
I’ll agree. That is indeed one legitimate way to describe MOTL (or MGR horse or car driving a circular track).
Conversely, I think you will agree that it is ALSO possible to describe MOTL (or the others above) as ‘translation in a circle + rotation about and internal axis’.
Mathematically these are two identical motions.
That leaves us with physics as the way to decided which is a ‘better’ description.
“If you ‘discontinue the orbit’, and you define ‘orbit’ as …”
This seems like a fruitful line of discussion. If we want to “maintain that momentum” then the simplest scenario seems to be to simply ‘turn off’ all forces and torques and let the object continue. It seems you agree that the object would keep moving straight forward and “you are left with your object still rotating on its own axis”.
On the other hand, if it is one motion as you suggest, then the only way to ‘discontinue the orbit’ would seen to be to pause the entire animation (eg to stop the MGR). But that violates the the spirit of “maintain that momentum relative to the monitor borders”.
Another option would be to think of a train car changing from a circular track to a straight track as a way to ‘discontinue the orbit’. The train car will indeed come out in a straight line with no rotation about its axis. This seems like a win for Team Non-Spinners, but there is a catch.
When circling, the two sets of wheels are providing torques about the COM — torques which cancel, so there is no net torque and no change in angular momentum about the COM. But as the train car comes out of the circle, the front wheels go straight first, removing the torque only on the front wheels. This provides a temporary torque to stop the rotation.
But an object on a low-friction bearing riding in the train car would continue to turn, because there is no torque.
So which description is more accurate for the actual moon?
(A) There are rails front and back that guide it around the orbit.
(B) There is a low-friction axle that guides the center around the orbit.
“I’ll agree. That is indeed one legitimate way to describe MOTL (or MGR horse or car driving a circular track)”
Thank you, Tim. That is all I wanted to discuss with barry, at this point. I just wanted him to understand that motion like the MOTL can be described as rotation about an external axis with no rotation about an internal axis, or translation in a circle with rotation about an internal axis.
So now, barry can argue against you, Nate, and Bindidon if he wants to.
If anyone else wants to address the rest of the points you made, they are more than welcome to. I intend focussing on only one thing at a time, until barry is up to speed on the basics. Tyson, as well, needs to learn. Entropic Man too, no doubt.
““That is all I wanted to discuss with barry, at this point. I just wanted him to understand that motion like the MOTL can be described as rotation about an external axis with no rotation about an internal axis, or translation in a circle with rotation about an internal axis.”
You moved the goalposts slightly. There is no ADDITIONAL rotation about an internal axis.
But by any normal definition of “rotation”, there is still rotation about the internal axis. The internal axis is moving, yes, but a vector from the center of the MOTL to any point on the edge is still a) constant length and b) changing orientation. (The MOTL is ALSO rotating about the point closest to the ‘earth’ or the leading edge or infinitely other points. An object can be rotating relative to many axis, just like an object can be translating relative to many origins.)
Or put another way, if the MOTL is rotating around the ‘stationary’ external axis through the earth, then it is necessarily ALSO rotating about the ‘moving’ internal axis through the center of the moon. (Much like if my car is translating relative to my house, it is ALSO translating relative all the neighbors’ houses, too).
No, Tim, you are the one now moving the goalposts.
To say that the MOTL is rotating on its own internal axis is to say that it is translating in a circle whilst rotating on its own internal axis. To say that the MOTL is not rotating on its own internal axis is to say that it is rotating about an external axis whilst not rotating on its own internal axis.
To say that the MOTL is translating in a circle is to say that it is also rotating on its own internal axis. To say that the MOTL is rotating about an external axis is to say that it is not rotating on its own internal axis.
It is as simple as that.
“To say that the MOTL is rotating about an external axis is to say that it is not rotating on its own internal axis.”
Suppose I show you some object. Suppose I define some axis. Your job is to tell me if the object is rotating about the axis. You don’t know how the object is held or if there are strings or bolts or frictionless axles.
How specifically would you determine if the object is rotating about my axis? If you can’t define what you mean by rotation, then you can definitively say whether or not it is rotating about that axis.
None of the Non-Spinners seem to be able to do this most basic task, which is foundational to the whole discussion.
I have given my abstract ‘vector of constant length and changing direction’ definition. And here is a concrete, operational approach. My smartphone has rotation sensors. If the sensors measure a rotation, then there is a rotation about the axes through the center of the sensors in the phone.
I cannot help you Tim until you can understand that the MOTL has only one axis of rotation. That is a statement of absolute truth. If you describe it as translating in a circle, then the axis of rotation goes through the moon itself. If you describe it as rotating about an external axis, then the axis of rotation goes through the Earth. Either way, there is only one axis of rotation. I have gone to the ends of the Earth to demonstrate this. So did Ftop_t. There is nothing more I can say, nothing more I can do.
“That is a statement of absolute truth. ”
Define “rotation about an axis” before trying to pontificate about rotation. If this is ‘absolute truth’ then you should have no problem telling is the ‘absolute definition’ of rotation.
When you say “If you describe it as rotating about an external axis, then the axis of rotation goes through the Earth” then you have already lost. You can’t describe the moon this way, because it is not moving in a circle around that axis.
“Or put another way, if the MOTL is rotating around the stationary external axis through the earth, then it is necessarily ALSO rotating about the moving internal axis through the center of the moon. (Much like if my car is translating relative to my house, it is ALSO translating relative all the neighbors houses, too).”
This is a good, scientific argument, Tim.
I note that DREMT responds without any logic but again simply asserts his personal unsubstantiated belief:
“I cannot help you Tim until you can understand that the MOTL has only one axis of rotation.”
It has been demonstrated by:
The transmographer.
Ftop_t’s mathematical proof.
Ftop_t’s Desmos examples.
Reference to various texts on kinematics.
The CSAItruth video plus XY Plotter counter-example.
That’s just off the top of my head, for now.
The transmographer hides the spin by fixating the Moon to the clock arm, thus turning the whole system into one object.
Flop could not even create a model where the line stayed on the Moon body all the time, and he tried to stretch it without telling anyone, which breaks isometry.
There is nothing else to this scam.
Gaslighting Graham gaslights a little more.
Lol.
Tim said, quoting me:
"“This is just a demonstration for you that rotation about an external point (at 0,0) moves an object like the MOTL, in one single motion. That settles that argument. Agree?”
I’ll agree. That is indeed one legitimate way to describe MOTL (or MGR horse or car driving a circular track)."
So he is agreeing that an object can move like the MOTL in one single motion. "One single motion" means "rotation about an external axis with no rotation about an internal axis". There’s no two ways about it…but because Tim wants to keep one foot in the Exit door, just in case, he starts to argue with himself!
Well, I’m not having it this time. He said he agreed, and I’m going to hold him to that. The MOTL can be described as moving in one single motion, which means no rotation about an internal axis. That’s what he conceded.
Gaslighting Graham gently gaslights a little more:
[TIM] Mathematically these are two identical motions.
[GG] So he is agreeing that an object can move like the MOTL in one single motion.
[ALSO GG] the MOTL has only one axis of rotation
Perhaps Gaslighting Graham has a different concept of mathematical equivalence?
Here is the link between all the statements. Are you paying attention, Little Willy?
"[TIM] Mathematically these are two identical motions."
Tim is referring to "translation in a circle plus rotation about an internal axis" and "rotation about an external axis with no rotation about an internal axis". In both cases, note that there is only one axis of rotation.
"[GG] So he is agreeing that an object can move like the MOTL in one single motion."
He did, by saying "I’ll agree" to a statement I made about the MOTL moving in one single motion.
"[ALSO GG] the MOTL has only one axis of rotation"
Which is correct, if you paid attention to what I wrote above.
“Ftop_ts mathematical proof.
Ftop_ts Desmos examples.”
FTOP is a science denier. Hence you accept him as an authority figure without being able to understand or back up his assertions.
His programmed orbits never behaved like real orbits, ie speeding up at the apogee and slowing down at perigee.
It was always obfuscation.
"[GG] So he is agreeing that an object can move like the MOTL in one single motion."
He did, by saying "I’ll agree" to a statement I made about the MOTL moving in one single motion.
"[ALSO GG] the MOTL has only one axis of rotation"
Which is correct, if you paid attention to what I wrote above.
Gaslighting Graham gently gaslight a little more.
With the 1+1 trick, Moon Dragon cranks make the Moon spin as it orbits. Spin and orbit go hand in hand. They are not independent.
Gravity simply does not work that way.
Hence why Gaslighting Graham refuses to engage on physics with Tim.
All wrong, Little Willy. In fact, you have moved further and further away from your initial comments on this subject, where you seemed to at least appreciate the problem could be looked at in more than one way. You now seem to look upon the “Spinner” version of “orbit without spin” as being the one and only way it can be seen. Hence you keep trying to say that the “Non-Spinners” are “adding spin to their definition of “orbit”” rather than simply seeing it as a different version of “orbit without spin”, to which “spin” must be kept separate.
Gaslighting Graham gaslights a bit more.
Descriptions of a motion must be equivalent or one of them does not describe a motion properly. Tim gets that. Graham pretends he does, until he rejects that equivalence for pure trolling effect.
So at best Moon Dragon cranks can only get a draw out of this. And to get that draw they need to settle their geometry among themselves. They also need to provide an equivalent physics,
Gaslighting Graham always skip that last bit.
To proceed in this argument in any way, the "Spinners" first need to settle their many, many differences amongst themselves.
Some agree with the "Non-Spinners" that the ball on a string does not rotate on its own axis. Some avidly disagree.
Some agree that "rotation about an external axis with no rotation about an internal axis" is motion like the MOTL. Some avidly disagree, and claim it is like the MOTR.
Some agree that reference frames do not resolve the moon issue. Some avidly disagree.
Some agree that "revolution/orbit" is defined as rotation about an external axis. Some avidly disagree.
The "Spinners" really are a complete mess of disagreement amongst themselves.
Notice how Gaslighting Graham dodges your point about physics, Tim.
It is as if Moon Dragon cranks knew that they had no physics leg to stand on.
Which means they are only trolling.
Conveniently, DREMT always refuses to address this point:
“That leaves us with physics as the way to decided which is a better description.”
Which I explained this way:
“Astronomy and physics has sought to describe motion in the simplest and most useful way possible. And early on it was motion of the planets that they sought to describe.
Having an object simply ROTATE around a point will NEVER EVER produce an elliptical orbit. And trying to use this method will needlessly complicate describing planetary orbits and rotations.
THUS, physicists and astronomers found that simplest and the most useful way of describing planetary motion was to describe orbital motion as movement of the COM on a path, like the way an XY plotter pen is moved, and to SEPARATELY describe ROTATION of planets around any axis passing through the COM.
Again, I would simply challenge the non-spinners to show us a different way that is both simpler and more useful.
If they cant, then they SHOULD acknowledge that what Astronomy has been doing for 400 years is likely the BEST approach.”
Little Willy, I was quite open about not responding to Tim’s further points. You see, I am trying to talk to barry. barry, like Tyson, seems to have a problem understanding that “rotation about an external axis with no rotation about an internal axis” is motion like the MOTL. Presumably, then, he must have thought it was motion like the MOTR. That is incorrect. As Tim, Nate, and Bindidon agree. Presumably you are going to say you agree, too, despite you having argued the opposite in the past.
” I was quite open about not responding to Tims further points.”
Because settling the moon issue runs strongly against DREMTs interest to keep this argument going indefinitely..
And so Gaslighting Graham gently gaslights a little more.
Am I not allowed to just talk to barry, about whatever I choose to talk about?
Of course you are. But others have the freedom to make repeated efforts to get you to acknowledge this point that would end the Moon debate.
And people are free to ask why you keep evading this point?
Gaslighting Graham gets called out for dodging the main point made by Tim, omits to mention that it defeats whatever silly semantic game he likes to play, and then plays victim.
And no – one does not simply ignore the very reason why Moon Dragon cranks are discussing these definitions in the first place.
I get to do as I please. Sorry.
Bindidon agrees on the top 3) items:
https://www.drroyspencer.com/2022/12/uah-global-temperature-update-for-november-2022-0-17-deg-c/#comment-1409168
Tim and Nate also agree on 2).
[Smug grin].
What are non-partisans to make of DREMTs refusal to deal with the main issue that could end the Moon debate?
Is he afraid? Knows he has no sensible response?
Is he a loser? Just here to troll? Does he have any integrity?
What say you neutrals?
Gaslighting Graham gaslights a bit less now.
“Lol, barry, your whole argument there is dependent on the orbit and axial rotation being separated the way you want them to be.”
Ahem:
DRRMT: “Now youre getting it, RLH. The two motions are separate from one another. There’s “orbital motion”, or “orbit”, or “orbit without spin”, or “orbital motion without axial rotation” (all meaning exactly the same thing), which is motion like the “moon on the left”. Then there is “axial rotation”. You have to keep the two motions separate from one another.”
https://www.drroyspencer.com/2022/12/uah-global-temperature-update-for-november-2022-0-17-deg-c/#comment-1411990
Orbit and rotation are separate items.
but to make your argument that the moon doesn’t rotate you, DEMT, keep tying the motions together.
barry: “For the purpose of argument the 4 sides of my monitor are an inertial reference frame, analogous to the fixed stars.”
DREMT: “Well done, barry. I would agree.”
https://www.drroyspencer.com/2022/12/uah-global-temperature-update-for-november-2022-0-17-deg-c/#comment-1412189
Then, WRT to the inertial reference frame, the MOTL is rotating.
Because it turns to face each side of the monitor.
In order for it NOT to rotate WRT to the inertial frame it would have to maintain its orientation WRT to the 4 sides of the monitor.
The MOTL does not do that. The MOTR does.
Your POV is based on the erroneous view that the Moon’s orbit is tied to its rotation.
This POV makes the orbit the reference frame (or rather, the Earth), instead of making the reference frame the fixed stars.
You keep saying that reference frames don’t ‘solve’ the argument. That assertion has not been demonstrated. Reference frames disprove your POV and therefore you want to sweep that aspect under the carpet.
It’s precisely why you have not addressed my argument and merely repeated yours. No, you really haven’t given any reason why reference frames are not sufficient to meet the matter. You’ve merely said your same stuff and then as an addendum said reference frames don’t matter. you don’t give any real reason why.
Thanks, barry. Your comment now neatly leads into the comment I already had lined up for you, below.
I am not tying orbit and spin together. I just have a different view on what orbit is (which happens to be the correct view). Spin is then separate to that.
You will not understand the point about reference frames until you understand rotation about an external axis, translation in a circle, and the difference between them.
You are not going to listen to me no matter what I say, so I think I will save my breath, beyond that.
Cheers.
barry, you won’t listen to me, but do you value Bindidon’s opinion?
[BARRY] It always ends up being the same thing. The Moon is rotating relative to the fixed stars, and not rotating from the POV of the Earth.
It’s all about frame of reference.
[BINDIDON] I have always agreed upon the evidence that a rotating celestial body always rotates, independently of the point in space from which it is observed, and independently of the reference frame used to describe its motion
* I suspect you to misuse what I agree upon, with the intention to suggest that a celestial body rotating wrt a reference frame RF1 wight very well not rotate wrt another reference frame RF2.
This would be utterly wrong.
Rotating frames are different to fixed frames. One is inertial, the other is not.
Indeed…and still, reference frames do not resolve the moon issue.
So do not confuse rotating frames with fixed orientation frames.
I do not…but thanks for the advice.
Indeed, Richard.
And only physics can resolve the issue, as Tim and I keep underlining, but Moon Dragon cranks keep denying.
One has to wonder how Gaslighting Graham would resolve the issue, or if he ever would.
“This is just a demonstration for you that rotation about an external point (at 0,0) moves an object like the MOTL, in one single motion. That settles that argument. ”
How can DREMT say this ‘settles the argument’ when HE has so often admitted that this motion can be described in TWO ways:
“1) Rotation about an external axis with no rotation about an internal axis.
2) Translation in a circle whilst rotating about an internal axis.
And FURTHERMORE, he has made a strong case that the mechanics determine which way is most appropriate:
“However, mechanically, the motion of the chalk circle is best described by 1). Thats what is physically happening, after all.”
Indeed so, since the ‘chalk circle’ mechanically is PART OF a rotating disk.
Not so for the MOTL. It is an independent body free to rotate on any internal axis.
In another case with that same mechanics, DREMT has clearly stated:
” In your scenario, 2) is appropriate, since that accurately describes the mechanics of the situation.”
That one is easy, Nate –
Gaslighting Graham could dissolve *any* issue with an if-by-whiskey.
To define problems away always works.
This might become problematic when you want to discover something about the world.
But Moon Dragon cranks are more into the trolling business than discovery mode.
Just a reminder, to whomsoever it may concern, that:
a) "Orbital motion without axial rotation" is motion like the "moon on the right"
does not follow from:
b) Objects in orbit are free to rotate on their own axes, or not.
Claiming that a) follows from b) is a non-sequitur, because "orbital motion without axial rotation" could be motion like the "moon on the left", and objects still be free to rotate on their own axes, or not, separate to that motion.
And yet somehow this again COMPLETELY FAILS to address the contradictory evidence found in HIS OWN WORDS:
“In your scenario, 2) is appropriate, since that accurately describes the mechanics of the situation.”
And if so, then the MOTL with exactly the SAME MECHANICS has axial rotation, and THAT does imply that the MOTR has no axial rotation.
This is pretty simple.
Apparently some people believe that the mechanics of “orbital motion” are “exactly the same” as a wooden horse mounted on a frictionless axle on the back of a truck, and then driven in a circle…
…there is no talking to some people. That is why I no longer directly respond to them.
The mechanics of having a body on 1) a frictionless axle, allows it to freely rotate on this axis.
The mechanics of 2) a body bolted to a rotating disk prevent it from rotating independently from the disk.
The ONLY difference in the mechanics of these two situation is whether there is the freedom to rotate on an internal axis.
An independent orbiting body, not mounted to a rotating disk, has this same mechanics as (1), it is free to rotate on an internal axis.
In fact it is free to rotate on ANY axis, and the planets indeed demonstrate this freedom.
This is pretty simple.
See what I mean?
If you mean that you cannot understand this SIMPLE logic, and have NO sensible alternative explanation, then yes, I see what you mean.
“Apparently some people believe that the mechanics of orbital motion are exactly the same as a wooden horse mounted on a frictionless axle on the back of a truck, and then driven in a circle”
Apparently you don’t understand us at all. We just think it is a pretty good analogy.
Our analogy can not only accurately model a perfectly circular orbit, it can ALSO accurately model an elliptical orbit, by driving the truck at varying speeds around the track. Your ‘rotation about the center’ fails utterly for the second.
https://www.drroyspencer.com/2022/12/uah-global-temperature-update-for-november-2022-0-17-deg-c/#comment-1413920
You still haven’t addressed the issue of elliptical orbits — ie all actual orbits.
What would you say is “orbital motion without axial rotation” for a moon in a highly elliptical orbit? We all have a trivial answer — any point on such a moon would face the same star throughout the orbit.
As far as I know, you have never given an answer.
* Would one point always face the earth?
* Would one point always face forward along the ellipse?
* Would one point always face the center of the ellipse?
* Other?
Change orientation at a constant rate, move through the orbit at varying rates. One single, yet complex, motion.
“Change orientation at a constant rate, move through the orbit at varying rates. ”
This sentence clearly describes TWO motions. A constant ROTATION and a varying TRANSLATION.
Anyone labeling this a SINGLE MOTION is delusional and in deep denial.
tim…”You still havent addressed the issue of elliptical orbits ie all actual orbits”.
***
I explained the elliptical orbit in detail and you failed to offer a detailed response. You simply dismissed my offering with an arrogance that can only come from a narrow mind.
“I explained the elliptical orbit in detail …”
Yes, you did. And I have responded. Your hypothesis is clever but clever does not make it right. You have an ad hoc proposal with no physical basis. It comes close to predicting the correct motion. (Much better, for example, than “one side always directly toward the earh”.) But still not correct.
When the moon passes the semi-minor axis, your bisector method would predict that the moon has turned 90 degrees from perigee; the face than had been directly toward earth would be directly toward the center of the ellipse. In fact, the moon will have turned LESS THAN 90 degrees at this point.
To paraphrase Feynman, no matter how clever the theory, if it doesn’t agree with reality, then then theory must be discarded.
Apparently some Moon Dragon cranks claim that mechanics cannot be reduced to a definition game but *still* pretend that one needs no physics to solve a physics problem.
Gaslighting Graham has no real bottom. He is just like Pup, but with a more Machiavellian facade.
Sure, I’m the “bad guy” in the movie that plays inside your little head. In reality, I’m just some random who disagrees with you on trivial issues.
Meet me in the middle, says the Gaslighting Man.
Tim takes a step forward.
The Gaslighting Man thanks Tim, then takes a step back.
Meet me in the middle, repeats the Gaslighting Man.
Meet me in the middle, says Gaslighting Man.
Tim takes a step forward.
Gaslighting Man thanks him, then takes a step back.
Meet me in the middle, repeats Gaslighting Man.
Not at all. Tim agreed with me on a basic point about kinematics, which barry and Tyson dispute. barry and Tyson can now argue with Tim about that, rather than me. Oh, the joy!
No real bottom:
https://www.drroyspencer.com/2022/12/uah-global-temperature-update-for-november-2022-0-17-deg-c/#comment-1413956
Gaslighting Graham soldiers on.
“Oh, the joy!”
Oh the lack of integrity!
Little Willy, please stop trolling.
“‘orbital motion without axial rotation’ could be motion like the ‘moon on the left'”
No it can’t. That purely describes MOTR.
Lol, whatever you assert, RLH. Whatever you assert.
rlh…MOTR describes the motion of a Ferris wheel gondola.
Do you have those in the UK?
https://www.smithsonianmag.com/history/history-ferris-wheel-180955300/
An axle would be required on MOTR to allow such motion while keeping the device upright.
Come on, Gordo.
A Ferris wheel destroys the CSA Truther trick:
It shows that orbit and spin are independent.
You sure you want to go there?
Everyone agrees that orbit and spin are independent, Little Willy.
[GASLIGHTING GRAHAM] Everyone agrees that orbit and spin are independent
[ALSO GASLIGHTING GRAHAM] Change orientation at a constant rate, move through the orbit at varying rates. One single, yet complex, motion.
Exactly. One single motion, which “spin” is separate from and independent to.
Gaslighting Graham puts the spin in the orbit, and then calls them independent.
And so Gaslighting Graham gently gaslights a little more.
No, Little Willy. “Spin” is separate from “orbit”. We just have different ideas on what “orbit” is.
[GASLIGHTING GRAHAM] “Spin” is separate from “orbit”.
[ALSO GASLIGHTING GRAHAM] One single, yet complex, motion.
No wonder he can’t grok Tim’s point.
Yes, one single motion, that is separate from "spin". Do you have a learning disability?
Gaslighting Graham cranks up his gaslighting:
https://tinyurl.com/holy-Madhavi
Gaslighting Graham thus includes the rotation usually attributed to the Moon’s spin into his idiosyncratic notion of orbit.
Little Willy, please stop trolling.
“Lol, whatever you assert, RLH. Whatever you assert.”
And why can’t the same be said for you, DREMT?
Let remind readers that what started this kerfuffle was this comment:
https://www.drroyspencer.com/2022/12/uah-global-temperature-update-for-november-2022-0-17-deg-c/#comment-1411760
Barry was responding to the claim that the Moon *cannot* spin and orbit while being in a 1:1 spin-orbit lock.
The issue was about facts, not definitions.
But even if we follow Gaslighting Graham on definitions, then his claim does not cohere with what Tim said, and with which Gaslighting Graham agreed.
Odd, that.
There is no need for a kerfuffle. I could just be left to talk to barry.
If Tim is right, the Moon *can* spin and orbit in a 1:1 spin-orbit lock.
Gaslighting Graham agrees with Tim, and he denies that the Moon *can* spin in a spin-orbit lock.
Gaslighting Graham soldiers on.
Little Willy, please stop trolling.
Gordon Robertson, where’s your evidence that the Moon does not spin? Evidence that it does include:
1) Wikipedia Tidal locking GIF… https://en.wikipedia.org/wiki/Tidal_locking#/media/File:Tidal_locking_of_the_Moon_with_the_Earth.gif
2) NASA Tidal locking video… https://moon.nasa.gov/internal_resources/549/
3) NASA video of the Moon rotating beneath LRO… https://svs.gsfc.nasa.gov/vis/a000000/a003400/a003453/lro_track_month.mp4
Evidence in this case means information, facts or data. Opinions, feelings, value judgments, or beliefs don’t count.
You can also add Nates point about the Moon Souths pole:
https://www.drroyspencer.com/2022/12/uah-global-temperature-update-for-november-2022-0-17-deg-c/#comment-1413910
And Tims point about libration:
https://www.drroyspencer.com/2022/12/uah-global-temperature-update-for-november-2022-0-17-deg-c/#comment-1411699
Not that it *settles* anything, mind you.
Nothing does.
Ever.
Unironically.
Yes Willard, evidence of the Moon’s rotation abounds, by any definition.
maguff…you are using appeals to authority whereas I have laid out a scientific analysis using calculus, trig, and basic engineering reasoning.
You have failed to respond to my analysis with a rebuttal of the science.
I’ve never been to the Moon so I consult those who have. I stand on the shoulders of giants.
maguff…with respect to 1) above I have invited you and others to download the free app Irfanview and load the left gif file in it. There is a feature on Irfanview for removing the individual jpg files that make up the gif sequence.
By going through the jpeg stills one by one you can plainly see what I am trying to convey. Pick a spot on the inner face of the gif Moon and verify that the spot and all spots on the Moon are moving in concentric circles at all times. In that case, it is impossible for the Moon to rotate about a local axis.
2) proves the non-spinner POV. Look at the smiley part of the Moon face, it is moving in a circle. Now look at the outer edge, which is also moving in a circle. All points on the smiley face are moving in concentric circles.
The right gif represents a car on a ferris wheel. It has to be on an axle for it to work. The car on a Ferris wheel has an axle to enable the chair to remain upright at all times.
The animators at NASA are frauds, or just plain stupid. In another vid, they show the Sun shining on the Moon and use the shadow cast to suggest the Moon is rotating about a local axis. They could have included a radial line on the Moon showing it always pointed at Earth but instead they fraudulently showed a moving shadow.
re 3)…Tim is lost in his own mind (thought experiments). He has a problem letting go of his ideas and thought experiments and ***LOOKING*** at the actual problem.
I explained libration clearly and Newton covered it in a far more detailed manner in Principia.
Get ready for a word count, maguff, these explanations have to be lengthy due to the detail required.
Consider the Moon at either end of the elliptical major axis. A radial line from the near face points at Earth’s centre exactly as it does in a circle. There is no libration at either of those points.
We (you and I) both surely understand that with a pure circular orbit, a radial line between Earth’s centre and Moon’s centre must coincide. That is true on an elliptical orbit ONLY at either end of the major axis. In between, a radial line projecting from the Moon varies a few degrees either side of a line connected Earth’s centre at the major focal point and the lunar centre.
That variance is longitudinal libration and it has nothing to do with the Moon rotating on a local axis. It is completely explained by the lunar motion in its orbit.
As you know, the Moon always keeps the same face pointed at Earth. If the Moon’s momentum was ideal, it’s interaction with Earth’s gravity would produce a circular orbit. However, when the orbit was formed, the Moon’s momentum was a little too much for Earth’s gravity to counter-balance it. Therefore, it extended the orbit into a slight ellipse before Earth’s gravity was able to pull it back into orbit.
The basis of libration is a a very slightly varying gravitational field strength. This is a form of ‘bend but don’t break’ situation. Obviously, when the Moon was captured, it was trying to move in a straight line and Earth’s gravity pulled it into an elliptical orbit. A little more momentum and the Moon would have broken free, continuing along a straight line.
Any body moving along a curved path has a radial line defined at any instant by a circle with an arc that coincides with the path. There is a clever way of calculating that radial line using chords to the path.
Fortunately, on an ellipse, there is a much easier method. If lines are drawn from each focal point to the Moon, the bisector of the angle formed is the radial line.
Try it!!!!!
See that the radial line points at different angles to a line between Earth’s centre at the major focus and the Moon’s centre. The angle formed between those two lines is longitudinal libration and it is a property of the orbital path, not lunar rotation.
The whole point of the exercise is that the radial line points from the near face tangential plane toward Earth. It is indicating in which direction the near face points. Due to orbital properties, it points a few degrees either side of perpendicular, allowing us to see a few degrees around one side of the Moon.
Come on, Gordo.
There is no need for any wall of words to explain longitudinal libration:
https://fr.m.wikipedia.org/wiki/Libration_lunaire#/media/Fichier%3ALibration_longitude4.png
This is only one of the four types of libration.
And you are defeating Gaslighting Grahams point about rotation, for admitting that there are two foci should compel you to explain away the Moon spin by some pure rotation included in its orbit.
Fun fact: Little Willy agrees that there is rotation involved in “orbit”.
That means he must agree that the object changes orientation whilst orbiting, and that this is separate and independent from “spin”.
Which, of the two possible options, means he agrees that “orbit without spin” is as per the MOTL.
Another fun fact: Gaslighting Graham got another implication backassward.
Whatever you say, Secret “Non-Spinner”.
Your secret is safe with me.
Readers might need a hint to appreciate Gaslighting Graham’s blunder:
https://en.wikipedia.org/wiki/File:Pluto-Charon_System.gif
This is neither the MOTR nor the MOTL.
Except that Charon keeps one face always oriented towards Pluto, and vice versa. So it is motion like the MOTL, doubled. It certainly has absolutely no connection to the MOTR.
Final fun fact: Gaslighting Graham still fails to realize that the Earth in his pet GIF does not replicate what Pluto does.
One day it will, but for now it does not.
Fully aware that the Earth doesn’t replicate what Pluto does, in the GIF. Or in reality. The Earth in the GIF is not even shown as rotating on its own axis.
The Pluto-Charon GIF is still much, much more like the MOTL than the MOTR. As any sane, rational human being would agree.
Gaslighting Graham gently gaslights a little more.
Little Willy, please stop trolling.
Gordon, your model is vague.
I don’t see how you are finding the Moon’s orientation wrt Earth. What are you assuming its orientation is doing wrt the stars as it orbits?
In the standard science model of longitudinal libration, the Moon’s orientation wrt the stars is changing uniformly in time. IOW it is rotating at a constant rate (because its spin angular momentum is constant).
Its orbital angular position is not changing uniformly in time. Its angular velocity is speeding up and slowing down.
This difference in the rotation rate, and orbital angular velocity leads to longitudinal libration.
And it clearly shows that its rotation and orbital motion are two independent motions.
Robertson
” I explained libration clearly and Newton covered it in a far more detailed manner in Principia. ”
Show us what Newton wrote about libration in Principia – elsewhere than he did in Book III, Prop. XVII, Theor. XV, because that place I perfectly know !!!
-16.2C at Campbell River. It breaks the 1990 record of -14C.
Global Warming? Not.
It’s -23C in Rapid City. Feels like -44C.
Ever get over to Sioux Falls? That’s where Mary Hart grew up.
Nope. That’s clear on the other side of the state, I stick to the hills, the Black Hills that is.
I’ll have to get down that way and have a beer with you, so we can debate this properly. Of course, we’d likely get thrown out of the bar.
Surprising for Campbell River. It’s ***ONLY*** -5C or so on our side of the pond. Wonder how much heat is being retained by infrastructure in the bigger city?
Ken
Why do you always look at cold places only?
Campbell river was a forest in beginning of 20th century.
Global warming or cooling is a thing of centuries.
Or it something they average over 30 years, and they should average over a period of +60 years.
It has been shown that NONE of the braindead cult idiots understand the basic science involved. I presented about a half dozen basic physics problems that NONE of them were able answer correctly. Only a couple even tried. They avoided the simple problems like they avoid reality.
The easy-to-understand debunk of lunar rotation comes with understanding what “orbital motion without axial rotation” looks like. IOW, if a moon is orbiting but NOT rotating, what would look like?
Well, we know from the simple ball-on-a-string that one side would always keep facing the inside of the orbit. Just like Moon.
The more advanced, harder-to-understand debunk involves vectors. But, that’s over the head of the braindead cult idiots.
The cult does not know science, and they don’t want to learn. So, here’s a challenge for TM, troll Nate, Bindidon, fraudkerts, willard, barry, and Ken:
What is the change in angle of the imaginary spin axis, based on the angles give by your cult, between the high and low points of Moon’s orbit?
If you can’t answer, you don’t even understand the basics.
That is not a challenge, Pup.
Here is a challenge:
https://www.drroyspencer.com/2022/12/uah-global-temperature-update-for-november-2022-0-17-deg-c/#comment-1413802
Do the Poll Dance Experiment.
clint…”The cult does not know science, and they dont want to learn”.
***
What’s even more sad is that most of them are also climate alarmists. I regard this exercise on the Moon to be representative of their inability to understand science without resorting to authority figures, ridiculous thought-experiments, and illogical conclusions.
Yes, the Moon discussion is exactly analogous to the GHE discussion. They don’t have a clue about the science. Often, the idiots don’t even know there own cult nonsense. When I asked one (who represents himself as a PhD-physics) to describe the GHE, he implied that because a hot vacuum tube could burn your fingers, that was “proof” of the GHE.
Idiot.
I recall the hot vacuum tube insinuation. I pointed out at the time that the glass was warmed directly by the heater element in the tube via conduction between the heater pins and the glass.
The heater in the tube is connected directly to the outside world in order to feed it the current required to make it glow red and emit an electron cloud. To reach the outside word it must pass through a sealed glass envelope. Therefore, heat from the red-hot filament can flow easily to the outside world, transferring heat to the glass.
The heat not only affects the glass, it heats up the bakelite tube socket to the point it can break down from heat. Mind you, there are other currents flowing, like from cathode to plate, that can heat the glass as well. Some tube sockets were made from ceramic to better deal with the heat.
“we know from the simple ball-on-a-string that one side would always keep facing the inside of the orbit”
A ball-on-a-string has NOTHING to do with orbits.
I didn’t mean to leave you out, troll RLH.
The cult does not know science, and they don’t want to learn. So, here’s a challenge for TM, troll Nate, Bindidon, fraudkerts, willard, barry, RLH, and Ken:
What is the change in angle of the imaginary spin axis, based on the angles give by your cult, between the high and low points of Moon’s orbit?
If you can’t answer, you don’t even understand the basics.
(Feel better now, RLH?)
A ball-on-a-string has NOTHING to do with orbits.
rlh…a ball on a string has a lot to do with its own orbit. Just so happens there is a lot in common between the BoS and the lunar orbit.
In electronics, some people feel the need to use an analogy of water running through a pipe. You would likely offer that such an analogy has nothing to do with current flow in a copper wire, and you’d be right. However, the water through a pipe analogy helps people visualize what is going on in a copper wire with electrons.
The BoS is simply an analogy to help visualize the Moon always keeping the same face pointed at Earth. I think the reason it disturbs you so much is its simplicity. It so aptly defuses the spinner lame argument that the Moon can rotate on a local axis while keeping the same face pointed at Earth.
A-ball-on-a-string only produces pure circles. Orbits are almost never pure circles.
Actually, the orbit of the BoS has to be elliptical. You have keep exerting a force to keep it moving as well as a slight vertical force to stop it from falling. The force causes it to move in an elliptical orbit, albeit slightly.
Actually, when you’re rotating the ball, the orbit is slightly elevated to compensate for gravity, and elliptical to apply the force to keep it moving.
I think Isaac may have covered that in Principia.
A-ball-on-a-string has a fixed length of string which, by definition, means a circle.
“What is the change in angle of the imaginary spin axis, based on the angles give by your cult, between the high and low points of Moons orbit?”
Troll Clint was asked politely to clarify this indecipherable question. Here he has the opportunity, but instead just restates it verbatim!
Looks like has no interest in getting a real answer. That serves his trolling needs.
Heres’s some guidance.
What are ‘high and low points’ of the orbit?
Change in angle of spin axis? Relative to what?
What are ‘angles given by your cult’ ?
Good obfuscation, Nate. Reveals you have not the slightest idea of what you are talking about.
Ok Gordon, lets see if you can interpret the question and answer mine..
Bear in mind the observations of Astronomy show that the rotational axis is tilted 6.7 degrees to the orbital axis.
What would that mean for the horse on the the MGR? The horse would be mounted on pole that is tilted, initially, OUTWARD, 6.7 degrees.
Suppose the pole is pointed at the Moon initially.
When the MGR rotates 180 degrees, the pole must now be tilted INWARD 6.7 degrees. Thus it is still pointed at the Moon. It must point at the Moon always as the MGR rotates around the pole, which is its axis of rotation.
Going back now to what our Moon is doing in its orbit. On one side of the Orbit, the N Pole will tilt outward away from the Earth. While 180 degrees later in the Orbit, the N pole will tilt inward toward the Earth.
This accounts for PART of the libration of the Moon.
Once again, if you guys can SHOW EVIDENCE that the Astronomy results are wrong, than show it now.
Otherwise we will know that you guys are just blowing smoke.
SO we can conclude that Clint refuses to even bother to clarify his vague question, because he has no interest in getting an answer.
His gotcha questions are purely for trolling purposes, nothing else.
Troll Nate, it’s no wonder your cult can’t understand the simple question. NONE of you understands any of this.
If you stop commenting (trolling) here for 60 days, I will explain both the question and the answer.
But, you have no interest in learning. Trolling is more important to you.
Once again, you don’t understand how the free market works. To get a buyer, you have to be selling something of value.
Your nonsense has no value to me.
I understand Nate — science is nonsense to you.
That’s why you’re a braindead cult idiot posing as an anonymous troll.
More importantly, Pup, for it to be a real bet you got to put skin in the game.
Like I did here:
https://www.drroyspencer.com/2022/12/uah-global-temperature-update-for-november-2022-0-17-deg-c/#comment-1413966
You suck a trolling, which sucks for you because it is all you do.
Little Willy, please stop trolling.
The Moon “argument” is not like the argument about the climate change effects of AGW.
All the data about the Moon’s rotation is in. There’s even a satellite in a, fixed wrt stars, polar orbit filming the Moon as it spins beneath it, and its ground track is publicly available in near real time. This is settled.
On the other hand, although climate science is nearly 200 years old, the AGW experiment is ongoing. The signal is slowly emerging from the natural variability noise and all we can do for now is model it. There is uncertainty in the modeled predictions but not in the science.
Every time you claim that the moon issue is settled by the LRO, you actually prove, to those who understand it, that you do not understand the moon issue.
Q.E.D.
Yes, it’s a sore subject for you because you want to move the goalposts.
Remember when you said this?
December 7, 2022 at 4:22 PM
“I don’t actually care about the moon’s spin anything like as much as I care about two subjects, …
1) Rotation about an external axis, with no rotation about an internal axis, is motion like the “moon on the left”.
2) Reference frames do not resolve the moon issue.
I think it is far more interesting the way people respond to points on those two subjects than to hear their opinions on the moon itself.”
What I said there is very true. If you understood 1) and 2), you would probably not be confused about the LRO…and it is indeed interesting to watch you fail to understand. Thanks for the reminder.
Indeed, Tyson.
Nate had an explanation as to why:
https://www.drroyspencer.com/2022/12/uah-global-temperature-update-for-november-2022-0-17-deg-c/#comment-1414512
Little Willy, please stop trolling.
Readers might also like a flashback to the early days of the Moon rotation argument.
From April 6, 2018…
Readers can probably guess who wrote that!
So, yes. LRO and the many other lines of evidence provided since, settle it.
Q. E. D.
"Readers can probably guess who wrote that!"
Not me.
Q.E.D.
Easy, Tyson.
Caps lock.
Appeal to religiosity.
That’s Pup.
TM, that quote is mostly correct, except for the “tidal locking” nonsense. Tidal locking for Moon doesn’t work. Moon does NOT rotate, but it’s NOT because of “tidal locking”.
Your homework assignment is to go back and find my comment that contains “Tidal Locking, Debunked”.
Is it the comment in which you were trying to correct Graham because he admits that tidal locking is a thing, Pup?
Not everything is about me, Little Willy.
Yeah, must be that one, Pup.
Little Willy, please stop trolling.
Every time you appeal to consilience of evidence, Tyson, Gaslighting Graham responds with his NO ONE SINGLE PROOF stupid line of defense.
Do you think he ever did any scientific research?
To those who understand the debate, the LRO is not even a piece of evidence one way or the other! So delicious to see bad people fail over and over again.
maguff…”All the data about the Moons rotation is in. Theres even a satellite in a, fixed wrt stars, polar orbit filming the Moon as it spins beneath it, and its ground track is publicly available in near real time. This is settled”.
***
It’s settled alright but not in the way you think. The LRO is deigned to create an artificial reference orientation that aligns it with the stars using gyros. Therefore, it is looking at the Moon from the perspective of the stars and sees a motion.
Of course, the motion it is seeing is a planet constantly re-orienting as it performs curvilinear motion around the Earth wrt to the same stars to which the LRO is referenced. Same as a ball on a string, a car driving around an oval, a wooden horse bolted to the floor of a carousel, a locomotive running around a rail oval, or an airliner circumnavigating the Earth around the Equator while maintaining an altitude of 35,000 feet.
Maguff, please don’t go out in the Black Hills with your sense of orientation, you’ll become hopelessly lost.
“…you’ll become hopelessly lost.”
May I remind you that non-spinners are the ones claiming that, in the northern hemisphere, you can only track a North Pole Star when standing at the North Pole!
https://www.drroyspencer.com/2022/12/uah-global-temperature-update-for-november-2022-0-17-deg-c/#comment-1413852
Not what I meant, Tyson.
Worse than that, Tyson.
Gaslighting Graham does not even need to stand under the North Star to triangulate his way in the world.
Tim wrote, quoting Gordon:
"“I dont know how they defined a N-S pole for the Moon. ”
Easy! When you stand at the north pole (whether on earth or the moon), one star remains straight overhead, and no stars ever rise or set. When you stand at the equator (whether on earth or the moon), all stars rise vertically.
Now you know. You’re welcome."
I was just making the point that observations from the surface of the moon itself are obviously not the way the moon’s so-called "pole stars" have been identified. The question as to how they’ve been identified remains unanswered. Still.
Either Gaslighting Graham has a short-term memory:
https://www.drroyspencer.com/2022/11/uah-global-temperature-update-for-october-2022-0-32-deg-c/#comment-1400669
Or he gaslights furthermore.
Explain to me, in your own words, the section on the moon and how they have established the moon’s “pole stars”.
Or, just a thought, DREMT could read about it himself if he is so interested.
Clearly he isnt that interested.
When put on the spot about the paper he linked to, Little Willy disappears…
[GG] The question as to how theyve been identified remains unanswered. Still.
[W] Here is again the paper I already cited on this.
[GG] Butbutbutbut
The question remains unanswered, and Little Willy doesn’t understand what he linked to.
DREMT makes it clear that the facts really are of no interest. Another opportunity to troll is of utmost importance to him.
Whereas most people accept well established scientific facts even if they personally dont understand how these were determined, DREMTs argument seems to be that if he doesn’t have the expertise to understand how astronomy analyzes its observations to find the Moons poles and rotational axis, then he can assume they have likely done it wrong, and its axis does not exist.
Ignorance is a powerful tool for DREMT and his TEAM.
A further very useful tool in the TEAM’s trolling toolbox is to make the opponent do work to understand a paper, the more difficult the better. Then when the opponent explains the science in the paper, a troll can simply dismiss their explanation as the ‘non-expert opinion’ of their opponent.
You see, if, without any evidence, they can reject the expert’s analysis of the observations, then they certainly won’t accept their opponents analysis of it.
So all in all its a powerful science denier tool.
I have personally experienced this many times trying to explain physics, which I do happen to understand, to these guys. They don’t understand it, dont really want to, and feel empowered to reject it.
Gaslighting Graham is doing the same as we speak, this time with the concept of rotation.
He does not care about it anymore, for some reason.
Let’s take Gaslighting Graham out of his misery:
https://www.drroyspencer.com/2022/11/uah-global-temperature-update-for-october-2022-0-32-deg-c/#comment-1400679
Gaslighting Graham had the answer all along.
The question remains unanswered, and Little Willy (and others) don’t understand what he linked to. They have no real interest in resolving the issue, and just want to troll.
“They have no real interest in resolving the issue, and just want to troll.”
That is obviously the most true of the people who have the most doubt about the facts, and yet won’t bother to look at the evidence.
Having looked at the paper, I put it to the blog that it does not answer the question of how the moon’s “pole stars” were determined. Prove me wrong, with detailed explanations in your own words.
[HINT: a search of the paper reveals no occurrences of the words "pole star", or the moon’s "pole stars" themselves, which are believed to be Omicron Draconis and Delta Doradus…none of those words appear in the text at all]
What are you whining about now?
No whining here. Sitting back, comfortably, with a big smile on my face. You?
” Prove me wrong, with detailed explanations in your own words.”
If any of us try to explain it to you in our own words, will you accept the explanation?
No of course not!
That is how this trolling exercise is designed.
“no occurrences of the words “pole star”, or the moons “pole stars” themselves”
For the unmotivated ignorati:
“Reference 2 gives expressions for the right ascension
and declination of the mean north pole”
Hint ‘right ascension and declination” are standard star map coordinates.
ok. My bad.
Not yours Tyson.
Yeah Nate, it seemed to me that DREMT was again whining about something or other. But he says he’s not.
The official term is lulzing, Tyson:
https://www.urbandictionary.com/define.php?term=lulzing
Trolls do that often.
The trolling from the “Spinners” continues…no explanations forthcoming. Quelle surprise.
Wrong.
https://www.drroyspencer.com/2022/12/uah-global-temperature-update-for-november-2022-0-17-deg-c/#comment-1414549
But at least you looked at the paper. Now you can look deeper and try to find a real flaw.
Good luck.
The trolling from the “Spinners” continues…no explanations of how the lunar “pole stars” have been determined are forthcoming, just false accusations that I don’t understand this or that, and general insults. Quelle surprise.
” just false accusations that I dont understand this or that”
“Having looked at the paper, I put it to the blog that it does not answer the question of how the moons pole stars were determined”
“Hint a search of the paper reveals no occurrences of the words “pole star”, or the moons “pole stars” themselves, which are believed to be Omicron Draconis and Delta Doradusnone of those words appear in the text at all”
“No whining here. Sitting back, comfortably, with a big smile on my face.”
The paper:
Reference 2 gives expressions for the right ascension
and declination of the mean north pole”
So you were obviously clueless about how stars are located with celestial coordinates, otherwise you would not have been whining about no references in the paper to ‘pole stars’
Verdict: Not a FALSE ACCUSATION, just more playing the victim card.
Gaslighting Graham gently gaslights a little more.
Incorrect, Little Willy. If you can’t understand your own references, don’t post them.
Gaslighting Graham. Gently gaslights a little more.
Little Willy fails to understand his own reference a little more.
Gaslighting Graham gaslights a little more, this time forgetting that he claimed at the time already having read the paper in which he could find the sammich he is requesting.
No, that was a different paper. I had not read the one we are now discussing before you found it.
So Gaslighting Graham had the answer all along.
That is how we recognize trolling.
No. I just said, I had not read the one we are now discussing before you found it…and, as far as I’m aware, the one we are now discussing does not have the answer in it, in any case. It seems to defer to Cassini, on that front.
Yes, I tried looking at a copy of Cassini’s relevant treatise. It was not written in English. So, that was a bit of a probby-wob.
https://www.drroyspencer.com/2022/12/uah-global-temperature-update-for-november-2022-0-17-deg-c/#comment-1414881
How is that the answer?
https://scholarworks.uark.edu/cgi/viewcontent.cgi?article=2873&context=jaas
The answer is not in that paper. As I said at the time.
Gaslighting Graham has not read the paper.
Yep, read it. No answer.
Perhaps Gaslighting Graham should put his money where his mouth is.
No. He will gaslight a little more instead.
Little Willy, please stop trolling.
C’mon, Gordo.
Here is the LRO video again:
https://youtu.be/WreSjN86ozg
The mission was to gather data.
You are story-telling conspiratorial crap.
Think.
He’s right, though. The LRO is "gathering data" on a moon that is changing its orientation beneath it due to its "orbital motion". How can you still not understand the basics of this debate!?
Gaslighting Graham gently gaslights a little more:
https://lunar.gsfc.nasa.gov/library/LRO_AAS_Paper_07-057.pdf
Our Moon Dragon cranks are just saying stuff once more.
…the LRO is "gathering data" on a moon that is changing its orientation beneath it due to its "orbital motion". How can you still not understand the basics of this debate!?
Gaslighting Graham gently gaslights a little more.
Little Willy, please stop trolling.
Clint R wrote upthread:
” Bindidon still doesnt understand CV is referring to ‘with respect to Sun‘.
Most people familiar with orbital motions can understand CV, but poor Bin is lost in space. Hes just another braindead cult idiots trolling here. ”
*
Wrong, Clint R: as always.
Unlike you, I very well understand what Vournas refers to.
First, have a look at Vournas’s website: nowhere does he use ‘with respect’ to anything at any place.
That fuzzy idea ‘with respect to Sun’ namely is your own invention: it is your ridiculous trial to misinterpret and hence misrepresent what Vournas wrote – in such a way that it fits your denying discourse.
Let us now look at Vournas’ numbers again, all written in the same style as on his site:
1. N.earth = 1/1 rotation per day, is Earths rotation spin
2. N.moon = 1/29.53 rotation per day, is Moons rotation spin
3. N.mars = 1/1.028 rotation per day, is Marss rotation spin
4. M.mercury = 1/176 rotation per day, is Mercury’s rotation spin
*
What Vournas is doing here is calculating the ratio between the rotation times of different planets, using the Earth’s rotation period as a unit. He uses the synodic values instead of the sidereal ones, what is – for his purposes, as he explained to me – absolutely correct.
If he would speak about orbits, as you incorrectly claim, then we would see orbit periods
– for Earth: 365 days;
– for Mars: 687 days;
– for Mercury: 115 days
Do you see such numbers anywhere? No, you don’t, because Vournas uses rotation periods.
Mars rotates on its axis, completing one revolution every 24.6 hours; its synodic rotation ratio is 1.02749125 i.e. rounded 1.027 Earth day, what corresponds to Vournas’ slightly incorrect 1.028 above.
Mercury rotates on its axis, completing one revolution every 176 days; its synodic rotation ratio is 0.00568 Earth day.
It is therefore evident that Vournas speaks about rotation around an internal axis, and not about orbiting around a planet, let alone the Sun.
A complete comparison of various planets and moons is visible here:
https://www.cristos-vournas.com/____impro/1/onewebmedia/i285978589402997373.jpg?etag=%221b68c-5db44839af051%22&sourceContentType=&ignoreAspectRatio&resize=670%2B472&extract=25%2B0%2B629%2B472
and we can be sure that for all planets, Vournas used the rotation period and not the orbiting period (for the moons we can’t see any difference because their respective rotation and orbit period are identical).
*
One value is missing in Vournas’ planet example series: that for Pluto you can see in the chart, however.
You might, for example, compute the value of
[ (1/R²)*(cp)¹∕ ⁴ ]¹∕ ⁴
for Pluto, by using
– its albedo and
– its synodic (1) orbit and (2) rotation periods
you’ll find here
https://en.wikipedia.org/wiki/Pluto
and comparing the results.
*
However, I doubt that you would ever try to convince yourself of how wrong you are. It’s so much easier to deny without any proof, isn’t it?
Mental blind-alleys are like physical ones: the further you go into them, the harder it becomes to get back out of them.
Bin, you’re so desperate that you’re trying to put words in someone’s mouth that can see what you’re doing, unlike Newton.
CV has clearly stated Moon is NOT rotating. He even went further, stating Jupiter moons were NOT rotating.
Keep trying to pervert reality. Your blah-blah ain’t working for you.
” CV has clearly stated Moon is NOT rotating. He even went further, stating Jupiter moons were NOT rotating. ”
So you’re claiming that Vournas was lying when he wrote the opposite on his blog, aren’t you, Clint R?
Don’t you see the numbers?
Why should Vournas select the rotation numbers for planets but suddenly switch to the orbit numbers for their moons, Clint R?
*
I repeat:
However, I doubt that you would ever try to convince yourself of how wrong you are. Its so much easier to deny without any proof, isnt it?
Mental blind-alleys are like physical ones: the further you go into them, the harder it becomes to get back out of them.
Moreover, you wrote the following:
” Bindidon still doesn’t understand CV is referring to ‘with respect to Sun’.
Most people familiar with orbital motions can understand CV, but poor Bin is lost in space. Hes just another braindead cult idiots trolling here. ”
Did you, Clint R, try to compute Vournas’ Earth’s or Mars’ or Mercury’s Planet Surface Rotational Warming factors by using their orbit numbers instead of their rotation numbers, as did Vournas?
Did you or did you not?
Quit trying to put words in my mouth, Bin. That’s not being honest.
You don’t want to be dishonest and pervert reality, do you?
tim…”Define rotation about an axis before trying to pontificate about rotation. If this is absolute truth then you should have no problem telling is the absolute definition of rotation.
When you say If you describe it as rotating about an external axis, then the axis of rotation goes through the Earth then you have already lost”.
***
Why is a ‘revolver’, as in a gun, not called a ‘rotator’? It’s obvious that we use the words interchangeably at times. When Newton used the term ‘revolving on its axis’, he obviously meant the Moon was revolving about the Earth as its axis.
He could not have meant anything else because he claimed the planets, and the Moon, moved with a rectilinear motion and that Earth’s gravity bends that rectilinear motion into curvilinear motion. So, Newton knew the Moon moved with a curvilinear motion (translation), while keeping the same face pointed at the Earth, therefore he had to know the Moon does not rotate about a local axis.
There is nothing fundamentally wrong with claiming the Earth is the axis for lunar rotation. It’s certainly not the classical usage for rotation but nonetheless it works. The Earth has a gravitational field that directs the Moon’s linear velocity into an orbit and that’s similar to an attached body, like the rim of a wheel, rotating about an axle to which it is attached by spokes.
Dremt claims it is an external axis but there is nothing wrong with calling the Earth an internal axis, since it is internal to the lunar orbital motion.
You can call it what you like, as long as it’s understood that movement like the MOTL can be described as "one single motion" – in other words, no rotation about an internal axis!
> Why is a revolver, as in a gun, not called a rotator?
🤦
C’mon, Gordo.
You’re short-changing Gaslighting Graham here.
Compare and contrast:
[GG1] you should not treat as a general plane motion that which can be described as a pure rotation or a pure translation
https://www.drroyspencer.com/2021/02/uah-global-temperature-update-for-january-2021-0-12-deg-c-new-base-period/#comment-610816
[GG2] Change orientation at a constant rate, move through the orbit at varying rates. One single, yet complex, motion.
https://www.drroyspencer.com/2022/12/uah-global-temperature-update-for-november-2022-0-17-deg-c/#comment-1413996
You should embrace the fact that he’s slowly but surely becoming a Spinner like you!
More fun and games from the Secret "Non-Spinner"…
yes…there are non-spinners and those who want to be non-spinners.
C’mon, Gordo.
You want to be a non-Spinner, but your concept of translation makes you a Spinner.
Think.
Not at all. Gordon sees “orbit” as curvilinear translation in a circle, which he sees as motion like the MOTL. Now, most people (“Spinners” especially) would say that curvilinear translation in a circle, without axial rotation, is actually motion like the MOTR. So, Gordon’s concept of translation certainly doesn’t make him a “Spinner”. Quite the opposite, in fact.
On the other hand, Little Willy sees “orbit” as involving rotation and translation.
The rotation part means he must agree that the object changes orientation whilst “orbiting”, and that this is separate and independent from “spin”.
Which, of the two possible options, means he agrees that “orbit without spin” is as per the MOTL.
Logic dictates his own words suggest he is a Secret “Non-Spinner”.
Gaslighting Graham gently gaslights a little more.
He holds that the orbit of the Moon is a rotation.
Gordo argues that it is a translation.
Moon Dragon cranks need to settle that one.
Nah, we don’t need to settle anything, as I literally just explained, Secret "Non-Spinner".
Gaslighting Graham gently gaslights a little more.
Perhaps he needs to help Gordo on his new multiple axes enigma.
Little Willy…always overdoing his memes to the point they lose all meaning.
Now…
Little Willy, please stop trolling.
😉
Gaslighting Graham gaslights more and more, this trying to pretend that when he falls back on his pet GIF it is because he does some explaining.
He rather evades the fact that a formal definition is not about likeliness.
Rotation and translation can be defined using three points, A, B, and C.
Let us see if he can pull it off.
🙄
Let us him out a bit.
Let A, B, and C form a triangle.
Little Willy, please stop trolling.
The ABC triangle is such that the AB line can be dropped on the AC line.
Where has Graham gone?
#2
Little Willy, please stop trolling.
Gaslighting Graham gently gaslights a little more.
Little Willy, please stop trolling.
“he obviously meant the Moon was revolving about the Earth as its axis”
No he didn’t. He mean the Moon is orbiting the Earth.
As long as its understood that the Moons motion, with rotation AND its elliptical orbit can NEVER EVER be described with ONE MOTION, ie simply a ROTATION.
[GORDON] …he obviously meant the Moon was revolving about the Earth as its axis…
[RLH] No he didn’t. He mean the Moon is orbiting the Earth.
[DREMT] Same thing.
[GRAHAM] If you describe it as rotating about an external axis, then the axis of rotation goes through the Earth
[TIM] You have already lost.
[GORDO] Newton knew the Moon moved with a curvilinear motion (translation), while keeping the same face pointed at the Earth, therefore he had to know the Moon does not rotate about a local axis.
[ISAAC] Because the lunar day, arising from its uniform revolution about its axis, is menstrual, that is, equal to the time of its periodic revolution in its orb, therefore the same face of the moon will be always nearly turned to the upper focus of its orb […]
Pure gaslighting from out Moon Dragon cranks.
I wasn’t commenting on what Newton said, or didn’t say…I was just taking the opportunity to point out that “revolution/orbit” is defined as a rotation about an external axis.
Small problem. A simple rotation can never ever produce an elliptical orbit.
And there many many more Wikipedia pages that would need to be edited to erase the fact that Astronomy finds that the Moon rotates on its own axis.
Oh well.
To be able to follow a complex exchange like a free wheeling conversation, Gaslighting Graham would need to have a good theory of mind module.
For some reason he has problems with his.
His 76 months of trolling helps him improve it a bit.
Just a bit.
Not enough to be able to follow an exchange, but one day he will.
A few more months and that goal will be reached.
We can hope.
Just a simple, straightforward insult from Little Willy.
A note to readers:
Gaslighting Graham was claiming that an orbit could be defined as a rotation.
Tim was reminding him that pure rotation only applied to circles.
Gordo was trying to bypass the difficulty by claiming that the rotation was in fact curvilinear rotation, and that this was like Isaac said.
Isaac said that the orbit and the spin of the Moon are synchronous.
So two mistakes for our Moon Dragon cranks.
But they went in opposite direction, which means they nullify, right?
🤦
It’s not my “claim”, Little Willy. It’s the way “revolution/orbit” is defined. Of course it’s a rotation about an external axis! Why do you think “revolution” and “rotation” are synonyms!?
I couldn’t care less about this silly “rotation has to be circular” argument. It obviously does not apply to “orbital motion”, which is a special case of “rotation about an external axis”.
Readers may notice how Gaslighting Graham tries to portrays his idiosyncratic definition of an orbit as the common one.
They may also notice that he switches from description to definition as if they were the same.
For someone who denies that the Moon spins, he sure spins a lot!
Find a definition where "revolution/orbit" is defined as "translation in a circle/ellipse", then.
Readers will easily find:
https://en.wikipedia.org/wiki/Orbit
They should not care about Gaslighting Graham’s sammich request.
Nobody does.
See? No mention of "translation".
Why o why would it need to? . The Earth is in orbit and it clearly is not simply translating!
Will you ever get this straight?
No mention of "translation", means the definition does not support the "Spinners" any more than it supports the "Non-Spinners". I’m a "Non-Spinner", and I’m quite happy to think of an "orbit" as being a path, or trajectory, that the object follows. Sure…
…but when it comes to settling this debate, we need a little bit more from the definition than that.
The Earth, for instance, could be said to be translating, whilst rotating on its own axis 366.25 times per orbit.
Or, it could be said to be rotating about an external axis, whilst rotating on its own axis 365.25 times per orbit.
So which one is right? Well, it obviously depends on whether "orbit" is defined as a rotation about an external axis, or a translation.
Exactly, Nate.
Unless and until we spoonfeed Gaslighting Graham, the rest of the world as no reason whatsoever to hold that the Moon orbits and spins.
Let’s save the world once again:
https://sites.math.washington.edu/~king/coursedir/m444a03/notes/trans/Orbits-Transformations-sup.html
Phew!
Now…be honest, Little Willy. Is that really a definition of orbit?
Readers who paid attention will have noticed:
The honest answer would be, “no”.
Gaslighting Graham does not always rely on the mathematical concept of rotation to troll this website, but when he does he refuses to accept that the notion of orbit has a mathematical definition that is perfectly fine.
Little Willy, please stop trolling.
Most ENSO modelz running straight up into El Niňo teritory, but some oddly take a kink downwards back to La Niňa, what do they know others don’t?
We should aks an expert
https://www.drroyspencer.com/2021/07/uah-global-temperature-update-for-june-2021-0-01-deg-c/#comment-747886
Aaah… the little ankle biting dachshund
https://upload.wikimedia.org/wikipedia/commons/thumb/2/27/Short-haired-Dachshund.jpg/330px-Short-haired-Dachshund.jpg
is here again.
By the way, this ‘dachshund’ word is amazing because though having a German origin (badger dog), it is really an English word.
This dog perfectly fits to commenter Eben’s behavior :- )
I yeah, I forgot, he is too busy to watch ENSO, he is watching the Moon constantly now trying to detect the spinning motion
” … now trying to detect the spinning motion ”
Hmmmh.
Why should I try to detect what Euler, Cassini, Newton, Lagrange, laplace already detected centuries ago, and was confirmed since 1976 by several LLR data evaluations, little dachshund?
Did the little dachshund suddenly move to the lunar spin deniers, like Vournas?
I want to join your circular ass debate
(_*_) (_*_) (_*_)
If you had some courage, little dachshund, you would contribute to this discussion, instead of discrediting me.
But exactly that you clearly lack.
Bin, you discredit yourself.
And always, always the same manipulation:
” When Newton used the term ‘revolving on its axis’, he obviously meant the Moon was revolving about the Earth as its axis. ”
anybody can produce by insidiously taking part of Newton’s wording out of its context:
” Jupiter revolvitur horis 9. 56′, Mars horis 24. 39′. Venus horis 23. circiter, Terra horis 23. 56′, Sol diebus 25 1/2, et Luna diebus 27. 7 hor. 43′ ”
*
Thus, when Newton mentions Earth and writes : ” Terra horis 23. 56′ “, he of course means Earth’s rotation about its axis, exactly like for Jupiter, Mars, Venus… and the Sun.
*
But, but… according to Robertson, the ignorant denialist-in-chief, when Newton mentions the Moon and writes ” et Luna diebus 27. 7. hor. 43′ “, he of course exceptionally means Moon’s orbit around Earth!
*
And Newton would have thought and written that in one and the same sentence!
It’s as if Robertson were making us think that Newton was a moron at the time he wrote what we’re discussing.
Just more of your blah-blah, Bin. If you knew any actual science, you could answer the question:
What is the change in angle of the imaginary spin axis, based on the angles given by your cult, between the high and low points of Moon’s orbit?
If you can’t answer, then you don’t even understand the basics.
” What is the change in angle of the imaginary spin axis, based on the angles given by your cult, between the high and low points of Moons orbit? ”
I could answer such a question if it had a sense.
But it has none.
” Just more of your blah-blah, Bin. ”
Did Newton – in one and the same sentence – mean
– rotation for Jupiter, Mars, Venus, Earth and the Sun
but
– orbiting for the Moon?
This is no blah-blah, Clint R.
This is a question that Clint R, Robertson, the Pseudomod and a few others refuse to honestly answer.
Yup, Newton was talking about “with reference to the fixed stars”. We know that because Moon is NOT actually rotating.
Got a model of OMWAR yet?
How about an answer to the imaginary pole axis question?
You’re getting behind, huh? Maybe some worthless troll will jump in to save you?
“We know that because Moon is NOT actually rotating”
It is rotating wrt the fixed stars which is all that matters.
As Bindidon agrees, the moon issue is not resolved by reference frames.
Rotating frames of reference are not the same as fixed ones.
Indeed.
rlh…”It [Moon} is rotating wrt the fixed stars which is all that matters”.
***
That’s not a rotation about a local axis which is the point we non-spinners have tried to make all along, hence the ball on a string model.
” Newton was talking about ‘with reference to the fixed stars’. ”
What does Newton exactly mean when he writes ‘with reference to the fixed stars’ ?
You know that, so you can explain.
Tell us, Clint R, you are so good in teaching.
He meant exactly what he stared, Bin. But, your desperation is amusing. Please continue.
As we can see, Clint R does not have a clue about what ‘with reference to the fixed stars’ really means. He keeps dodging around.
But, as the Pseudomod correctly writes, Clint R is not the only ignoramus in this story. RLH’s claim
” It is rotating wrt the fixed stars which is all that matters. ”
is nonsense.
I wrote often enough that nothing is rotating nor orbiting only ‘wrt the fixed stars’.
Fixed points in space allow us to exactly determine the period of the motion(s) of observed celestial bodies – independently of the motion(s) of the celestial body from which the formers are observed.
Newton perfectly explained that observed from the orbiting Earth, the Sun rotates in 27 1/2 (Earth) days; but the fixed star taken as reference at Sun’s rotation begin has long passed the point where it should have been. The exact computation then gives 25 1/2 days.
Some people seem to think that a motion observed wrt a fixed point in space possibly is invisible or even inexistent otherwise.
This is nonsense.
Like Earth, the Moon always rotates about its polar axis – independently of the position from which this rotation is observed.
Only the rotation’s period differs – e.g. between synodic and sidereal measurement.
All your blah-blah can’t change reality, Bin.
Moon does NOT rotate about its axis. Again, study the model of “orbital motion without axial rotation” — the ball-on-a-string.
A-ball-on-a-string has NOTHING to do with orbits.
RLH, your incessant trolling has nothing to do with reality.
You ramblings have NOTHING to do with science or reality.
binny…”Clint R does not have a clue about what with reference to the fixed stars really means. He keeps dodging around”.
***
Clint knows perfectly well what it means but I guess he’s tired of explaining it to you.
The near face of the Moon always points at Earth, plus or minus a few degrees due to libration. However, the orientation of that face wrt the fixed stars changes through 360 degrees per orbit. That re-orientation is a product of the curvilinear nature of its orbital motion, not due to a rotation of the near face about a local axis.
The near face of a ball on a string, to which the string attaches, goes through the same curvilinear motion wrt the walls in a room. The ball cannot rotate about a local axis for the simple reason that the tension on the string won’t allow it to rotate about a local axis. However, that same face re-orients through 360 degrees about the axis where the other end of the string is located.
Whenever rlh sees such a simple explanation,his brain goes into spasms, so much so, that he becomes like a parrot and repeats his mantra that a BoS has nothing to do with the lunar orbit.
Robertson
” Clint knows perfectly well what it means but I guess hes tired of explaining it to you. ”
I get tired of your stupid manipulations.
Your friend-in-denial DOES NOT KNOW what ‘with respect to the fixed stars’ means.
Like you, he thinks that Newton means a different KIND OF MOTION.
But like all physicists, astronomers and mathematicians, Newton means ‘with respect to the fixed stars’ a different MOTION PERIOD.
You are both so dumb, so stubborn.
binny…” Newton was talking about with reference to the fixed stars.
What does Newton exactly mean when he writes with reference to the fixed stars ?”
***
Newton explained several times in Principia that planetary bodies like the Moon have only a rectilinear motion which is converted to curvilinear motion by the Earth’s gravitational field.
Newton was not a stupid man, he knew that bodies undergoing rectilinear or curvilinear motion required all points in the bodies to be moving parallel to each other at all times. For a curved path, he knew it meant all particles of the body are moving along concentric curves.
Such a parallel motion completely rules out rotation about a local axis. Curvilinear motion combined with rotation about a local axis has an entirely different meaning, and someone with the intelligence of Newton would have noted that. He was talking about straight curvilinear motion without local rotation.
We know that because he included in his statement that the body always moves with a rectilinear motion without interference from gravity. It is the gravitational field that diverts the Moon from its natural rectilinear path. Newton said nothing about the field producing a torque on the Moon that would cause it to rotate. Nowhere does he claim the Moon has a natural rotation about a local axis.
There is no reason why a body moving with a pure rectilinear motion would suddenly start spinning when confronted by a gravitational field. The field would act on it across the entire near face therefore no torque would be available to start a rotation.
Also, the odds of the Moon rotating exactly once per orbit would be astronomical.
Robertson
Don’t try to manipulate us with what Newton meant about some curvilinear translation or the like.
I refer to what he wrote about the Moon in Book III, Prop. XVII, Theor. XV – what you persistently deny.
Come back to that place, and explain what he wrote wrong – but without intentionally misrepresenting his words, as you use to do!
“If you cant answer, then you dont even understand the basics.”
Again, troll Clint refuses to clarify his vague question.
It is quite apparent that he can’t clarify it because even HE dosnt know what he is trying to ask.
In any case he has no desire for an answer.
As we can see, he is just trying to troll as usual. But failing miserably.
Oh well.
That’s correct troll Nate. If you can’t answer the simple question then you don’t understand the basics.
Gee can u even answer your own question, genius?
> Actually, the orbit of the BoS has to be elliptical.
Gordo.
Take a good look at this:
https://en.wikipedia.org/wiki/Tidal_locking#/media/File:Pluto-Charon_System.gif
C’mon.
Couple of things wrong with that animation.
One, if Charon and Pluto were orbiting a barycentre, they would have to be rotating in lock-step. The animation shows Pluto orbiting a barycentre which is completely wrong and its motion is entirely independent of Charon.
Think of a dumbbell with equal weights on either end. The barycentre, also centre of mass, is a point exactly between the weights. If one weight was twice the weight of the other, the barycentre would move closer to the heavier weight.
If you placed a hefty axis through the dumbbell shaft at that point, the weights would rotate about the axis just the same as if it was located in the middle between equal weights. That would affect nothing till you increased the rotation to a point where the system might become unbalanced.
Such a mechanical interaction does not translate to a system of planets operating in a gravitational field.
Two, the animation shows Pluto circling something vague. In reality, it is orbiting the Sun. It also has 5 Moons with Charon being 1/2 its size. Therefore the gravitational effect of the other Moons must be significant to balance the motion of Charon.
The animation is incorrect in that it shows Pluto orbiting a barycentre independent of the orbit of Charon. You need to get it that Wiki is often a load of rubbish.
Robertson is either an absolute incompetent idiot, or intentionally misrepresents what anyone can see, namely that Pluto and Charon orbit around their barycenter.
You must be incredibly ignorant not to understand that the animation exactly does what is described below it:
” Charon is massive enough that the barycenter of Pluto’s system lies outside of Pluto… ”
This is massive denial.
Check out the SOI cranking
https://i.postimg.cc/mkCNHzSr/soi12.jpg
If the moon is not rotating, all the universe rotates around the moon. That sun is really moving fast to make that work, never mind the stars, though not as fast as when the earth was the center of the universe and the sun had to make its transit every 24 hours.
What a bunch of silly non-thinkers that can’t get their head around the fact the moon rotates around its axis as evidenced by the sun shining on all sides over the period of rotation.
I hope your well-deserved lump of Christmas coal is small. Maybe you could tie your lump of coal onto a string and try to make elliptical orbits around yourself.
“If the moon is not rotating, all the universe rotates around the moon.”
The moon is rotating…
…but not on its own axis.
What forces are there in action that the Moon ‘rotates’ about an ‘external axis’?
Gravity makes the Moon orbit around a barycenter.
I’m just going by definition, RLH, e.g:
[WIKIPEDIA] “A rotation around a completely external axis, e.g. the planet Earth around the Sun, is called revolving or orbiting, typically when it is produced by gravity, and the ends of the rotation axis can be called the orbital poles.”
“A rotation around a completely external axis, e.g. the planet Earth around the Sun, is called revolving or orbiting”
Note well that 2 bodies, the Sun and the Earth, are mentioned above and that the barycenter/axis is inside the conjoined pair of both of them.
Not the first time that the Wiki is wrong in the detail.
…not the first time that you have raised this total non-point.
Right on, Richard.
Keep pushing Graham on the physics side of the problem.
RLH and Little Willy. Two old friends.
The point is that there is only internal axis when using gravity.
…and my counterpoint is: that’s irrelevant. It’s irrelevant whether you describe the axis the moon revolves around as external or internal. If you agree that “orbit” is a rotation, you agree the moon does not rotate on its own axis. It’s that simple.
No, DREMT. The definition of rotation is in the first line of that wiki article you quoted:
“Rotation, or spin, is the circular movement of an object around a central axis. ”
The actual *definition* includes “circular”. This is reinforced throughout the article. You managed to find one line (and a poor line at that) that relates “rotation” to nearly circular orbits.
Let me ask, do you think Haley’s Comet “rotates” around the sun?
Sorry Tim:
"A rotation around a completely external axis, e.g. the planet Earth around the Sun, is called revolving or orbiting, typically when it is produced by gravity, and the ends of the rotation axis can be called the orbital poles."
Deal with it.
By the way, before I answer any of your questions, ever again, answer me this:
Do you think "rotation about an external axis with no rotation about an internal axis" is motion like the MOTL or the MOTR? I want a one word answer, Tim. MOTL or MOTR?
Sorry, Tim.
Someone somewhere once said that the the Moon orbit was like a ball on string.
From now on that is the definition.
No takeback.
” If you agree that ‘orbit’ is a rotation, you agree the moon does not rotate on its own axis. Its that simple.”
Only an idiot or a troll would quote a Wikipedia article that plainly states what everybody knows, that a rotation is a CIRCULAR movement, then insist that an elliptical orbit is a rotation!
Sure, "revolution" and "rotation" aren’t synonyms. There’s no obvious link between the two concepts going back hundreds of years.
Too late, Nate:
http://scienceline.ucsb.edu/getkey.php?key=4583
From now on, I will only refer to an orbit as a bowling ball on a rubber band!
Little Willy does his "talking past the person he’s trolling to the other troll" thing…
Gaslighting Graham gently gaslights a little more.
Falsely accusing me of gaslighting all the time is kind of…well, it’s like you’re gaslighting me a little bit, Little Willy.
Gaslighting Graham gently gaslights a little more.
Little Willy, please stop trolling.
[ALSO WIKIPEDIA] A barycenter is a dynamical point
Oooh…big whoop. The “orbital poles” go through the point.
Grammie pup continues with his confusion, endlessly repeating his ignorance of astronomy. The Moon does not “rotate” around an external axis fixed to the Earth-Moon barycenter. It ORBITS around the barycenter in an elliptical trajectory. From Wikipedia:
Then edit Wikipedia, Swanson. At the moment, it says this:
“A rotation around a completely external axis, e.g. the planet Earth around the Sun, is called revolving or orbiting, typically when it is produced by gravity, and the ends of the rotation axis can be called the orbital poles.”
Deal with it.
☺️
So, what is the North Pole of the barycenter of the Earth-Moon system?
swannie…”An orbital pole is…. perpendicular to the orbital plane”.
***
Gee. that’s funny, Swannie, I could have sworn the Earth’s orbital pole was tilted about 23 degrees to its orbital plane.
🙄
Come on, Gordo:
https://www.drroyspencer.com/2022/12/uah-global-temperature-update-for-november-2022-0-17-deg-c/#comment-1414623
rlh…you are claiming the Earth is orbiting the Moon as it orbits the Sun. That means the orbital path is a series of loops stretched out over an orbit.
That’s not happening Richard, like the Moon’s orbit, the Earth’s orbit is also a linear path bent into an ellipse by solar gravitation.
As I tried to explain to you in the past, the Moon lacks the mass, at its present distance, to pull the Earth off its orbital path. All it can do is raise the ocean water by a metre or the surface a centimetre.
Forget this nonsense about barycentres, it’s a mathematical calculation for a centre of mass that has no physical application between the Earth and its moon. The forces and masses involved are insufficient to cause a rotation about that barycentre.
Newton made it clear that f = ma applies only if f can move m. Obviously the Moon lacks the f to move the Earth’s COM, all it can do is raise the oceans a metre. Due to the Moon’s momentum, all the Earth’s gravitational force can do is divert it about 5 metres for each 8000 metres moved by the Moon. That 5 metres makes up for the loss in altitude due to Earth’s curvature, and keeps the Moon at orbital altitude.
Come on, Gordo.
You are becoming a Spinner more and more.
A barycenter is a point where the mass of a system balances.
[Come to think of it, Dragon cranks seem to have a problem with balance models in general.]
If gravitation cannot exert a force on the Moon so that the Man on the Moon keeps looking at us, where does the force come from?
Think.
rlh…”Gravity makes the Moon orbit around a barycenter”.
***
F = G.m1.m2/r^2
Where does it say barycentre in that equation? r is the distance centre to centre, not to a barycentre.
Come on, Gordo:
https://en.wikipedia.org/wiki/Center_of_mass#Center_of_gravity
willard…we must not confuse a centre of mass with a centre of rotation. A COM is purely a mathematical calculation and whether two bodies will rotate about it involves other physical matters.
In the case of the Earth, it is also rotating on it internal axis and rotating about the Sun as its external axis. There is no scientific evidence that the Earth is being deviated from that orbital path by the Moon. The only motion we see is the rising of the ocean due to tidal effects and a minor motion due to the solid surface straining under the same tidal effects.
“Where does it say barycentre in that equation?”
Are you saying that Newton 3 is wrong? You know, equal and opposite?
Now you got my attention, Gordo.
Where is the center of rotation you are talking about?
rlh…”Where does it say barycentre in that equation?
Are you saying that Newton 3 is wrong? You know, equal and opposite?”
***
No, I am saying you are misinterpreting the meaning of Newton II, III, and the meaning of barycentre.
Newton III is essentially action-reaction. If I push on a wall with x pounds of force it pushes back with an equal and opposite force. That is the basis of Statics, in physics, where forces are in static equilibrium. Actually, a wall has no means of mustering a force, it can only resist motion.
It’s not clear to me what Newton meant by an inertial force being exerted by a static body on a force trying to move it.
If Earth pulls on the Moon, the Moon pulls back with an equal and opposite force. However, those force must be strong enough in order that an acceleration and motion is produced. That’s not the case with the Earth-Moon gravitational interaction since the forces are not strong enough to produce a motion along a radial line between them.
Meantime, you can calculate the centre of mass between the two and call it a barycentre. That does not imply a motion about the barycentre, it gives only its location.
“you can calculate the centre of mass between the two and call it a barycentre. That does not imply a motion about the barycentre, it gives only its location”
Newton 3 says that there is an equal and opposite force to any force that is generated in nature.
If gravity pulls on one body one way then it pulls equally on the other body the opposite way.
Thus around a barycenter there is an equal force in both directions. It one body is larger than the other then it will move a lesser distance as it moves in its orbit. That is all. Science agrees.
Yes, Gordo.
It is as if the orbital axis and the spin axis were not the same.
I wonder how that could be.
Please help.
🤦
If an object, moving as per the MOTL, has an “orbital axis”, then it does not have a “spin axis”.
There is no helping you Willard but I will try to humour you.
Yes, the Moon’s orbital axis is the Earth, as Newton claimed in Principia. What else could it be?
The Moon has no spin axis, it’s an illusion created by the same human mind that thinks the Sun rises in the east and moves across the sky.
🤦 🤦 🤦
Once again, if an object, moving as per the MOTL, has an “orbital axis”, then it does not have a “spin axis”.
Gaslighting Graham gently gaslights a little more.
Readers will spare a thought for him. Having to coax Gordo on the right trolling path is a big ask.
It’s just a fact about rotation, Little Willy. Conversely, if an object moving like the MOTL has a "spin axis", then it cannot have an "orbital axis".
[WIKI] By definition, the reference plane for the Solar System is usually considered to be Earth’s orbital plane, which defines the ecliptic, the circular path on the celestial sphere that the Sun appears to follow over the course of a year.
In other cases, for instance a moon or artificial satellite orbiting another planet, it is convenient to define the inclination of the Moon’s orbit as the angle between its orbital plane and the planet’s equatorial plane.
To clarify, when I say "axis" I’m talking explicitly about an "axis of rotation". If an object is rotating about an "orbital axis", then it already moves like the MOTL with no rotation about a "spin axis" (as Bindidon, Tim, and Nate agree). That means there is one axis of rotation, only.
grammie pups, to clarify, what you say is pure semantic BS word games. The Moon’s orbital axis is not the Moon’s axis of rotation and it’s “orbit poles” are not the same as it’s “axial rotation poles”. You are still lost in your cartoon world, which has nothing to do with the Moon’s rotation.
What I say is correct, Swanson…and what’s more, I think you actually agree with it. You think the moon is translating in an ellipse, whilst rotating on its own axis. Thus you agree with what I said here:
"Conversely, if an object moving like the MOTL has a "spin axis", then it cannot have an "orbital axis"."
You do not think of the moon as having an "orbital axis", i.e. an axis of rotation external to the body of the moon, that it rotates (revolves) around. As you say here:
"The Moon’s orbital axis is not the Moon’s axis of rotation".
Your agreement is a delight. Thank you. Of course, you are wrong about the most important thing – the moon does not rotate on its own axis – but your agreement on what I’m saying otherwise, is nice to have.
Indeed, Eric, Graham is appealing to his pet GIF because Gordo got caught almost figuring it out that the polar axis of the Earth was not the same as the ecliptic axis:
https://kids.britannica.com/students/assembly/view/106452
I kid you not.
Pseudomod
” … then it already moves like the MOTL with no rotation about a “spin axis” (as Bindidon, Tim, and Nate agree). ”
Where do I agree to no rotation about a spin axis ?
That is a pure manipulation.
I told you often enough that have nothing in mind with your stupid MOTL/MOTR blah blah.
You agreed that "rotation about an external axis with no rotation about an internal axis" is motion like the MOTL, Bindidon. That was number 2) on my list of points, further up-thread.
“‘rotation about an external axis with no rotation about an internal axis’ is motion like the MOTL”
No, rotation about an external axis with no rotation about an internal axis is motion like the MOTR. i.e. no rotation means one face always points towards the fixed stars.
P.S. you should replace ‘motion about a external axis’ to be ‘orbits around’ to have any real meaning in science.
Wrong, RLH. Here is Nate, agreeing that it is like the MOTL:
https://www.drroyspencer.com/2020/12/uah-global-temperature-update-for-november-2020-0-53-deg-c/#comment-566712
Pseudomod
” You agreed that ‘rotation about an external axis with no rotation about an internal axis’ is motion like the MOTL, Bindidon. That was number 2) on my list of points, further up-thread. ”
I manifestly misunderstood your completely unscientific blah blah, and retract my agreement.
I repeat, for the very last time, that I have nothing to do with your stupid MOTL/MOTR stuff.
…and here is Bindidon’s agreement that it is like the MOTL:
https://www.drroyspencer.com/2022/12/uah-global-temperature-update-for-november-2022-0-17-deg-c/#comment-1409168
So you can argue against Nate and Bindidon. Not me.
Sorry, Bindidon. No take-backs.
You were right in your agreement, anyway, and you’d be wrong to disagree. Stick with being right, for a change.
” If an object is rotating about an “orbital axis”, then it already moves like the MOTL with no rotation about a “spin axis” (as Bindidon, Tim, and Nate agree). That means there is one axis of rotation, only.”
No. I agree there is no ADDITIONAL rotation about the spin axis. That *actually* means there is an equal rotation about the spin axis. And an equal rotation about infinitely many other axes.
And E. Swanson adds the important point about the tilt of the moon’s spin axis, that I had not specifically contemplated before.
The MOTL has its axis exactly aligned with the circular motion around earth — straight up out of the page. This allows this cartoon moon’s movement to be considered “one motion” – a simple rotation around the cartoon earth.
In additional to my usual objection that this is not “one motion” for the real moon because the orbit is not circular, we have the additional objection that this is not one motion because the axis is not aligned.
Tim, you sure are a wriggly little worm, aren’t you?
Here, let’s try to pin you down with something:
Do you think "rotation about an external axis with no rotation about an internal axis" is motion like the MOTL or the MOTR? I want a one word answer. MOTL or MOTR?
Specifically, mark a point at the center of the MOTL. That marks the location of something we will call the “spin axis”. Draw a line from that point to any point on the circumference of the MOTL. Measure the angle of that line (relative to horizontal on the screen). Then wait a frame. Measure the angle of the line again. The angle has changed. Therefore the moon has rotated about that point. It has rotated around the “spin axis”.
Yes, Tim. If (and only if) "orbit without spin" is as per the MOTR.
Now, please answer my question.
"This allows this cartoon moon’s movement to be considered "one motion" – a simple rotation around the cartoon earth."
This is what’s so amusing about you, Tim. You say the MOTL can be considered to be "one motion" – a "simple rotation". Well, that means "rotation about an external axis with no rotation about an internal axis" – that’s the only thing you can mean by a "simple rotation"! That’s the "one motion" you are referring to. If there were two rotations, one about an external axis, and one about an internal axis, it would be two motions! Two is more than one, Tim. "One single motion" means "one simple rotation" means "rotation about an external axis with no rotation about an internal axis".
But you just refuse to say it. You literally cannot say the words "the MOTL can be described as not rotating on its own axis". You can’t bring yourself to admit that there is even a possibility of describing the MOTL as not rotating on its own axis. But, you’ll happily say it can be described as one motion!
So what is the "one motion", then Tim, if not "rotation about an external axis with no rotation about an internal axis"? Is it "translation in a circle with no rotation about an internal axis", as Gordon would describe it? Either way, if it’s "one motion", then there’s no axial rotation. Right? Unless you’re saying the "one motion" is axial rotation!? Is that it? Is the MOTL just motionless on the screen, not moving around the Earth, and just rotating on its own axis, in your eyes? Is that it? Come on Tim, explain yourself!
[RICHARD] P.S. you should replace motion about a external axis to be orbits around to have any real meaning in science.
[GASLIGHTING GRAHAM] Wrong, RLH. Here is Nate.
[NATE] Rotating about an external axis NOT equivalent to ORBITING. No matter how many times you try to declare it so.
🤦 🤦 🤦
Yes, Little Willy, Nate doesn’t agree that "orbit" can be described as "rotation about an external axis"…
…but what he does agree with, is:
[DREMT] Firstly, Craig, we know from upthread that an object that is rotating about an external axis (without rotating about its own center of mass) always presents the same face to that axis whilst it moves.
[NATE] TRUE.
So he agrees that "rotation about an external axis with no rotation about an internal axis" is motion as per the MOTL. Tim agrees that motion like the MOTL can be described as "one motion". Which can only mean…not rotating on its own axis. Whether he can bring himself to admit that, or not.
Bindidon did agree, then took it back, because he got all upset that I was talking about the MOTL/MOTR again. He’ll probably change his mind back again, if Tim can ever bring himself to admit the obvious.
(Vlad) An object that rotates…
(Estr) Got it.
(Vlad) If it always shows the same side.
(Estr) Yes.
(Vlad) It is like the left part of the GIF…
(Estr) The stupid GIF nobody but you cares about?
(Vlad) Yes.
(Estr) Is it an orbit?
(Vlad) Yes…?
(Estr) Then it’s not exactly a rotation, now, is it?
(Vlad) Well, I believe that…
(Estr) That’s where you’re wrong, Kiddo.
Have you literally popped up just to try to save Tim from his embarrassment?
[GASLIGHTING GRAHAM] Have you literally popped up just to try to save Tim from his embarrassment?
[ALSO GASLIGHTING GRAHAM] before I answer any of your questions, ever again, gimme a sammich.
Why are Tim’s questions not sammiches? Oh, that’s right. You’ve got a little bit of a thing for Tim.
Poor Gaslighting Graham.
Forever the victim.
Readers may ask themselves: does Haley’s Comet “rotates” around the Sun?
Little Willy wants his sammich!
Hmmm…where did Tim go?
🤦
Tim? Tim!?
TIM!?
Pseudomod
” Sorry, Bindidon. No take-backs. ”
You won’t decide here what can be done resp. what can’t.
I repeat, for the very last time, that I have nothing to do with your stupid MOTL/MOTR stuff.
It has no scientific meaning and hence I ignore>/b> it. Neither do I disagree nor do I agree.
Why are you so angry all the time?
“So he agrees that “rotation about an external axis with no rotation about an internal axis” is motion as per the MOTL”
‘is motion as per the MOTL’? FALSE
‘One of two ways the MOTL can be described?’ TRUE
Get it straight.
And of the two ways of describing it, this one ‘rotation about an external axis with no rotation about an internal axis’ is NOT USEFUL to physics and astronomy since it would rarely, if ever, be applicable to planets or moons. It is not applicable to The Moon.
This is the KEY point that can settle the Moon argument, thus DREMT keeps evading it.
Looks like Bindidon wasn’t the only person who got out of the wrong side of the bed this morning.
“Well, that means “rotation about an external axis with no rotation about an internal axis” thats the only thing you can mean by a “simple rotation”!”
No. I can — and do — mean “a simple rotation about your specified axis, with no other *additional* motions; no rotations or translations in addition to the one you describe.”
There is no ADDITIONAL translation about the earth on the left or about the moon on the right or the bottom left corner of the screen. There is no ADDITIONAL rotation about the earth on the left or about the moon on the right or the bottom left corner of the screen.
Why would you get upset when Gaslighting Graham completely ignores everything you say except what he thinks may help his trolling persist, Binny?
He only does it for the lulz, after all.
Lighten up.
Tim, you appear to be ineducable. Two questions for you:
1) Is "rotation about an external axis, with no rotation about an internal axis", motion like the MOTL or the MOTR? You may respond with only one of the two options. Note that Nate has already agreed that it’s the MOTL, so you don’t need to feel bad about admitting reality to us.
2) You have agreed that motion like the MOTL can be described as "one motion". Thus you must agree that motion like the MOTL can be described as not rotating on its own axis. Do you agree? Yes or no? If no, then what is the "one motion" if not "rotation about an external axis with no rotation about an internal axis"?
Gaslighting Graham gently gaslights a little more.
Little Willy, please stop trolling.
Wow suddenly my posts are of great interest to DREMT.
He forgot this part of my post after “TRUE”
” [DREMT]’That is just a fact, proven both by the link ftop_t found and by the Madhavi ref. I mentioned. Now, the statement is conditional, if the moon were rotating about an external axis (orbiting)”
Right there is the sleight of hand. State something true, then sneak in something FALSE, and maybe nobody will notice.
Rotating about an external axis NOT equivalent to ORBITING. No matter how many times you try to declare it so.”
And Tim was quite correct when he stated
“E. Swanson adds the important point about the tilt of the moons spin axis, that I had not specifically contemplated before.
The MOTL has its axis exactly aligned with the circular motion around earth straight up out of the page. This allows this cartoon moons movement to be considered ‘one motion’ a simple rotation around the cartoon earth.”
IOW the MOTL is useless for real planets and moons.
” Is “rotation about an external axis, with no rotation about an internal axis”, motion like the MOTL or the MOTR? You may respond with only one of the two options. Note that Nate has already agreed that its the MOTL, so you dont need to feel bad about admitting reality to us.”
“‘is motion as per the MOTL’? FALSE
‘One of two ways the MOTL can be described’? TRUE
Get it straight.”
Oh what pretzel logic do we weave when we practice semantic games to deceive.
Logicians amongst us will note that the statement ""rotation about an external axis with no rotation about an internal axis" is motion like the MOTL" remains "TRUE" even when there are two options for how to describe motion like the MOTL.
Logicians might also note that unless and until they falsify the description according to which the Moon spins Moon Dragon cranks have little going for them.
And since they know about indeterminacy, they could not care less about Grahams pet GIF.
Awaiting Tim’s answers…
“when there are two options for how to describe motion like the MOTL.”
Well then your quest to get people to commit to the one you prefer makes no sense.
It will soothe your ego in some way, but it will not settle anything.
As Tim and I have both noted, and you have ignoring (why?), only one method for describing the MOTL will work for the general case, ie orbits which are elliptical and have rotation on various axes, like our Moon.
And that is the one that describes it as orbiting with an axial rotation. Exactly the way your source for the diagram describes it.
Here is another one.
“Tidal locking is the phenomenon by which a body has the same rotational period as its orbital period around a partner. So, the Moon is tidally locked to the Earth because it rotates in exactly the same time as it takes to orbit the Earth. That is why we only see one side of the Moon.”
https://www.sciencefocus.com/space/what-is-tidal-locking/
Still awaiting Tim’s answers…
That’s funny Ken, but not very original. Some other cult already came up with that nonsense.
https://uncyclopedia.com/wiki/Lunarcentrism
clint…from the link…”Force depends on mass and acceleration
The force of gravity depends on the mass of the two objects, and the distance between them”.
***
Completely screwed up in their interpretation of Newton II.
Force does not depend on mass and acceleration, it’s the other way around. Acceleration depends on force and mass.
In the article, they have completely misinterpreted the meaning of f = ma. However, that misunderstanding reaches to the higher levels of NASA, where one of there mission coordinators claimed the same thing.
I blame the misunderstanding on the bs related to Einstein’s theory of relativity which is freely taught in modern universities as fact. Einstein focused on the acceleration of a mass as having an independent quality and he was dead wrong.
In his paper on relativity, Einstein compared the effect of acceleration on a man in a box where the acceleration was provided by either a sky hook accelerating the box upward or gravity accelerating it downward. Einstein, a theoretical physics who did no experimenting, thought acceleration was an independent phenomenon whereas it is totally dependent on force and mass.
Newton hinted at that in Principia. He offered a disclaimer, for f = ma, as follows: if a force can move a mass, then f = ma. So, Newton knew the independent variables are force and mass and that acceleration is a totally dependent variable.
Apparently that simple fact escaped Einstein, who employed kinematics to create a false universe where acceleration is a motivating force. He was wrong and who knows how long it will take us to undo the damage.
Come on, Gordo.
Physical laws are equivalences. They posit symmetries. Read it one way or the other, it does not matter.
ken…”If the moon is not rotating, all the universe rotates around the moon”.
***
Where did you summon up that logic? You are claiming, in essence, that the Moon is rotating about a local axis, and if it is not, then the universe must be rotating around the Moon.
There is another possibility, Ken, the Moon is not rotating on a local axis, therefore the universe does not have to be re-aligned to rotate around the Moon.
Do you understand rectilinear motion/translation? It is a simple concept describing the motion of a body in a straight line where the body is NOT rotating about a local axis. For example, a car moving from A to B is not rotating about its centre of mass, unless it has spun out on ice or something.
Start the car along a straight line then turn on a huge electromagnet that is strong enough to divert it off the straight line into a curved line. Keep driving the car with the electromagnet set strong enough to pull the car off its rectilinear path and hold it in a curved path but not so strong it causes the car to slide on it tires laterally. To prevent that, we could install a greased guide rail so the tires would slide along it.
If the magnetic strength is high enough and the car’s momentum is in proportion, the car will be forced to follow an orbital path. Meantime, the driver side (in North America) is always facing the magnet as the car orbits the magnet CCW.
That’s the Moon’s orbit for you. At no time is the car rotating locally about its COM. To do that, the front would have to rotate about the COM and eventually face backwards to the direction of travel.
Ken, I implore you to put on your thinking cap and let’s keep us climate skeptics on the same page.
Come on, Gordo.
Your *essence* is longer than what Kennui said.
Suppose your car goes from A to B, but the shortest path between the two points is a curve.
What do you think happens to the car when subjected to an unbalanced force?
If the straightest line between the two points A and B is a curve, then the motion has to be curvilinear translation. If it was the surface of the Earth, in order for it to be rectilinear translation, you’d need to bore a straight line through the Earth as a tunnel to connect A and B.
That gives a good relationship between rectilinear and curvilinear translation. It mean that rectilinear motion on the Earth’s surface is limited to very short distances where the tangential plane is relatively flat. However, the Earth’s surface curves 5 metres for every 8000 horizontal metres. That suggests all motion on the Earth’s surface is essentially curvilinear in nature, “in the long run”.
C’mon, Gordo.
I gave you the line you want. That line is a curve. Now, you’re supposed to tell me what happens to the car when subjected to an unbalanced force.
No need for any numbers.
Just tell it like it is.
I present to you, Gordon Robertson the lost lectures… https://youtu.be/bv8WPiLxELs
Brennan nailed it.
He must own TSLA stocks.
Like, totally *own* them.
Little Willy says:
C’mon Gordo…
C’mon Gordo…
C’mon Gordo…
C’mon Gordo…
C’mon Gordo…
C’mon Gordo…
C’mon Gordo…
C’mon Gordo…
C’mon Gordo…
C’mon Gordo…
C’mon Gordo…
C’mon Gordo…
C’mon Gordo…
C’mon Gordo…
C’mon Gordo…
C’mon Gordo…
C’mon Gordo…
C’mon Gordo…
C’mon Gordo…
C’mon Gordo…
C’mon Gordo…
C’mon Gordo…
C’mon Gordo…
C’mon Gordo…
C’mon Gordo…
C’mon Gordo…
C’mon Gordo…
C’mon Gordo…
C’mon Gordo…
C’mon Gordo…
C’mon Gordo…
C’mon Gordo…
C’mon Gordo…
C’mon Gordo…
C’mon Gordo…
C’mon Gordo…
C’mon Gordo…
C’mon Gordo…
C’mon Gordo…
C’mon Gordo…
C’mon Gordo…
C’mon Gordo…
C’mon Gordo…
C’mon Gordo…
C’mon Gordo…
C’mon Gordo…
C’mon Gordo…
C’mon Gordo…
C’mon Gordo…
C’mon Gordo…
C’mon Gordo…
C’mon Gordo…
C’mon Gordo…
C’mon Gordo…
C’mon Gordo…
C’mon Gordo…
C’mon Gordo…
C’mon Gordo…
C’mon Gordo…
C’mon Gordo…
C’mon Gordo…
C’mon Gordo…
C’mon Gordo…
C’mon Gordo…
C’mon Gordo…
C’mon Gordo…
C’mon Gordo…
C’mon Gordo…
C’mon Gordo…
C’mon Gordo…
C’mon Gordo…
C’mon Gordo…
C’mon Gordo…
C’mon Gordo…
C’mon Gordo…
C’mon Gordo…
C’mon Gordo…
C’mon Gordo…
C’mon Gordo…
C’mon Gordo…
C’mon Gordo…
C’mon Gordo…
C’mon Gordo…
C’mon Gordo…
C’mon Gordo…
C’mon Gordo…
C’mon Gordo…
C’mon Gordo…
C’mon Gordo…
C’mon Gordo…
C’mon Gordo…
C’mon Gordo…
C’mon Gordo…
C’mon Gordo…
C’mon Gordo…
C’mon Gordo…
C’mon Gordo…
C’mon Gordo…
C’mon Gordo…
C’mon Gordo…
C’mon Gordo…
C’mon Gordo…
C’mon Gordo…
C’mon Gordo…
C’mon Gordo…
C’mon Gordo…
C’mon Gordo…
C’mon Gordo…
C’mon Gordo…
C’mon Gordo…
C’mon Gordo…
C’mon Gordo…
C’mon Gordo…
C’mon Gordo…
C’mon Gordo…
C’mon Gordo…
C’mon Gordo…
C’mon Gordo…
C’mon Gordo…
C’mon Gordo…
C’mon Gordo…
C’mon Gordo…
C’mon Gordo…
C’mon Gordo…
C’mon Gordo…
C’mon Gordo…
C’mon Gordo…
C’mon Gordo…
C’mon Gordo…
C’mon Gordo…
C’mon Gordo…
C’mon Gordo…
C’mon Gordo…
C’mon Gordo…
C’mon Gordo…
C’mon Gordo…
C’mon Gordo…
C’mon Gordo…
C’mon Gordo…
C’mon Gordo…
C’mon Gordo…
C’mon Gordo…
C’mon Gordo…
C’mon Gordo…
C’mon Gordo…
C’mon Gordo…
C’mon Gordo…
C’mon Gordo…
C’mon Gordo…
C’mon Gordo…
C’mon Gordo…
C’mon Gordo…
C’mon Gordo…
C’mon Gordo…
C’mon Gordo…
C’mon Gordo…
C’mon Gordo…
C’mon Gordo…
C’mon Gordo…
C’mon Gordo…
C’mon Gordo…
C’mon Gordo…
C’mon Gordo…
C’mon Gordo…
C’mon Gordo…
C’mon Gordo…
C’mon Gordo…
C’mon Gordo…
C’mon Gordo…
C’mon Gordo…
C’mon Gordo…
C’mon Gordo…
C’mon Gordo…
C’mon Gordo…
C’mon Gordo…
C’mon Gordo…
🤦
C’mon Little Willy, lighten up.
test
Gordo,
I gave you the line you want. That line is a curve. Now, you’re supposed to tell what happens to the car when subjected to an unbalanced force.
No need for any numbers.
Just tell it like it is.
C’mon.
Shamone, Gordon, Shamone!
Gordo?
GORDO!
G o o r d o o o ?
Shamone, Gordo, Little Willy just wants you to Shamone!
A rather cool resource:
https://oer.pressbooks.pub/lynnanegeorge/chapter/chapter-2-orbit-geometry/
No hit either for “rotation” or “translation” in that resource.
That ought to make Moon Dragon cranks sad.
As everyone knows, Wikipedia is edited by the public and thus sometimes contains misleading or contradictory information:
Hence an article on Rotation states in its first line:
“Rotation, or spin, is the CIRCULAR movement of an object around a central axis.”
and that is CORRECT, as we can see from any Kinematics textbook:
“Rotation about a Fixed Axis. In this motion, the particles forming the rigid body move in parallel
planes along CIRCLE centered on the same fixed axis”
https://mvsrec.edu.in/images/dynamicsofrigidbodies.pdf
Then later the same article states
“A rotation around a completely external axis, e.g. the planet Earth around the Sun, is called revolving or orbiting, typically when it is produced by gravity, and the ends of the rotation axis can be called the orbital poles.”
Since planetary orbits are well known to often be ELLIPTICAL rather than circular, this statement appears to CONTRADICT the prior one, and the definition of ROTATION found everywhere else.
It as at the very least unclear on its generality to all orbits.
Then later the same article clarifies the issue for planetary motion:
“While revolution is often used as a synonym for rotation, in many fields, particularly astronomy and related fields, revolution, often referred to as orbital revolution for clarity, is used when one body moves around another while rotation is used to mean the movement around an axis.”
This returns to accuracy, and agrees with the first definition of rotation given in the article, while contradicting the second statement.
In any case, no one with INTEGRITY would cherry pick only the single incorrect sentence from a Wikipedia article to make their argument, while ignoring all other contradictory and correct statements in the same article and those found in every other reliable source.
But that is what some people here do. Repeatedly. Nobody is falling for it.
Little Willy, please stop trolling.
Ball on string only works if Earth is center of the universe. Sun moon and stars orbit around the earth.
This hypothesis was clearly disproven by Galileo. Earth is not center of the universe.
Neither is the moon the center of the universe. The moon rotates with respect to the sun.
The moon cannot make a circular path around the earth because the earth is moving in a circular path around the sun. The moon too is making a circular path around the sun even as that path is perturbed by earth gravity. Sometimes moon path is inside earth path around the sun and sometimes it is outside. The only way this works for the moon to always face earth is if moon rotates around its axis.
You can be forgiven for thinking the Sun is the center of the universe; for all intents and purposes in discussion regarding the moon, it is so.
Please catch up with the times. Or go to some dark corner and gnaw on your lump of coal. Leave us alone till you’ve actually done some thinking using logic. Galileo already paid the price for his controversial facts and you disgrace his discovery.
Very good, Ken. Even funnier than the last one.
“Ball on string only works if Earth is center of the universe.”
That sounds like something a worthless troll would say. It doesn’t even begin to make sense. It’s just one of their failed efforts to distort/pervert reality. They HATE the simple ball-on-a-string.
Like the rest of his cult, poor Ken understands NONE of this, can’t answer ANY of the science questions, and has NO viable model of “orbital motion without axial rotation. He’s got NOTHING.
Gaslighting Graham refuses that question, Pup –
Does Haleys comet rotate?
As a good team player, please save him from embarrassment.
About which axis? Do we even have any idea of how Halley’s Comet remains oriented, whilst it moves?
Give us a specific way it should be oriented that would make its orbit a rotation around the sun.
Did I hear that annoying squawking drone, again?
Gaslighting Graham gaslights a little more.
Now there’s another drone…
Just a little more.
Ooh ah, just a little bit
Ooh ah, a little bit moar
😊
That’s the spirit. Lighten up. It’s nearly Christmas.
DREMT,
“If you ‘discontinue the orbit’, and you define ‘orbit’ as a ‘translation in a circle’, then you are left with your object still rotating on its own axis. But, if you define ‘orbit’ as a ‘rotation about an external axis’, then you are left with your object not rotating on its own axis when you stop the ‘orbit’.
I describe an orbit as a body revolving around another. That would be your former description there. That is what an orbit IS.
This is sometimes also described as a body rotating about another (more archaically, and less so in astronomy). But that’s not to be confused with rigid-body rotation on an internal axis. This is a semantical, not an actual difference.
A rotation about an external axis that has nothing to do with orbit is a translational movement with the translated object changing its orientation relative to a fixed point outside itself. Such as:
https://upload.wikimedia.org/wikipedia/commons/5/5b/Rotation_illus.svg
Figure description: “Rotation (angular displacement) of a planar figure around a point”
In that figure above, the object is rotating, and the axis is external. It moves like the MOTL. It’s a rotational movement because its orientation changes. It’s also part of an orbit.
If that object were a Moon I would say it was rotating and also orbiting. That wiki entry would agree wth me.
But no doubt wikiepdia is, once again, wrong?
I’ve read your comment several times. It’s still unclear what you’re trying to say.
Rotation is translational!?
“In that figure above, the object is rotating, and the axis is external. It moves like the MOTL. It’s a rotational movement because its orientation changes.”
Yes. Well done. With no rotation about an internal axis, the object moves like the MOTL.
Are we done here, then?
barry, this is why this issue is so amazing. You cult idiots will pervert anything to fit your beliefs. The motion described by your link is clearly ONLY one motion. You can describe it as “rotating about an external axis” or “revolving”. (My preferred term is “revolving”.) But no matter how you describe it, it is ONLY one motion.
You are so blind to reality that you can’t see it. It’s just like the nonsense spewed by fraudkerts. You did not want to understand that that meant ice cubes could boil water. Like a devout cult member, you called me a “lying dog”, because you would not accept reality.
You’re just another braindead cult idiot posing as an anonymous troll.
“The motion described by your link is clearly ONLY one motion.”
It is the same motion as if the planar object is a particle in a larger rigid body, all of which is rotating. It is described in the article as a rotation, not an orbit, or revolution.
I also call an orbit a revolution, and not a rotation.
barry, since you agree that "revolution" is just another word for a "rotation about an external axis", you should understand that your link shows an example of rotation about an external axis, and thus revolution!
Yeah, I was a little unclear and even haphazard. It’s Christmas and I’m distracted by life in that zone.
Merry Christmas.
Rotation isn’t dependent on translation or even related to it. Translation occurs when every point on an object moves in the same direction the same distance.
https://en.wikipedia.org/wiki/Translation_(geometry)
If we take an orbit, the MOTR represents translational movement. Every point on the M moves the same distance in the same direction. Choose 4 points and you would get 4 overlapping rings after a full orbit. All the same size, and thus distance. All being drawn in the same direction at any given moment through the orbit
The MOTL is not translational, because a point on the Earth-facing side would travel less distance than a point on the far side. The circles drawn by each point after a full orbit are of different diameters, therefore these points have not traveled the same distance.
The movement of the MOTL is not translational. It’s rotational. It’s spinning while it orbits.
That’s my attempt to answer the issue ignoring frame of reference.
“If we take an orbit, the MOTR represents translational movement.”
“The movement of the MOTL is not translational. Its rotational. Its spinning while it orbits.”
Indeed, yet both are orbits, and that means that in general, an ORBIT should not use the word translation in its definition.
Trolls claiming the lack of the word ‘translation’ in the definition of ORBIT is meaningful for this discussion, are creating yet another strawman.
“Indeed, yet both are orbits, and that means that in general, an ORBIT should not use the word translation in its definition.”
Agreed. But I’m trying to use DREMT’s preferred language.
barry, my "preferred language" is no different to anyone else’s.
barry spews: “Choose 4 points and you would get 4 overlapping rings after a full orbit.”
Yes barry, and that should indicate to a reality-motivated person that the MOTR is both orbiting AND rotating.
But, we know you’re NOT a reality-motivated person….
If you are so big on reality, Pup, why do you keep appealing to a silly counterfactual?
Not at all, Clint. Quite the opposite.
Well, barry, you got some things right, and some things wrong. Most people, ("Spinners" especially), if thinking of the motion of the MOTR as being comprised of only one motion, would agree with you that it is translational motion. Hence, "Spinners" describe the motion of the MOTL as being "translation in a circle plus rotation about an internal axis". Does that make sense?
However, you can’t confuse this with rotational motion. If we’re thinking of the MOTL as being comprised of only one motion, then that motion is "rotation about an external axis", or "revolution" – exactly as Clint R says, above. It is one single motion (as even Tim now agrees, see further up-thread), so there is no rotation about an internal axis.
OK? So, the MOTL can be described as not rotating on its own axis. That’s the first thing you have to accept. It can legitimately be described that way, kinematically.
Merry Christmas to you, too.
” If were thinking of the MOTL as being comprised of only one motion, then that motion is “rotation about an external axis””
Fair enough.
What is the rationale for calling a simple rotation ONE MOTION?
If a manual for machine says: “rotate the part +67 degrees around point P” then that has a unique, clear meaning (using the convention that + means CW).
The point is only a single number, 67 degrees needs to be given to convey the instruction.
Because a simple rotation has ONE Degree of Freedom. That is one rationale for calling it ONE MOTION.
If the instruction said “rotate the part +67 degrees around point P and then move the part 10 cm radially away from point P” that would clearly not be ONE MOTION. It would be a rotation plus a translation, two numbers required. The body has two degrees of freedom. TWO MOTIONS.
But the latter instruction is what is required to move a planet part way, say 67 degrees, around an elliptical orbit. Because it moves the body around a center, like a rotation, but also radially away or toward the center, like translation. And a further complication is how to orient the body as it moves through is not specified.
Thus a body in an elliptical orbit has more than one degree of freedom, its motion is not a pure rotation, and it cannot be described as ONE MOTION.
There’s that weird sound again…
‘weird sound’ for trolls who have no interest in getting at the truth.
Troll Nate spews all that nonsense just to end up being WRONG, again.
He’s amazing.
A Clint post with insults, but no science or any point at all?
Shocking!
Actually not shocking at all. That describes the vast majority of his posts.
I don’t use science to respond to trolls, troll Nate.
They can’t understand it….
“If were thinking of the MOTL as being comprised of only one motion, then that motion is ‘rotation about an external axis’, or ‘revolution'”
Ok, let’s quote that exact notion from the wiki page on rotation.
“A rotation around a completely external axis, e.g. the planet Earth around the Sun, is called revolving or orbiting, typically when it is produced by gravity…”
The rotation being described here is purely orbit. The word I use do describe the motion is revolution, as I was taught that a rotation in celestial mechanics refers purely to objects rotating about an internal axis, and ‘rotation’ around an external axis – i.e. a Moon around a planet or a planet around a star – is called a revolution, or orbit.
You would have it that the Moon’s orientation is a function of its orbit, but I see nothing that confirms your POV. The wiki page (which takes its text from Rotation, Reflection, and Frame Changes: Orthogonal tensors in computational engineering mechanics) clearly disagrees with you, as it uses the Earth as an example of the ‘one motion’ you’re describing. And you think the Earth is rotating.
Trying to see how you see it, it looks like you conflate the terminology ‘rotate’ and ‘revolve’. Because an orbit can be described using both words, you see no separate function WRT the moon. Here, though, if we ignore the inertial frame of reference and remove celestial dynamics from the equation, it is simply a rigid body issue, of which the Moon is a particle, and the Earth/Moon system is one unit. That unit is rotating, and the Moon is a part of that rotating rigid body. Just as with the planar object ‘rotating’ around an external axis.
But this is the Moon and the Earth, and the frame that gives us the most explanatory power for the wider celestial system is the fixed stars. The inertial frame of reference has to be applied or our explanation for the Moon’s movement falls apart once we use the frame of reference you are using to try to explain other celestial motion.
IOW, your POV is geocentric.
"Rotation about an external axis with no rotation about an internal axis" is motion as per the MOTL. As Nate agrees. It is one single motion. As Tim agrees.
Please continue to argue with Nate and Tim, and not me, on that point. The evidence that this is the case has been provided by the transmographer. I also, some years ago, already discussed this with you, and showed you some examples from a kinematics text that proved the point. I will most likely not bother to do so again, as you will just find a way to reject it.
I do not conflate the terminology "rotate" and "revolve". "Revolution" is indeed a rotation about an external axis. The Earth is revolving and rotating on its own internal axis. The moon is just revolving. The Earth is not given as an example of "one single motion" in the text you cite. The Earth is given as an example of an object that is rotating about an external axis (revolving). It just so happens that it is also rotating on its own internal axis. So that is two motions.
My POV is not geocentric. Deary, deary, me.
“The Earth is not given as an example of “one single motion” in the text you cite.”
It is the same as what you said:
“If we’re thinking of the MOTL as being comprised of only one motion, then that motion is rotation about an external axis, or revolution'”.
This merely describes an orbit, as did the wiki bit I quoted.
“My POV is not geocentric.”
Ok, You are Sun. If you see more than one side of the Moon, how is it that it is not rotating?
Oh, barry. You just don’t listen!
"The Earth is not given as an example of "one single motion" in the text you cite. The Earth is given as an example of an object that is rotating about an external axis (revolving). It just so happens that it is also rotating on its own internal axis. So that is two motions."
"Ok, You are Sun. If you see more than one side of the Moon, how is it that it is not rotating?"
It is rotating…but not on its own internal axis. It is rotating about an external axis (revolving) whilst not rotating about an internal axis.
grammie pups continue to play semantic games, writing:
and later:
In so saying, grammie pups ignores geometry. There is no FIXED EXTERNAL AXIS for an orbiting body to “revolve” around. grammie pups can’t identify one scientifically, since he refuses to specify the geometric system necessary define said axis.
Troll on, moron.
Sorry Swanson, barry agrees that "revolution" is a rotation about an external axis. So you’ll have to ask him to "troll on". Merry Christmas.
as I pointed out, grammie pups continues to ignore the fact that there is no FIXED EXTERNAL AXIS for an orbiting body to revolve around. Barry discuss inertial coordinates, which grammie pups also ignores. The Moon orbits around the Earth-Moon barycenter. That’s has nothing to do with the Moon’s rotation around it’s axis at a constant rate.
The ignorant troll will never learn science, insisting that his cartoons are reality.
As Bindidon agrees, reference frames do not resolve the moon issue.
“It is rotating… but not on its own internal axis.”
The only force holding the Moon to the Earth is gravity. In astronomical dynamics this is not a rigid body system with the moon as a particle within it. The Moon is a satellite orbiting a planet.
WRT the fixed stars the Moon is rotating on its axis.
WRT rotational angular momentum the Moon is rotating. You can examine the equation online.
https://www.quora.com/What-is-the-angular-momentum-of-the-moon-in-its-rotation-around-its-axis
https://www.youtube.com/watch?v=qBJjORy9y9s
This is an explanation under celestial mechanics.
When a particle rotates about an external axis, as in a fixed body regime, this is called a rotation – of the particle.
This is an explanation under geometry.
Using either a celestial coordinate system or a geometric coordinate system with the earth at 0,0 – the Moon is rotating, by definition.
What you appear to be doing is conflating two separate disciplines, and assigning an orbital pattern and terminology to a geometric pattern, relying on the fact that both disciplines use the word rotation to describe something similar. But they are not the same thing.
I think this is the error in your POV.
You can use either coordinate system – and terminology – but not both at once.
DREMT: “My POV is not geocentric.”
berry: “Ok, You are Sun. If you see more than one side of the Moon, how is it that it is not rotating?”
DREMT: “It is rotating… but not on its own internal axis. It is rotating about an external axis”
And what determines that external axis?
The Earth.
Your POV is geocentric.
(And you are conflating a geometrical pattern with orbital dynamics)
barry, you’re jumping to an awful lot of conclusions.
You have already said you agree that "orbit/revolution" is a rotation about an external axis. So if I say the Earth revolves around the Sun, does that mean my POV is "Sun-centric"!? Of course not. So acknowledging that the moon revolves around the Earth does not make my view "geocentric".
Using a "celestial coordinate system…with the Earth at 0,0", the moon is revolving, and not rotating on its own axis, by definition. So long as you define "orbit/revolution" as a rotation about an external axis, that is.
If you think of "orbit/revolution" as a translation in a circle/ellipse, on the other hand, then the moon can be said to be rotating on its own axis as well as "orbiting/revolving".
As I said to you up-thread, you first need to understand the difference between translation in a circle, and rotation about an external axis. They’re not the same motion.
…and to write out an equation for the moon’s angular momentum you have to assume that the moon is rotating on its own axis in the first place. It’s not like the equation itself proves that the moon has spin angular momentum. You have to actually think that the moon has an angular velocity about its own axis in order to put that value into the equation.
grammie pups continues to present proof of his ignorance, refusing to define a coordinate system for his bogus physics while also refusing to state the location of his “external axis” around which the Moon “rotates”. He presents a feeble attempt to so so, writing:
Selecting an origin for a coordinate system does not fully define that system. Are the X and Y axes located in the Earth’s ecliptic plane, or in it’s equatorial plane? Or, should one use the Moon’s orbital plane instead? Why does he insist that the origin be the center of the Earth, not the barycenter?
Of course, grammie pups fails again when he ignores the fact that the Moon’s rotation in any celestial based coordinate system will be the same, because geometry tells us that the rotational vector in any such inertial reference frame selected will be parallel to that in any other celestial reference frame and exhibit the same magnitude. The choice of origin does not matter, the rotational inertia will always be the same.
The particles within the Moon do not move in concentric circles around an external point or axis, as required for rotation around said axis. The Moon rotates once an orbit as it’s CM traces an elliptical trajectory around the Earth.
I was actually quoting barry, Swanson.
grammie pups, I was replying to YOU as you continue to fail to provide an exact location for the your claimed “external axis” around which the Moon “rotates”. The real world physics definition of “rotation” requires that all the particles in the body move in concentric circles around a single fixed point. So, pups, where is that point and axis in 3D space, not in some fantastical a 2D cartoon?
Swanson, you may have been replying to ME, but the majority of your 11:19 AM comment were criticisms that should have been directed to barry, since I was only using his choice of words. I’m not sure why you are asking me questions that I have already answered before. It doesn’t matter where I say the external axis is, you will just argue the same thing you do every time – you think a rotation about an external axis can only occur in a circle, and thus with an elliptical orbit there is no location for it that will satisfy you. But, that darn definition of "revolution" as being a "rotation about an external axis" still exists, and there’s nothing you can do about it. It’s been that way for hundreds of years.
Now, please stop trolling, and Merry Christmas.
grammie pups continues playing with words. He thinks that substituting “rotate” for “revolve” makes his claims correct, while ignoring the basics of geometry and physics. He still refuses to define his “external” axis using geometry and math, just endlessly repeating his mantra with a cartoon. For example, he misrepresents “rotation”, claiming that:
No, clown, in 2D kinematics, “rotation” is defined as motion in which all the particles of a body move in concentric circles around a single point. On occasioin, grammie pups even posted a link to a graphic demonstrated this geometry. In three dimensions, the same is true, but the motion is around an axis, which, for the Moon, is not perpendicular to the orbital plane therefore the Moon’s rotation and the orbit of it’s CM are not connected to a single axis.
““rotation” is defined as motion in which all the particles of a body move in concentric circles around a single point”
Just like the motion of the “moon on the left”, with the “point” in the center of the “orbit”.
“He thinks that substituting “rotate” for “revolve” makes his claims correct”
No, I’m not substituting “rotate” for “revolve”, I’m pointing out that “revolution” is defined as a “rotation about an external axis”.
“In three dimensions, the same is true, but the motion is around an axis, which, for the Moon, is not perpendicular to the orbital plane therefore the Moon’s rotation and the orbit of it’s CM are not connected to a single axis.”
The moon does not have a rotational axis passing through its body, it only has an axis that it revolves around. The Earth, on the other hand, has both an axis that it revolves around and a rotational axis passing through its body, which is not perpendicular to the orbital plane.
“The moon does not have a rotational axis passing through its body, it only has an axis that it revolves around. ”
When a debate opponent states observed facts, one troll tactic is to simply deny that the observable fact is a fact.
Excellent illustration of that here.
It is the essence of the TEAMs argument.
Swanson,”rotation is defined as motion in which all the particles of a body move in concentric circles around a single point”
DREMT: “Just like the motion of the ‘moon on the left’, with the ‘point’ in the center of the ‘orbit'”
Swanson ‘He thinks that substituting ‘rotate’ for ‘revolve’ makes his claims correct”
No, Im not substituting ‘rotate’ for ‘revolve’, Im pointing out that ‘revolution’ is defined as a ‘rotation about an external axis’.
Indeed DREMT is fully aware that ORBITS are most of the time elliptical, which cannot satisfy the above definition of ROTATION which he does not disagree with.
Yet here he is, using sleight of hand, to try to get around this obvious contradiction.
grammie pups wrote:
Silly boy. There’s nothing in the definition of a “revolution” which requires an external axis. Airhead grammie continues his moronic attempts to re-define reality to suit his warped world view, denying facts of the Moon’s motion proven found over generations of scientific measurements and calculations. He still refuses to provide an exact location for his imaginary “external axis” which somehow only applies to the Moon and no other orbiting body or satellite in non-circular orbit.
Where is it grammie? Surely an expert on astronomy with your infinite wisdom can answer such a simple question.
By the way, Swanson – it’s a fact that with two axes of rotation, one external and one internal to an object, that object would show all sides to the inside of the orbit.
The only way the moon can have an external axis of rotation that it revolves around, and present always the same side to the inside of the orbit, is if it lacks an internal axis of rotation.
[SWANSON] There’s nothing in the definition of a "revolution" which requires an external axis.
[WIKIPEDIA] A rotation around a completely external axis, e.g. the planet Earth around the Sun, is called revolving or orbiting, typically when it is produced by gravity, and the ends of the rotation axis can be called the orbital poles.
"He still refuses to provide an exact location for his imaginary "external axis" which somehow only applies to the Moon and no other orbiting body or satellite in non-circular orbit."
All orbiting bodies are revolving, Swanson, which means all orbiting bodies are rotating about external axes (located at the barycenter). Not just the moon.
The Earth, for instance, is revolving (rotating about an external axis) and rotating about its own internal axis. The moon only revolves. Why am I needing to explain this to you? You should understand the "Non-Spinner" position by now.
“[WIKIPEDIA] A rotation around a completely external axis, e.g. the planet Earth around the Sun, is called revolving or orbiting, typically when it is produced by gravity, and the ends of the rotation axis can be called the orbital poles.”‘
Shameless, repeated cherry pick of this one unreliable source with contradictory statements, is an admission that no other credible, supportive sources can be found.
The same article states:
“While revolution is often used as a synonym for rotation, in many fields, particularly astronomy and related fields, revolution, often referred to as orbital revolution for clarity, is used when one body moves around another while rotation is used to mean the movement around an axis.”
“Rotation, or spin, is the circular movement of an object around a central axis. ”
Such deceptive, thoroughly dishonest tactics destroys what little credibility this poster has left.
Just search for “revolution rotation about an external axis”, Swanson. Amongst the pages of results, you should find:
https://www.thoughtco.com/rotation-and-revolution-definition-astronomy-3072287
“Revolution
It is not necessary for the axis of rotation to actually pass through the object in question. In some cases, the axis of rotation is outside of the object altogether. When that happens, the outer object is revolving around the axis of rotation. Examples of revolution would be a ball on the end of a string, or a planet going around a star. However, in the case of planets revolving around stars, the motion is also commonly referred to as an orbit.”
grammie pups continues with his incorrect use of words. His latest reference begins by stating that:
There’s no difference between the orbital and rotational motions of the Earth and that of the Moon. “Orbiting” describes the trajectory of a body’s CM, whereas “rotating” describes the change in orientation of the body around an axis thru the CM.
Airhead grammie pups insists on displaying his ignorance of physics as he continues his refusal to specify his “External Axis” about which his Moon’s fantastical “rotation” occurs. His own reference proves him wrong again.
Swanson, "my own reference" proves me right. You seem to be unable to read, all of a sudden. I already know that "revolution" and "rotation" mean different things. "Revolution" means a rotation about an external axis, whereas "rotation" means a rotation about an internal axis. It’s all explained for you in incredibly straightforward terms in the article.
"…he continues his refusal to specify his “External Axis”"
Specified in my 10:40 AM comment. Do try to keep up.
“Swanson, “my own reference” proves me right. ”
And yet it also proves you wrong.
“The same article states:
‘While revolution is often used as a synonym for rotation, in many fields, particularly astronomy and related fields, revolution, often referred to as orbital revolution for clarity, is used when one body moves around another while rotation is used to mean the movement around an axis.’
‘Rotation, or spin, is the circular movement of an object around a central axis.’
But the parts proving you wrong are ignored.
And the textbook definitions are ignored.
Thats how we recognize dishonest trolling!
Thoughtco article:
“The strict definition of rotation is “the circular movement of an object about a point in space.”
What a surprise. Yet another contradictory part ignored.
Oh, and by the way, Swanson, in the Wikipedia article (my first reference) it also states:
"While revolution is often used as a synonym for rotation, in many fields, particularly astronomy and related fields, revolution, often referred to as orbital revolution for clarity, is used when one body moves around another while rotation is used to mean the movement around an axis."
Which does not prove me wrong in the slightest. A body that is "revolving" (meaning "rotating about an external axis") is also "moving around another body". So there’s no contradiction or problem there for those that understand the English language.
This quote, from the same article:
"Rotation, or spin, is the circular movement of an object around a central axis."
Is obviously not a problem either, as "spin" is indeed a circular movement around an internal axis.
“”While revolution is often used as a synonym for rotation, in many fields, particularly astronomy and related fields, revolution, often referred to as orbital revolution for clarity, is used when one body moves around another while rotation is used to mean the movement around an axis.”
Which does not prove me wrong in the slightest. A body that is “revolving” (meaning “rotating about an external axis”) is also “moving around another body”. So theres no contradiction or problem there for those that understand the English language.
This quote, from the same article:
“Rotation, or spin, is the circular movement of an object around a central axis.”
Orbits are mostly elliptical, NOT “circular movement around a central axis”.
Revolution = Orbiting is not a rotation around an external axis, since that would require them to be circular motion, which they are not.
Some people are just in very deep denial, and/or cannot understand plain english.
I would say that some people are just in very deep denial, and/or cannot understand plain English, Swanson. At least barry has agreed that “revolution” is a rotation about an external axis, so you can all argue against him next time he shows up. Right?
grammie pups still can’t understand the implication of conflating “revolving” (as in: orbiting) with “rotating” around a point (or axis), writing:
He utterly fails to accept the plain language from his reference:
It’s quite clear that one can not use a word with two different meanings. One can say that orbiting is revolving, but not use the word “rotate” when referring to orbiting, if one is to be concise. Only the airhead trolls around here insist on such idiocy. “Rotating” means that all the particles of a body move in concentric circles around a center point or axis. When a body is moving in an elliptical orbit, it’s geometrically impossible for all points to move in concentric circles around an axis.
Period, end of story.
I am not conflating “revolving” with “rotating”. Period. End of story.
“A body that is ‘revolving’ (meaning ‘rotating about an external axis’)”
Not conflating, but declaring them the same.
Which is plainly contradicted by your sources, and all others.
So, as I said, Swanson, just search for “revolution rotation about an external axis” and check out the many pages of results all confirming that I am eternally, powerfully, beautifully, gloriously correct. Now and forever. This will be repeated if necessary.
Indeed, if one consistently ignores contradictory information, one can be erroneously convinced that they are eternally, powerfully, beautifully, gloriously correct.
But no one else will be convinced. And more likely they will recognize that behavior as simply narcissism.
grammie pups, I searched:
[revolution rotation about an “external axis]
Found:
https://en.wikipedia.org/wiki/Rotation_around_a_fixed_axis
https://www.physicsforums.com/threads/rotation-of-a-rigid-body-about-external-axis.841993/
Sorry, airhead, these replies put the lie to your claims. But, we already knew that. There were several more non-scientific hits. Rotation around an axis is DEFINED for motion in which the body’s particles move in concentric circles around that axis. That doesn’t work for elliptical orbiting.
…as I said, Swanson, just search for “revolution rotation about an external axis” and check out the many pages of results all confirming that I am eternally, powerfully, beautifully, gloriously correct. Now and forever. This will be repeated if necessary.
Lets review the play in slow motion to see ‘ignoring of contradictory information’ in action.
“Rotation, or spin, is the circular movement of an object around a central axis.”
Is obviously not a problem either, as “spin” is indeed a circular movement around an internal axis.”
Notice the contradictory information, the word ‘rotation’ in the first sentence, is simply left out of the next sentence.
Leaving it out allows a narcissist troll to claim there is no contradiction.
"Rotation around an axis is DEFINED for motion in which the body’s particles move in concentric circles around that axis. That doesn’t work for elliptical orbiting."
Sorry, Swanson, but you seem to be deliberately ignoring contradictory information in order to carry on believing you are correct. Is this narcissism, perhaps?
You have to keep pretending that all the quotes where "revolution/orbit" is DEFINED as being "rotation about an external axis" don’t exist. It really is quite amusing to watch.
“Now and forever. This will be repeated if necessary.”
which will not convince one single new person. But will demonstrate childishness and narcissism.
Please proceed.
I can’t help but notice there’s a lot of childishness and narcissism being displayed by the "Spinners" on this thread…
“all the quotes where “revolution/orbit” is DEFINED as being “rotation about an external axis” dont exist. It really is quite amusing to watch.”
If a paraphrased statement such as the one above is contradicted in the very same article that would suggest to most people the article is not a reliable source, or the quoter is over generalizing it.
If a quote such as the one above contradicts facts that the quoter KNOWS VERY WELL, such as
“Rotation, or spin, is the circular movement of an object around a central axis.”
and
Orbits are in general NOT circular movements.
then what are we to conclude?
There is no choice but to conclude that the quoter is actively ignoring contradictory information.
The use of ‘I know you are but what am I!’ playground taunt is a good example of the childishness on display here.
Swanson, is "spin" another word for "rotation about an internal axis", do you think? I do. "Spin" can just be used interchangeably with "axial rotation" or "rotation about an internal axis".
By the way, I think arguing that "revolution" can’t be a "rotation about an external axis" because you think "rotation has to occur in a circle" is one of the dumbest and most desperate arguments ever made on this blog…but people will keep insisting on it, making themselves look ever more foolish. The fact that an elliptical orbit (the Earth’s orbit around the Sun) is used as an example of "rotation about an external axis" in the Wikipedia entry on rotation ought to give people a hint that maybe the normal rules on rotation don’t apply when it comes to "orbital motion". People need to be a little less inflexible in their thinking…
https://www.drroyspencer.com/2022/12/uah-global-temperature-update-for-november-2022-0-17-deg-c/#comment-1418363
Swanson? barry? Oh well.
Indeed conservation of angular and linear momentum tells us that stopping the orbit by turning off gravity or blowing up the Earth would leave the object with whatever rotation it had, now clearly around its COM, and translating with whatever velocity it had, now in a straight line.
So again, physics is not consistent with orbit defined as a ‘rotation about an external axis’
Since the Moon keeps the same side pointing to the Earth, if it was suddenly released, it would fly off in a straight-line with the near side still pointing in the same direction with no rotation about a local axis.
That should be easy to see. Stop the Moon, cut the orbit, and stretch it into a straight line.
“the same direction with no rotation about a local axis”
Moon men see the sun rise every month, so clearly the Moon is rotating wrt the sun and stars.
Conservation of angular momentum is really just saying a massive body that is rotating wrt to the stars is unable to suddenly stop rotating, without a MASSIVE torque.
You are claiming the Moon men would suddenly stop seeing the sun rising.
So where is that massive torque to stop the Moons rotation coming from, Gordon?
barry…for some entertainment this Christmas, be sure to check out this ongoing discussion:
https://www.drroyspencer.com/2022/12/uah-global-temperature-update-for-november-2022-0-17-deg-c/#comment-1414509
There is bound to be some fireworks!
How do you like them short mild snow-less global warming winterz
http://hp2.wright-weather.com/icons/us_chill.gif
How is it you still confuse climate and weather?
Meanwhile, on the other side of the world…
From the European Centre for Medium-range Weather Forecasts (ECMWF) Thursday December 22 2022:
What’s the difference between weather and climate?… You can get out of the weather.
maguff…”Another heat wave in South America,with temperatures over 35C in Patagonia…”
***
More propaganda from Maguff’s sources.
https://www.weather25.com/south-america/argentina/patagonia?page=today
“Friday, 23 December 2022
The weather today in Patagonia will be hot with temperatures reaching 28C. During the evening and night time the temperatures will drop to 14C”.
Forecast Patagonia Dec 26, 29; Jan 1:
38 C
https://www.weather25.com/south-america/argentina/patagonia?page=day#date=2022-12-26
China sets out clear and independent long-term vision for space
by Andrew Jones December 22, 2022
“The overarching ambition is to make China one of the worlds main aerospace powers by 2030 and become a fully comprehensive space power by 2045. CASC, ranked 322 in this years Fortune 500 list, has previously stated plans to make China a global leader in space technology by 2045, a focus seen by some as a challenge to the U.S.”
…
CASC has previously released grand plans for space, including a space transportation roadmap to 2045, and plans to development a $10 trillion Earth-moon economic zone.
https://spacenews.com/china-sets-out-clear-and-independent-long-term-vision-for-space/
Linked from: https://instapundit.com/
[Well, they got their own space station- not some International Space Station- at a Russian inclination.]
Are going to have some chick standing on the lunar surface before the end of 2024 AD?
And someone standing Mars surface by around 2030 AD
So in terms lunar have 2 lunar landing before end 2025 and add 4 more before end of 2026. Then discuss lunar bases or whatever, get ready to sent crew Mars. And should have tested artificial, before this.
Or perhaps China will tested artificial gravity- before this.
google:
Why does China want to build a kilometre-long spacecraft? And is it even possible?
By Stuart Clark
Published: 28th September, 2021 at 04:00
https://www.sciencefocus.com/news/why-does-china-want-to-build-a-kilometre-long-spacecraft-and-is-it-even-possible/
“In other words, this most recent announcement is the beginning of China thinking about how to build such a spacecraft in the future, rather than a declaration that it intends to begin construction.”
I wouldn’t make 1000 meter tall, I start with 20 meters and mars amount of artificial gravity. Or find out the shortest length for Mars gravity and then, perhaps shortest length needed for Earth artificial gravity. And if needs 1 km, use 1 km of rope, first. Though maybe needs to be 1.5 km of rope.
North Germoney isn’t North CONUS, he he.
+4 C last night, +8 C now at 1 PM on Dec 23.
Wonderful!
But like last year, the price for these mild winter moments very probably will be a cool spring.
The moderator job is open, have you applied yet ???
Aaaah, the little ankle biting dachshund is here again.
What happened to Tim? He seemed to disappear at a time when he was on the spot, with a couple of important questions to answer…
A few minutes after Barry posted his long comment, Graham replied with a long one in which he said that he read it a few times.
A few hours after Tim went up and about, Graham was already fidgeting over a response and was sure he was gone for good.
By chance Tim returned this morning:
https://www.drroyspencer.com/2022/12/uah-global-temperature-update-for-november-2022-0-17-deg-c/#comment-1415068
Or else he would have started to develop an attachment problem.
Tim returned, and wriggled. No surprises there.
Tim corrected once again Grahams misconceptions about rotation.
But it was not Grahams sammich, so it was ignored.
He soldiers on.
Tim corrected Nate’s misconceptions about rotation? I don’t recall them debating their difference of opinion. Strange, that.
Gaslighting Graham gently gaslights a little more.
Little Willy, please stop trolling.
Does Gaslighting Graham really know what equivalence means?
Does Little Willy ever stop trolling?
Your friends-in-denial Robertson and Clint R are constantly trolling 100 times more than Willard ever could.
I think Little Willy does a pretty good job of trolling 100 times more than most people on this blog. I guess I’m the one on the receiving end of it, more than anyone else, so I would probably notice that more than you do.
Gaslighting Graham gently gaslights a little more.
Do you think he will ever opine on if Haleys comet rotates, Binny?
How about you opine on that same issue, Little Willy?
See, Binny?
Graham is the Question Poseur here.
See, Bindidon? Little Willy does a pretty good job of trolling 100 times more than most people on this blog. I guess I’m the one on the receiving end of it, more than anyone else, so I would probably notice that more than you do.
See, Binny?
Graham refuses to answer a simple question Tim asked him.
Everybody knows why he does not answer it.
He would rather get in a food fight rather than to own his gaslighting.
Little Willy, please stop trolling.
An orbit is a PATH. End of.
Bingo.
Then the issue will remain forever unsettled. After all, both "sides" can agree than an orbit is a path, or trajectory.
One side imagines that a planet should follow a ‘path’ like a horse would, nose forward, whereas the rest of us are not stoned on LSD.
nate…”One side imagines that a planet should follow a path …”
***
I have been clear that the Moon does not follow a path, it creates a path that is the resultant of Earth’s gravitational force and the lunar momentum.
I just learned recently that the elliptical plane keeps changing direction every 8 years or so. In other words, the major axis is rotating.
“I have been clear that the Moon does not follow a path”
A path is an orbit.
Sure, both sides can agree that an orbit is a path, or trajectory. Which is why such a definition does not settle the issue. Shall we go round again?
“Then the issue will remain forever unsettled”
No. Because a path does not require an orientation.
Unless and until physicists really cut the Gordian knot of a geometrical equivalence, they will NEVER be able to study a phenomena using physics.
Graham has finally succeeded in putting an end to science.
Good for him!
Well, the issue can be settled by definitions of "revolution/orbit", without any need to consider the physics of the situation, but "Spinners" don’t like the way that goes, so they’d rather stick with "an orbit is just a path", and then forever get themselves confused about reference frames and angular momentum and torques for the rest of their lives.
Spinners would rather stick with the facts.
Vagueness in the meaning of words is the best friend of a troll.
Terms like ‘Orbit’, ‘Rotation’, ‘One Motion’ must remain il-defined.
That enables the troll to keep the argument going indefinitely.
When asked to precisely define terms they are unable to do it. That would be against their trolling interests.
Attempts to precisely define terms by their opponents, in order to settle the argument,
https://www.drroyspencer.com/2022/12/uah-global-temperature-update-for-november-2022-0-17-deg-c/#comment-1415057
must be opposed, ignored, dismissed or diminished.
nate…” Terms like Orbit, Rotation, One Motion must remain il-defined.
That enables the troll to keep the argument going indefinitely.
When asked to precisely define terms they are unable to do it. That would be against their trolling interests”.
***
It’s your side that tries to redefine physics terms to prop up your anachronism that the Moon rotates on a local axis. I have invited all of you to rebut my argument related to curvilinear motion and not one of you has attempted it. The reason is obvious, none of you have a scientific argument for rebuttal, so you try to redefine common terms like rotation to suit your red-herring arguments.
Anyone who has studied physics understands clearly what rotation means. It can involve the rotation about an internal or an external axis.
A planet is obviously rotating about an external axis. We can quibble over whether the motion is rotating or revolving, two words that are often interchanged. For example, a pistol, where the chamber rotates about a local axis, is called a revolver.
With the Earth-Moon system, whether the Earth represents an internal or external axis for the Moon depends on one’s reference frame. With the Moon as a centre, obviously the Earth represents an external axis. However, if the Earth is the inertial reference frame that it is normally considered to be, then the Earth is an internal axis for the Moon.
In engineering problem sets, when you draw a freebody diagram for the Earth-Moon system, you replace Earths gravitational field with a vector pointing from Moon to Earth. You label it as ‘f’ or ‘mg’, which are equivalent.
In other words, Earth is regarded as the axis about which the Moon rotates/revolves. And that’s the truth of it.
Come on, Gordo.
Tim and others have refuted your demonstration many times already.
If you respond to my question about the car, I will find the receipts for you.
What do you say?
Readers will note that I no longer directly respond to Nate. I try to ignore him as much as I possibly can, but it is tricky when he just will not leave me alone.
Except when he needs to quote me, which is a lot lately.
And when he feels he has a sensible response. Apparently at the moment he doesnt have one.
See what I mean?
Will Gaslihting Graham ever find out what equivalence means?
Yes, we need something to settle the issue of which of the two equivalent descriptions of the MOTL is the correct one. One way of doing so, which doesn’t require any consideration of the physics involved, is to look at how "revolution/orbit" is defined. Of course, if you just go with "an orbit is a path", you get nowhere.
A path through space does not define or require an orientation with either the path or either/any of the bodies which define that path.
…which is why it does not settle anything.
But you insist that an orbit defines an orientation.
Only in his Motte mode, Richard.
He only concedes equivalence in Bailey mode.
It does…if I asked you how an object that was orbiting, whilst not rotating on its own axis, remained oriented whilst it moves, you would say like the MOTR. There you go.
The GIF does not settle anything, but the transmographer refutes the idea that the Moon spins.
Gaslighting Graham gently gaslights a little more.
MOTR is what happens when the Moon does not rotate during its orbit/path wrt the fixed stars.
MOTR is your definition of "orbit". Whether you understand that, or not. Trouble is, you’ve got nothing to back it up.
See, Richard?
Gaslighting Graham *still* fails to realize that the Moon on the right is counterfactual that can *only* be settled by a physical argument!
First, people need to recognize and understand what the discussion is actually about. Two separate motions, "orbit" and "spin". Each side of this discussion has a different idea of what "orbit" is.
Then, people can move on to deciding which version of "orbit" is the correct one.
Unless Gaslighting Graham finally gets a sammich, Science cannot move on.
You don’t have to stick around if this is not worth your time, Little Willy.
Gaslighting Graham has been trolling this website for 76 months over a trivial point –
Let A, B, and C form a triangle. The ABC triangle is such that the AB line can be dropped on the AC line.
Thus AB = AC.
To go from B to C, one can do two things:
(T1) One can rotate the AB line onto the AC line.
(T2) One can translate the B point onto the C point.
If we abstract away the lines and consider only what happens on B and C, these are equivalent motions.
There’s nothing else to that silly stupid charade.
OK, Little Willy.
” which doesnt require any consideration of the physics involved”
Lets face it, that would be against their trolling interests.
Physics and astronomy for planetary motion? Pfft!
Maybe one day Graham will realize that a physical problem requires more than geometry to be solved.
Just maybe.
Plenty of people on both sides of this debate seem to think the issue can be resolved by geometry alone. Little Willy just chooses not to obsessively stalk them. There is really very little physics that needs to be discussed…and it has most certainly all been discussed 100 times before already.
Geometry? Sure.
Start by defining ‘rotation’ with geometry.
Then define ‘one motion’ with geometry.
The we will see if the issue can be resolved with geometry.
nate…the only time rotation would apply in geometry is in the case of a rotating axis, and that’s not the same thing. Are you sure you’re not talking about trigonometry? I don’t recall an axis being used in any geometry I studied.
Come on, Gordo.
Affine geometry:
https://en.wikipedia.org/wiki/Affine_transformation
No need to play dumb.
Little Willy, please stop commenting on every comment.
Gaslighting Graham could correct Gordo on a trivial blunder.
He prefers to gaslight instead.
Will “Spinner” ever argue against “Spinner”? On even the most trivial point? Of course not.
Gaslighting Graham gaslights a little more.
If by "gaslighting" you mean "telling it like it is". I don’t think I have ever seen "Spinner" argue against "Spinner" in all the time I’ve been here.
Another if-by-whiskey by Gaslighting Graham.
Feel free to correct me if you have ever seen "Spinner" argue against "Spinner". I guess you and RLH had a minor exchange the other day, but it hardly amounted to anything and you quickly turned it around on to me, as always.
Cuz its boring. Bug races are better..
https://www.facebook.com/watch/?v=648698082583347
Notice DREMT refuses to define even ‘rotation’. Hint: he could use Madhavi. He knows it won’t work out for his narrative.
That’s how we recognize a troll.
He refuses to define ‘one motion’ as well. How can it be that he uses this term regularly but he is unable to define it?
Thats how we recognize trolling.
Troll Nate, are you still confused about the definitions?
Possibly, because you can’t learn.
But likely you’re just trolling.
You’re a braindead cult idiot posing as an anonymous troll.
And, that ain’t an insult — it’s reality.
No wonder Gaslighting Graham always flees when Tim asks him a question that he uses some physics.
Perhaps he learned his lesson when he got spanked on torques?
willard…”No wonder Gaslighting Graham always flees when Tim asks him a question that he uses some physics”.
***
Tim seldom relies on physics, his forte being thought-experiments.
Come on, Gordo.
Physics is 90% thought experiments. The other 10% is equational stuff.
And you forgot about the car.
Why is that?
Worthless willard makes up nonsense because he’s NEVER studied physics.
You have no idea what’s physics, Pup.
Here’s physics:
https://youtu.be/vWz9VN40nCA
“Physics is 90% thought experiments”.
Maybe in theoretical physics, but we have seen where that leads. We end up with inane theories about time dilating and space-time curving.
C’mon, Gordo.
Twas a joke.
Physics is 99% maths.
In physics, thought experiments represent math models.
While bladder dilation comes with time, never confuse time and bladder dilation!
As I said, it has all been discussed 100 times before. Even by people other than myself, Little Willy. Imagine that!
Gaslighting Graham chickens out once again.
Has Tim answered those questions yet?
Had Gaslighting Graham read Tim properly, he would have to answer yes to his rhetorical question.
Alas Gaslighting Graham is only here to troll.
Still no response from him…
Still no physics from our Moon Dragon cranks.
Really? You’re going to pretend you’ve never seen any discussion of physics from any of the "Non-Spinners"!?
This is a thread on "an orbit is a PATH. End of" by the way. So it’s not exactly lending itself to anything other than a discussion of what you call "geometry".
Will Gaslight Graham gaslight readers into thinking that he added ANYTHING new to the Moon Dragon crank position in this thread?
Perhaps he will try to fake that he is having discussions again?
If his theme of the moment is that geometry definitions do not settle the issue, why the hell would he *still* monopolize another thread about them if not to troll?
The mind wonders.
Sure, I’m repeating previous discussions. For the benefit of anyone reading that is unfamiliar with them, or those that are familiar, but for which it might not have "clicked" up until now. I’m just generous that way.
Gaslighting Graham gently gaslights once again.
The reason why he’s shying away from physics is quite simple –
He would not like that readers see how Moon Dragon cranks always end up embarassing themselves when they talk about physics.
Really simple.
I wonder if we’ll ever see Little Willy discuss physics?
[T] Get over it, the bolts FORCE it to rotate about its COG. If the horse didn’t rotate about its COG, the nose would keep pointing north. But when the platform starts to spin, the bolts apply a torque about the COG axis that makes the horse rotate. With no bolts (nor other similar fasteners), there is no torque about the COG axis and no change in angular velocity about the COG axis. The nose keeps pointing north and the horse is not rotating.
[GG] Don’t be silly, Tim. Replace the wooden horse with a chalk circle in the same position. Is the chalk circle “rotating on its own axis”, or simply rotating about the carousels axis?
[T] That changes nothing about anything I said. Locate the center of the circle. Draw a vector from that point to any point on the circle. If the vector (a) maintains a constant length and (b) changes orientation, then the vector (and the circle) are rotating about that axis.
The only question left is “changes orientation relative to what?”. You are clearly thinking “relative to the rotating platform”. I prefer to start from an inertial frame that is NOT rotating. Working within a rotating frame of reference introduces all sorts of unneeded complications (like Coriolis forces). Much easier to choose an inertial frame. To measure relative to “the direction north” rather than relative to “the direction toward the center of the MGR”.
And then Gaslighting Graham continued to gaslight a bit more.
…wonder if we’ll ever see Little Willy discuss physics?
Gaslighting Graham gently gaslights a little more.
Little Willy, please stop trolling.
So many cult idiots, throwing so much crap against the wall, and still the simple ball-on-a-string wins.
That’s why this is so much fun.
A-ball-on-a-string is only relevant to a-ball-on-a-string.
rlh…”A-ball-on-a-string is only relevant to a-ball-on-a-string”.
***
Polly want a cracker?
This is an ex-parrot…J. Cleese in a skit at Notlob, an obvious palindrome for Bolton.
I purely state the facts as they are.
No, troll RLH. You pervert the facts.
Just like when you keep claiming the ball-on-a-string is not relevant when many colleges and universities use it as an introduction to learning about orbits.
You just can’t face reality, like the rest of your cult.
Balls on string are mostly used to learn about centripetal force, Pup:
https://www.wired.com/story/the-physics-of-swinging-a-mass-on-a-string-for-fun/
You can’t even do your TROLLING properly.
Little Willy, please stop trolling.
Troubleshooting an Internal Server error…dang!!!
rlh…”If gravity pulls on one body one way then it pulls equally on the other body the opposite way.
Thus around a barycenter there is an equal force in both directions. It one body is larger than the other then it will move a lesser distance as it moves in its orbit. That is all. Science agrees”.
***
I have no argument with your opening sentence. However, you open the second paragraph by claiming a barycentre has an equal force in both directions. A barycentre has no force, it is a mathematical definition that locates a centre of mass. In order for a body to move another body, the force must be enough to actually move it.
part 2 of 985
What you are missing is that the force of gravity between the Earth and the Moon is insufficient to pull either body toward the other. All the Moon can offer for force is enough to raise the oceans by a metre. To affect your idea, that force would have to be strong enough to pull the Earth off its orbital path and cause it to move in a looping orbit.
As evidence of that claim, the force exerted on the Moon by Earth is just barely enough to move the Moon by 5 metres for every 8000 metres moved by the Moon in a tangential direction. If the force was present to pull the Moon further from its orbit, it would begin accelerating the Moon toward Earth, and we would have become extinct long ago.
The Earth would need to develop a significant wobble and the Moon an even greater wobble in its orbit. Neither have been observed.
The Moon is rotating essentially around the Earth’s centre. Newton’s law of gravitation depends on that. The notion that both are orbiting a barycentre comes from a mistaken idea related to binary star system. Stars are far more massive than either the Earth or the Moon and I could see a barycentric problem developing involing a relative motion.
However, the evidence for even binary star systems is slight due to the massive distances over which we observe them. We cannot see such a motion with an optical telescope therefore we are reliant on radio-telescopes, which ascertain such observations by looking at shifts in gas spectra.
Gravity exerts sufficient force to cause the bodies to orbit that apply equally about the barycenter, just as Newton 3 claims.
“The notion that both are orbiting a barycentre comes from a mistaken idea related to binary star system.”
No, it comes directly from Newton 3. Regardless of size.
In his extensive coverage of lunar motion, Newton mentioned nothing about the Earth and Moon orbiting a barycentre. In fact, he produced the equation…
F = G.m1.m3/r^2
Where r is measured centre to centre of the masses, not from an imaginary barycentre to each mass.
correction, m3 should be m2.
You’ll have to check me on precedence here, but I think Newton’s was the first description of the concept of a barycentre.
Book 3. Proposition 12. Theorem 12.
I suppose Newton never expected anyone would doubt the Moon’s spin, so he didn’t mention the Earth-Moon baricentre explicitly.
maguff…nothing in your quote to indicate the planets and Sun are rotating around that barycentre.
If that was the case with the Earth-Moon system, Newton would have needed to modify…
F = G.m1.m2/r^2
GR,
I’m not going to debate this basic material with you. You can study up on it.
Why would you need to modify the Universal Gravitation equation? All you need to do is balance it with the centrifugal force.
That’s all I have to say about that.
If gravitation cannot exert a force on the Moon so that the Man on the Moon keeps looking at us, where does the force come from?
Worthless willard, that’s a great example of the crap you idiots keep throwing against the wall.
It’s also a violation of the concept that “There is no stupid question”.
Good job.
Pup,
If you accept not to comment for 90 days, I will tell you the answer to that question.
Say yes, please.
Otherwise do the Pole Dance Experiment.
Worthless willard, you have no worthwhile answer to your nonsense question.
That’s why you’re worthless.
The answer is a four-letter word, Pup.
My offer is still valid.
No one said Earth’s gravity does not act on the Moon, or vice-versa. It has already been pointed out that lunar gravity raises our oceans about 1 metre.
You have to understand that the Moon is moving at considerable speed in its orbit, and with its mass, it has a tremendous linear momentum. As it moves, Earth’s gravity diverts it roughly 5 metres for every 8000 metres the Moon moves along a tangential path. That is enough of a diversion to make up for the Earth’s curvature therefore the Moon remains at a relatively constant altitude.
And the same effect occurs on the Earth. The Moon pulls on the Earth too. So they both orbit the barycenter that they create.
C’mon, Gordo.
Let me read what I wrote more slowly:
If gravitation cannot exert a force on the Moon.
So that the Man on the Moon keeps looking at us.
What does?
I know that gravity exerts a force. And no, not just tides. Gravity deforms both the Earth and the Moon:
https://scitechdaily.com/nasa-scientists-measure-deformation-moon/
The usual story is that the Moon spins.
The Moon spin is the physical reason why the Man on the Moon always show his face to us.
Remove the Moon spin, and you’re left with having to provide a physical explanation.
No geometry word games.
Physics.
willard…”The Moon spin is the physical reason why the Man on the Moon always show his face to us”.
***
Paint the face of the man in the Moon on the driver-side door of a car in North America. Let the car move CCW around an elliptical track. Or paint the face on the string side of a ball on a string. The mitm image always faces the centre of the track, yet in either case, the car or ball are not rotating about a local axis.
If that doesn’t make you happy, paint the face on the inside of a horse bolted to the floor of a carousel. We know the horse cannot rotate about a local axis because it is bolted to the floor.
How then do you explain the face always pointed inwardly when it is impossible for the horse to rotate locally?
Come on, Willard, I can’t dumb it down any more.
C’mon, Gordo.
Which part of “physical” you do not get?
Your pseudo-geometry does not cut it.
It not my geometry that doesn’t cut it, it’s the inability of your brain to follow the physics. I have dumbed it down as much as possible and you still don’t get it.
Come on, Gordo.
A car does not get pulled in a curve because of how you define words. Forces are involved, not vague descriptions of motion.
As you yourself say, gravity provides a pull. That pull is perpendicular to the Moon orbit. Something else is at work that explains the velocity of the Moon and its orientation.
Find it.
And no, you will not find it in a geometry book.
Now bolt a gyroscope (which always aligns with the fixed stars) to an object and then then tell me whatever you bolt it to does not rotate about it.
‘Let the car move around an elliptical track’
This is what the moon does around the sun. It does not do this around the earth.
The moon does not always face the sun. Hence it is rotating about its axis.
Go gnaw on a lump of coal while you think about it. Try drawing a sketch that includes earth and moon moving around the sun.
Here is section of moon and earth trajectories around the sun.
Do you see any moon doing circles around earth? No it does not. ball-of-string only works if earth is stationary; it is not.
https://en.wikipedia.org/wiki/Orbit_of_the_Moon#/media/File:Moon_trajectory1.svg
Your dentist will probably recommend that you don’t gnaw on lumps of coal.
Ken, please stop trolling.
barry…”Rotation isnt dependent on translation or even related to it. Translation occurs when every point on an object moves in the same direction the same distance.
https://en.wikipedia.org/wiki/Translation_(geometry)
If we take an orbit, the MOTR represents translational movement”.
***
Barry…good point, but you are confusing translation of a coordinate system with the translation of a body within a coordinate system.
If you have an x-y coordinate system centred at 0,0, and you translate the 0,0 point to 0′,0′, then the entire x-y plane has translated.
The translation to which we are referring is the translation of a mass or a particle within a coordinate system.
For example, if you have a particle at x = 0, y = 0 and you translate the point along the x-axis to +5, the particle has moved (translated) from 0,0 to 5,0. That is also rectilinear translation without rotation. If you now move it along x = 5 to y = 5, you have performed rectilinear translation from 5,0 to 5,5. If it’s a rigid body rather than a particle, the COM will do the translating while the body remains upright.
You could translate directly from 0,0 to 5,5 which would be motion along a line at 45 degrees to the x-axis. As long as all particles in the body move along a straight line, at the same velocity, that is rectilinear translation.
Suppose 0,0 is point A and 5,5 is point B. You can translate directly along the line at 45 degrees or you can break the trip into two sections, from 0,0 to 5,0 then from 5,0 to 5,5. It’s all rectilinear translation.
Suppose you have a circle with radius 5 centred at 0,5. Therefore you have an arc of the circle from 0,0 to 5,5, with A and B defined in the same manner. If you move a particle from 0,0 along the curve to 5,5, you are performing curvilinear translation. That is, the particle is moving along a curved line from A to B.
If the Earth is centred at 0,5 and the Moon is located with its COM at 0,0, if it moves along the circle from 0,0 to 5,5, it is performing curvilinear translation while keeping the same side pointed at Earth.
You have to be careful here. I don’t want to get into this deeper since I have described the motion many times where all points on the Moon move along concentric circles. You have to remember that the Moon at 0,0 is trying to move along a straight line and that Earth’s gravitational field is acting on it. Therefore, the Moon moves like MOTL.
“the Moon moves like MOTL”
i.e. rotating about its own axis once as it orbits the Earth.
rlh…”rotating about its own axis once as it orbits the Earth”.
***
I have invited you to download the free Irfanview viewer in which you can break the MOTL gif into individual jpeg frames. There are about 50 frames and you can see precisely at each part of the orbit, that the Moon’s motion is curvilinear translation with no local rotation. That is, all parts of the Moon in MOTL are always moving in parallel, making it impossible for the Moon to rotate about a local axis.
“Moons motion is curvilinear translation”
Wrong Gordon, as the shown in the reference you saw just the other day.
But you persist in making up your own definitions. Then you will never be effective in communicating with anyone else.
https://www.drroyspencer.com/2022/12/uah-global-temperature-update-for-november-2022-0-17-deg-c/#comment-1412428
nate…”Moons motion is curvilinear translation
Wrong Gordon, as the shown in the reference you saw just the other day.
But you persist in making up your own definitions”.
***
Me and Isaac Newton agree on the definition of curvilinear translation, you are obviously the outlier. Make that a plain liar.
Quote Newton agreeing with you.
If you can’t then we’ll know who is the liar.
If you look at each frame you will notice that the MOTL rotates compared to the frame as it orbits the center. The MOTR does not.
“curvilinear translation”
Is movement along a curve. You can throw a ball at an angle in the air to see it for yourself.
It’s got nothing to do with the rotation of the ball.
“If you now move it along x = 5 to y = 5, you have performed rectilinear translation from 5,0 to 5,5. If its a rigid body rather than a particle, the COM will do the translating while the body remains upright.”
If the particle is part of a rigid body you have now deformed the body. You were better, perhaps, making the movement 5,0 to 4,5. And what you have now is a rigid body rotating.
In this respect, the Moon is part of a a rigid body, Earth/Moon unit. The Moon is rotating because the whole body is.
So are the horses on a merry-go-round.
If you are moving with the axis frame, you don’t notice the horses rotating, but the rest of the world is now rotating around you.
The horses on a merry-go-round are rotating about an axis in the center of the merry-go-round (revolving, in other words), and not rotating on their own internal axes. If you disagree, argue it out with Nate.
The horses on the merry-go-round are part of that merry-go-round, not separate from it.
That’s correct…but you agree that the horses are not rotating about axes that go through the body of the horses themselves…whereas some people do not agree. They’re a bit silly.
Now braindead barry implies Moon is rigidly attached to Earth!
“In this respect, the Moon is part of a a rigid body, Earth/Moon unit. The Moon is rotating because the whole body is.”
I wonder if he will call himself a “lying dog”?
(That’s why this is so much fun.)
barry…”curvilinear translation
Is movement along a curve”.
***
It is more precise than that, Barry.
Newton described the motion as follows. The Moon is moving with rectilinear motion which is converted to curvilinear motion by Earth’s gravitational field. Note that motion and translation are the same, a motion from A to B is translation, whether it moves in a straight line or along a curve.
Rectilinear translation is defined as a body moving in a straight line so its constituent particles are moving in parallel and at the same speed. The same must apply along a curved path.
I have proved in past posts that the same applies to curvilinear translation.
Consider the lunar orbit is a circle of radius 5 centred at 0,0 on an x,y plane. Place the Moon at 5,0 along the X-axis, moving instantaneously CCW and pointing straight north. It wants to keep moving north along x = 5 because all it possesses is linear velocity/momentum. That is rectilinear motion as described by Newton.
As it moves 8000 metres along x = 5, it is acted upon by Earth’s gravitational field which diverts it 5 metres over the 8000 metres. That 5 metres is the natural curvature of the Earth over 8000 metres, therefore the Moon maintains its altitude.
Note…if the Moon was moving with rectilinear translation at 5,0 then it has to be moving with the same motion when diverted. Therefore all parts are moving along concentric circles at the same angular speed, not tangential velocity.
It is vital to note that the Moon can only move in a linear, tangential direction. So, at each instant that gravity acts to pull the Moon off course, the Moon always maintains its motion along a tangent line to each point. That is, the Moon is constantly re-oriented to keep the same side pointed at Earth.
It is not rotating about a local axis although one could claim it is rotating wrt the stars about Earth as its axis. I prefer the word re-orienting because rotation obviously confuses a lot of people.
If the Moon at 5,0 is moving north along x = 5. It’s motion is rectilinear. An instant later, it is moving with the same motion, but its direction vector has re-oriented slightly. There is no rotation in this motion about a local axis because all points on the Moon are moving in concentric circles.
That is the key. The Moon moves with a constant linear momentum. There are no forces that can cause it to rotate about a local axis. For every 8000 metres it moves tangentially it is diverted 5 metres toward Earth.
How do I know that? The curvature of the Earth is a 5 metres change per 8000 metres. In order to maintain an orbit, the Moon must pretty well follow that ratio. If the ratio is greater, say 3 metres per 8000 metres, momentum would prevail and the Moon would elongate the orbit and eventually break free. If the ratio is too small, say 8 metres per 8000 metres, the Moon will lose orbit.
Again, straighten the orbit into a straight line. You have the same situation at 5,0 where the Moon was moving with rectilinear translation, with the left side facing the Earth. That’s proof that the orbital motion is curvilinear translation without local rotation.
“The Moon is moving with rectilinear motion which is converted to curvilinear motion by Earths gravitational field”
The PATH it follows is a ‘curvilinear motion’. That does not alter the way the body is rotating or not. It just continues to point at the fixed stars. See Newton.
That makes no sense, Richard. The Moon does not follow a path, it creates one in conjunction with Earth’s gravitational field as it moves. That elliptical path is also re-orienting every 8 years as it’s major axis is re-orienting wrt the stars.
The lunar motion is curvilinear translation, not the path/orbit. At each instant, the Moon is trying to move in a straight line while the vector representing that linear velocity is constantly bent into an orbit by the gravitational field. Therefore,the velocity vector changes direction through 360 degrees wrt the stars during one orbit.
If you can imagine the instantaneous velocity vector as representing a point at the COM, which is typical with a uniform rigid sphere, then imagine each point outside that COM having a parallel velocity vector, you have a humungous number of velocity vector all pointing in parallel at any one instant.
If the Moon was rotating about the COM, those vector would be required to rotate around the COM at the same time. That is not the case, so we have pure curvilinear translation without local rotation.
To visualize that better, consider the orbit to be circular, with a radial line connecting Earth’s centre to the lunar centre, while extending through the far side. A portion of that radial line is contained within the Moon, therefore that portion would have to rotate within the radial line as the line rotated about Earth’s centre.
In fact, there is no need for the portion of the radial line within the Moon to rotate since all points along that line are moving in concentric circles about Earth’s centre.
Can you not see that? Local rotation requires the portion of the radial line within the Moon to turn a full 360 degrees about the lunar COM per orbit. It can’t do that if those points, including the COM, are all moving along concentric orbital paths.
Gordo says:
Gordo further pontificates, asserting that:
If you use celestial coordinates to define your radial line which is fixed to the Moon, you would find that it’s orientation would change direction during the orbit, resulting in one rotation each orbit.
Swanson, please stop trolling.
“The Moon does not follow a path”
Everybody else thinks that it does. Including those who are tasked with creating Moon orbits based on its future projections.
“It can’t do that if those points, including the COM, are all moving along concentric orbital paths”
So there can be no inertia about the COM of the Moon. Despite that fact that a pendulum (or a gyroscope) hung at the poles of it will show a rotation wrt the fixed stars.
Rectilinear and curvilinear motion describe the movement of the CENTER of an object. Not its orientation during that movement.
Cold weather records broken in British Columbia, Canada…
https://www.msn.com/en-ca/weather/topstories/b-c-deep-freeze-41-temperature-records-broken-as-arctic-chill-pushes-through-another-day/ar-AA15C6fj?ocid=hponeservicefeed&pc=U591&cvid=5d3694fb3ba94d0fa70aca1bf2d5c2f0
Abbotsford area
Preliminary new record of -13.4 C
Old record of -11.7 C set in 1970
Agassiz area
Preliminary new record of -13.6 C
Old record of -13.5 C set in 1990
Blue River area
Preliminary new record of -39.8 C
Old record of -35.8 C set in 1983
Burns Lake area
Preliminary new record of -35.7 C
Old record of -34.9 C set in 1983
Cache Creek area
Preliminary new record of -30 C
Old record of -26.5 C set in 1983
Clearwater area
Preliminary new record of -34.5 C
Old record of -27.8 C set in 1924
Clinton area
Preliminary new record of -35.8 C
John Christy of UAH straightening out the US government a while back…
https://www.youtube.com/watch?v=Cz45fETw078&ab_channel=HouseNaturalResourcesCommitteeDemocrats
Since it soon will be Newtonmas:
https://telescoper.wordpress.com/2019/11/13/newtons-laws-in-translation/
Merry Festivus!
Thanks, Willard. What caught my eye immediately is the guy has 5 years of Latin yet he could not even begin to translate the original Latin in Principia.
C’mon, Gordo.
The guy actually did translate the most important bits. But if you want to rely on the authoritative translation, it’s this one:
https://www.thecrimson.com/article/1999/10/28/cohen-updates-370-year-old-translation-pas-if/
You can find it on the Z-library or elsewhere.
Do you have a link to the 900+ page original from Cohen?
Cohen claims the translation by Motte is indecipherable, never mind the original by Newton.
Indeed I do, Gordo.
When do you intend to answer my question about the car?
Little Willy, please stop trolling.
maguff…”GR,
Im not going to debate this basic material with you. You can study up on it.
Why would you need to modify the Universal Gravitation equation? All you need to do is balance it with the centrifugal force”.
***
Of course you’re not going to debate it for the simple reason you lack the background in physics to debate it. Anyone who thinks there is a centrifugal force acting knows nothing about gravitational force. Try reading Newton on it, all he talks about re gravitation is centripetal force.
“Of course you’re not going to debate it for the simple reason you lack the background in physics to debate it.”
Blah, blah, blah.
“Anyone who thinks there is a centrifugal force acting knows nothing about gravitational force.”
G x M1 x M2 / R^2 = M2 x v^2 / (R-r)
G = 6.674×10^-11; M1 = 5.97×10^24 Kg; M2 = 7.35×10^22 Kg; R = 384,400 Km; r = 4671 Km.
From which I calculate the Moon’s sedereal period of 27.3 Days. This matches the observed value thus confirming my calculation method.
“Try reading Newton on it, all he talks about re gravitation is centripetal force.”
You should read Proposition 12. Theorem 12 carefully.
maguff…my first consideration is that we should try to get along in the new year. I enjoy discussing science, even with people who hold an opposing view. However, when someone is antagonistic, always trying to prove me wrong, I tend to ignore the person and reply to a third party who may be lurking. I have no problem discussing or debating with you if it is done civilly.
The first problem with your equation …
Gm1m2/r2 = mv^2.r is the RHS.
mv^2/r is derived from f = ma in which acceleration is presumed to be v^2/r. That in turn is derived from the PRESUMPTION that a change in direction of a velocity vector is an acceleration. It is not.
A vector quantity has two components: a vector pointed in a certain direction and a scalar quantity indicating the magnitude of the vector. If you have a vector representing a particle orbiting a circle, it is obviously changing direction, but if the velocity is constant then acceleration = 0.
A change in the direction of a velocity vector is not a change of acceleration. The scalar quantity, or magnitude, must change for an acceleration to occur.
Further proof of this indiscretion is that the acceleration component points inwardly, along a radial line, not in the direction of the velocity vector. That makes no sense whatsoever. If there was even the slightest acceleration in a radial direction, the orbiting body would lose altitude.
F = mv^2/r may work but its derivation is wrong. I have not checked to see if it is wrong.
The only thing I can think of to justify the equation is that the acceleration derived as v^2/r is a fictitious quantity. In other words, there is no acceleration but the body acts as if there was one. Acceleration must always act in the direction of motion, not perpendicular to it.
Re the Proposition. I see no reference in the article to centrifugal force. In fact, Newton may have contradicted his own statement about the Newton II, in which he said, ‘if a force can move a mass…’. Obviously, with planetary motion, there is no acceleration toward the focus of the ellipse. If there was, the orbiting body would lose altitude rapidly.
As it stands, it does lose a tad of altitude but just enough to make up for the curvature of the Earth. I would not call that an acceleration since acceleration involves a change of velocity/second. Since an orbiting body loses no tangential velocity, since no forces are acting to slow it down, I don’t thing mv^2.r applies.
The RHS is the Centrifugal Force which opposes the Earth’s gravitational attraction. This is simply the application of Newton’s 3rd Law i.o.w. Gm1m2/r^2 – mv^2/r = 0. You should have recognized that.
The rest of your comment is about you denying angular acceleration.
“A change in the direction of a velocity vector is not a change of acceleration.”
Of course not since acceleration is defined as dv/dt; a change of acceleration is da/dt called the jerk.
“The scalar quantity, or magnitude, must change for an acceleration to occur.”
Wrong. Given two vectors A and B of equal magnitude but A points North and B points West, they are obviously not equal.
“Further proof of this indiscretion is that the acceleration component points inwardly, along a radial line, not in the direction of the velocity vector. That makes no sense whatsoever.”
It makes perfect sense since the acceleration vector always points in the direction of the net force.
“Acceleration must always act in the direction of motion, not perpendicular to it.”
As I said above, acceleration acts in the direction of the applied force. Get in your car and drive in a straight line at constant speed of 30 mph, you don’t feel any force as predicted by Newton’s 1st Law. After a few hundred feet step on the gas and you will feel a force as predicted due to acceleration.
Now repeat the experiment but this time, while maintaining constant speed, turn the wheel to follow a gradual curved path. Again you feel a force pulling you in the direction of the radius of curvature. This is the centrifugal force at work. Centrifugal force is a fictitious force with real effects.
Centrifugal force is defined as mv^2/r . Which means that its magnitude depends on how fast you take the turn (v^2), and/or how sharp (r) the curve is.
“If you have a vector representing a particle orbiting a circle, it is obviously changing direction, but if the velocity is constant then acceleration = 0.”
Good ol Gordon. We can always count on him for a laugh..
GR,
since you didn’t heed my admonition and chose instead to debate me on this subject, I await your rebuttal to my proof above.
Please, use your physics words.
TM, if you were trying to prove you don’t understand physics and math, you were successful.
You probably can’t find all the mistakes, but start with your bogus equation.
Why do you hate physics?
willard…”As you yourself say, gravity provides a pull. That pull is perpendicular to the Moon orbit. Something else is at work that explains the velocity of the Moon and its orientation.
Find it”.
***
I have already found it and explained it to you. There is only one significant force acting on the Moon, Earth’s gravitational force. The force of solar gravitational force on the Moon is negligible.
The only other phenomenon acting is the Moon’s linear momentum. The lunar orbit is a resultant of the two.
As I recall the sun’s gravity at 1 AU is .0006 m/s/s.
But I will google it:
“At earth’s distance from the sun solar gravity is about 6 millimeters/sec^2 ”
Oh, 6 mm = .006 m/s/s
“Out here, at the distance we orbit the sun, the gravitational pull of the sun is only 0.0006 of the strength of the earths gravity on the surface of the earth.”
Earth surface about 9.8 m/s/s x .0006 = 0.00588 m/s/s
{I am always confusing it, so, what is correct is about 6 mm per second per second or about .006 m/s/s]
“At earth’s distance from the sun solar gravity is about 6 millimeters/sec^2. Earth surface gravity is 9.8 meters/sec^2, about 1,600 times greater.” Or, .006 times 1600 = 9.6 m/s/s
And Earth gravity reduces by Earth radii.
10 radii is what? 1/100th and 20 radii is 1/400, 0.098 m/s/s, 0.0245 m/s/s
6371 times 10 = 63,710 km above Earth surface, 20: 127,420 km
And 30 is 1/900th = 0.010888889 m/s/s: 191,130 km
40 radius is 1/1600 = 0.006125 m/s/s: 254,840 km
And say 45 radii is 1/2025th = 0.004839506 and 286,695 km above Earth surface.
And moon is .3844 million or 384,400 km average distance from Earth
And nearest or perigee is .3633 million km
Sun has about .006 m/s/s acceleration at 1 AU or roughly both Earth and Moon- and Earth gravity has less than .004 m/s/s acceleration on Moon.
And at Earth/Moon L-1 [about 60,000 km towards Earth or away from Moon- is where Earth and Moon gravity force balances, or Moon’s and Earth’s gravity is some number less than .004 m/s/s.
Come on, Gordo.
Gravity is more or less perpendicular to the trajectory of the Moon as it orbits and spins around the Earth. It cannot explain anything else than the distance the Moon has.
In contrast to a string swirling a ball, gravity does not swirl the Moon around. It only provides an acceleration toward the Earth. So you need to find what propels the Moon. Please bear in mind the proper units of a force. It cannot cancel out the angular momentum of the Moon, as you tried to suggest this summer I believe.
Merry Christmas!
So worthless willard believes a force can not cancel linear momentum? That’s just one more example of his incompetence.
Adults would understand how brakes can stop a car. But worthless willard isn’t old enough to drive. All of this is WAY over his head. That’s why he’s so worthless.
Good one, Pup.
Here is what happens when Muricans put the brakes an an icy road:
https://youtube.com/watch?v=aGTbVaqNRuY
And here is what happens when Canucks do the same:
https://youtube.com/watch?v=ETd5LZEnRcA
Do you think space is more like a sticky road or like an icy road?
Think.
Yeah, people in Atlanta don’t do well in the snow (I used to live there). But, it’s always funny to see folks driving those SUV’s and 4×4 PU’s as the snow turns to ice.
https://www.youtube.com/watch?v=1jcLEkjeCy4
I spent 13 years pushing the snow off the road I live on with an old JEEP Cherokee and learned it’s all about traction. Chains and/or studded tires make it possible to navigate a hill, either up or downward, and around curves. Those big SUV’s with oversized mud/snow tires are a recipe for a crash on ice.
Worthless willard reveals his ignorance of physics, and when corrected just doubles down on his childishness resorting to YT videos for his “science”.
He can’t learn when he avoids reality.
The second video shows Connor McDavid Goals But They Get Increasingly More Impossible, Pup.
Your TROLLING sucks.
Who is Connor McDavid? Did he appear in the Highlander?
The Canucks just beat a team in Edmonton last night. There is a guy playing for Edmonton with a similar name but I did not catch it.
swannie…it’s amazing what a difference a proper set of ice-rated tires make on ice. They are only good down to a certain temperature since they too will freeze and lose their grip.
Ice-rated tires have a snowflake and a mountain embedded on them.
Come on, Gordo.
Your Canucks will meet Conor at least four times this season:
https://youtube.com/watch?v=5UeYwogWHrY
Are you sure you watch hockey?
Being the poor sport that I am, I watch the Canucks only when they are winning, especially when they win against, Edmonton, Calgary, Toronto, and Montreal.
Fair.
Tim earlier asked the non-spinners to DEFINE what is the singular axis of rotation of a body. They were unable. Yet they insist there is one.
For a rotating body to stop rotating it needs to experience a torque, by Newtons laws. If the MOTL is rotating only about an axis in the Earth then one would simply need to apply torque on the moon around that axis.
We could apply such a torque by applying a brief strong force thru the COM of the moon opposite to its velocity. This would immediately stop its linear velocity and its orbital motion. But would it stop its ROTATION wrt the stars?
What say folks?
If you think its rotation would stop, explain how.
If not, then explain how its rotational axis is in the Earth.
Moon is NOT rotating, troll Nate. If it were ever rotating, it’s now stopped.
You’re not only late to the party, you’re at the wrong party.
So, no surprise, that’s one non-spinner that cant answer the question…
ALuminum pipe with 1 cm thick walls [.01 meter or 10 mm or 0.393701″ thick pipe walls]
with diameter of 2 meter [2000 mm or 78.74″ 0r 6.561 feet in diameter- outside diameter]
Inside pipe wall diameter: 1980 mm or 1.98 meters and middle of metal: 1.99 meter diameter
which has circumference of pi, 3.14159 x 1.99 meters = 6.2517641 meter of circumference of aluminum metal
which has density of about 2700 kg per cubic meter.
And going to put in water which has density of 1000 kg per cubic meter.
If put material with lower density than 1000 kg per cubic meter, such as water ice, it float in water.
If put material like Aluminun in water, it weighs less compared the Aluminum in air or weighs
2700 – 1000 kg = 1700 kg per cubic meter.
Now lets make 2 meter diameter pipe 20 meter tall [20,000 mm or 787.40157″ or 65.616 feet tall] :
20 times the “6.2517641 meter of circumference of aluminum metal” = 125.035282 square meters which is .01 meter
thick which equals 1.25035282 cubic meters of Aluminum which has mass of times 2700 kg = 3375.952614 kg
But if whole thing was under water, times 1700 = 2125.599794 kg of weight.
Now going to put 1 end on Pipe, inside diameter is 1.98 meter diameter, it’s radius is 1/2 = 0.99 meter squared
times pi = 3.079072359 square meter and going make it 2 cm thick or .02 meters thick times 3.079072359 square meters =
0.061581447 cubic meter of AL which has mass of 2700 kg = 166.269907386 kg
the 20 meter tall 2 meter pipe with one end capped has mass of 3375.952614 kg + 166.269907386 kg =
3542.222521386 kg and round it up and sau it’s 3543 kg
So we put this capped pipe in water, and what happens?
Water flows in the open end, and it flips towards vertical. And open a valve and let out some of the air
it floats exactly vertical.
Let’s pick amount of air to let out, say want 4 meters air.
The volume of air is inside diameter [same as cap: 3.079072359 square meters x 4 meters is 12.316289436 cubic meter]
Got about 12.3 cubic meter of air, and per cubic meter there is about 1.2 kg of gas = 12.3 = total about 14.8 kg of air.
How high above the waterline does the capped end float vertically?
well got about 16 meter of 20 meter weighing 1700 kg, with pipe and end above waterline weighing 2700 kg per cubic meter.
But we instead just look at more significant thing of displacing one cubic meter of water give 1000 kg of displacement
so 1 meter of air under waterline is about 3 cubic meter of air displaced = 3000 kg
2125.599794 kg is what weighs submerged, and 1 meter air inside floats 3000 kg, so 4 meter of air floats about 3 meter
above water, and pushs air about 1 meter below waterline.
Pushing water 10 meter above waterline requires 14.7 psi or 1 atm of pressure and 1 meter is 1.47 psig of pressure.
So it is floating about 3 meter [9.8 feet] above waterline. What happens someone climbs on it.
Nothing much- they don’t weigh much, 10 people, then it lowers few feet.
And what if add some air to inside it. It got about 15 kg of air in it. If add 15 kg of liquid air to it, it becomes
air if hit the water inside pipe, it doubles the 4 meters of air, to about 8 meter of air.
Considering that can happen quickly, could go up 4 meter in a second, 1 gee acceleration is going up 4.9 meter within 1 second.
if dumped 1 ton of liquid air in it quickly, you could call it explosive- more gees then most people want.
Could the pipe survive a ton of liquid air added to it quickly?
It depends on the strength of the Aluminum.
Anyways this about a gravity gradient.
“Tim earlier asked the non-spinners to DEFINE what is the singular axis of rotation of a body. They were unable. Yet they insist there is one.”
I tend think that the Moon has orbiting Earth for over 3 billion years.
But I don’t insist this has been the case, and some might not even think that creation is 3 billion years old. Some might doubt time itself.
If accept expansion of space time- than you accept time is not a constant and you accept you don’t really know rate of expansion and of course don’t know what 80% of mass universe, is.
Or there is lots of wriggle room, but I think the Moon has been orbiting Earth for more than 3 billion years [roughly speaking].
I also think 3 billion years ago, the Earth was spinning significantly faster {likewise many might disagree}.
If Moon was orbiting Earth 3 billion years ago and Earth was spinning faster. Then we continue to say, the Moon was closer.
And if closer, how much closer, and was spinning on it’s axis, how fast was it spinning.
I pick 3 billion year because it seems possible to me, the Moon has facing Earth for at least 3 billion years.
nate…”For a rotating body to stop rotating it needs to experience a torque, by Newtons laws”.
***
Hopefully you understand that a torque is a force applied at a distance from an axis. So, if I apply a torque to a sphere at rest, it begins rotating. I am applying a force perpendicular to its axis and along the circumference of the rotating body.
If I want to stop the body spinning, I must apply an equal and opposite force, for a certain period of time, to the same circumference, albeit in the opposite direction of the force that started the rotation. Obviously, the farther I apply the force from the axis, the longer it will take to stop the body.
An axis can be either a rigid axle about which the body rotates or an imaginary axis like the N-S pole of the Earth.
“Hopefully you understand that a torque is a force applied at a distance from an axis. So, if I apply a torque to a sphere at rest, it begins rotating. I am applying a force perpendicular to its axis and along the circumference of the rotating body.
Ok sounds good. Then a force applied thru the COM will not apply a torque around the COM axis of the moon, and neither start or stop rotation of a moon.
But the force thru the COM would be applying a torque around the Earths axis.
But wouldnt you agree that if the MOTL is rotating only about an axis in the Earth then one would simply need to apply torque on the moon around THAT axis?
nate…”But the force thru the COM would be applying a torque around the Earths axis”.
***
A torque is simply a force, applied at a distance from an axis. However, it applies to a rigid body only. If you apply such a force to the Moon, in its direction of motion, and the force is large enough to move the Moon, it will change the lunar tangential velocity/momentum. That will affect the orbit of the Moon.
Since the force cannot be transmitted via gravity to the Earth, the system will experience no torque.
That is also why we have to be careful about applying an angular momentum to the Moon since it has none. The Moon has only a linear momentum and acts in Earth’s gravitational field, which bends the momentum direction into an orbit. A force applied along the line of motion of the Moon serves only to change the lunar linear velocity/momentum.
“A torque is simply a force, applied at a distance from an axis. However, it applies to a rigid body only. ”
Well I agree that it cant transfer any torque or rotation to the Earth. But since it can change the orbit, it can add angular momentum to the moon-earth system.
nate…the change in orbit is due to a change in lunar velocity/momentum, not torque.
The Moon’s orbit is based on its tangential momentum/velocity interacting with gravity. The curvature of the Earth is such that it changes 5 metres vertically for each 8000 metres horizontally. If the Moon’s velocity, or that of any satellite, meets the requirement that the body moves 8000 metres while gravity moves it vertically by 5 metres, the body will stay in orbit.
https://www.nesdis.noaa.gov/news/why-dont-satellites-fall-out-of-the-sky
Note that sats carry fuel to adjust the orbit if required. Firing rockets for a brief period will increase orbital altitude. The Moon does not require such a boost since it is outside any atmospheric resistance.
“A torque is simply a force, applied at a distance from an axis.”
Your quote and correct.
Such a force through the COM of the Moon applied opposite to its velocity that weve been discussing constitutes a torque around an axis through the Earth on the Earth-Moon system.
And we agree that said force will change the Orbit of the Moon.
If the orbit of the Moon is changed the angular momentum of the Earth Moon system changes.
Its a Newton Law of rotation that Torque = dL/dT where L is angular momentum.
So indeed it makes perfect sense that a torque was applied on the Earth Moon system, and as a result its angular momentum changed.
Here is section of moon and earth trajectories around the sun.
Do you see any moon doing circles around earth? No it does not. ball-of-string only works if earth is stationary; it is not.
https://en.wikipedia.org/wiki/Orbit_of_the_Moon#/media/File:Moon_trajectory1.svg
Your dentist will probably recommend that you dont gnaw on lumps of coal.
Ken, usually your comments are so funny because they reveal how uneducated you are. But this one is just lame.
Besides, this has already been explained to you. You didn’t learn because you’re braindead. And braindead is just lame.
After all these years, Pup, has it ever occurred to you that a better model would be an Olympic hammer throw, and that it illustrates the tango between Pluto and Charon more than the Earth and the Moon?
Enjoy yourself today. Do the Pole Dance Experiment.
Is it the holidays making Clint lose his sh*t?
We can tell because the ad-hom fraction of his posts is rapidly approaching 1.
You have run that one past us before, Ken. Despite the obfuscation in the drawing, the Moon is in fact orbiting the Earth in almost straight circles.
What your drawing is doing is projecting the lunar motion onto a background. You can do the same with a pendulum, which oscillates physically about a vertical line. When the motion is projected onto a moving background, you get a sine wave, which in no way represents the true motion of the pendulum.
Same with an electron orbiting an atomic nucleus. As far as we know, the electron orbits the nucleus like the Moon orbits the Earth. The frequency of the electron is determined by how many times it orbits per second.
Again, you can project its motion onto a moving background and see the motion as a sine wave. It’s called simple harmonic motion.
BTW, an oscilloscope works along those lines. If you connect the scope to a circuit using a suitable probe, the motion of electrons in the circuit causes deflection plates in the scope to sweep the electron beam back and forth on the scope screen. With the proper timebase selected, the motion appears on the scope screen as a sine wave, if the motion in the circuit acts like a sine wave.
You cannot claim the sine wave appearing on the screen is an accurate depiction of electron motion in a circuit. In the same manner, your wiki image does not represent the motion of the Moon about the Earth.
This is the problem; you can’t think 3D.
I’m beginning to understand why it was Galileo that discovered the earth goes around the sun. Its a discovery that should have been self evident millennia before that.
Bad education I guess.
1D, 2D, 3D…n^x degree…it doesn’t matter. The physical parameters are such that the Moon is forced to orbit the Earth at all times.
You are having trouble with that because your mind is trying to operate in thought-experiment mode while ignoring the actual, physical reality.
You can fix that, Ken, and it has nothing to do with choice. It is simply about emptying your mind of rubbish and allowing your brain to look directly at a problem without interference from the garbage piled up in your mind over the ages.
I am not taking a shot at you, we all suffer from this distortion. Once you become aware of it, life becomes a vigil of looking, and still we get caught. By vigil, I don’t mean something unpleasant, or a chore, it’s simply being aware at all times. After a while it becomes second nature.
If you apply that to Happer you will soon see through his nonsense. Happer is a luke-warmer who fails to grasp the problem with greenhouse theory.
The people of the Moon colony are tired of the freezing cold darkness they experience half of the time, so they decide to STOP the Moon’s rotation.
They then realize that stopping its orbital motion would be a horrible mistake, because then the Moon would then fall out of orbit and crash headlong into the Earth.
Luckily they realize that its ROTATION and ORBITAL MOTION are INDEPENDENT MOTIONS, so ONE MOTION can be stopped without affecting the other!
They determine they need to add and equal and opposite ROTATION around the Moon’s COM.
Which begs the question, if the Moon’s present rotation can be STOPPED by adding the opposite rotation around a COM axis, how can its rotation be considered to be ONLY around an external axis through the Earth?
Puzzling…
So how could they do it? They have access to an electromagnetic catapult to launch rocks from the Moon.
https://en.wikipedia.org/wiki/The_Moon_Is_a_Harsh_Mistress
Troll Nate, you don’t understand the physics.
Putting a torque on Moon would induce rotation. And we would notice that rotation from Earth. That’s one of the ways we know Moon is NOT rotating, the same side always faces toward us.
Now, if you want to stop Moon’s linear momentum, you need to apply a force in line with it’s center of gravity, opposite to its momentum. Such a force would NOT induce rotation.
“Now, if you want to stop Moons linear momentum, you need to apply a force in line with its center of gravity, opposite to its momentum. Such a force would NOT induce rotation.”
Very good, so that relates exactly to my previous challenge.
https://www.drroyspencer.com/2022/12/uah-global-temperature-update-for-november-2022-0-17-deg-c/#comment-1415621
It would not induce or stop any rotation but would stop its orbital motion. Illustrating they are independent motions.
Orbiting and rotating are two independent motions but Moon is only orbiting.
Yet some Moon Dragon cranks define orbiting as rotating, Pup.
At least one defines orbiting as translating.
None do the Pole Dance Experiment.
You should.
Show us the way.
Little Willy, please stop trolling.
“And we would notice that rotation from Earth. Thats one of the ways we know Moon is NOT rotating, the same side always faces toward us.”
Yes you are clearly using a geocentric rotating reference frame to measure rotation of the Moon.
Wrong troll Nate. I’m using the model of “orbital motion without axial rotation” — the ball-on-a-string. One side always faces the inside of the orbit.
‘we would notice that rotation’ is the giveaway.
That’s what they never understand, Clint R. The moon issue is not resolved by reference frames. It’s just a question of keeping the axial rotation separate from the “orbital motion”…and, as you say, the model of “orbital motion without axial rotation” is the ball on a string. The axial rotation then has to be in addition to that motion. Hard to explain, but if you get it you get it. You have to be able to mentally add two motions together.
Clint sez:
“Putting a torque on Moon would induce rotation. And we would notice that rotation from Earth. Thats one of the ways we know Moon is NOT rotating”
and
“Orbiting and rotating are two independent motions”
Oh well!
Thanks for quoting me correctly, Nate.
If you don’t understand, I always recommend memorization. Memorize both quotes and repeat 100 times daily until you understand.
“The people of the Moon colony are tired of the freezing cold darkness”
If you are living space is not cold- Germany is cold. Light is cheap these days. If on Near side you have light of Earth which is bigger and brighter than the Moon. If in lunar polar region, you can still get earthshine and you could get sunlight 80% of the time. And if near polar region you walk as fast as sun moves- there is also relatively short distance to different time zones. So, if solar panel two times zone east and two west or 450 km from middle, you get about 70% of time with solar power.
Hmm, let’s near polar region 60 degree north or south, you put 450 km
line going direction of pole and tie into a more northern grid.
So you work/operate 70% and time off 30% of time. Higher energy use 70% of time 30% lower energy use- or paying more for it, importing from polar grid. And one have someone else 450 km more towards equator which you are sharing grid power with. And if want “traditional” earth type hours you can arrange that by sharing grid power.
OK so the dark side of the Moon is no longer cold?
Moon has farside and nearside. And it has very long night and very long day.
During long night the surface gets very cold.
1 meter below the surface it is cold, whether during day or night- or 1 meter below the surface is has fairly uniform temperature is which
around -30 C.
But Moon or Mars is vacuum, the Moon is much more of vacuum. The Moon’s vacuum is more of vacuum that 100 km high orbit above Earth’s surface.
100 km orbit [or space has no temperature] though this in in Earth thermosphere, wiki:
“The highly attenuated gas in this layer can reach 2,500C (4,530F) during the day. Despite the high temperature, an observer or object will experience low temperatures in the thermosphere, because the extremely low density of the gas (practically a hard vacuum) is insufficient for the molecules to conduct heat.”
https://en.wikipedia.org/wiki/Thermosphere
“The thermosphere is uninhabited with the exception of the International Space Station, which orbits the Earth within the middle of the thermosphere between 408 and 410 kilometres (254 and 255mi) and the Tiangong space station, which orbits between 340 and 450 kilometres (210 and 280mi).”
Of course things in sunlight can heat up to around max temperature of about 120 C at Earth distance from the sun, and things not in sunlight [or not warmed by anything] over time can cool down a lot- ISS orbits every 90 min, or doesn’t much time to cool down much in an
orbital period and tends to be warm, and require active refrigeration to keep crew cool enough.
[And btw, ISS due to elevation gets about 60% of it’s time in sunlight and 40% in night.]
So people which know how to live in space, aren’t freezing:
“The people of the Moon colony are tired of the freezing cold darkness”
Nor are they in darkness- unless they want to be in darkness.
Though a lunar colony could have a “Florida man” -who might not live very long.
Bill made a good point. Need to leave the Moon with a bit of rotation to keep one side facing the sun.
nate… what are the odds that the Moon rotates exactly once on a local axis per orbital period? Even if the theorized period of rotation was off by a few feet, eventually the Moon would show a different face to the Earth.
If you consider the non-spinner POV, the odds are removed….science is restored.
Good question, Gordo:
https://link.springer.com/article/10.1007/s10569-017-9783-7
More than a coin toss would be my bet.
Odds are needed for coincidences. This is not one. Tidal locking is a resonance phenomenon, common in nature.
nate…tidal locking is a dumb idea and the idea has nothing to do with resonance.
How do tidal forces lock anything? Like I said, dumb idea.
Come on, Gordo.
A lock could obtain because a strange attractor obtains:
https://academic.oup.com/mnras/article/443/4/2957/1013543
A,axing you spend so much time without researching much.
Little Willy, please stop trolling.
https://en.wikipedia.org/wiki/Tidal_locking
“Tidal locking between a pair of co-orbiting astronomical bodies occurs when one of the objects reaches a state where there is no longer any net change in its rotation rate over the course of a complete orbit. In the case where a tidally locked body possesses synchronous rotation, the object takes just as long to rotate around its own axis as it does to revolve around its partner”
Or, from the “Non-Spinner” way of looking at it, what the “Spinners” see as a “1:1 spin-orbit lock” equals “orbiting whilst not rotating on its own axis. The physical mechanism remains the same, and it results in motion like the MOTL, but we just see that motion as not involving axial rotation.
You are wrong.
Graham and a few fellow Sky Dragon cranks believe that the sky is like a sticky road.
Everybody else understand that the Sky is slippier than that!
rlh…”Tidal locking between a pair of co-orbiting astronomical bodies occurs when one of the objects reaches a state where there is no longer any net change in its rotation rate over the course of a complete orbit”.
***
Why would the body keep rotating at exactly one revolution per orbit? Why would it not continue to slow down?
Tidal locking is a hypothesis that cannot be backed by science. If something is causing a body to slow its rate of rotation, there is no physical reason why it would not continue to slow down till it stopped.
What makes you think the Moon stopped from spinning, Gordo?
“If something is causing a body to slow its rate of rotation, there is no physical reason why it would not continue to slow down till it stopped.“
Which is why the tidal locking mechanism and its results make so much more sense from the “Non-Spinner” perspective.
“Why would the body keep rotating at exactly one revolution per orbit? Why would it not continue to slow down?”
Because tidal locking causes forces to operate that either spin it up or down depending on the exact alignment. Do keep up.
“results in motion like the MOTL”
But MOTL has one rotation of the ‘Moon’ per obit of the ‘Earth’ as can be clearly seen from individual frames.
As can clearly be seen, the MOTL is “rotating about an external axis with no rotation about an internal axis”.
“Which is why the tidal locking mechanism and its results make so much more sense from the Non-Spinner perspective.”
And yet nowhere can this weird perspective on tidal locking be found other than this blog’s cult.
I would simply note that ‘locking’ a rotation is not equivalent to ‘stopping’ a rotation.
As can be seen, Moon Dragon cranks fail to realize that an infinity of motions could account for what they see.
I don’t think a single one of them truly understands the "Non-Spinner" position, even after all this time. Remarkable.
IOW, my arguments may be unconvincing to others, but in my own mind, they are solid gold!
don’t think a single one of them truly understands the "Non-Spinner" position, even after all this time. Remarkable.
Gaslighting Graham gently gaslightists a little more.
#2
Little Willy, please stop trolling.
“dont think a single one of them truly understands the “Non-Spinner” position, even after all this time. Remarkable.”
I don’t understand the desperation that makes one feel the need to cheat to defend their position, which is plainly indefensible.
…don’t think a single one of them truly understands the "Non-Spinner" position, even after all this time. Remarkable.
Just to help readers follow the thread, I will leave this here:
https://www.drroyspencer.com/2022/12/uah-global-temperature-update-for-november-2022-0-17-deg-c/#comment-1424900
Posted that in the wrong place. Carry on!
There is so much science that Gordon cant wrap his mind around.
It must be cuz its ‘dumb’, the science that is…
“How do tidal forces lock anything? ”
https://en.wikipedia.org/wiki/File:%C3%81rap%C3%A1ly_forgat%C3%B3nyomat%C3%A9k.png
The tidal bulge on the Moon is out of alignment with the Earth when the Moon spins faster then the orbit.
Gravity tugs on the bulge, slows the rotation until it is synchronized with orbit.
But GR will claim that the Earth’s gravity is not strong enough to distort the Moon into such a bulge.
Nate, did you find another link you can’t understand?
There are blue arrows and black curved arrows. What do the arrows represent?
You need to understand the garbage you find so you will know it’s garbage.
The bulge would not be more than a couple of centimeres. How exactly does such a ***bulge*** cause a loss of momentum never mind a locking mechanism?
nate…”The tidal bulge on the Moon is out of alignment with the Earth when the Moon spins faster then the orbit”.
***
How is that possible when the bulge is there only when the Earth and Moon are opposite and aligned? If your theory is correct, then the Moon has stopped rotating, hence keeping the bulge pointed permanently at Earth.
… unless the Moon needs to spin to keeps the same face looking at the Earth, Gordo.
You always forget that possibility.
Caption:
If the tidal bulges on a body (green) are misaligned with the major axis (red), the tidal forces (blue) exert a net torque on that body that twists the body toward the direction of realignment.
“How is that possible when the bulge is there only when the Earth and Moon are opposite and aligned? If your theory is correct, then the Moon has stopped rotating, hence keeping the bulge pointed permanently at Earth.”
The tidal bulge is always there, on both Moon and Earth. The bulge takes time to return to equilibrium. When the Moon is spinning faster than the orbital speed, the rotation carries the bulge beyond the red line between the Moon and Earth.
The article discusses for body A (Earth) and B (Moon).
“The material of B exerts resistance to this periodic reshaping caused by the tidal force. In effect, some time is required to reshape B to the gravitational equilibrium shape, by which time the forming bulges have already been carried some distance away from the AB axis by B’s rotation. Seen from a vantage point in space, the points of maximum bulge extension are displaced from the axis oriented toward A”
From the “Non-Spinner” perspective, you could say that the tidal bulge on the moon is out of alignment with the Earth when the moon spins faster then zero axial rotations per orbit.
Gravity tugs on the bulge, slows the rotation until it has stopped spinning completely. The tidal bulge on the Moon is out of alignment with the Earth when the Moon spins faster than zero axial rotations per orbit.
Gravity tugs on the bulge, slows the rotation until it has stopped.
Nate gets caught with another lame distraction, and strikes out again.
His graphic applies to Earth’s surface water, known as “tides”. It does NOT apply to solids, as least in anything meaningfully measurable. Strike ONE.
Just for fun, let’s assume Moon’s surface “bulge” is several 100 miles. Gravity would still not produce any torque on Moon because gravity acts on center of mass. Strike TWO.
For more fun, let’s assume gravity does produce a torque on the bulge. Then, if Moon were rotating, the torque would be opposite on the other side of the center line. Opposite torques cancel. Strike THREE.
That’s why this is so much fun.
When all is said and trolled, our Sky Dragon Cranks need to provide a numerical model without a spin, perhaps even without any angular rotation…
After their 76 months of trolling, we’re still waiting…
GR. The magnitude of the land tides is around 30cm on Earth.
“Unlike ocean tides, land tides only change the Earth’s surface by around 12 inches (30 cm) or so twice a day.”
https://www.thoughtco.com/land-tides-or-earth-tides-1435299
Are you saying the Moon’s distortions would be smaller?
“keeping the bulge pointed permanently at Earth”
If the bulge continuously points at Earth, then it must rotate on its axis once per orbit.
CR. Are you saying that 1/d^2 does not apply?
“If the bulge continuously points at Earth, then it must rotate on its axis once per orbit.”
Which from the “Non-Spinner” perspective is: “not rotating on its own axis”.
Tell, me, does the Moon part of the gif rotate compared to the outside of the frame?
Not on its own internal axis. All particles of the MOTL move in concentric circles about an axis in the center of the orbit. Whereas, if the object was rotating on its own internal axis, the paths of the particles would cross over each other.
Aristotelian physics makes more sense than Newtonian physics. Moon Dragon crank physics is more like Aristotelian physics than Newtonian physics. Their trolling is purer than Aristotelian rhetoric, however.
His graphic applies to Earths surface water, known as ‘tides’. It does NOT apply to solids, as least in anything meaningfully measurable. Strike ONE.”
Assertion without a shred of evidence. Strike one.
“Just for fun, lets assume Moons surface ‘bulge’ is several 100 miles. Gravity would still not produce any torque on Moon because gravity acts on center of mass. Strike TWO.”
Wrong, gravity produces no torque on a UNIFORM sphere. Because gravity decreases with radius, it CAN produce torque on a non-uniform sphere. Strike TWO.
“For more fun, lets assume gravity does produce a torque on the bulge. Then, if Moon were rotating, the torque would be opposite on the other side of the center line. Opposite torques cancel. Strike THREE.”
Clint continues in his cluelessness! Look at the tidal forces acting on the two bulges. The bulges are both being pulled by these tidal forces in the CW directions, as the large arrows indicate.
Strike out!
Little Willy continues with his trolling.
> His graphic applies to Earths surface water, known as tides. It does NOT apply to solids, as least in anything meaningfully measurable.
If Clint were to read the Wikipedia article associated with the graphic he would see that it is applied to tidal deformation of solid bodies.
Strike ONE.
> Just for fun, lets assume Moons surface bulge is several 100 miles. Gravity would still not produce any torque on Moon because gravity acts on center of mass.
If Clint’s magic fizzicks were correct, matter at the surface would not be gravitationally bound to the rest of the body, and the entire planet would fly apart.
Strike TWO.
> For more fun, lets assume gravity does produce a torque on the bulge. Then, if Moon were rotating, the torque would be opposite on the other side of the center line. Opposite torques cancel.
The “back” bulge is further away from Earth than the “front” one and thus experiences less gravitational attraction to Earth. Therefore the net torque is not zero.
Strike THREE.
***
This has been so much fun, I leave Clint with another opportunity to make a fool of himself: the tidal forces of the Moon on Earth are causing the latter’s rotation to slow. The angular momentum lost by Earth is transferred to the Moon, increasing the size of its orbit.
Brandy Guts explodes back onto the scene, completely out of nowhere. Obviously reinforcements were needed for Team "Spinner".
Hi Brandon, thanks to you and Nate for quoting me correctly. That’s always a sign that you’re at least trying to not be trolls. Trolls like Norman and worthless willard thrive on misrepresenting what others say.
But remember, braindead cult idiots can’t learn physics. So sorry, but my comment was NOT for you. That’s why you typically see me say something like You don’t understand any of this.
The comment was written for those that see something wrong with the “lunar rotation” nonsense, but may not have enough familiarity with all the side (bogus) issues like “tidal locking”.
But keep commenting. I always like your inventive “physics”. Like your belief that Earth’s rotational angular momentum can be transferred to Moon’s linear momentum, through a vacuum!
It would be fun to see the “math” on that….
> It would be fun to see the math on that.
https://www.aanda.org/articles/aa/full_html/2022/09/aa43445-22/aa43445-22.html
Good luck.
That’s what I’m talking about Brandon, you don’t understand any of this.
The very first sentence of your “source”: “Due to tidal interactions in the Earth-Moon system, the spin of the Earth slows down and the Moon drifts away.”
You don’t start out with a “given” is “prove” the given! Spin angular momentum can NOT transfer to linear momentum though a vacuum.
You need to read more than the first sentence, Clint: the maths are all the way down in the appendices.
Same problem Brandon. First sentence of the Appendix (Bold my emphasis.): “For the reconstruction of the Earth-Moon distance, we used a reduced secular dynamical model describing the exchange of angular momentum between the Earth’s rotation and the lunar orbital motion…”
Then, after a bunch of blah-blah, we see: “Under these assumptions, the governing dynamical system of equations is expressed as…
You need to start from First Principles and show how spin angular momentum can be transferred to linear momentum through a vacuum. Hint: It can’t be done.
> after a bunch of blah-blah
Moar evidence that Clint sometimes gets confused who is who in these exchanges.
Why do you hate science?
And every time I show how easy it is to debunk your false beliefs you resort to your juvenile trolling — “moar”, and a false accusation.
Worthless willard and troll Norman will be impressed.
(You will likely be trolling here all day, but you will need a babysitter.)
I repeat the question, why does Clint R hate science? Did he fail science in school?
Dearest Confused Clint,
A first principle is a proposition or *assumption* which cannot be deduced from any other proposition or *assumption*.
You don’t even know what you’re asking for, much less able to recognize it once your sammich has been served.
Taunting you with mispellings and alliterative language is better than you deserve.
With love and admiration,
BG
I’m not referring to “philosophy”, troll Brandon.
It’s physics: In physics, a calculation is said to be from first principles, or ab initio, if it starts directly at the level of established laws of physics and does not make assumptions such as empirical model and fitting parameters.
I will not respond anymore, even if you misrepresent me. I don’t respond to trolls.
> I will not respond anymore
Bye.
brandon…from link…”Due to tidal interactions in the Earth-Moon system, the spin of the Earth slows down and the Moon drifts away”.
***
Amazing!!! Now the orbit of the Moon is dependent on Earth’s rate of rotation. And what’s this thing about drifting away? The Moon is moving at an average speed of 1 km/second. Since when is that classified as drifting?
At 1 km/s it will take 8 seconds to cover 8 km and in that time Earth’s gravity has to move the Moon 5 metres vertically. Then it will remain at a constant altitude, like Newton’s cannonball.
Good thing Brandon ran for the hill. We were just about to dismantle his theories.
“But remember, braindead cult idiots cant learn physics.”
Clints arguments are debunked, actually, demolished.
He has no response other than to blame others.
Thats how we recognize a troll.
Tidal locking only makes more sense from the “Non-Spinner” position.
The Moon spinning once on its axis per orbit of the Earth makes much more sense from a scientific view.
Not in the least.
Dear Gordon,
More convincing than your trivial objections would be a counter-model which explains observed reality:
1. The Moon’s mean distance from Earth increases by about 3.78 cm per year.
2. Days on Earth are getting longer by about 0.000018 seconds each year.
If you claim competence to dismantle mainstream theory, surely you can best it with one of your own.
In baited anticipation,
BG
Nah, Brandy Guts. Tidal locking’s fine.
I see Nate quoted me correctly again. That gives him one foot in reality. His other foot remains stuck in his cult’s nonsense. Progress is one baby step at a time….
And braindead Brandon continues his distraction, yet is unable to present the First Principles as to how spin angular momentum gets transferred to linear momentum through a vacuum.
Like the rest of his cult, Brandon just spews crap, hoping something will stick to the wall.
They’ve got NOTHING.
Clint,
You abandoned our conversation, not me. Are you back for real or is this just a drive-by?
If the former, tell me: do you consider the universal law of gravitation a “first principle”?
Thanks.
Wrong braindead Brandon. I didn’t abandon, you got ignored. I no longer put up with incompetent, immature trolls. And, we weren’t having a “conversation”. I was attempting to educate you, and you were trolling.
Keep trolling, and you will be ignored again. Behave like a responsible adult, and I will explain reality to you.
Another hit and run by Clint, emphasis on the run.
rlh…”Unlike ocean tides, land tides only change the Earths surface by around 12 inches (30 cm) or so twice a day.
***
Have you tried checking your source? There is no way the land is deformed 12″ by lunar tidal forces. It’s closer to 1 cm.
Some blithering idiots claim the city of New York rises up to 12 inches during each land tide. If that was the case, there would be cracks in roads, sidewalks, and even buildings all over New York. Bridges would crack and eventually fail. Reservoirs would crack and fail as would dams.
Those idiots should try consulting a civil engineer before shooting off their mouths.
Gordon,
The Earth is 501.65 million inches in diameter. Surely even you can see how small a percentage of that is 12 inches and thus how gradual is the tidal deformation of the surface.
Hint: the top of Empire State Building sways on the order of a foot while the building proper is a mere 15,000 inches.
Please tell me the infrastructures you have had a hand in engineering so that I may avoid them at all costs.
Thanks.
…tidal locking’s fine.
[GASLIGHTING GRAHAM] Tidal locking’s fine.
[PUP] Tidal locking for Moon doesn’t work.
Correct, we disagree…and, unlike the “Spinners”, we’ve even discussed our disagreement.
Gordon says: “At 1 km/s it will take 8 seconds to cover 8 km and in that time Earths gravity has to move the Moon 5 metres vertically. Then it will remain at a constant altitude, like Newtons cannonball.”
No. The problems should be obvious with a little thought about geometry and physics.
Geometry: If the moon moved vertically down at the same rate as the surface of the earth moves down, then the moon’s orb it would be the same size as the earth — a radius of 6400 km. Since the moon’s orbit is about 60x the earth’s radius, the moon would move about 5/60 = 0.08 m vertically in 8 km.
Physics: The strength of earth’ gravity at earth’s surface is 9.8 m/s^2. The moon is about 60 earth radii away, so gravity is about 1/3600 as strong, or 0.0027 m/s^2. In 8 seconds, the moon falls about (1/2)a t^2 = 0.5 * 0.0027 * 8^2 = 0.08 m vertically.
It’s cool how well multiple lines of thought lead to exactly the same result when you understand the underlying physics.
When people fail at multiple lines of thought, well …
Tim! There you are. Hope you are ready to answer these two questions:
https://www.drroyspencer.com/2022/12/uah-global-temperature-update-for-november-2022-0-17-deg-c/#comment-1415077
Too bad Graham does not respond to that comment by Tim that reminds him how the Moon issue is one of physics, not geometry.
Readers might wonder why.
Tim?
You really need to chill DREMT. It is not my job to explain physics to you. For free. During vacation. Especially since your question has nothing to do with the topic I was addressing here.
But I am feeling generous ATM.
“1) Is “rotation about an external axis, with no rotation about an internal axis”, motion like the MOTL or the MOTR? “
You still don’t get it. “Rotation about an external axis, with no rotation about an internal axis” is an oxymoron. “Rotation” is movement in a circle relative to a given reference line (the “axis”); a vector from the axis to some point that maintains constant length but changing orientation. If you don’t agree with this basic statement, then we have different definitions for “rotation” (and you could give YOUR definition so that we could discuss how various scenarios relate to you personal definition of “rotate”).
But if you agree with “constant length; changing orientation” then you should be able to understand that this definition applies simultaneously to the line up through the center of the cartoon earth, and to the line up through center of the cartoon moon. Rotation about the external axis REQUIRES simultaneous rotation about the internal axis for MOTL.
The MOTL is rotation about the external axis with no ADDITIONAL rotation about the internal axis.
> constant length
Perhaps Graham should send Flop the memo.
Poor Tim is in a real logical bind. He has said that the motion of the MOTL can be described as “one motion” – and, by the way, I will never let him forget that, as long as he comments here – but he insists that an object that is rotating about an external axis is also rotating about an internal axis…so that’s two motions. Yet he has also said that the “one motion” is described as a “simple rotation”! So it looks like he is purely contradicting himself! There’s no real way out for him. If he tries to change it to “simple translation” then he will face the same criticisms Gordon gets. If he sticks with “simple rotation” then he has to accept that “one motion” means there is only rotation about the external axis. Thus, no rotation about an internal axis.
His attempt to get out of this will probably include droning on about definitions of rotation. Little Willy will hang on his every word, no matter what, even though he’s definitely wrong on this one. Such a shame all round. The mighty Tim has fallen.
Tim asks “and you could give YOUR definition so that we could discuss how various scenarios relate to you personal definition of ‘rotate’.
Indeed he has been asked this many times, and by me also. He has always evaded the question.
He insists he can tell us what qualifies as a rotation, eg an elliptical orbit, but he CANNOT DEFINE it.
Vagueness of definitions is the best friend of a troll, particularly this one.
Their are numerous questions that DREMT has evaded. Here is another one related to the definition of rotation.
“Let me ask, do you think Haleys Comet ‘rotates’ around the sun?”
and he wriggled and dodged more
https://www.drroyspencer.com/2022/12/uah-global-temperature-update-for-november-2022-0-17-deg-c/#comment-1415090
The mighty Tim has fallen. As Nate agrees, “rotation about an external axis with no rotation about an internal axis” is motion as per the MOTL. Tim is wrong.
Perhaps Gaslighting Graham will never understand what Tim says. At this point it is not Tim’s problem anymore.
Perhaps he should return back to the concept of object.
Perhaps he should gently gaslight a little more.
Tim says the movement of the MOTL can be described as “one motion”, a “simple rotation”. This is correct. Then he says that “rotation about an external axis” cannot occur without “rotation about an internal axis”. That is incorrect, and indeed it contradicts his first statements. Two motions are not “one motion”, Little Willy. Tim contradicts himself, and he contradicts Nate, who has previously agreed that “rotation about an external axis with no rotation about an internal axis” is motion like the MOTL. Nate has agreed this is one of two ways the MOTL’s motion can be described.
Tim is wrong, and his credibility is undermined the further he continues without correcting himself.
Dr Roys Emergency Moderation Team says:
”Poor Tim is in a real logical bind. He has said that the motion of the MOTL can be described as one motion and, by the way, I will never let him forget that, as long as he comments here but he insists that an object that is rotating about an external axis is also rotating about an internal axisso thats two motions. Yet he has also said that the one motion is described as a ‘simple rotation’! ”
Indeed Tim has an insurmountable problem with his view. He is in direct conflict with Dr. Madhavi in Section 2.0 (2.) where she says:
”Rotation should not be confused with certain types of curvilinear translation. For example, the plate shown in Fig 2(a) is in curvilinear translation, with all its particles moving along parallel circles, while the plate shown in Fig 2(b) is in rotation, with all its particles moving along concentric circles. ”
Tim’s arguement flips this well established principle in kinematics. He uses two different motions and treats the concentric orbital motion of the moon’s particles as being in parallel motion so he can claim Lorb is a curvilinear translation.
His take is completely backwards as the particles of the moon in rotation on an external axis are not parallel. Madhavi illustrates parallel motion of particles in figure 2(a) and is a curvilinear translation. But thats not the motion of particles of the moon’s orbital motion. . . .which are concentric and that makes it a rotation on an external axis.
One should note in neither 2(a) or 2(b) that Madhavi does not calculate the COM of the plate motion as an axis because it is abundantly clear where the real axis is in both diagrams due to our knowledge of gravity.
Spinners simply don horseblinders so they can’t see the real axis then calculate where the COM is so they can claim the motion of the moon is rotating on its COM. . . .but it doesn’t work because of the error being introduced in its orbital motion and treating that as a curvilinear translation which it clearly is NOT. But that doesn’t faze them as they refuse to take their blinders off.
since nobody has posted this reference recently her is Madhavi’s work for anybody not familiar with this.
https://www.mvsrec.edu.in/images/dynamicsofrigidbodies.pdf
Yes, Bill, Tim is in real trouble here. Unless he admits his error he is going to lose a lot of credibility…and even then, this is something incredibly simple that he really should have understood years ago. So it is not a good look for him.
“The mighty Tim has fallen. As Nate agrees, rotation about an external axis with no rotation about an internal axis is motion as per the MOTL. Tim is wrong.”
Perfect illustration of this posters desperate loser troll tactics. Here the tactic is misrepresenting my posts and taking them out of context.
As both he and I have agreed, the MOTL can be described in TWO ways. One of which is
1) a rotation about an external axis’.
The other is
2) orbiting in in a circular orbit with axial rotation.
The description (1) is ONLY useful for this unique idealized MOTL situation.
Which is unlike the motion of real planets and moons, including our Moon.
For all other orbits only (2) is useful though in general ‘circular’ should be replaced by ‘elliptical’.
DREMT simply ignores this key fact.
Tim’s quote that DREMT is all in a lather about:
“Rotation about the external axis REQUIRES simultaneous rotation about the internal axis for MOTL.
The MOTL is rotation about the external axis with no ADDITIONAL rotation about the internal axis.”
What is wrong about this, other than DREMT may not comprehend it?
As most of us agree, the MOTL has ROTATION wrt the stars.
However, Tim argued earlier that there is no single UNIQUE axis of rotation.
After all, standing on the COM of the MOTL, one would look up and see the universe rotating around you and conclude the moon is rotating around its COM.
And looking from above at the MOTL, if one measures the velocity of the points on the moons surface to the right and left of its COM, one would find a velocity DIFFERENCE, consistent with a rotation around the COM.
Nate says:
”And looking from above at the MOTL, if one measures the velocity of the points on the moons surface to the right and left of its COM, one would find a velocity DIFFERENCE, consistent with a rotation around the COM.”
yes it would ‘appear’ that way. +
the real velocity of the moon’s particles is the mean angular velocity of the moons orbit. thus as you move from the center of the moon closer to its orbital axis the particles are moving slower. and as you move away from its orbital axis they move faster. but if the motl were rotating on it com axis the particles would be moving faster in any direction from the com axis and that is not the case for the motl.
Why are you mentioning velocity, Bill?
That was not in your Holy Madhavi, and Gaslighting Graham was adamant that the Moon Dragon cranks position did not rely on physics at all!
Once again, Tim is wrong. As Nate has agreed, one of the ways the MOTL’s motion can be described is “rotation about an external axis with no rotation about an internal axis”. The bolded part is of course the most significant part, and it is precisely this that Tim is in denial about. He is trying to have his cake and eat it too, by agreeing that the movement of the MOTL can be described as “one motion”, a “simple rotation”, but then refusing to accept that this means “no rotation about an internal axis”.
By the way, the two ways that motion like the MOTL can be described are:
1) Rotation about an external axis with no rotation about an internal axis.
2) Translation in a circle with rotation about an internal axis.
So, the only way our moon can be described as rotating on its own axis is if “orbit without spin” is translational motion (which the “Spinners” would describe as motion like the MOTR).
” ‘orbit without spin’ is translational motion”
Well, it is self evident that without any rotation, a body has no option but to be in translation. The MOTR has no rotation.
As I showed earlier. The MINIMAL motion that can keep a body in orbit is like the MOTR. It has the least ENERGY, and the least ANGULAR MOMENTUM. This is orbital motion.
https://www.drroyspencer.com/2022/12/uah-global-temperature-update-for-november-2022-0-17-deg-c/#comment-1417806
Add rotation to the orbital motion of the MOTR and you get the MOTL.
And the MOTL now has MORE energy, and MORE angular momentum than the minimal amount of the MOTR.
A body with orbital motion CAN have rotation or not, about any axis, because rotation is an independent motion, as is clear from the variety of rotations seen in the solar system.
Just as I can walk and chew gum or I can walk without chewing gum, because chewing gum is an independent motion.
The non-spinners argue, in effect, that walking while chewing gum at the same rate as moving your legs is ONE MOTION, which is quite silly.
One could legitimately say however that this is walking with synchronous gum chewing.
“yes it would appear that way. +
the real velocity of the moons particles is the mean angular velocity of the moons orbit. thus as you move from the center of the moon closer to its orbital axis the particles are moving slower. and as you move away from its orbital axis they move faster. ”
OK.
Now suppose the MOTL continued from where it is now, but travelling in a straight line, rather than orbiting. IOW, remove the Earth and its gravity.
As you move from the center of the moon closer to the point where Earth was you would find that the particles are moving slower, just like what Bill described above.
Then Bill ought to conclude that this body is rotating around the point where Earth used to be.
But it isnt, it is moving in a straight line. Its rotation is clearly around its own COM, which just happens to moving in a straight line.
…and here are the two ways that motion like the MOTR can be described:
1) Rotation about an external axis with rotation about an internal axis.
2) Translation in a circle with no rotation about an internal axis.
Note how they follow on from the logic and form of my previous comment. Those that accept the MOTL can be described as “rotation about an external axis with no rotation about an internal axis” should logically accept that 1) can apply for the MOTR.
Tim is wrong, and that will never be forgotten, by the way.
Nate says:
”Well, it is self evident that without any rotation, a body has no option but to be in translation. The MOTR has no rotation.”
Yes but this is imaginary it isn’t possible in the presence of gravity.
Nate says:
”As I showed earlier. The MINIMAL motion that can keep a body in orbit is like the MOTR. It has the least ENERGY, and the least ANGULAR MOMENTUM. This is orbital motion.”
The only possible situation for a moon like the MOTR is if it had additional angular momentum in reverse of the orbit that would precisely offset the forces of earth’s gravity with an angular momentum about the COM of the moon. Even that may be impossible simply because of the precision required. Nate you have been in denial of this because you continually bring up the fact that it may take millions of years to spin a moon down from an existing spin on its COM. But scientists have calculations to do just that. How accurate they are is in question but you can’t dispute that science holds that as a fact.
From the start I have not taken any issue with the fact that science and the training of scientists using the shortcut formula for a perfect sphere has at a minimum created a wide held opinion that the stable state of the moon is as the MOTR while knowing without question it is the MOTL. It also does not pose any significant issues because of the timescale that corrections would be made by holding your point of view.
And the reason is that despite the laws of conservation of angular momentum, angular momentum of a non-tidal locked moon is constantly but very slowly being absorbed into the angular momentum of an orbit and the final point of that process where no more angular momentum can be retrieved from that moon is because the orbit now possesses all of it upon the moon becoming tidal locked.
This viewpoint is completely consistent with Einstein’s relativity while you cling to an out-of-date Newtonian viewpoint of being able to correctly view stuff without relativity. . . .and thats why you choose a distant star as your cherry picked point of reference.
Nate says:
”Add rotation to the orbital motion of the MOTR and you get the MOTL”
Perturbing the moon to add energy to its rotation is obviously going to present some changes. But that is the case also in converting the MOTL to the MOTR. All you are doing though is adding energy no matter what direction you choose to do it from. You cling to your out-of-date Newtonian physics like it was the basis of all physics.
Nate says:
”And the MOTL now has MORE energy, and MORE angular momentum than the minimal amount of the MOTR.”
Yes it would and it would also accumulate more energy if you start with the MOTL and convert to the MOTR. You have to pay attention to the fact that energy cannot be destroyed. . . .it can only be redeployed.
Nate says:
”A body with orbital motion CAN have rotation or not, about any axis, because rotation is an independent motion, as is clear from the variety of rotations seen in the solar system.”
Nobody claimed otherwise. Earth has two motions going around the Sun. The Moon has one motion going around the Earth. This is basic kinematics.
The energy of the moon has not disappeared it has simply been absorbed into the orbit as a change in the orbital parameters. You want to look at the winddown of a rotation of the moon as adding to the orbit only to the extent that it ends up looking like the MOTR. Which is incorrect.
Now being incorrect isn’t an issue for astronomers, explaining why there are no papers establishing your view point. And the reason there isn’t such papers is such papers would be in error. But it makes no difference to astronomers because they haven’t yet advanced to the point of creating world’s and the puny satellites we launch we must provide for their stability which we do with active systems as there is no desire to wait for nature to take its course. After all Newtonian physics may be out of date but its very useful still for a lot of stuff.
and here are the two ways that motion like the MOTR can be described:
1) Rotation about an external axis with rotation about an internal axis.
But why would Astronomy do that, when that approach would fail miserably for the vast majority of orbits which are non-circular?
So of course Astronomy does not do that.
Oh well, that SHOULD settle it.
“Yes but this is imaginary it isnt possible in the presence of gravity.”
Your mansplaining opinion, not a fact.
And who the hell cares anyway? AGAIN, to measure rotation, one needs to know what 0 rotation is, as a reference point. The MOTR has zero rotation, even DREMT agrees.
As Nate agrees, "rotation about an external axis with no rotation about an internal axis" is one of the ways you can describe the motion of the MOTL. Tim disagrees. Tim is wrong.
Nate says:
”And who the hell cares anyway? AGAIN, to measure rotation, one needs to know what 0 rotation is, as a reference point. The MOTR has zero rotation, even DREMT agrees.”
once again a spinner loses touch with the non-spinner position. non-spinners hold that the MOTL IS rotating so it isn’t zero!!!!!
And DREMT is intelligent to know that the MOTR either has no rotations or has two rotations in opposite directions so as to achieve the same net movement as zero rotations.
I doubt it, Bill.
Remember – the CSA Truther guy proved that it was I M P O S S I B L E.
I kid you not.
Unless Graham knows it, and like you is gaslighting?
Little Willy, please stop trolling.
The MOTR has zero rotation, even DREMT agrees.
once again a spinner loses touch with the non-spinner position. non-spinners hold that the MOTL IS rotating so it isnt zero!!!!!”
I notice Bill is highly confused again and chastising me for saying something I never said about the MOTL.
“DREMT is intelligent (?) to know that the MOTR either has no rotations or has two rotations in opposite directions so as to achieve the same net movement as zero rotations.”
If he is that intelligent he would know that it could also have dozens of rotations involved in its net motion, like how my grandfather clock’s gears end up producing a single net rotation of the minute hand.
But he insists that it has TWO. Yet he cannot tell us how to test this theory.
“As Nate agrees, “rotation about an external axis with no rotation about an internal axis” is one of the ways you can describe the motion of the MOTL. Tim disagrees. Tim is wrong.”
DREMT agrees that adding a counter axial rotation to the MOTL will produce the MOTR, with no net rotation.
How is possible that a counter axial rotation can exactly CANCEL an axial rotation that is not present?
“And DREMT is intelligent to know that the MOTR either has no rotations or has two rotations in opposite directions so as to achieve the same net movement as zero rotations.”
Exactly, Bill. The MOTR either has no rotations (can be described as translation in a circle with no rotation about an internal axis) or it can be described as rotating about an external axis, whilst rotating about an internal axis (in opposite directions). In other words:
https://www.drroyspencer.com/2022/12/uah-global-temperature-update-for-november-2022-0-17-deg-c/#comment-1419700
DREMT apparently cannot rebut this:
“How is possible that a counter axial rotation can exactly CANCEL an axial rotation that is not present?”
For the logically challenged: for a motion to be exactly cancelled by an axial rotation, it must have been an axial rotation.
Thus as Tim correctly noted, an axial rotation is present in the MOTL. And yet it can ALSO contain a rotation around an external point.
There is no contradiction because a rotation need not have a single unique axis of rotation.
Just a reminder, for those that need it, that Tim was wrong to say that the MOTL can be described as rotating about both an external axis and an internal axis. He acknowledges that movement like the MOTL can be described as "one motion". Thus, unless he is suggesting that the "one motion" is the moon not moving around the Earth at all, remaining on the spot whilst rotating on its own internal axis, then he logically must acknowledge that the MOTL can be described as not rotating on its own internal axis, since the "one motion" must be something other than internal axis rotation.
He described the "one motion" as being a "simple rotation". So that can only be a "rotation about an external axis with no rotation about an internal axis".
That is what logic dictates.
What is clear is that DREMTs arguments about our Moon have been regularly shot down by Tim, as well as others.
What is increasingly clear that DREMT is desperately seeking something for Tim to be wrong about. It doesnt seen to matter how pedantic it is.
He tried and failed with ‘synchronous rotation’.
He tried man-splaining angular momentum, and failed spectacularly
Now its “The mighty Tim has fallen. As Nate agrees, ‘rotation about an external axis with no rotation about an internal axis’ is motion as per the MOTL. Tim is wrong.”
Tim has stated that
‘Rotation about the external axis REQUIRES simultaneous rotation about the internal axis for MOTL.
The MOTL is rotation about the external axis with no ADDITIONAL rotation about the internal axis.’
So it seems it is the use of the word ‘additional’ that is getting DREMT all in a lather.
The main point is that DREMT NEEDS Tim to be wrong about something.
As there are currently no objections to the logic in my 9:23 AM comment, I’ll assume it’s understood that Tim accepts "rotation about an external axis with no rotation about an internal axis" is motion like the MOTL, and will add him to the list of people agreeing with my point 2) from further upthread.
“As there are currently no objections to the logic in my 9:23”
People other than DREMT can see how he shamelessly ignores inconvenient facts.
Thats how we recognize trolling.
As there are still currently no objections to the logic in my 9:23 AM comment, I’ll assume it’s understood that Tim accepts "rotation about an external axis with no rotation about an internal axis" is motion like the MOTL, and will add him to the list of people agreeing with my point 2) from further upthread.
“Ill assume its understood that Tim accepts”
OK, so if I post and YOU don’t respond then its understood that you agree with me??
Tee hee hee…
Given that Tim has clearly stated that
Rotation about the external axis REQUIRES simultaneous rotation about the internal axis for MOTL.”
then he clearly doesnt agree with you.
Only trolls would assume their opponent no longer agrees with their STATED view.
But that is what we have come to expect from you and your TEAM.
As there are still currently no objections to the logic in my 9:23 AM comment, I’ll continue to assume it’s understood that Tim accepts "rotation about an external axis with no rotation about an internal axis" is motion like the MOTL, and will add him to the list of people agreeing with my point 2) from further upthread.
FALSE!
https://www.drroyspencer.com/2022/12/uah-global-temperature-update-for-november-2022-0-17-deg-c/#comment-1421870
Tim makes a clear logical argument. And you ignore it.
As there are still currently no objections to the logic in my 9:23 AM comment, I’ll continue to assume it’s understood that Tim accepts "rotation about an external axis with no rotation about an internal axis" is motion like the MOTL, and will add him to the list of people agreeing with my point 2) from further upthread. This can be repeated indefinitely, if needs be.
Nate says:
”If he is that intelligent he would know that it could also have dozens of rotations involved in its net motion.”
I can agree with that. It has at least 2 rotations. We know it doesn’t have zero rotations as all the elements are in place and measurable and estimated by consensus to be there to have at least 1 rotation. . . .so something else would need to be there to account for the fact a single rotation cannot be observed. But OTOH again nobody has ever seen a MOTR, so it is just a figment of your imagination.
.
Tim Folkerts says:
”The MOTL is a perfect mathematical circle; no real moon is a perfect mathematical circle.”
No rotation in the real world is perfect mathematical circle Tim. Didn’t you learn that in school? You run around making up your own conditions then to eliminate everything you want eliminated you ignorantly eliminate everything.
“We know it doesnt have zero rotations as all the elements are in place and measurable and estimated by consensus to be there to have at least 1 rotation. . . .so something else would need to be there to account for the fact a single rotation cannot be observed.”
You ‘know’ it doesnt have zero rotations only because your pet THEORY says it should have at least one. OBSERVATIONS dont agree. Feynman says if your theory doesnt fit the observations, it is wrong.
Apply the KISS principle.
"It has at least 2 rotations"
Well, Bill, I think here it starts to all get a little bit silly. I mean, if "Spinners" are going to argue that the MOTR could consist of more than 2 rotations (but always an even number), they may as well argue that the MOTL could consist of more than 1 rotation (but always an odd number). It’s just a pointless line of thought that leads nowhere.
On a similar note, applying the KISS principle to the MOTL leads to the conclusion that it’s just one motion. Why complicate it by assuming that it’s two motions? This is what the "Spinners" don’t seem to get. They think they should apply the KISS principle to the MOTR to conclude it’s just one motion, but they don’t seem to get that this principle could equally well be applied to the MOTL to conclude that is one motion.
Overall, then, applying the KISS principle to either MOTL or MOTR does not resolve the issue. The two arguments (the one from the "Spinner" perspective and the one from the "Non-Spinner" perspective) cancel each other out. It gets us nowhere.
Nate says:
”You know it doesnt have zero rotations only because your pet THEORY says it should have at least one. OBSERVATIONS dont agree. Feynman says if your theory doesnt fit the observations, it is wrong.”
Got me on that one. Typo! It should read it should not have zero rotations because. . . .
Nate says:
”OBSERVATIONS dont agree. Feynman says if your theory doesnt fit the observations, it is wrong.”
My observation is the moon on the right is rotating around the earth. You are trying to classify it as a lineal motion without any angular velocity which it clearly has. You need to apply Feynman’s test to your observation.
There is an adage attributed to Einstein that things should be made as simple as possible, but no simpler.
A ball on a string *continues* to rotate when the string is cut.
Sorry for your loss.
Then you can argue with all the "Spinners" who agree that a ball on a string is not rotating on its own axis, Brandon.
Sorry for their win.
Or I could argue with you since you’re here. Or at least you were until you ran away just now.
I don’t have to go through the motions of repeating arguments that were already done to death years ago, when I now have "Spinners" that agree a ball on a string is not rotating on its own axis. I refuse to debate the point, and you can count that as a victory for yourself if you want. Not bothered by how you choose to delude yourself.
Only you could not argue the point by arguing it.
For anyone interested, the reason I choose not to argue the point with Brandy Guts is because I’m aware that he doesn’t accept that "rotation about an external axis with no rotation about an internal axis" is motion like the MOTL. Accepting that fact is a requirement to understanding why the ball goes off spinning when the string is cut. So getting into any discussion on the point will just be a huge waste of everybody’s time. Until all "Spinners" can accept that "rotation about an external axis with no rotation about an internal axis" is motion like the MOTL, there will be no progress in this debate.
In fact, until my points 1) – 3) from further upthread are accepted and understood by all "Spinners", not just some of them, we’ll remain in this pointless state of endless bickering. It would help if "Spinner" would argue against "Spinner", but we know that will never happen.
“My observation is the moon on the right is rotating around the earth. You are trying to classify it as a lineal motion without any angular velocity which it clearly has. You need to apply Feynmans test to your observation.’
OMG.
All this time you have been claiming it is TWO cancelling rotations that produce zero net.
Now you suddenly are claiming to observe it rotating?!
Your beliefs are affecting your vision and judgement.
But feel free to DEFINE rotation in a way that turns MOTR into one and then we’ll compare to the standard definitions, such as in Madhavi.
887 whole characters of not arguing the point, counting spaces, punctuation and carriage returns. Amazing!
I suppose when you declare victory on the topic in the December temperature update, that won’t be arguing the point either!
OK, Brandy Guts.
“Well, Bill, I think here it starts to all get a little bit silly. I mean, if ‘Spinners; are going to argue that the MOTR could consist of more than 2 rotations (but always an even number), they may as well argue that the MOTL could consist of more than 1 rotation (but always an odd number). Its just a pointless line of thought that leads nowhere.”
Only as pointless as declaring without evidence that it consists of two cancelling rotations, as you guys do.
The point, which with concerted effort, people have missed, is that two cancelling rotations is just as untestable and unfalsifiable as 12.
Thus it isnt science. Its religion.
“Accepting that fact is a requirement to understanding why the ball goes off spinning when the string is cut. So getting into any discussion on the point will just be a huge waste of everybodys time.”
Nah, not really. DREMT is just looking to score imaginary points.
Given that DREMT gets angular momentum all wrong, I guarantee his explanation will be non-physical hand waving, ie nonsense.
On a similar note, applying the KISS principle to the MOTL leads to the conclusion that its just one motion. Why complicate it by assuming that its two motions? This is what the “Spinners” dont seem to get. ”
KISS says find a model that works well for ALL orbits.
A rotation model works only by happenstance for this ONE cartoon case of a circular orbit with no axial tilt and synchronous rotation.
As I explained to Bill:
‘Any engineer knows what a rotation is. Ask an engineer to use a rotation to predict the Moons position and orientation exactly 1 week from now. They could divide 1 week by the orbital period and multiply that fraction by 360 degrees to find the rotation angle. They could apply a rotation by this angle around the barycenter to the Moons current position and orientation.
But they will predict a position and orientation of the Moon that will be VERY far off the mark!
Why? Because the Moon has an elliptical orbit. Its distance from the barycenter varies, its orientation changes at a different (constant) rate than its (variable) orbital rate. And the Moon axial tilt. Its orientation changes uniformly around a different axis than the orbital axis.
The observed motion of the Moon is a very poor match to a ROTATION model. KISS says ROTATION is the wrong model!’
Funny, Bill, it seems that some people want to continue with "pointless lines of thought that lead nowhere".
That was my initial thoughts over a year ago. Why the spinners want to spin an astronomy convention into a scientific fact is beyond me. They seem incapable of logic. But thats not surprising my first college class in formal logic had 90% of the class really struggling because you couldn’t just memorize the literature.
The simple logic is if you can have a particle rotating in an elliptical orbit it makes 100% logical sense you can have an object rotating in an elliptical orbit.
But you show them the calculations for that. . . .http://hyperphysics.phy-astr.gsu.edu/hbase/amom.html#amp and the spin machine goes into hyperdrive.
“The simple logic is if you can have a particle rotating in an elliptical orbit it makes 100% logical sense”
So you know a rotation when you see it, and yet you are unable to define it?
Neither you or DREMT can define rotation.
Il-defined words are a trolls best friend.
“…and the spin machine goes into hyperdrive.”
Suggest that “revolution/orbit” is defined as a rotation about an external axis and the spin machine simply explodes.
Strange that none of the first five dictionary definitions of Orbit mention ‘rotation’ at all.
That doesnt stop people from making up their own facts!
” An orbit is a regular, repeating path that one object takes around another object or center of gravity.”
https://www.nationalgeographic.org/encyclopedia/orbit/#:~:text=Encyclopedic%20entry.,%2C%20asteroids%2C%20and%20manmade%20devices.
“An orbit is a regular, repeating path that one object in space takes around another one. ”
https://www.nasa.gov/audience/forstudents/5-8/features/nasa-knows/what-is-orbit-58.html
“orbit, in astronomy, path of a body revolving around an attracting centre of mass, as a planet around the Sun or a satellite around a planet.”
https://www.britannica.com/science/orbit-astronomy
“An orbit is the curved path in space that is followed by an object going around and around a planet, moon, or star.”
https://www.collinsdictionary.com/us/dictionary/english/orbit
“The path of a celestial body or an artificial satellite as it revolves around another body due to their mutual gravitational attraction.”
https://www.thefreedictionary.com/orbit
You are such an imbecile Nate. DREMT has told you this several times yet you search far and wide for stuff that avoids the word ‘rotate’ when all you have to do is look in a thesaurus. If you want to claim that orbit is not a rotation you actually need to establish it as such/
SYNONYMS FOR orbit
path
pattern
rotation
trajectory
apogee
circle
course
curve
cycle
ellipse
lap
locus
perigee
round
track
circumgyration
and thats not to speak of the fact that your own source here:
https://www.thefreedictionary.com/orbit
Uses these definitions:
orbit
noun
1. path, course, track, cycle, circle, revolution, passage, rotation, trajectory, sweep, ellipse, circumgyration the point at which the planet’s orbit is closest to the sun.
orbit
verb
To move or cause to move in circles or around an axis:
circle, circumvolve, gyrate, revolve, rotate, turn, wheel.
and usage:
orbit
orbit determination
orbit period
orbit point
orbital
orbital cavity
Orbital index
orbital injection
orbital mechanics
orbital motion
orbital plane
orbital point
orbital rotation
When cherry picking sources Nate you probably ought to actually read them or it makes you look like the idiot you are.
Heres DREMT:
“Suggest that ‘revolution/orbit’ is DEFINED as a rotation about an external axis”
So I look up the definition Orbit.
NONE of the first five Definitions of it ORBIT that pop up, define it as a rotation about an external axis.
They make NO mention of ROTATION at all!
And of course they don’t, because of the definition of ROTATION being a CIRCULAR motion, which ORBITS need not be.
And you guys refuse to come with any alternative definition of ROATATION that works!
https://www.drroyspencer.com/2022/12/uah-global-temperature-update-for-november-2022-0-17-deg-c/#comment-1423770
The claim is FALSE.
But go ahead and continue to live in your own fantasy world where facts don’t matter.
BTW Bill,
“and thats not to speak of the fact that your own source here:
https://www.thefreedictionary.com/orbit”
If I follow your link this is what I get:
“orbit (r′bĭt)
n.
1.
a. The path of a celestial body or an artificial satellite as it revolves around another body due to their mutual gravitational attraction.
b. One complete revolution of such a body.
2. The path of a body in a field of force surrounding another body; for example, the movement of an atomic electron in relation to a nucleus.
3.
a. A range of activity, experience, or knowledge.
b. A range of control or influence: “What magnetism drew these quaking ruined creatures into his orbit?” (Malcolm Lowry). See Synonyms at range.
4. Either of two bony cavities in the skull containing an eye and its external structures. Also called eye socket.
v. orbited, orbiting, orbits
v.intr.
To move in an orbit.
v.tr.
1. To revolve around (a center of attraction): The moon orbits Earth.
2. To put into an orbit: The space agency orbited a new satellite.”
It does not agree with ehat you posted!
And Bill, perhaps by design, you mix up DEFINITIONS and SYNONYMS. They are not equivalent.
And similarly you mix up THESAURUS with DICTIONARY, perhaps by design. They are not equivalent.
For example.
Equivalent
in a Thesaurus:
adjective
equal
identical
similar
parallel
analogous
comparable
corresponding
correspondent
interchangeable
like
commensurate with
Thus if one wanted to mislead people one could claim Equivalent is defined as Parallel.
“Uses these definitions:
orbit
noun
1. path, course, track, cycle, circle, revolution, passage, rotation, trajectory, sweep, ellipse, circumgyration the point at which the planets orbit is closest to the sun.”
What you’re obviously doing here Bill, is taking a list of SYNONYMS and calling them DEFINITIONS.
This is an intentional LIE, Bill.
Just to help you understand, here are some synonyms:
deception
deceit
fraud
dishonesty
disinformation
distortion
evasion
fable
fabrication
falsehood
forgery
fiction
hyperbole
inaccuracy
libel
mendacity
myth
perjury
prevarication
slander
subterfuge
tall tale
whopper
You guys are shameless!
Just to help readers follow the thread, I will leave this here:
https://www.drroyspencer.com/2022/12/uah-global-temperature-update-for-november-2022-0-17-deg-c/#comment-1424900
Bill skips over the lengthy dictionary definitions at the link, https://www.thefreedictionary.com/orbit
and finds this under the THESAURSUS section.
“orbit
noun
1. path, course, track, cycle, circle, revolution, passage, rotation, trajectory, sweep, ellipse, circumgyration the point at which the planets orbit is closest to the sun.”
These are clearly SYNONYMS, but Bill FALSELY identifies them as DEFINTIONS.
Shameless.
Just to help readers follow the thread, I will leave this here:
https://www.drroyspencer.com/2023/01/uah-global-temperature-update-2022-was-the-7th-warmest-of-44-year-satellite-record/#comment-1425037
Again DREMT shamelessly defers to a false authority, Bill, who is obviously lying.
No matter how many times it is repeated, or cited, it is still a lie.
Just a reminder that at 9:18 AM I linked to my own comment, not anyone elses.
People keep soldiering on claiming that
“revolution/orbit is DEFINED as a rotation about an external axis”
So I looked up the definition Orbit.
NONE of the first five Definitions of it ORBIT that pop up, define it as a rotation about an external axis.
They make NO mention of ROTATION at all!
Nor has anyone provided an alternative DEFINTION of ORBIT that defines it as ‘a rotation around an external axis’
So anyone who is aware of these plain facts, and yet continues to claim
” revolution/orbit is DEFINED as a rotation about an external axis”
is LYING.
There is no other explanation.
…a reminder that at 9:18 AM I linked to my own comment, not anyone elses.
Nate says:
People keep soldiering on claiming that
revolution/orbit is DEFINED as a rotation about an external axis
So I looked up the definition Orbit.
—————————
thats because you are wrong. it was in the first definition you posted. you just didn’t want to see it and did you usually do. . . .namely you fooled yourself!
As clearly demonstrated for everyone, Bill, you were posting misinformation and deliberately so.
Just stop.
“November 2022 was +0.17 deg. C departure from the 1991-2020 mean. This is down from the October anomaly of +0.32 deg. C”
What will December 2022 be, relative to 1991-2020 mean?
Though another question is what do you want it to be?
Some things that didn’t happen yet, Europeans are not freezing to death and we haven’t had a nuclear war.
The biggest news is China lifted it’s lockdown- though you can’t really trust any news about anything- Soviet Union news was probably more accurate, but weather forecast seems pretty good- no snow for me
this Christmas.
My day high will be about 66 F [19 C] and night low around 32 F [0 C]
and Christmas will be cloudy [1%] chance of rain or snow and 67 F and
33 F night low.
Which might seem fairly mild, comparatively to other places.
I have not had any snow here, yet, and forecast next week is going to get warmer and likely to rain.
But rather wanting snow for Christmas, what I have had, and will get is snow on hills around me.
Or if merely wanted snow on hills- which looks nice- I would get snow
in the hills for Christmas.
In terms of what is important, we didn’t get Spaceship test launch by Christmas. Rather than being the Grinch, Musk seems have allowed most of his elves have a holiday, and being on roll, could even include the New Year. As he seems to be an extremist.
But still trying for two more falcon 9 launches which if both work will bring 2022 to 61 launches, and Elon wanted 60 or more, so he probably get it.
2022 was crazy year for rocket launches. Just getting the SLS launch would made it remarkable. Other SpaceX doing the impossible, if you believe the news, China has also been busy with launching stuff into Space and they have space station in orbit.
I remember when ISS first got into orbit. I was never much of a fan of ISS, but when it seems Goldin, was apparently wondering if would be delayed further from being launched, I was rather impatient to get the puppy into orbit. I didn’t like the 51 inclination orbit, and reason why, was to work with Russians. It seems it would be nice, if we were doing something with Russians in similar fashion as back then. I understand Russian has been involved a lot wars since then, but there is the appearance that main reason to involve the Russia was their cheaper rocket launch- though this cheaper launch, cost us a lot money. But one could argue [badly] that ISS caused us to get SpaceX. But Elon Musk did go to Russia to see if he could get a cheap rocket launch to put a greenhouse on Mars, which lead him to deciding he could make a cheaper rocket, instead.
But anyhow, for 2023, Russian space launch doesn’t look good, but Chinese launch could be quite good, and SpaceX launch appears it will a lot more than the crazy amount it launched in 2022. And it seems
a lot nations are making rockets to go into space. And at some point we going to do more 3 D printing of rockets- maybe not much in 2023, but 2024 and later, probably a lot. And that could cause a trickle of more nations launching into space, into a flood.
Other Starship test launch, what I want is artificial gravity stations and Equatorial ocean launches. And related, place in the ocean where rockets bigger than Starship can be launched. {safely launch- and I would want rocket engines lighting about 100 meter above the ocean.
gb…it’s virtually impossible to predict the December mean because it’s the beginning of summer in the Southern Hemisphere which is largely Pacific Ocean. Whatever cold we experience in the Northern Hemisphere is likely offset by the warmth in the south Pacific.
Sure
https://coralreefwatch.noaa.gov/data/5km/v3.1/current/animation/gif/ssta_animation_90day_large.gif
PUBLIC ANNOUNCEMENT
A storm may be coming your way, and Xmas times means you need to drive. Here’s a quick lesson not to crash your car:
https://www.youtube.com/watch?v=TZQXuWzBC18
In any event, do *not* do like Moon Dragon cranks would suggest.
Little Willy, please stop trolling.
Once again, we are living in an Ice Age and last few million year of the present Ice Ace has been the coldest time of this Ice Age.
And all reconstructions or global temperatures agree with this.
During the Ice Age, there are warmer and cooler periods, and last few million years the warmer periods are getting cooler and the colder periods are getting colder.
An interglacial period starts from the colder of part a cool period called a glaciation period and rapidly warms with with centuries rapid sea level rise.
It has been proposed there is colder climate state than an Ice Age, which called a Snowball or Slush ball global climate, but there a lack evidence regarding them. If we discard the possibility of Earth ever being in snowball global climate, an Ice Age is the coldest climate Earth has ever had.
We also disregard a snowball global climate as not happening within last 250 million years, and no one claim Earth is going to enter a snowball Earth, despite everyone agreeing that last few million years has been the coldest time in the 33.9 million year old Ice Age which has been called the Late Cenozoic Ice Age.
And the reason we have been in an Ice Age is due to geological processes and having a cold ocean.
And we stay in this Ice Age because the cold ocean will not warm up enough and there is no known geological which will alter it. And both cold ocean and geological processes are factors which have always involved time periods of millions of years.
Or only thing which could happening quickly far ending this Ice Age is related large impactors, supernovas, and other cosmic events, which are not known to be going to happening.
Or some major thing the Yellowstone Super volcano has which erupted many times, over millions of years would be insufficient in doing anything to alter it.
Though massive amount if volcano activity under ice sheet could cause a large sea level rise. And also geological processes could cause huge tsunami wave race across the ocean causing much more death and damage than any large sea level rise. But this does not alter our global climate, nor have much effect upon life, other than humans which find it desirable to live close to a beach.
YES. NEXT QUESTION? Can space-based solar power really work? Here are the pros and cons.
When it comes to space-based solar power, there is no science to solve, Cash told Space.com. We have it all worked out pretty much since the 1970s, when NASA with the U.S. Department of Energy conducted a very large-scale study. Weve proven the physics behind this ever since we first launched a communication satellite into geostationary orbit. Youve got solar wings, which face the sun. And you have the body of the satellite, either with a parabolic dish or a phased array antenna, which faces the Earth. All the principles are the same; youre converting solar energy to electricity, converting it to microwaves and beaming it to Earth. The only thing thats different is the scale of the apertures.
Andrew Wilson, a researcher at the Advanced Space Concepts Lab at the University of Strathclyde in Scotland, who led a study looking into the feasibility of space-based solar power, agrees: I dont think theres technology that needs to be developed as opposed to just advancing through the technology readiness levels, Wilson told Space.com. Theres nothing really that needs to be invented.
There is, however, rather a lot of engineering work that remains.
If you really care about the planet you should support it, although in the meantime we should be rushing to build nice, clean, reliable nuclear plants.
https://instapundit.com/
So, let’s at details:
“Building solar power plants in space certainly isn’t an easy task, but it seems to have advantages at least for some countries. The technology’s proponents claim that a solar-power plant in Earth’s orbit would produce 13 times more power than an equivalent installation located in the notoriously cloudy U.K.”
https://www.space.com/space-solar-power-pros-cons
Ok but UK and Germany are hideous places to make electrical power from solar panels
“According to the United Nations’ Panel on Climate Change (opens in new tab), the world is currently on track to warm by 4.5 degrees Fahrenheit (2.5 degrees Celsius) by the end of the century. That is 1.8 degrees F (1 degree C) above the threshold considered safe by the international climate science community to avoid disastrous climate change consequences.”
But warm 2.5 C from the little Ice Age period, and nothing bad ever comes from making Earth have a more uniform average temperature.
But in terms wasting trillions of dollars because we have idiots almost anything looks better.
“Building solar power plants in space certainly isn’t an easy task, but it seems to have advantages at least for some countries. ”
For some countries, well might be good for Hawaii and UK and Germany
and when China runs out of coal- ah, forget that, they paying to much for coal now. For islands in general it could good.
And:
“Building a solar power plant in space would come with an enormous price tag. Once built, however, the plant would pay for itself much faster than any Earth-based renewable power generating technology, according to Wilson.”
Small compared to the crazy stuff they spent it on so far, but in time it could a lot cheaper.
“It could power flying airplanes”
Well, you could design such a plane, I guess
Cons:
–but the need to focus the microwaves that will carry the energy through Earth’s atmosphere into a reasonably sized beam that could be received on the ground by a reasonably sized rectenna. These focusing antennas, Cash said, would have to be 1 mile (1.6 kilometers) or more wide, simply because of the “physics you are dealing with.”–
It can be smaller- I think bigger is cheaper- economy of scale type thing. And a big one can’t power airplane, I tend to think for airplane you want multiple sources of beaming.
“This robotic construction is probably the biggest stumbling block to making this science fiction vision a reality, Cash said.”
Maybe. Developing such robots might a good reason to do sooner than later. But you waste a lot time and money failing to make them.
“Converting electricity into microwaves and back is currently awfully inefficient”
That has been an issue, some think lasers could be better.
“Huge amounts of energy, however, are lost already at the plant and then at the rectenna when the electricity produced by the photovoltaic panels is turned into microwaves and then back to electricity.”
You have to fix that first. But if launch costs lower a lot, you don’t need to [but probably will increase efficiency].
“It might be turned into a weapon of mass destruction
Some worry that microwave beams in space could be turned into weapons of mass destruction and used by evil actors to fry humans on the ground with invisible radiation.”
This silly argument- though lasers could be a good weapon. But we are already using lasers in war. No one using microwave in war- for good reasons. Anyhow targeted bombs work good enough for war. Dropping rod from space could work pretty good- so outlaw metal in space??
If actually getting power from space, it will reduce war on Earth.
“It would get damaged by micrometeorites”
Hence the another use of robots in space.
“It could contribute to light pollution”
if you anywhere near doing SPS, you can put telescopes in space and space telescope could cost less then using a telescope on Earth. surface.
“All the principles are the same; youre converting solar energy to electricity, converting it to microwaves and beaming it to Earth”.
This guy is no James Clerc Maxwell. More like the Scottish version of Bozo the Clown.
In case anyone missed the irony in this post, converting solar to a power that can be negotiated by magnetrons in a microwave unit, is about on parallel with the current idiocy about wind and solar power.
The amount of power that could be converted per unit is a p*** in the ocean compared to the amount of power required.
And what about the safety of people on the surface? Microwaves spread out over distance, you can’t focus them like a laser beam. If you have a kilowatt, or megawatt, of microwave energy being transmitted, it could potentially hit someone and seriously damage them.
But, wait, microwave, like any EM, loses power according to the square of the distance it travels.
A radar beam can start with 10,000 watts of power and by the time it returns to the sending antenna, it is measured in microwatts. With losses like that through the atmosphere, how feasible is it to send microwaves through the atmosphere?
I fear that the person behind this article is shaking some gullible funder down, into funding yet another Green, dead-end project.
Microwave transmission are commonly used on Earth. And we not talking
about microwave as intense as in microwave oven.
The story/myth of microwave ovens came someone working with microwave transmission being in it’s beam and finding out it melted a chocolate bar in his pocket, so worked making stronger and using less electrical power [the microwaves bounced around until absorbed by water, cooking potato in microwave is fast and cheap. Also heats up my coffee if I didn’t drink it fast enough.
Lasers would be better, because lasers have become a lot more efficient over the years, but laser in past were far less efficient- or wouldn’t been such good idea in 1970’s.
It seems likely sending and receiving, could get more efficient, but at moment, I tend to go with lasers at the moment.
But I don’t we are ready to use SPS right now, but I do think SPS right now is cheaper than solar and wind energy- but that is not really a good argument for doing it now. In 3 years launch costs could lower by more than 1/2, and 10 years by a 1/4.
Governments move slowly, maybe by time they ready, launch cost would will get even lower than I imagine they will get.
But if I was UK, I use money [a trillion dollars over say 5 to 6 years, related in lunar exploration and etc. As that will lower launch cost, faster. And it seems UK is moving in that direction {finally}.
gb…”Microwave transmission are commonly used on Earth. And we not talking about microwave as intense as in microwave oven”.
***
The local microwave dishes used for communications, telephone and the likes, runs at 0.5 watts. It’s line of sight communication and only half a watt is required.
Seems 5G is in the same vicinity power-wise. Can’t understand what all the fuss is about safety-wise.
The microwave oven runs at 1500 watts.
–C. SAFETY
Time-averaged RF power density levels at 10 GHz are re-
stricted by international agreement [24][26] to 10 W/m 2 for
the general public, 50 W/m2 for occupational exposure, and
100 W/m2 for military workplaces. Due to its low duty factor,
the Blossom Point transmitters time-average radiated power
only reaches these levels of concern in the immediate vicinity
of the reflectors feed. For illustration, however, Fig. 15 maps
these safety limits in the elevation plane assuming continu-
ous transmit power. —
https://ieeexplore.ieee.org/stamp/stamp.jsp?arnumber=9662403
It seems to me if limited 100 watts on military area , one should allowed higher amounts if confined to private property.
And if had private property on ocean it could be higher than on private property on land.
I think you can make freshwater lakes on the ocean, and such a freshwater lakes can be used for waste water management and it have dual use of getting beamed power from space.
And you could other freshwater lakes for other things, like generating nuclear power or residential use,
gb…I was not talking about w/m^2, just plain, old watts. A transmitter is rated in watts for power output, not w/m^2.
10 w/m^2 is a lot of power and I seriously doubt that any public transmitters operate at such a level.
“gbI was not talking about w/m^2, just plain, old watts. A transmitter is rated in watts for power output, not w/m^2.
10 w/m^2 is a lot of power and I seriously doubt that any public transmitters operate at such a level.”
The one I linked to:
“delivers 1.6 kW of electrical power at a 1046 m standoff from a 5.4-m-diameter X band transmitter.
The transmitter is a reflector antenna with a linearly actuated feed horn that can focus the power density at specific standoff distances.”
The test with that one was only about 1 km, and in past I read about testing sending power for over 100 km, and likely, with much larger dish. Of course those were also just tests [trying to send power at longer distance].
But this test was regarding how high the tower with disk needed to be, and appeared to be excited about being able to bounce off ground [or ground gave interference which amplified it] and got stronger signal.
In terms of “public transmitters” they can be quite small and lot of them could be on a tower- and, it doesn’t make much sense to talk per square meter as they tend to be smaller than a square meter.
I will note that going thru “sea level” type air for 100 km is a lot air compared to coming from space at fairly high angle [or putting into space at higher angle].
I have always thought that SPS is related to sending power from Earth to space and back to Earth. Bouncing the signal from orbit.
Or if you had SPS, then one would get the Earth to Earth via using space. But also instead SPS first, and leading to that, you could start with from Earth to Earth surface by bouncing it at some orbital height.
The problem is the present inversion loss with Microwave. And problem with lasers is what? People not liking the light show?
You make the light invisible.
Of course another factor with SPS is balancing power loads globally- and can do this without beaming earth to earth, instead you just send the power where ever it’s needed.
But with SPS one still power generation on Earth surface- one should have back up power, but amount power generation on Earth might at the level emergency back up power. Or roughly SPS would only provide say, 1/2 of global electrical use.
Of course another aspect is moving large energy use type things off of Earth- roughly have industry [and computing energy use], off of Earth’s surface.
willard…”Here is what happens when Muricans put the brakes an an icy road:
And here is what happens when Canucks do the same:”
***
You trying to tell me Canada is not in America? America is a continent of which the US is a part. It is named the United Sates ***of*** America.
Show me a map where there is a country called America listed on it. And show me how Hawaii is in America.
C’mon, Gordo.
I’m not trying to tell you anything.
You’re just a crank who has problems with his own equivocations:
https://en.wikipedia.org/wiki/United_States
Troglodytes keep conflating their country with a continent. Deal with them.
The short cut for United States of America is not ‘America’. ‘The US’ works but not America.
Look on a map, there is no country called America. And as I pointed out, Hawaii is in the US but not in America.
Come on, Gordo.
Language is a social art.
You do mean a lie, don’t you?
Not exactly, Gordo:
https://en.wikipedia.org/wiki/Demonyms_for_the_United_States
I rather like “Usonian,” “Frede” and “United Stater.”
Meanwhile, Murican suits me fine.
I would suggests Yanks, aka Yankees, but that has negative connotations for the rebs from the South. Apparently the word Yankee is derived from the Dutch word Janke, which means Jan, or John. It was used by the Dutch in reference to Yanks from New Hampshire.
I don’t know why the Union Army became known as the Yankees since the term predates the Army.
The problem is obviously the lack of a term for United States. The only problem I have with you guys calling yourself Americans is that it misrepresents the US as America, which it is not. The US is in America, not America itself and it seems that is a long-standing issue based on the quotes you supplied of people trying to find a name that works.
I still laugh at the encounter I had with a Scottish lady in Scotland a few years back. She asked if I was American and I told her I am. Then she asked where I am from in America and I told her Vancouver, Canada. She looked puzzled and noted that Vancouver is in Canada. I told her she was correct and that Canada is in America.
She looked puzzled for a few seconds then the light went on. She laughed and told me she’d remember that.
I don’t care that the US has stolen the word American. Small potatoes. However, as a Canadian I am as much American as any citizen of the US.
You mean Murican as popularized by LBJ.
Ma fullow Muricans.
You can’t win at this game. Many here in BC don’t like the name British Columbia. Some wankers want to change it to Pacifica. Can’t shorten that to BC. Maybe we could just rename the province, BC.
“I dont care that the US has stolen the word American. Small potatoes. However, as a Canadian I am as much American as any citizen of the US.”
But as a Canadian, I know Canadians call Americans, Americans.
A problem is America has 50 States, and Canadian can’t tell difference of Californian from a New Yorker, so they call them Americans.
Though a Texan is pretty easy to spot.
“HAARP IS ABOUT TO PING AN ASTEROID: Researchers from NASA and the University of Alaska are about to perform an unusual radar experiment. They’re going to ping a near-Earth asteroid using shortwave radio. The target is a 500-ft-wide space rock named “2010 XC15.” When it passes by Earth on Tuesday, Dec. 27th, the HAARP array in Alaska will hit it with a pulse of 9.6 MHz radio waves.”
https://www.spaceweather.com/
I was wondering recently whether they use Microwave when do radar observation of space rocks. This time they are using radio waves.
Solar wind
speed: 502.2 km/sec
density: 1.59 protons/cm3
Sunspot number: 107
The Radio Sun
10.7 cm flux: 133 sfu
Thermosphere Climate Index
today: 15.16×10^10 W Neutral
Oulu Neutron Counts
Percentages of the Space Age average:
today: +0.6% Elevated
The little sunspots are growing a little bit.
gb…”But as a Canadian, I know Canadians call Americans, Americans”.
***
There are a lot of Canadians who would be happy if the US took over Canada.
Any Canadian who does not realize he/she is as American as a US citizen deserves to be taken over.
Solar wind
speed: 456.0 km/sec
density: 5.80 protons/cm3
Sunspot number: 89
The Radio Sun
10.7 cm flux: 133 sfu
Thermosphere Climate Index
today: 14.61×10^10 W Neutral
{thermosphere not very energized}
Oulu Neutron Counts
Percentages of the Space Age average:
today: -1.8% Below Average
48-hr change: -1.5%
Still got a fairly large coronal hole in northern hemisphere
of sun.
Old large sunspot coming from farside [southern hemisphere].
Not like going to go spotless or something but Dec sunspot number
will on high side, but Jan might go back to sideways.
willard…”What makes you think the Moon stopped from spinning, Gordo?”
***
Why would you try for such a lame gotcha?
C’mon, Gordo.
If you don’t know how the Moon stopped from Spinning, what are you doing here, except to display daily your willingness to embrace whatever crank stuff comes your way?
I have never claimed the Moon was spinning, I simply don’t know. I don’t think anyone else knows either.
No one knows where it came from and when it was captured by the Earth. How often do planet sized moons come along at the right momentum and altitude to be captured?
That leads me back to the theory that maybe the universe was created, however, the human mind prefers far more mundane theories such as evolution. Theories that make no sense but which somehow please the need in some minds for mindless authority.
C’mon, Gordo.
If the Moon never spun, why do you think Graham and Pup claim that it stopped from spinning?
Think.
Little Willy, please stop trolling.
rlh…”GR. The magnitude of the land tides is around 30cm on Earth.
Unlike ocean tides, land tides only change the Earths surface by around 12 inches (30 cm) or so twice a day.”
***
Least you could do is quote me correctly. I said the Moon’s tidal force raises the oceans a metre and the surface about a centimetre.
“I said the Moons tidal force raises the oceans a metre and the surface about a centimetre.”
I was pointing out that your ‘measurement’ was incorrect. The true figure is 30cm, not 1cm.
And I claim the idea of the solid surface rising by 30 cm would produce disastrous effects on infrastructure, like roads, bridges, dams, reservoirs, and buildings.
No civil engineer designs infrastructure based on lunar tidal forces.
> No civil engineer designs infrastructure based on lunar tidal forces.
A stopped clock moment for you, congratulations.
ICYMI
The sway in buildings is built in to the design. The Moon lifting the solid Earth surface by 12″ is not.
Lunar tidal force can lift the oceans by 3 feet at mid-ocean. That rise causes a considerable change at the edges of the oceans. Claiming the Moon’s tidal forces can lift solid granite by 1/3rd that distance is absurd.
Try some actual engineering, Gordon:
Compute the bending moments for a 12 inch deflection over 15,000 inches and that of the same deflection over 0.4 billion inches.
If granite can’t handle the loading in the latter case I’ll eat my hat.
Brandy Guts, please stop trolling.
Such a clown.
#2
Brandy Guts, please stop trolling.
> Good thing Brandon ran for the hill. We were just about to dismantle his theories.
C’mon, Gordo.
Moon Dragon cranks can’t even agree if the Moon rotates or translates, or if the Moon once spun.
Go right ahead. Try to dismantle.
The “Spinners” couldn’t disagree on more things.
1) Some say a ball on a string is not rotating on its own axis. Others avidly disagree.
2) Some say “rotation about an external axis with no rotation about an internal axis” is motion like the MOTL. Others avidly disagree.
3) Some say the moon issue is not resolved by reference frames. Others avidly disagree.
4) Some say that “revolution/orbit” is a rotation about an external axis. Others avidly disagree.
Not once will “Spinner” argue against “Spinner”, though, despite all their disagreements.
People in glass houses…
There is no such things as an ‘external axis’ unless you wish to subdivide the whole into separate parts first. All axis are internal axis compared to the whole.
Then what is the Moon revolving about? And why? If it has a revolution axis, as claimed by Newton, then it must have an external axis about which is is rotating.
Earth’s gravitational field acts like a string to hold the Moon in orbit. It’s a flexible string and it’s far wider than a string in its action, but nevertheless, it acts like a string.
Come on, Gordo.
We are still waiting for that Newton quote, for a longer time than Graham can wait for Tim.
Indeed, Graham.
It is as if he had no idea why we mention the word system.
Indeed, Richard, that is.
Sorry.
How come you never bring this non-point up with other “Spinners”, RLH?
I have brought it up with all mentions of ‘external axis’.
Not true, but never mind.
I have, but there is no ‘external axis’ whoever brings it up.
…but never mind.
Gaslighting Graham gently plays No U.
Hush, child.
Gaslighting Graham gently gaslights a little more.
Little Willy, please stop trolling.
‘rotation has to occur in a circle’ is one of the dumbest and most desperate arguments ever made on this blog”
One would think that anyone making ridiculous hyperbolic rants like this, should be able to provide an explicit definition of ROTATION that disagrees with this.
Meanwhile their opponents can simply point to explicit definitions of ROTATION in numerous valid sources, that agree.
Madhavi
“Rotation about a Fixed Axis. In this motion, the particles forming the rigid body move in parallel
planes along circles centered on the same fixed axis (Fig 1).”
It is quite clear that this poster does not have an alternate explicit definition of rotation that supports their claim that
‘rotation has to occur in a circle’ is one of the dumbest and most desperate arguments ever made on this blog”
nate…”Madhavi….Rotation about a Fixed Axis. In this motion, the particles forming the rigid body move in parallel…”.
***
That describes the motion of the rigid body we call the Moon. It is orbiting the Earth as its axis, and the particles forming the Moon all move in parallel.
Madhavi is describing the curvilinear translation of individual particles of a rigid body. If that defines rotation of a rigid body about an internal axis why does it not apply to a rigid body orbiting an external axis?
Look at it this way. Fill in the space between Earth and Moon to make it one solid, rigid body. No one would argue that the Moon was now part of a system rotating about the axis of the Earth.
What’s the difference if the Earth and Moon are separate bodies?
I noticed that you stopped the quote before it got to “parallel
planes along circles centered”
since the Moon’s particles certainly DO NOT move that way.
As we all know well by now the Moon moves in an elliptical orbit and exhibits libration.
So barry agrees that "revolution/orbit" means a "rotation about an external axis". I wonder if he will ever get the kind of grilling for his correct opinion that I have received?
P.S: Whatever happened to Tim? He still has two questions to answer!
You need to orbit about something, so you cannot orbit an ‘external axis’ of thew whole thing combined.
So you’ve challenged barry…interesting. I can’t wait to see what he has to say to you, whenever he returns. Of course, what you say is a complete non-point which you never shut up about, but I’ll still be interested to hear what he has to say.
I’ll challenge anyone who says that an object can orbit nothing.
OK, RLH.
Is this debate no longer about what is the truth about the Moon?
Or is it about scoring imaginary points by pointing out who said what and who they disagree with?
If one is after the truth about the Moon, then one should be able to make sense of all the available facts, particularly those that are directly observed by Astronomy.
If one has to carefully select (cherry pick) only the few statements one can find that appear to agree with one’s POV, while ignoring all contradictory facts and sources, then this is simply never going to be convincing.
Nate
The so-called ‘non-spinner’s and that part of the so-called ‘spinner’s I prefer to name the ‘anti-non-spinner’s all do not have any interest in whichever ‘truth about the Moon’.
The only interest of both parties is to endlessly try to deny or conversely to ‘prove’ the lunar spin by using strange, useless ‘models’ like coins, merry-go-rounds, ball-on-a-string, MOTL/MOTR pictures, curvilinear translation and the like.
The discussion about these ‘models’ of presence or absence of lunar spin seem to be much more important than the lunar spin itself.
And the arrogance of some idiots who discredit centuries of science and distort Newton’s words about Moon’s spin until it fits to their perverse, egomaniac narrative is even worse.
Bindidon, is that your confession?
A sincere confession like that would be a good place to start the New Year. Clear your slate and start again. There’s a lot to learn. And with your lack of knowledge, there’s only one way to go — up.
That would make Gaslighting Graham an anti-non-spinner, as he clearly stated not caring about the issue anymore.
All he wants is discordian fun.
As if he was trolling or something.
barry will probably already be aware that some hypocrites here have been carefully ignoring all the sources that state that "revolution/orbit" means a "rotation about an external axis" and are only cherry-picking those sources that appear to agree with their POV…however, they are going with sources that state "revolution/orbit" is just a path or trajectory, oblivious to the fact that this doesn’t support their cause any more than it supports the "Non-Spinners"…
(…they really need a source stating that "revolution/orbit" is a translation in a circle/ellipse, but they can’t find that, so they just pretend that these other sources support them).
Nope, not “been carefully ignoring all the sources that state that “revolution/orbit” means a “rotation about an external axis”
Making sense of them and putting them in context of all available facts. Such as here:
https://www.drroyspencer.com/2022/12/uah-global-temperature-update-for-november-2022-0-17-deg-c/#comment-1415027
Which is worth repeating:
As everyone knows, Wikipedia is edited by the public and thus sometimes contains misleading or contradictory information:
Hence an article on Rotation states in its first line:
Rotation, or spin, is the CIRCULAR movement of an object around a central axis.
and that is CORRECT, as we can see from any Kinematics textbook:
‘Rotation about a Fixed Axis. In this motion, the particles forming the rigid body move in parallel
planes along CIRCLE centered on the same fixed axis’
https://mvsrec.edu.in/images/dynamicsofrigidbodies.pdf
Then later the same article states
‘A rotation around a completely external axis, e.g. the planet Earth around the Sun, is called revolving or orbiting, typically when it is produced by gravity, and the ends of the rotation axis can be called the orbital poles.’
Since planetary orbits are well known to often be ELLIPTICAL rather than circular, this statement appears to CONTRADICT the prior one, and the definition of ROTATION found everywhere else.
It as at the very least unclear on its generality to all orbits.
Then later the same article clarifies the issue for planetary motion:
‘While revolution is often used as a synonym for rotation, in many fields, particularly astronomy and related fields, revolution, often referred to as orbital revolution for clarity, is used when one body moves around another while rotation is used to mean the movement around an axis.’
This returns to accuracy, and agrees with the first definition of rotation given in the article, while contradicting the second statement.
In any case, no one with INTEGRITY would cherry pick only the single incorrect sentence from a Wikipedia article to make their argument, while ignoring all other contradictory and correct statements in the same article and those found in every other reliable source.
Well, one thing’s for sure – making sense of all of the quotes on "revolution/orbit" and putting them in context of all available facts, we can safely conclude that "revolution/orbit" is a rotation about an external axis. Thus settling the issue once and for all in the "Non-Spinners" favour. Another juicy, succulent victory for Team Reality.
You are probably the ONLY person who comes to that conclusion.
Putting everything in context (ie the context of astronomy) it is clear that
* moons, planets, stars, etc rotate on their axes
* moons, planets, stars orbit around other larger objects.
Sure, words like rotate, circle, spin, orbit, revolve, and twirl overlap in varying degrees in varying contexts. But you can’t just take any two meanings that overlap in two different settings and claim they are the same in other contexts.
For instance, people could describe a merry-go-round and either ‘rotating’ or ‘revolving’. People could described the moon as ‘revolving’ or ‘orbiting’. That does NOT make “rotating” and “orbiting” the same.
In any technical setting, “rotate” always means “move in a circle”. There is simply no way to conclude that “rotate” includes ‘moving in an ellipse’.
Tim, you have to pretend that the various definitions of “revolution/orbit” as being a rotation about an external axis do not exist. Your cognitive dissonance must be excruciating. Poor you.
Its as if he didnt read your post at all, Tim.
Everyone else gets it.
Poor you.
And so Gaslighting Graham gently gaslights a little more.
Little Willy, please stop trolling.
One thing is sure is that Gaslighting Graham will soldier on.
Yes, I will soldier on, the victor…
*These ‘wins’ by performance enhancing narcissism.
…I will soldier on, the victor…
Gaslighting Graham will also gently gaslight a little more.
Little Willy, please stop trolling.
We award you the last wording consolation prize. Go for it..
#2
Little Willy, please stop trolling.
“some hypocrites here have been carefully ignoring all the sources that state that ‘revolution/orbit’ means a ‘rotation about an external axis'”
How can you can you have an ‘external axis’ that is part of the whole?
External to the body of the orbiting object itself, RLH. The funny thing is, aside from this quibble, you agree that “revolution/orbit” is a rotation around an external axis! You just don’t like calling it an “external axis”…
Keep reminding Gaslighting Graham that he needs to consider the Earth and the Moon as a whole system, Richard.
One day he’ll get it.
The funny thing is, aside from this quibble, you agree that “revolution/orbit” is a rotation around an external axis! You just don’t like calling it an “external axis”…
Who knows, Richard, Graham might even get what Tim keeps telling him!
…funny thing is, aside from this quibble, you agree that “revolution/orbit” is a rotation around an external axis! You just don’t like calling it an “external axis”…
Warmer is bad for you they say
Let them eat snow
https://n.pr/3C6GMli
If some think they are able to scientifically contradict the work made since decades about orbital and rotational data of all planets and moons around us
The JPL Planetary and Lunar Ephemerides DE440 and DE441
https://iopscience.iop.org/article/10.3847/1538-3881/abd414/pdf
especially what is written in section 4 (Rotational Dynamics of the Moon), they should write a paper exactly explaining their scientific contradiction.
Using trivial ball-on-a-string ideas, together with discrediting, denigrating all the science that led to the current Ephemerides?
Pffff.
Bin, did you find another link you can’t understand?
Ephemerides deal with orbital motion. So there is NOTHING there that supports your bogus “lunar rotation”.
Here’s something usual you could do — Contact one to more authors of that paper. Ask them what their model of “orbital motion without axial rotation” is. If they can’t provide one that works, you know they’re phonies.
Let us know what the responses are.
Who knew that JPL is a member of my “cult”?!:
At least you’re admitting you’re in a cult, braindead Brandon. That’s progress.
Reality always wins.
Rather the opposite C00ky Clint; I’m pointing out that you don’t apparently know the meaning of the word.
Brandy Guts, please stop trolling.
> there is NOTHING there that supports your bogus lunar rotation
There’s an entire section devoted to lunar rotation you pretentious b00b:
… bbbut not from first principles so it must be wrong!
Similar challenge I gave Bin — Contact the authors for the model of OMWAR, and verification from First Principles that Earth’s spin angular momentum can be transferred to Moon’s linear momentum, through a vacuum!
Then show us the responses, with names.
What if I were to tell you that I already know what their answer will be just from having read the paper, C00kie?
Apart from go to school and then do all their post-doctoral work that is.
Make your own sammich, IOW.
First Principles, now in Proper Case no less, may not be all you have them cracked up to be, which is why I asked you above whether the universal law of gravitation qualifies.
So sad that you ran away.
[sniffle]
Sorry braindead Brandon but all that rambling babble just indicates you’ve got NOTHING.
If you had anything…
But, you’ve got NOTHING, except your juvenile trash like “sammich”.
Grow up.
C00ky is getting testy.
Why he refuses to say whether the universal law of gravitation is a First Principle or not may have something to do with G having been determined empirically.
Sadly it’s assumptions, parameters and models (oh no!) all the way down.
Pointing to uncertainties and lack of absolute “proof” is all that ignorant cranks like Clint need to stay that way.
Sad indeed.
[weeps]
Still got NOTHING, huh Brando?
At least you’re consistent…
I’ve got the detailed work of mainstream scientists in refereed literature, C00ky.
You can’t even tell me whether the universal law of gravitation is a First Principle or not.
Such a sad little man. I cry for you.
[b00 h00]
VERY consistent.
brandon…”Why he refuses to say whether the universal law of gravitation is a First Principle or not …”
***
Would you be so good as to enlighten us to what this has to do with anything?
Clint knows, Gordon, which is why he’s ducking the question.
Wrong braindead Brandon. I’m not “ducking” anything. I’m ignoring immature trolls.
When you grow up and can comment responsibly, then I can respond accordingly.
Verrrry convenient, C00ky. Keep on running.
Brandy Guts, please stop trolling.
brandon… The angular momentum vectors of the mantle and core are the product of the angular velocities and the moments of inertia. ”
***
In order for a rigid body to have an angular momentum it first has to be rotating about a local axis. Where’s you proof of that? We non-spinners have proved it is not happening.
Come on, Gordo.
Where is your proof of that?
Now we all know it: Clint R is this blog’s dumbest, most ignorant troll.
He has NO IDEA about what is explained in section 4 (Rotational Dynamics of the Moon) of a document, let alone would he ever be able to scientifically contradict anything of it.
BUT… he discredits it, like he discredits and denigrates everything what doesn’t fit his utterly stupid ‘ball-on-a-string’.
Now I’m definitely sad of this brainless Clint R stuff.
Too afraid to contact your sources, huh Bin?
Just invite them here to answer questions. I’m sure they’d like to discuss their “science” on a public forum….
Musk is trying to get people to think for themselves. Most people can’t, as we’re learning here.
Musk Tweet this morning: “New Twitter policy is to follow the science, which necessarily includes reasoned questioning of the science.”
That is not a tweet, Pup.
This is a tweet:
https://twitter.com/GretaThunberg/status/1608056944501178368
Do the Poll Dance Experiment.
clint…that does not fill me with confidence. Recently I heard Musk’s views on global warming/climate change and he sounds like a raving alarmist. Hope I’m wrong.
I can’t say I know much about Musk, but a raving alarmist could fit into his description as seems to think humankind existence is in possible peril, but in terms of near term, I would guess AI would be an more immediate concern- AI could be a significant risk and it could very helpful to Humankind. Anyhow AI is big and near term issue, whereas climate change could be less significant and longer term issue.
Or in terms of next 100 years, AI could have more significant unknowns. In terms climate climate and next 100 years no one has really seriously said much will happen, even something as wild as 5 meter rise in sea level is not very alarming.
In terms of significant nuclear war, vs 5 meter sea level rise, a 5 meter rise is less of an issue. And no one thinks 5 meter rise is reasonable within 100 years. And 1 meter rise in 100 years is less likely than a nuclear exchange- and it seems that Russia directly involved [not indirectly] is unlikely- mainly because Russia has spent awhile thinking about the consequences of it. And seems buy into the Mad Doctrine- have them, but avoid using them. But a Mad Doctrine for Russian, doesn’t extend to not having other nations having them- or for Russia, the more the merrier. The more the less Russia is the main target of them. Or with large nation like Russia getting only 100 nuclear attacks is a win, in terms of Mad Doctrine, whereas getting more 500 nuclear strike is a more of a loss. And Iran
maybe thinking like Russia. I tend to think Iran should be turned into a glass parking lot- which even religious crazies, don’t want.
That a nuclear war starts in Middle East seems likely- no where else, seems to want it.
But largest chance is it being an accident/mistake- or somewhere other than middle east, because it’s due to a “mistake”.
Using them in terms a war- to win a war, seems to point to North Korea. Or North Korea in a war, is country which loses the war, quickly- unless nukes are used. And any country just using 1/2 dozen nukes to win a war- and wins the war, changes things a lot, in terms future nuclear wars. So, likewise, North Korea should also be turned into a glass parking lot. And the leadership [which could survive it- should all be executed- but such prospect, would not be deterrent- but could deter later ones.
But I think being space faring civilization would make nuclear war, old fashion/outdated. A space faring could wipe out the entire planet. But has no reason to do it- other than some gross mistake- or a big enough impactor make any kind of nuclear exchange, small potatoes.
In space, it’s hard to hide- a criminal threatening it- would simply be killed. And why would an Earthling want to do it. It easy to do, but also only slightly harder to stop. And it could happen “naturally” and would want stop it, if caused “naturally” or by mistake.
And space alien wouldn’t want a planet- They would have to be able to live without a planet- so, they don’t need one.
Or Earth is a place with a high cost to get energy- Mars would seem more desirable- as it takes less energy to leave it. And Mars works ok- if you want some place to hide.
Anyhow, Musk probably knows, that Earth has some finite amount of cheap energy.
https://youtu.be/cer5_0Dr06A
Carl Sagan joins a panel to testify in Congress on climate change and the greenhouse effect.
DECEMBER 10, 1985
I’m glad to be here. As I understand my function, it is to give some sense of what the greenhouse effect is, to try to say something about the greenhouse effect on other planets, to again underscore that this is a real phenomenon, and then perhaps I can take liberty to say a few remarks about what to do about it.
The power of human beings to affect and control and change the environment is growing as our technology grows and at present time we clearly have reached the stage where we are capable, both intentionally and inadvertently, to make significant changes in the global climate and in the global ecosystem. And we’ve probably been doing on a smaller scale, things like that for a very long period of time. For example slash and burn agriculture, which has been with us for tens of thousands of years, probably changes the climate to some extent by changing the Albedo, the reflectivity of the Earth.
That massive changes have occurred is clear from the historical record. For example Egypt was once the breadbasket of the Roman Empire, had maybe the same role as the American Midwest plays today, that is certainly no longer the case. It’s not a greenhouse effect issue, it maybe an over grazing issue, but it is an example of how humans are perfectly capable of making these unexpected and inadvertent changes.
Because the effects occupy more than a human generation there is a tendency to say that they are not our problem. Of course then they are nobody’s problem, not on my tour of duty, not on my term of office, it’s something for the next century. Let the next century worry about it.
But the problem is that there are effects, and the greenhouse effect is one of them, which have long time constants. If you don’t worry about it now, it’s too late later on, and so in this issue as in so many other issues we are passing on extremely grave problems for our children when the time to solve the problems if they can be solved at all is now.
“That massive changes have occurred is clear from the historical record. For example Egypt was once the breadbasket of the Roman Empire, had maybe the same role as the American Midwest plays today, that is certainly no longer the case. Its not a greenhouse effect issue, it maybe an over grazing issue, but it is an example of how humans are perfectly capable of making these unexpected and inadvertent changes.”
It wasn’t over grazing.
It was Earth getting drier- or global cooling.
It happened before humans had herds of animals and it happened like
clockwork.
But it was one of biggest climate changes, which modern human have lived thru.
Denied facts are still facts.
So, less than a million goats caused the biggest climate change to have occurred recently on Earth.
And a low global population of humans caused the biggest climate change.
And burning witches was correct thing to do?
WTF are you talking about?
Some people in the past, theorized humans caused the desert in the Sahara desert.
This is an outdated idea- data strongly argues otherwise.
Likewise women were blamed for bad weather in the past- they were
called witches.
maguff quotes Sagam a loud-mouthed schnook…”As I understand my function, it is to give some sense of what the greenhouse effect is, to try to say something about the greenhouse effect on other planets…”
***
Sagan’s description of the GHE on Venus was proved wrong by the Pioneer probes. They measured surface temperatures on Venus at about 450C, far too hot to have been the product of a runaway greenhouse effect, if one exists.
Therefore, Sagan was full of hot gas. He had no idea what a greenhouse effect meant because there is none in the atmosphere. Even the modern IPCC with all its peer reviewed papers cannot explain it.
Grand Solar Minimum is on
https://youtu.be/cejkoatplUo
All this because you emmit some CO2.
They are snowing on your feet and telling you it’s global warming
https://youtu.be/4wVC1e1VMe8
What it would take to discover life on Saturn’s icy moon Enceladus
https://www.spacedaily.com/reports/What_it_would_take_to_discover_life_on_Saturns_icy_moon_Enceladus_999.html
It’s an interesting question.
Or how easy would be it be compared to say Europa.
I would guess less harmful radiation, and it’s lower gravity world.
The issue is not one of understanding, it is one of your side not having any evidence to support your belief. That is made clear by neither Bill nor you being able to answer how to test your belief.
If it isn’t testable and falsifiable it isn’t science, it’s religion.
Referring to
https://www.drroyspencer.com/2022/12/uah-global-temperature-update-for-november-2022-0-17-deg-c/#comment-1418464
Poor Nate is now talking to himself.
That’s why this is so much fun.
So now we have Bill, DREMT and Clint completely unable to answer how their theory could ever be tested, and if didnt pass the test, be falsified.
We have no choice but to conclude that their Moon theory is a religious belief.
Nate continues talking to himself, making things up as he goes because he has NOTHING.
A Moon Dragon crank theory as to why the Moon has no angular momentum would already br great.
Little Willy, please stop trolling.
nate…”If one is after the truth about the Moon, then one should be able to make sense of all the available facts, particularly those that are directly observed by Astronomy”.
***
I have gone into great detail on this matter and I have received no constructive criticism.
What is observed by astronomy is that the Moon keeps the same side pointed to Earth at all times. I have proved that a body orbiting a planet under such conditions cannot possibly be also rotating about a local axis.
The proof is dead simple. If the near side always points at Earth the far side must always point away from Earth. That means, at all times, the near face and the far face are moving along concentric circles. At the same time, the COM is moving along a circle inside the two concentric circles therefore is concentric to the other two.
That principle can be extended to all points on the Moon. Every point is moving along concentric circles, therefore those points cannot possibly be rotating about a local axis at the same time.
The type of motion described by the parallel motion of all points in the rigid body is curvilinear translation. Newton called it curvilinear motion, which is the same thing.
> cannot possibly be also rotating about a local axis.
Readers might hope that Gaslighting Graham is paying attention.
How much would you be willing to bet to prove you wrong, Gordo?
Come on.
Don’t worry – Gordon is the one who believes that the moon’s phases are caused by the earth’s shadow. No one actually believes he knows what he’s talking about.
I’m not certain Gordon actually believes that, but he needs to correct his statement nevertheless. We all can get something wrong when writing in haste. Gordon needs to slow down so he doesn’t make as many mistakes because often he has brilliant things to contribute.
If he says one brilliant thing and then says one stupid thing, readers will just think he’s a loose cannon, firing in all directions.
What does “every point is moving along concentric circles” mean?
What is most amusing here is that the trivial assertion
” That principle can be extended to all points on the Moon. Every point is moving along concentric circles, therefore those points cannot possibly be rotating about a local axis at the same time. ”
could apply to a slowly rotating Earth as well, when observed from the Sun if it were a giant planet and not a hot star.
AQ and Bin, we try different examples to get your cult to understand Moon’s motion. But, nothing works. That’s because cult idiots are braindead.
The problem is not with the examples, Pup, but with your ineptitude to think them through.
After all these years, you could have come up with better ones anyway, like the hammer throw or the yo-yo with a loose axle.
Correct, the problem is not with the examples.
The problem is with the braindead cult idiots and the worthless trolls.
Fortunately, both are often easily ignorable.
Indeed, Pup. It is very easy for you to block your ears and chant “lalala I can’t hear you.”
You got more than ten years of practice on this website.
The problem is with the braindead cult idiots and the worthless trolls.
Fortunately, both are often easily ignorable.
The real problem is that you do not do the Pole Dance Experiment, Pup:
https://www.youtube.com/watch?v=XNLyGhFdnHw
“That principle can be extended to all points on the Moon. Every point is moving along concentric circles, therefore those points cannot possibly be rotating about a local axis at the same time.”
…well, they can’t, unless “orbital motion without axial rotation” is motion like the MOTR. We’d need to see what model the “Spinners” have for OMWAR being as per the MOTR. So far they’ve come up with the bicycle pedal, and the Hubble Telescope whilst focussed on some distant star. Both of those have been debunked. Do they have anything else?
dremt…”well, they cant, unless orbital motion without axial rotation is motion like the MOTR”
***
We have already pointed out to the spinner that MOTR is represented by a gondola car on a ferris wheel. In other words, you’d need an axle on that Moon for it to rotate about independently of the orbit, to keep it upright.
Come on, Gordo.
The car on the Ferris wheel could represent both sides of that silly GIF.
All you need is different physics.
Which of course we have, as explained by the legend of that silly GIF.
Little Willy, please stop trolling.
“the Moon keeps the same side pointed to Earth at all times”
because it rotates once on its axis per orbit of the Earth.
That is the “Spinner” view.
Exactly, Richard.
That’s Team Physics view.
…is the "Spinner" view.
richard…I have asked you to prove the Moon rotates exactly once on its axis per orbit. Still waiting.
A set of vectors are equal if they all have the same length and same direction — even if the tails are drawn in different locations.
A vector is stretching if the vector changes length, but maintains a constant direction — — even if the tails are drawn in different locations.
A vector is rotating if the vector changes direction, but maintains a constant length– — even if the tails are drawn in different locations.
Draw a vector from the center of the moon to a point on the moon’s equator. Over the course of a month, that vector (which tells us the orientation of the rigid moon) changes direction but maintains a constant length. Yes, the tail changes location, but that is fine. The vector — and the moon — are rotating about the moon’s axis.
Let’s test that Tim. What is your vector measuring, or representing? You can’t arbitrarily, draw a vector and claim it represents the Moon rotating about an axis.
We are interested in a vector that would rotate about the Moon’s centre. We can test your theory easily. Draw a radial line from Earth’s centre through the lunar centre. Replace the radial line part through the Moon with two vectors: one pointing from the lunar centre to the near side and one pointing to the far side.
You have two vectors sitting tail to tail and 180 degrees apart. Now let the radial line rotate about Earth’s centre. At no time will those two vectors break with the radial line. In order for them to rotate through 360 degrees, as required for rotation about a local axis, they would have to break with the radial line and rotate within it.
Alternately, you could draw 3 vectors. The tail of each touches the radial line at the Moon’s centre, the near side junction and the far side junction, all poiting in CCW diretion. You have three vectors parallel to each other and through the entire 360 degree motion of the orbit, they will remain parallel at all times.
Do I have to reveal the obvious, that if any of the 3 vectors was rotating about the Moon’s centre, they would need to point at an angle to the radial line at an angle other than 90 degrees.
Come on, Gordo.
The vector represents a part of the equator. You put it there to be able to observe the Moon spin.
Please leave playing dumb to Bill.
Little Willy, please stop trolling.
“What is observed by astronomy is that the Moon keeps the same side pointed to Earth at all times.”
No, it is more than that. The moon rotates at a constant angular velocity (stars move across the sky at a constant rate). The moon orbits at varying angular speeds. (This is one basic cause of libration.) The non-spinners still cannot explain this simple observation.
“I have proved …”
That is not how science works. No matter how elegant your theory, until it can accurately explain the constant spin on the moon’s axis, the theory is useless.
“Every point is moving along concentric circles …”
No. The center of the moon is moving along an ellipse, not a circle. So right off the bat, you are wrong. I will grant that every point on the moon is moving in concentric circles around the axis, but that is the definition of ‘rotating about the axis’.
Tim tries to run away from his mistakes:
https://www.drroyspencer.com/2022/12/uah-global-temperature-update-for-november-2022-0-17-deg-c/#comment-1418925
tim…”The moon rotates at a constant angular velocity (stars move across the sky at a constant rate). The moon orbits at varying angular speeds. (This is one basic cause of libration.) The non-spinners still cannot explain this simple observation”.
***
Anyone with half a lick of scientific sense knows the Moon has only a linear velocity. Newton knew that back in the 1600s yet it has escaped you. Because it only has a linear velocity that means it requires a force along its tangential velocity to change it’s linear velocity. Where do you suppose that force comes from?
****************
“[GR]Every point is moving along concentric circles
No. The center of the moon is moving along an ellipse, not a circle.
***
I proved it for both a circular and an elliptic orbit, I guess you were absent on those occasions.
Come on, Gordo.
You still have to find where Newton says what you say. In contrast, you were told at least a hundred times that he hold that the Moon orbited as it spun.
Little Willy, please stop trolling.
It is amazing to see that some commentators see heavy US snowfall as a sign of global cooling and sometimes even predict an impending Grand Solar Minimum.
In Europe, meanwhile, the winters in Germany are becoming milder from year to year, Spain and southern France are suffering from increasing drought and it is snowing less and less in the Alps.
*
We will see in one month how far away NOAA’s ‘global cooling’ predictions for North America
https://www.cpc.ncep.noaa.gov/products/CFSv2/imagesInd3/usT2mMonInd1.gif
and for Europe
https://www.cpc.ncep.noaa.gov/products/CFSv2/imagesInd3/euT2mMonInd1.gif
will have been from reality.
binny…”In Europe, meanwhile, the winters in Germany are becoming milder from year to year…”
***
You mean they ***were*** getting warmer, albeit a tenth of a degree or so. This sudden cooling is enough to set records for low temperatures in some regions, a fact that flies in the face of global warming rhetoric.
People are freezing to death in Buffalo, New York. Some are caught out in a storm without adequate means of staying alive till rescued. Other’s have frozen to death in their homes because power was lost.
Why are we continuing down the road to destruction by even considering eliminating fossil fuels? It is sheer lunacy.
It’s true that the cold air is coming from the Arctic but it was predicted long ago that the Arctic Ocean should be ice-free by now. Idiots who spread such propaganda should be in jail. It is not possible for the Arctic to be ice free year round due to the simple fact their is little or no solar input for most of the year.
Russian sausage magnate Pavel Antov, a lawmaker who criticized the war on Ukraine this summer, is the latest victim of Tall Building Syndrome a.k.a. Terminal Velocity Poisoning.
Antov mysteriously died after falling from the third floor of a luxury hotel in the southern district of India’s Rayagada on Saturday, while traveling for his birthday.
The abrupt death came just two days after Antov’s 65th birthday, the same day his friend Vladimir Budanov was also found dead at the hotel following a sudden heart attack on the trip.
Antov, who founded the Vladimir Standard meat processing plant, topped Forbes Russia’s list of the 100 richest civil servants in Russia in 2018. He netted about $156.3 million in annual income, more than double the next highest earner.
At least 12 Russian elites have mysteriously died by suicide or under unexplained circumstances amid escalating geopolitical tensions between Russia and Ukraine this year.
Amazing “coincidences”.
And, there were two more last weekend.
The “results” of a failed coup plot, perhaps? Or, is Putin getting paranoid?
There is a strong mafia movement in Russia. How do we know this is the work of Putin and not gangsters who might want him in power?
I have no proof of this, but it strikes me that Putin has learned to balance both sides of the equation. He leaves the gangsters relatively alone and they reciprocate by leaving him alone. That is, provided they don’t cross a line and stick to their own business.
I base that on the fact that Gorbachev endorsed Putin. He claimed Putin could have followed the old ways of the KGB but he chose to follow a more democratic approach.
We know nothing about Putin because the western media won’t tell the truth about him. From my perspective, he is an enigma. Since he has a finger on the trigger that could eliminate us here in the West I am inclined to give him benefit of the doubt. It is equally obvious that leaders in the West are totally ignorant about that prospect.
Part 2.
https://youtu.be/cer5_0Dr06A?t=400
Carl Sagan joins a panel to testify in Congress on climate change and the greenhouse effect.
DECEMBER 10, 1985
I’d like to stress that the greenhouse effect makes life on Earth possible. If there were not a greenhouse effect the temperature would, as I say, be 30 Centigrade degrees or so colder and that’s well below the freezing point of water everywhere on the planet; the oceans would be solid after a while. A little greenhouse effect is a good thing, but there is a delicate balance of these invisible gases and too much or too little greenhouse effect can mean too high or too low a temperature. And here we are, pouring enormous quantities of CO2 and these other gases into the atmosphere, every year, with hardly any concern about its long-term and global consequences.
Now, certainly not all aspects of how increased CO2 and other gases into the atmosphere affect the climate are known. There are still many uncertainties although the overall picture is, I think, quite clear and quite widely understood and accepted.
Yes TM, we know Sagan got it wrong. He got a lot of things wrong. Why rub his nose in it? He’s been dead for over 25 years!
Why do you hate science?
Why are you an anonymous troll?
For the same reason you are, obviously.
You may be experiencing one of these conditions, bibliophobia, ergophobia, numerophobia, or technophobia.
Swanson, take your anonymous troll and see if you can find some science. Otherwise, you’re just worthless trolls, with NOTHING.
Which is it? Bibliophobia?
Sagan was truly an idiot. When people disagreed with him on a TV debate, or other, he’d resort to ad hominem attacks in an effort to belittle his opponents. Whereas we can get away with that at the blog level, for a so-called eminent scientist to try embarrassing a colleague at the national level is unforgivable.
You can take Sagan’s views on the GHE with a pinch of salt.
The ‘Spinner view’
https://svs.gsfc.nasa.gov/4709
“An enduring myth about the Moon is that it doesn’t rotate. While it’s true that the Moon keeps the same face to us, this only happens because the Moon rotates at the same rate as its orbital motion, a special case of tidal locking called synchronous rotation. The animation shows both the orbit and the rotation of the Moon. The yellow circle with the arrow and radial line have been added to make the rotation more apparent. The arrow indicates the direction of rotation. The radial line points to the center of the visible disk of the Moon at 0N 0E.”
rlh…it surprises me that someone like you, with a master’s degree, cannot think for himself. You can’t even discuss a ball on a string with any logic, you resort to being a parrot, mindless repeating ‘a ball on a string has nothing to do with the Moon’s orbit’. When the reasoning is explained to you, you immediately resort to your mantra.
You are the idiot. Not me.
P.S. Anything with a rigid connection has nothing to do with gravity.
Its like a car on a three lane highway with a yahoo (lets call him Clint) passing on the left moving into the center lane in front of you then moving into the right lane where Clint slows down while you pass then Clint moves into the center lane behind you and repeats the cycle.
At no point is Clint going in reverse; he’s not driving in a circle around your (coal powered) car.
Ball on String has nothing to do with moon orbit. Moon does not make a circle around the earth. Its weaving inside and outside earth orbit around the sun.
You’ll notice Clint’s car is always facing the same direction; it is not orbiting on its axis.
So change the road to an icy road where the idiot (Clint) passes too fast on the left and spins out so that his passenger door always faces your car. The right side of the car is not facing the right side of the road (the point of reference aka the sun) so the car is rotating about its axis with respect to the only point of reference that matters.
Thanks for another ridiculous excursion into your make-believe “science”, Ken.
The passing car would show differing sides to the car it was passing.
Most people wouldn’t believe you could be so braindead, so thanks for the ongoing evidence.
All people commenting on this issue, regardless of whether they are "Spinner" or "Non-Spinner", should be at the point where they realise the term "synchronous rotation" is a misnomer. It implies two rotations happening synchronously, after all, and that cannot possibly be motion like the MOTL.
All people commenting on this issue, regardless of whether they are “Spinner” or “Non-Spinner”, should be at the point where they realise the term “synchronous rotation” concisely describes tidally locked satellites.
There is an orbital motion (in an ellipse, so it is NOT a ‘rotation’). This orbit varies in angular velocity — highest omega at perigee/perihelion, and lowest omega at apogee/aphelion. For our moon, the average omega is 360 degrees/27.3 days = 13.19 degrees per day. But sometimes it is faster and sometimes it is slower than 13.19 deg/day.
There is a spin about the moon’s axis (ie an actual rotation, with the surface of the moon moving in an actual circle around the axis). This motion is at a constant angular velocity of 13.19 deg/day. These are two separate motions, since they have different angular velocities.
The cool thing here is that tidal torques can change the angular velocity of a satellite. The satellite will tend to match its angular velocity about it axis to the average angular velocity of the satellite around central object. The two angular velocities become — hmmm what would be a good word? — synchronized.
[Even if someone were to object to the terminology here, there is still the indisputable fact that the moon moves in its orbit at changing angular velocity, and the stars move across the sky with constant angular velocity. There are two different motions. The ONLY time it could be described as ‘one motion’ is in the idealization of of perfectly circular orbit, which might describe cartoon animations, but does not describe actual moons.]
Even “no credibility” Tim, as a “Spinner”, concedes that “synchronous rotation” is a misnomer.
tim…”the term synchronous rotation concisely describes tidally locked satellites”.
***
A satellite remains in orbit only because its tangential velocity is enough to offset the vertical displacement over 8000 metres. It has nothing to do with tidal locking or any other fictitious force.
8000 metres is the magic number because the curvature of the Earth falls off under the satellite at a ratio of 5 metres per 8000 metres. If an orbiting body can maintain such a tangential velocity that the curvature of the Earth is respected, gravity will do the rest.
[DREMT] …the term "synchronous rotation" is a misnomer. It implies two rotations happening synchronously, after all, and that cannot possibly be motion like the MOTL.
[TIM] There is an orbital motion (in an ellipse, so it is NOT a ‘rotation’).
[DREMT] See? Even "Spinners" agree that "synchronous rotation" is a misnomer.
Fraudkerts, gravity can NOT produce a torque on Moon.
Your fraud fails again.
C’mon C00ky, a see-saw is a perfect example of how gravity can produce torque.
WRONG braindead Brandon. A see-saw is NOT separated from Earth by a vacuum. A see-saw in space orbit would not be affected by different weights. One side could have 100 times the mass of the other side, yet the see-saw would not tilt.
You don’t understand ANY of this, and you can’t learn. You’re braindead.
> A see-saw is NOT separated from Earth by a vacuum.
This has to be one of the funniest things ever written on the Interwebz, C00ky. Thanks ever so much.
“There is an orbital motion (in an ellipse, so it is NOT a rotation)”
[DREMT] See? Even “Spinners” agree that “synchronous rotation” is a misnomer.
DREMT shamelessly takes Tims quote out of context, and leaves out these parts:
“There is a spin about the moons axis (ie an actual rotation”
and
“hmmm what would be a good word? synchronized.”
to then blatantly lie and claim:
[DREMT] See? Even “Spinners” agree that “synchronous rotation” is a misnomer.”
Is DREMT a lying loser troll?
What say you readers?
As readers will no doubt understand, Tim does not see “orbital motion” as being a “rotation”, and so logically must agree (despite what he says) that “synchronous rotation”, which implies two rotations (not just motions) occurring synchronously, is a misnomer.
And yet you still shamelessly lied about what Tim stated.
‘In the case where a tidally locked body possesses synchronous rotation, the object takes just as long to rotate around its own axis as it does to revolve around its partner. For example, the same side of the Moon always faces the Earth, although there is some variability because the Moon’s orbit is not perfectly circular.’
Trolls keep insisting that Astronomy gets a lot about the Moon wrong.
But offer no evidence.
As readers will no doubt understand, Tim does not see “orbital motion” as being a “rotation”, and so logically must agree (despite what he says) that “synchronous rotation”, which implies two rotations (not just motions) occurring synchronously, is a misnomer.
The Moon has rotation which is synchronous with its orbit. The word orbit is left out for simplicity. since BY DEFAULT all planets and Moon’s are in orbit.
Some people are hyper focused on semantics, at the expense of the truth, what the Moon is actually doing.
‘Alternative names for the tidal locking process are gravitational locking,[2] captured rotation, and spinorbit locking.
…readers will no doubt understand, Tim does not see “orbital motion” as being a “rotation”, and so logically must agree (despite what he says) that “synchronous rotation”, which implies two rotations (not just motions) occurring synchronously, is a misnomer.
Again, you lied and misrepresented what Tim was saying, and what I was saying, and people can clearly see that you did that.
And people understand that is what trolls do when they are desperate and losing the argument on the facts.
But we will award you the ‘win’ at last wording as a consolation prize.
Now have the last word and then go troll elsewhere.
Readers will no doubt be aware that despite frequent (make that relentless) false accusations, no commenter here has ever proved that I’ve lied. Logic and the meaning of words dictates that Tim agrees "synchronous rotation" is a misnomer. As should every "Spinner", and of course, every "Non-Spinner".
Now, Tim can say "the term "synchronous rotation" concisely describes tidally locked satellites", but he’s contradicted by the fact that he doesn’t think an orbit is a rotation. If he did, then he would at least be justified in thinking what he wrote there, even though the motion of two rotations occurring synchronously could not possibly resemble motion like the MOTL. So, he’d still be wrong (in a different way), but at least he’d be justified in using the term.
Readers will observe that Gaslighting Graham gently gaslights a little more by confusing *is a rotation* with *is only a rotation*. Tim rejects the plausibility of explaining an orbit as a mere rotation. Synchronous rotation involves an orbit and a spin, both of which involves complex motions.
And even Gaslighting Graham admits that a complex motion *is* a mix of rotations and translations. Which means that he is gaslighting once again.
Little Willy, please stop trolling.
It is exactly that. 3 motions. 2 rotations about an axis, one each for the Earth and the Moon, and an orbit around a barycenter.
“Synchronous rotation” is a misnomer.
Its quite apt. Two motions in synchrony.
“Synchronous rotation” is a misnomer.
So you don’t disagree that the word ‘synchronous’ is apt?
“Synchronous rotation” is a misnomer. “Spinners” and “Non-Spinners” will think it is a misnomer for different reasons, but both groups should agree it is a misnomer, all the same.
Astronomers are spinners, have coined this term, and have no problem with it.
Another DREMT feeling is wrong and pointless. Oh well.
“Spinners” and “Non-Spinners” will think it is a misnomer for different reasons, but both groups should agree it is a misnomer, all the same.
SHOUDING
“The cognitive distortion of making statements of what should be true, as opposed to reality.”
…will think it is a misnomer for different reasons, but both groups should agree it is a misnomer, all the same.
LAST WORDING
The cognitive distortion that have the last word, no matter how repetitious, equals winning the argument.
rlh…by continuing to babble about rotation about a barycentre you reveal yourself to be the idiot here.
Someone thinks astronomers and physicists ‘should agree’ with their beliefs, but they don’t. And they have sound reasons not to.
Most people would leave it there.
“All people commenting on this issue, regardless of whether they are "Spinner" or "Non-Spinner", should be at the point where they realise the term "synchronous rotation" is a misnomer. It implies two rotations happening synchronously, after all, and that cannot possibly be motion like the MOTL.”
Some people will never get it, of course.
Gee this post seems familiar…
Yet more cognitive dissonance at work!
…some people will never get it, of course.
When Gordon confronted NASA about this nonsense, their only defense was that Moon was “rotating relative to the fixed stars”! So, when confronted, they try to “blend into the scenery”.
That’s why Bin’s link is so useful. It clearly implies axial rotation.
Too bad the producers of that video won’t come on here to answer questions.
But notice the orbit in the video is almost a perfect circle. In fact, the entire graphic is similar to a ball-on-a-string. Maybe the cult will have to accept the ball-on-a-string, since Cult HQ promotes it….
That’s why this is so much fun.
Tell us about the simple orange/string demonstration? Or is that a little too high-tech for some?
“Orange/string demonstration”??
At least that now tells me who you are. No one could be that stupid, except Ken!
Our braindead cult idiot posing as an anonymous troll, “Ken”, has now morphed into “Refutation of False Science”.
Only, he’s not refuting his cult’s false science.
NASA should be embarrassed to hide behind such chicanery.
They have included a radial line and they hide the intended revelation by including the lighting of the lunar surface by the Sun. Since that lighting changes orientation as the Moon orbits it suggests the Moon itself is rotating on a local axis.
When NASA has to resort to such deceit they have truly lost their basis in science.
Gordo wrote more trash:
Perhaps Gordo should look at that radial line a little closer. The line does not always point to the center of the Earth (or the barycenter), but swings slightly from one side of the actual connecting line to the other. That’s because the Moon rotates at a constant rate of once an orbit. It also proves that there is no external axis about which the Moon rotates.
” When Gordon confronted NASA about this nonsense, their only defense was that Moon was ‘rotating relative to the fixed stars’ ! ”
Never do I believe that NASA did ever write a nonsense like that, because – as I explained often enough – nothing rotates ‘relative to the fixed stars’.
This is the typical nonsense written by the so-called ‘non-spinners’: until today, and despite having been explained that so many times, all of them still don’t understand that fixed points in space are used to calculate the exact period of motions, but have no bearing on the motions themselves.
Where is Robertson’s original mail correspondence with NASA?
I want to see an unmanipulatable version of it.
It’s some “Spinners” who erroneously believe that reference frames resolve the moon issue, not the “Non-Spinners”.
Now Bin is walking away from his “fixed stars”.
That means he’s got less than NOTHING….
1. No one is talking here about reference frames. Don’t try to manipulate the discussion, Pseudomod.
The comment above is about ‘with respect to the fixed stars’, a concept still not understood by the so-called ‘non-spinner’s.
*
2. ” Now Bin is walking away from his ‘fixed stars’… ”
Where do I ‘walk away’ from what, troll Clint R?
Show us that!
Your own words, Braindeadidon: “…as I explained often enough — nothing rotates ‘relative to the fixed stars’.
Enjoying eating them.
I was just stating a fact, Bindidon. As usual, you falsely accuse me of manipulating the discussion.
No, Pseudomod, you weren’t ‘just stating a fact’.
You did it in a very specific context that makes manipulation obvious.
No manipulation, and yes it was a fact.
Clint R – the ignoramus par excellence – is all the time so busy with misrepresenting and insulting that he lacks the time to read and really understand.
For the (hopefully) last time I thus repeat:
No celestial body is ‘rotating relative to the fixed stars’.
No celestial body is ‘orbiting relative to the fixed stars’.
Because sentences like these two don’t make sense: they would make us think that celestial bodies rotating/orbiting relative to the fixed stars might not do so if observed relative to something else.
But celestial bodies orbit and rotate independently of how they are observed.
*
What makes sense is:
The motion P-E-R-I-O-D-S of celestial bodies are observed or computed ‘relative to the fixed stars’ (in fact, one star is enough, of course): in order to keep the observed / computed periods independent of the motion of the celestial body on which the observer stays.
I think that the so-called ‘non-spinner’s will never accept that fact, even if they understand it.
“But celestial bodies orbit and rotate independently of how they are observed.”
…as “Non-Spinners” would agree, but some “Spinners” would avidly disagree.
Bindidon, instead of your constant babbling and trolling, why not attempt some science? Where’s your viable model of “orbital motion without axial rotation”.
You don’t have one. That’s why you must babble and troll constantly.
I wrote
” But celestial bodies orbit and rotate independently of how they are observed. ”
Your reply [1]
” … as ‘Non-Spinners’ would agree… ”
‘Non-spinner’s agreeing? Oh! Really??
Until now, I read from your corner only nonsense, written for example numerous times by Clint R:
https://www.drroyspencer.com/2021/01/canada-is-warming-at-only-1-2-the-rate-of-climate-model-simulations/#comment-601877
Do you need more links to such idiocy, Pseudomod? No problem!
*
Your reply [2]
” … but some ‘Spinners’ would avidly disagree. ”
If you don’t want to be accused again of manipulating, if not lying, show me some (really valuable) sources of your allegation.
If you are going to pretend you have never seen a “Spinner” arguing that the moon rotates on its own axis wrt the fixed stars, but does not rotate on its own axis wrt Earth, then I have no reason to take you seriously, Bindidon.
tim…”Sure, words like rotate, circle, spin, orbit, revolve, and twirl overlap in varying degrees in varying contexts. But you cant just take any two meanings that overlap in two different settings and claim they are the same in other contexts”.
***
You are atill talking rhetoric, theoretical bs substituting for scientific fact.
We are talking about the Moon, whether or not it rotates on a local axis. There is no need to define such a situation because it is totally apparent. With a uniform rigid body like the Moon, rotating on an axis means having momentum about that local axis.
I have proved over and over that such a momentum is not possible for the Moon since all parts of the Moon are moving in parallel lines of motion during the orbit. That should be blatantly obvious to you since the near side face always points at Earth. A moment’s reflection reveals that means the far side is moving in parallel, therefore the COM is also moving in parallel, and all points in between.
That’s a QED Tim, despite belly aching from the peanut gallery.
Yes, Gordo, the Moon’s motion appears as though it were rotating around an external axis, but only for an instant. The next instant in the orbit, the apparent rotation is around a different axis. That’s because the Moon is orbiting in an elliptical trajectory, not a circular one. No one in the “NO SPIN” cult, including Gordo, can prove that there is a fixed external axis. HERE’s a visualization which demonstrates their fundamental problem.
Yet again, we see that Gordo doesn’t know what he’s talking about.
swannie…tries to be clever and shows an animation of a body moving on an ellipse without a planet at its major focal point. Swannie reveals himself as a total idiot through trying to be clever when he lacks the ability.
Swannie has joined the idiotic world of rlh where the Moon and Earth rotate about a barycentre. No on has ever measured such a motion but rlh persists with his idiocy.
Come on, Gordo.
To speak of barycenter is a good for two reasons.
First, it reminds Moon Dragon cranks that it is a physics problem.
Second, it also remind them that the Moon is in 3D.
You do not deny these points, do you?
“rotating on an axis means having momentum about that local axis.”
And the moon does have constant spin angular velocity and constant spin angular momentum about its own axis. L = I(omega), where (omega) = 13.19 deg/day.
There is also constant orbital angular momentum, L = r x p. Newton showed that. This is due to the simple fact that gravity pulls straight inward, and applies no torque during the orbit.
Together there is constant total angular momentum.
“the near side face always points at Earth.”
Only approximately. The more elliptical the orbit, the worse this approximation. The point closest to the earth at perigee is NOT closest to the earth the rest of the orbit (other than again at apogee). The rest of the time, that closest point (and the farthest point) are not moving ‘parallel’ and your entire argument falls apart.
———–
The short answer is that 400 years of physicists — smarter than you or me — have all concluded that the moon rotates on its axis. Your hand-waving ‘parallel’ motion not going to convince anyone that all of physics is wrong.
tim…”…the moon does have constant spin angular velocity and constant spin angular momentum about its own axis. L = I(omega), where (omega) = 13.19 deg/day”.
***
Tim…before you make a complete ass of yourself, the 13.19 degrees per day the Moon moves, is the number of degrees a radial line tracking it would move per day. Absolutely nothing to do with local rotation of a radial line within the Moon, which doesn’t move at all.
And, btw, there is not angular momentum related to the Moon either local with an internal axis, or externally in an orbit. The Moon has only a linear momentum at all times.
“the 13.19 degrees per day the Moon moves, is the number of degrees a radial line tracking it would move per day”
No! I explained this already.
That radial line moves an AVERAGE of 13.19 degrees per day. The number is higher at perigee and lower at apogee.
But 13.19 deg/day is the actual rate that the moon turns on its axis each day. The 13.19 degrees per day the Moon moves is the number of degrees a radial line tracking A STAR IN THE LUNAR SKY would move per day, as viewed by an astronaut on the surface of the moon.
“And, btw, there is not angular momentum related to the Moon either local with an internal axis, or externally in an orbit. The Moon has only a linear momentum at all times.”
No. If you accept the standard definitions of ‘angular momentum’ (L = I(omega) for a rotating solid; L = r x p for a moving particle) then the moon does have angular momentum. Period. If you don’t accept the standard definitions of ‘angular momentum’ then you need to come up with a new name for whatever it is you are talking about!
Tim, here’s a "standard definition" of "angular momentum":
"In physics, angular momentum is the rotational analog of linear momentum".
So it seems the existence of the concept of "orbital angular momentum" is further evidence that "revolution/orbit" is a rotation about an external axis. If an "orbit" is not a rotation, how is there such a thing as "orbital angular momentum"?
Using gravity (which is required for orbits) there is no such thing as an ‘external axis.
…and yet, the point remains:
If an "orbit" is not a rotation, how is there such a thing as "orbital angular momentum"?
Perhaps one day Gaslighting Graham will realize that *is a rotation* and *is only a rotation* are two different predicates.
If an "orbit" is not a rotation, how is there such a thing as "orbital angular momentum"?
“If an “orbit” is not a rotation, how is there such a thing as “orbital angular momentum”?”
Well, because of how angular momentum is defined. There does not need to be any ‘rotation’ per se for there to be angular momentum.
L = r x p
Define an axis. Measure the distance to a particle from that origin. Measure the momentum of the particle relative to that axis. Measure the angle between the two vectors. Calculate the cross product. That is the angular momentum for that particle
For example, an object moving at constant speed in a straight line has a constant angular momentum about any axis.
If you don’t like that definition, then speak to the 100’s of authors of physics and engineering texts who use that definition.
Tim, here’s a "standard definition" of "angular momentum":
"In physics, angular momentum is the rotational analog of linear momentum".
If “orbit without spin” is translational motion, then there should be no such thing as orbital angular momentum.
Or are you now going to say translation is rotational, or something equally ridiculous?
Tim,
Perhaps this tool could help:
https://demonstrations.wolfram.com/RotationWithZeroAngularMomentumTheSquareCat/
…prove Tim wrong.
There is nothing “magical” about being able to describe a motion in multiple ways simultaneously. – Mighty Tim
…and I agree with him, however that doesn’t get him out of his logical bind over agreeing that the MOTL can be described as "one motion" but then not agreeing that it can be described as "not rotating on its own internal axis".
Tim, heres a “standard definition” of “angular momentum”:
“In physics, angular momentum is the rotational analog of linear momentum”.’
Hilarious..DREMT tries to mansplain physics to a physicist.
Tim gave you the standard definition. It was an equation!
Stalkers are gonna stalk. What can you do?
Ignorant trolls gonna man-splain. Its what they do.
And it is most deserving of ridicule.
“Well, because of how angular momentum is defined. There does not need to be any ‘rotation’ per se for there to be angular momentum.
L = r x p
Define an axis…”
Tim falls at the first hurdle. An axis only exists if there is rotation. So you can’t say “there does not need to be any rotation per se for there to be angular momentum” and then in your very next breath say “define an axis”, which immediately means rotation!
“Tim falls at the first hurdle. An axis only exists if there is rotation. So you cant say ‘there does not need to be any rotation per se for there to be angular momentum’ and then in your very next breath say ‘define an axis’, which immediately means rotation!”
Losing an argument causes some people to become excessively pedantic.
For angular momentum to be quantified requires a point in space to be referenced.
Though there does not need to be ANY rotation around that point to have angular momentum wrt it, that angular momentum could be CONVERTED INTO ROTATION around that point, and determined using Conservation of Angular Momentum.
Such as in this example.
“Consider a child who runs tangential to the edge of a playground merry‐go‐round with a velocity vo and jumps on while the merry‐go‐round is at rest. Treat the child’s mass as a point of mass and the merry‐go‐round as a disc with a radius R and mass M. From the conservation law, the total angular momentum of the child before the interaction is equal to the total angular momentum of the child and merry‐go‐round after the collision: mrvo = mrv′ + Iω, where r is the radial distance from the center of the merry‐go‐round to the place where the child hits. If the child jumps on the edge, (r = R) and the angular velocity for the child after the collision can be substituted for the linear velocity, mRv o = mR( Rω)+(1/2) MR 2. If the values for the masses and the initial velocity of the child are given, the final velocity of the child and merry‐go‐round can be calculated.”
Oh well..
No response from Tim, so far. I’ll wait.
When DREMT thinks he has answers, he responds to my posts, as he did above.
But when he has NO sensible answers to my debunking of his nonsense, he pretends that no one has posted.
It is his go-to troll tactic. And everyone is aware of it.
Readers will note that I responded to Tim, and await a response from him still…
Tim was correct about angular momentum not requiring rotation. DREMT was wrong about angular momentum requiring rotation, and ignores the example with the kid running and jumping on the MGR that makes this clear.
If he is waiting for Tim to change his mind and agree with him he will be waiting a loong time.
Still no response from Tim
Yeah, maybe I should have said
“L = r x p
Define a point. Measure the distance to a particle from that point“. it is common for the point to be on some “axis” in a problem, but that is not necessary.
Otherwise Nate is doing fine. DREMT is nitpicking a word, while ignoring the physics.
A response five days later is absurd, Tim…and I don’t respond to Nate. So if you think he’s doing fine, you’ll have to explain why. I try not to even register his comments, as much as possible. Kind of hard when he stalks me so desperately, pathetically, and obsessively.
Is angular momentum the rotational analog of linear momentum, or not?
“Is angular momentum the rotational analog of linear momentum, or not?”
Sure. But that is a DESCRIPTION, not a DEFINITION.
I can’t make a good table here but it is easy to find many analogs between linear and angular quantities:
d vs theta
v vs omega = v/r
a vs alpha = a/r
F vs Torque = rxR
m vs I = mr^2
p vs L = I(omega)
There is always a simple analogy between the two related to a distance (radius), r. Just write the other letters. For example d = vt becomes (theta)= (omega)t. Kinetic energy is 1/2 mv^2 or 1/2 I(omega)^2.
For a particle translating in circle, the angular momentum is I(omega).
But this is freshman physics. IF you don’t know what the angular quantities and equations are, you are out of your depth. If you can’t calculate the angular momentum of a simple particle in a simple circle, what are you even doing here?
"Sure."
Then there you have it. Thanks, Tim.
define an axis, which immediately means rotation!”
No. when I define the x-axis to be toward the right and the y-axis to be upward, that says absolutely nothing about rotation.
Sneaky, Tim. Very sneaky. That’s what you do best!
There is also an “axis of symmetry”. Again no rotation. You are the one “sneakily” trying to force a word to be something it is not.
And further, “axis” is merely a convenient word here, not a necessity. Angular momentum is r x p. Period. As long as you have a reference point from which to determine r & p, you can find the angular momentum.
Choose a point on the floor for the reference. Have an object move horizontally in a straight line above the floor.
Is there an “r”? Yes.
Is there a “p”? yes.
Is there an “L”? yes
But is there ‘rotation’? no. and it is not needed.
You meant axis of rotation, Tim. Stop trying to pretend otherwise.
Fraudkerts claims: “The short answer is that 400 years of physicists — smarter than you or me — have all concluded that the moon rotates on its axis.”
Fraudkerts, would those “physicists” also be frauds? We have a lot of people here that claim to be “physicists”, but are only faking it. You know, frauds that claim fluxes simply add, or a vacuum tube is “proof” of the GHE, or Sun can heat Earth to 800,000K! You know the type.
REAL physicists know that something that is not rotating is NOT rotating.
Exactly, Pup.
And REAL physicists know that the Moon spins because it SPINS.
Real physicists know how to make measurements and perform mathematical calculations describing the the dynamics of the Moon and other bodies moving in a gravitational field. Very important stuff when one intends to land on the Moon.
The No-Spin Cultist doesn’t do the math and have no clue why it’s necessary to do so.
Look at this! Pup and Pup Jr. appearing together, for one-night only! I wonder if they’re dressed alike? Maybe with the same colored ribbons in their hair. So cute….
And Swanson believes Moon landings can’t occur if Moon is not rotating, or some such convoluted “thinking”? Like Bindidon, he must believe measurements of orbital motion mean something is also rotating. Who knows?
Something that isn’t happening isn’t going to affect ANYTHING.
Little Willy, Swanson, please stop trolling.
“would those “physicists” also be frauds? ”
Sure. Believe that. Believe that there is a 400 year conspiracy. Believe that all the technical advances that use standard physics were dumb luck. Believe than engineers use some ‘secret science’ that is hidden from physicists when they design centrifuges and furnaces. Believe that conservation of energy and conservation of angular momentum doesn’t apply to the moon.
You should take a year of physics. It would do you a world of good! Then you might be able to understand the errors in each of the incorrect claims you made.
Sorry, Tim, but your credibility has been shot to bits. Until you can admit your error, you don’t get to be taken seriously any more.
DREMT, If you don’t want to take physics seriously, I can’t really do anything about that.
You do not represent physics, Tim. Your arrogance is off the charts. Especially considering your simple, fundamental mistake about rotation, that you cannot even admit to.
You agree that a movement like the MOTL can be described as "one motion". Yet you won’t accept that this means the MOTL can be described as not rotating about an internal axis! Your mistake is such an obvious blunder that it’s a wonder you can even continue commenting. You should be too embarrassed to.
“You agree that a movement like the MOTL can be described as ‘one motion'”
MOTL is 2 motions, not one. A rotation about an axis of the Moon and an orbit around the Earth.
…and yet, Tim has agreed that it can be described as “one motion”. Somehow he doesn’t get that this necessarily means it can be described as not rotating on its own axis. What a complete idiot.
Fraudkerts, you don’t get to make up your own personal physics.
Sorry.
(Got a job yet?)
DREMT. Everybody has agreed that it is 2 motions. A rotation and an orbit.
That’s completely WRONG, RLH.
And, please stop trolling.
“The MOTL has its axis exactly aligned with the circular motion around earth — straight up out of the page. This allows this cartoon moon’s movement to be considered “one motion” – a simple rotation around the cartoon earth.”
– Tim Folkerts
If Gaslihting Graham cannot take physics seriously, there is nothing Tim can do about that.
– Pace Tim Folkerts
Yes, Tim apparently believes he is physics.
“You agree that a movement like the MOTL can be described as “one motion”. Yet you wont accept that this means the MOTL can be described as not rotating about an internal axis!”
1) The idealized “MOTL” can be described as ‘one motion’ when we are looking at a mathematically ideal circular orbit. This mean we do not need to include any ADDITIONAL rotation about the internal axis. But by any standard definition of “axis” and “rotate”, the MOTL is rotating about its own axis. Only when you measure relative to the rotating frame is there no rotation about the internal axis.
[Measuring from the rotating frame is a possible way of doing things, but not the only way. Or even the best way.]
2) For any real moon in any real elliptical orbit, a movement like the “MOTL” does not describe the motion. You NEED two motions – one with varying angular speed about the external axis to describe the orbital position, and one with constant angular velocity about the internal axis to describe the orientation of the moon.
Since “one motion” only works for the impossibly ideal case of a perfectly circular motion, and “two motions” works for that case AND all other actual orbits, the “two motion” description is better.
Tim, you just made the exact same mistake again. You agreed that movement like the MOTL can be described as “one motion”, and then immediately refused to accept that this meant the MOTL can be described as not rotating on its own axis! You’re hilarious.
DREMT, you continue to misunderstand the meaning of “rotating about an axis”.
It might help move the conversations forward if you could define what you mean by “rotation about an axis”.
Tim, it might move the discussion forward if you just stopped being so ridiculous. You have agreed that movement like the MOTL can be described as “one motion”. So, unless you are saying that the MOTL stays fixed in one spot whilst rotating on its own axis, and that is the “one motion”, then you logically must agree that the MOTL can be described as not rotating on its own axis.
I have logically explained what rotation means (in agreement with how rotation is defined mathematically). If a point is rotating about an axis, it must
1) maintain a constant distance from that axis
2) change orientation relative to that axis
The MOTL satisfies those two criteria relative to BOTH the external axis through the earth AND the internal axis through the center of the moon.
So your “one motion” magically becomes two motions! You’re a hoot, Tim. You are completely unable to comprehend even the most basic logic.
“So your “one motion” magically becomes two motions! ”
Motion along a diagonal could be considered “one motion” – a single velocity along the diagonal. Or it could be considered the sum of “two motions” – the vector sun of two velocities along the two axes.
There is nothing ‘magical’ about being able to describe a motion in multiple ways simultaneously.
There is nothing ‘magical’ about rotating simultaneously about two axes.
Something can indeed rotate simultaneously about two axes, Tim. Like the MOTR, for instance…but for the MOTL, you have agreed that it can be described as having only “one motion”. So, when you think of that “one motion”, what motion are you thinking of? Apparently, a “simple rotation”. That can only mean, a rotation about an external axis, presumably…and since it is just one motion, that means a “rotation about an external axis with no rotation about an internal axis”.
If you meant “a rotation about an external axis with a rotation about an internal axis”, then that would be two motions, not one motion. You said “one motion”, Tim.
There is nothing “magical” about being able to describe a motion in multiple ways simultaneously. – Tim Folkerts
Two motions are more than “one motion”.
In the Moon Dragon cranks universe, one half-turn plus another half-turn cannot equal a full turn.
Little Willy bashes another straw man, without shame.
A half-turn is one motion. A full turn is another motion. Two half-turns equal one full turn.
So two motions can indeed be *equivalent* to one.
Gaslighting Graham rejects a *direct* refutation of his point.
So of course he whines about strawman, another concept from fallacy theory he keeps misrepresenting.
Tim is happy to acknowledge that the movement of the MOTL can be described as "one motion". Yet, somehow, he refuses to acknowledge that this necessarily means the MOTL can be described as not rotating on its own axis.
You can continue to defend the indefensible if you like, but I already know that you agree the MOTL can be described as not rotating on its own axis, so I have no idea why you would try to support Tim on this. Other than to troll me.
Let’s repeat again the sage wisdom of Tim the Mighty:
…and I agree with him, however that doesn’t get him out of his logical bind over agreeing that the MOTL can be described as "one motion" but then not agreeing that it can be described as "not rotating on its own internal axis".
“that means a “rotation about an external axis with no rotation about an internal axis”.”
I am sure I will be misunderstood again, but what I mean is “a rotation about an external axis with no ADDITIONAL rotation about an internal axis”.
And again, what I mean by “rotation about an axis” (whether internal or external) is
* choose a point (say a particular pixel on the MOTL)
* draw a vector from your chosen axis (for example, the center of the earth, or the center of the moon)
* if that vector keeps a constant length, but changes orientation, then there was a rotation of the point about the axis.
—————————
And yet again, all of this only applies to hypothetical circular orbits. With an elliptical orbit you CANNOT describe it as a ‘single rotation about an external axis, but you CAN describe it as a translation (of a point about an ellipse) and a rotation (about that moving point).
The MOTL is a perfect mathematical circle; no real moon is a perfect mathematical circle.
https://www.drroyspencer.com/2022/12/uah-global-temperature-update-for-november-2022-0-17-deg-c/#comment-1421719
DREMT FINALLY gets a response from Tim, what he has been asking for.
And promptly ignores it.
I guess he didnt want it after all.
Tim, you are refuted here:
https://www.drroyspencer.com/2022/12/uah-global-temperature-update-for-november-2022-0-17-deg-c/#comment-1421719
I will assume you agree that acknowledging the movement of the MOTL can be described as “one motion”, a “simple rotation”, is logically the same thing as acknowledging that “rotation about an external axis with no rotation about an internal axis” is motion as per the MOTL.
Well, given that what Tim says
“* draw a vector from your chosen axis (for example, the center of the earth, or the center of the moon)
* if that vector keeps a constant length, but changes orientation, then there was a rotation of the point about the axis.
So lets see:
A vector drawn from the outside edge of the MOTL to its COM will indeed keep a constant length and will indeed change orientation. It is an internal rotation about the COM.
This is verifiably TRUE.
So DREMTs logic,
“a ‘simple rotation’, is logically the same thing as acknowledging that ‘rotation about an external axis with no rotation about an internal axis’ is motion as per the MOTL.”
must be flawed.
Rather then just repeating the assertion, he needs to understand why it is flawed.
Tim, just to add:
Rotation about an external axis with rotation about an internal axis is two motions. You said the movement of the MOTL could be described as “one motion”.
Not sure how to make my point any clearer or simpler.
“Rotation about an external axis with rotation about an internal axis is two motions.”
He has clearly stated that the motion is
‘The MOTL is rotation about the external axis with no ADDITIONAL rotation about the internal axis.’
His point was that a rotation need not have a single unique axis.
He showed that a rotation can be measured around the COM axis, but also an axis thru the Earth.
So these are flaws in your logic.
I will try breaking this comment up, as it’s not posting…
"Not sure how to make my point any clearer or simpler."
I’ve thought of a way to make it even clearer and simpler.
There are two separate and independent motions that have always been at the heart of the moon discussion:
1) Orbital motion.
2) Axial rotation (rotation about an internal axis).
You have said that the movement of the MOTL can be described as "one motion". Therefore you concede that the MOTL can be described as not rotating on its own internal axis, but only orbiting (unless you are saying that the MOTL is not orbiting, but is only rotating on its own internal axis – I think we can reject that option!)
So now it’s up to you what kinematics you use to describe the motion "orbiting". It’s kind of irrelevant…you’ve conceded that the MOTL can be described as not rotating on its own axis.
End of story.
https://www.linkedin.com/in/timothy-folkerts-904a4110
Tim Folkerts, PhD is evidently not faking it.
But Clint R?
Solar wind
speed: 456.9 km/sec
density: 9.24 protons/cm3
Sunspot number: 88
The Radio Sun
10.7 cm flux: 160 sfu
Updated 29 Dec 2022
Thermosphere Climate Index
today: 14.85×10^10 W Neutral
Oulu Neutron Counts
Percentages of the Space Age average:
today: -1.2% Below Average
https://www.spaceweather.com/
–BIG FARSIDE SUNSPOTS:You might suppose that the farside of the sun is hidden from view. However, researchers using a technique called “helioseismology” can make crude maps of the sun’s hidden hemisphere. Their latest map reveals multiple farside active regions:
[Image]
The black blobs are probably sunspot groups–big ones. The first of the three will rotate onto the Earthside of the sun this weekend, followed by the other two next week. This could bring an uptick in geoeffective solar activity.–
Good to know we aren’t going spotless anytime soon, but even though we aren’t spacefaring civilization- this reminds me, we aren’t- how hard is it to put a cubesat in Earth/Sun L-4?
I assumed there was number spacecraft which could look at the Sun from different angles- but it could mean would paperwork and could be seen as not part of mission. Lack bandwidth or whatever.
And they have star trackers for nav, but I don’t know why they don’t track our star, the Sun.
–Note that the inability to state that an acceleration is present with certainty using satellite radar altimetry does not imply there is no acceleration at all. Its estimated value in this study is actually in line with the results of the 20th-century tide-gauge-based GMSL reconstruction by Dangendorf et al.17, notably 0.018 0.016 mm yr−2. The uncertainties in the altimetry-derived estimate, however, cause the same acceleration to become statistically equivalent to zero at a 95%-confidence level. It should be stressed that, based on the decadal behavior of GMSL as shown in the same study, we need to be careful with comparing accelerations from records of different length.–
A revised acceleration rate from the altimetry-derived global mean sea level record
Article Open Access Published: 29 July 2019
https://www.nature.com/articles/s41598-019-47340-z
Linked from:
Science Catches Up With WUWT
https://wattsupwiththat.com/2022/12/29/science-catches-up-with-wuwt/
Willis Eschenbach later revises:
[UPDATE] An alert commenter pointed out what I had missed, which was that the article is not new. It was only last weeks media article describing their work that was newtheir study was published before mine. Mea maxima culpa. However, my work uses a totally different method, but comes to the same conclusionscience at its best.]
Anyhow, sea level rising has not accelerated, and it’s about 7″ per century-
just in case someone, missed the correction.
7″ / 10″ is 0.7″ per decade and we go 77 years before the magical time of 2100 AD or .7″ times 7.7 decades = 5.39″
And I don’t think we will get another 5″ rise in sea level by 2100 AD.
I think we have recovered from the Little Age Ice cold period- by which I mean, we won’t continue the 7″ per century rise. But it might be a 3 to 4″ rise, or no measurable rise, but I would not guess it is going to start falling before 2100 AD.
And I don’t think anyone thinks we going to have 39″ rise in sea level by 2100 AD.
I do imagine some warming from higher CO2 level and I do think if we have grand Solar Max, it should affect the weather. Or could cause drier and colder weather but there are a lot factors involved in weather. When talks higher CO2 levels cause some warming, I mean global warming- not weather or global weather. And weather has large immediate effects, and it’s possible given enough time, weather could have effect upon global warming or cooling.
But global climate- and we in a ice house global climate {also called Ice Age] changes over long time period- mostly about a century of time and more.
And it’s mostly about the average temperature of our ocean- which has average temperature of about 3.5 C.
Or I am on board with what NASA and NOAA say, which is more than 90% of global warming is warming our cold ocean.
And it appears to me, that average ocean temperature has been around
3.5 C for thousands of years.
And we should measure it, more accurately so I can say more than about 3.5 C as as little as .1 C cooling or warming has large effect upon global average air temperatures.
gbaikie
I recommend the careful lecture of
Reassessment of 20th century global mean sea level rise
Sönke Dangendorf, Marta Marcos, Guy Wöppelmann and Riccardo Riva
2017
https://www.pnas.org/doi/full/10.1073/pnas.1616007114
*
Having read a lot of reports dealing with PSMSL evaluations and their comparison to sat altimetry, and having compared some of these evaluations, I can tell you that Dangendorf’s work is way more accurate than that of Kleinherenbrink’s and Eschenbach’s.
*
Here is a comparison of such evaluations (made out of the data published by the different sources, together with my own layman job):
https://drive.google.com/file/d/1_s5eKMqX-SlQIx28pTgbF2lTAcPgvIz5/view
*
I still await a comparable evaluation made by people like Kleinherenbrink & alii.
Until then, I prefer to trust Dangendorf, Frederikse, Foster etc.
Five Space Exploration Missions to Look Out for in 2023
https://flaglerlive.com/184629/space-2023/
1 Juice, interesting trajectory
2 SpaceX Starship {obviously}
3 dearMoon [though has lot’s uncertainties in terms happening in 2023]
4 OSIRIS-REx, 1 kg of sample return in Sept 2023
“Asteroid sample return has only been achieved once before, by the Japanese Space Agencys Hayabusa 2 mission in 2020.”
“Bennu is an approximately diamond-shaped world just half a kilometre in size, but has many interesting characteristics.”
“It also has an abundance of precious metals, including gold and platinum. Finally, Bennu is classed as a potentially hazardous object with a (very) small possibility of Earth impact in the next century.”
[That it could hit us, does make it personal matter. It’s rumble pile asteroid.]
5 Skyroot Aerospace, which successfully launched its Vikram-S rocket in November 2022, is soon to become the first private Indian company to launch a satellite.
40-Year Study Finds Mysterious Patterns in Temperatures at Jupiter
https://tallbloke.wordpress.com/2022/12/29/40-year-study-finds-mysterious-patterns-in-temperatures-at-jupiter/#more-60421
“The scientists collected these images at regular intervals over three of Jupiters orbits around the Sun, each of which lasts 12 Earth years.
In the process, they found that Jupiters temperatures rise and fall following definite periods that arent tied to the seasons or any other cycles scientists know about. Because Jupiter has weak seasons the planet is tilted on its axis only 3 degrees, compared to Earths jaunty 23.5 degrees scientists didnt expect to find temperatures on Jupiter varying in such regular cycles.
The study also revealed a mysterious connection between temperature shifts in regions thousands of miles apart: As temperatures went up at specific latitudes in the northern hemisphere, they went down at the same latitudes in the southern hemisphere like a mirror image across the equator.”
[Did they check the cycles of Jupiter’s moons? Our Moon has weather effects on Earth]
Anyhow Juice is going spend long time studying Jupiter and it’s moon, and going to first spacecraft that orbits a moon {the biggest moon}
but also going spend quite awhile in “earth orbit” or going take quite awhile before dives down to Venus and comes back to Earth for another gravity boost. But once gets beyond the inner planets it goes pretty fast to Jupiter.
For some reason Gordo forgot to respond to Pup:
https://www.drroyspencer.com/2022/12/uah-global-temperature-update-for-november-2022-0-17-deg-c/#comment-1419070
Readers ought to wonder why.
Readers, please not DREMT’s latest move in his game of pigeon chess, whereby he asserts that:
“‘Synchronous rotation‘ is a misnomer.”
As a reminder:
Which non-spinner will volunteer to write to the Royal Astronomical Society demanding the term be changed? The smart money is on GR.
Please share your correspondence with the readers.
As both "Spinners" and "Non-Spinners" should agree, the term is indeed a misnomer, as it implies two rotations occurring synchronously.
There are 2 motions.
Moon only has one motion, RLH. It’s just like a ball-on-a-string.
Please stop trolling.
The Moon has 2 motions and has nothing to do with a ball-on-a-string.
“There are 2 motions.”
“Spinners” think there are 2 motions…but do they think those motions are both rotations?
That is the question.
There are 2 motions as Newton described.
Whoosh! went the point, straight over your head.
Woosh. The science behind it went straight over yours.
As both "Spinners" and "Non-Spinners" should agree, the term is indeed a misnomer, as it implies two rotations occurring synchronously.
Just saying that there are 2 motions over and over again does not in any way address the point being made. Only if “Spinners” think those 2 motions are both rotations should they believe “synchronous rotation” is an appropriate term. However, most “Spinners” think an orbit is not a rotation.
As Clint has pointed out, the Moon has only one motion…a linear momentum. That produces a net result with gravity of an orbital path featuring curvilinear translation without rotation.
It should be totally obvious to you that the Moon cannot rotate locally due to the fact it keeps the same side pointing at Earth…like with a ball on a string, a car driving around an oval, and airliner circumnavigating the Equator, a wooden horse bolted to the floor of a carousel, etc.
The only honourable thing left to you, Richard, is to hand in your Master’s degree. Or, at least admit you have no understanding of physics.
See Newton.
Both “Spinners” and “Non-Spinners” should agree that Dr Roys Emergency Moderation Team is a misnomer, based on your 574 trolling comments so far this month alone, no?
What is remarkable is your insistence on counting them. That reveals an obsessive-compulsive nature that seems to underlie your other posts.
You do know that the number is calculated by the computer don’t you?
For in=stance you have 296 posts to your name this month so far.
DREMT points out one of the many flaws in the cult nonsense. So what does TM do? He quotes the cult nonsense, as a rebuttal!
TM has no science, only his cult beliefs. For example, where’s TM’S viable model of “orbital motion without axial rotation”?
He doesn’t have one. He’s got NOTHING.
where’s TM’S viable model of “orbital motion without axial rotation”?
Here you go Tonto. It’s at exactly your level too… https://www.turboimagehost.com/p/83542116/Moon_Earth1.gif.html
A typical troll response from a typical troll.
Trolls hate science as much as they hate reality.
Was that too advanced for you?
Try this then, https://moon.nasa.gov/assets/public/gifs/Simple+tidal+comparison+of+Earth+Moon.gif
Left= viable model of “orbital motion with axial rotation”
Right= viable model of “orbital motion without axial rotation”
Yes, Tyson, the "moon on the right" is the motion that "Spinners" believe is "orbital motion without axial rotation". Now, do you have a viable model for it? Something like a ball on a string, only for motion like the "moon on the right"?
Again TM, the very first sentence reveals they don’t understand orbital motion: “Satellite spin states evolve under the action of solid body torques and tidal forces.”
Gravity can NOT produce torques on moons.
Your cult is nothing more than incompetent idiots throwing crap at the wall. You’ve got PhDs – physics that can’t figure out the energy of a photon.
You’ve got NOTHING, but go ahead and throw something else against the wall.
That’s why this is so much fun.
Exactly, Tyson.
Please make sure that you are referring to a physical model, otherwise Gaslighting Graham will continue to gaslight readers into thinking that geometry alone can save Moon Dragon cranks.
Little Willy, please stop trolling.
> do you have a viable model for it?
A properly functioning bicycle pedal. You can tell it’s not spinning because the rider’s foot is connected to their a$$ which is sitting on a non-spinning seat.
Twit.
If the pedal was locked so that it was physically unable to rotate on its own axis, it would move like the MOTL. As a normally functioning bike pedal is not locked, and so physically able to rotate on its own axis, it can move like the MOTR.
I also like the Ferris Wheel/gondolas setup: https://youtu.be/chrMgczxrTg?t=44
Same rebuttal.
“Same rebuttal.”
Are you suggesting to lock the gondolas so that they become part of one single rigid body with the axle and spokes? https://youtu.be/chrMgczxrTg?t=44
The Earth-Moon system consists of two separate rigid bodies in the vacuum of space.
Irrelevant. The point is, if the bicycle pedal/gondola is physically unable to rotate on its own axis, it moves as per the MOTL. If it is physically able to rotate on its own axis, it moves as per the MOTR.
Nope. Not irrelevant in the inertial frame of the fixed stars.
You are viewing it from an Earth-fixed reference frame.
As Bindidon agrees, the moon issue is not resolved by reference frames.
Denial and prevarication are the last refuge of the moon dragon crank.
Take it up with Bindidon if you disagree.
You haven’t explained how the rider’s foot can be rotating while their a$$ attached to the seat is not.
No more of your mantras. Answer the question.
I’m happy that I won the exchange, at 7:16 PM. Thanks for taking part in another easy victory for me.
Your 7:16 does not address the movements of the rider’s body.
Explain how it can both rotate and not rotate at the same time.
Putz.
Sorry for your loss.
Annnd Graham gaslights himself.
Poor lad.
I’ll preemptively stop trolling now.
Glad you agree you are trolling.
Not any more, I stopped. Didn’t you read?
Well done for kicking your habit. Try not to start again.
Now now, I can’t let you have all the fun.
You immediately started again!
I never promised to stop forever. Besides I wouldn’t want to deny the sense of importance you gain from exercising your authority.
Self-confessed troll Brandy Guts, please stop trolling.
Are you suggesting to lock the gondolas so that they become part of one single rigid body with the axle and spokes? https://youtu.be/chrMgczxrTg?t=44
Okay, let’s go with that. Load the bottom cart, advance the wheel to load the next cart and so on, until half the carts have been loaded. Now you look up and see that riders in the first cart are hanging upside down! But your design assured you that the cart wouldn’t rotate, what happened?
What happened is you mistook 1:1 spin-orbit for orbit without axial rotation. Now you have riders falling out of the carts at the top of the orbit.
As I said, Tyson, if you lock the bicycle pedal/gondola so it is physically unable to rotate on its own axis, then it will move as per the MOTL. It can now only rotate about an axis that is external to the body of the bicycle pedal/gondola.
Have you noticed how Gaslighting Graham always falls back on his silly pet GIF after having lost a point, Tyson?
On the contrary, Tyson brought up the GIF, at 12:45 PM.
[T] Are you suggesting to lock the gondolas so that they become part of one single rigid body with the axle and spokes?
[GG] if you lock the bicycle pedal/gondola so it is physically unable to rotate on its own axis, then it will move as per the MOTL.
[W] Have you noticed how Gaslighting Graham always falls back on his silly pet GIF after having lost a point, T?
[GG] On the contrary, Tyson brought up the GIF, at 12:45 PM.
You don’t ever actually have a point. You just arrange quotes, seemingly at random.
When being shown the exchange in chronological order and with the replies connected to each other, Gaslighting Graham sees randomness.
What is your actual point? Do you even have one? I can read through the discussion in full, I don’t need your "summaries".
When confronted with direct contradiction, Gaslighting Graham plays dumb.
It’s as if “Gaslighting Graham” fitted like a glove.
I didn’t "fall back on the GIF", if that is still your "point". The GIF was a part of the discussion from the beginning, as I indicated.
maguff…”Synchronous rotation, of a body orbiting another, is where the orbiting bodys sidereal rotation period is exactly the same as its sidereal orbital period”.
***
Has it never occurred to you how unlikely it is that an orbiting body would rotate exactly once on a local axis per orbit. There is no physics to explain such a situation.
On the other hand, there is plenty of physics to explain the motion of the Moon keeping the same side pointed at Earth. It’s called curvilinear translation without local rotation. Even Newton knew that back in the 1600s. It seems luminaries like NASA has forgotten the meaning of curvilinear translation as explained by Newton.
Newton did not use the words translation, but motion and translation are equivalent.
“Has it never occurred to you how unlikely it is that an orbiting body would rotate exactly once on a local axis per orbit”
Has it not occurred to you that a mechanism for just such a behavior has long been documented?
“Newton did not use the words translation, but motion and translation are equivalent”
So it is your interpretation that describes ‘curvilinear translation’. Thank you for that (and you are wrong).
Richard, you have a propensity for claiming someone is wrong without offering proof as to why. That suggests you are holding your degree in one hand and preaching from a pulpit as if you have any idea of what you are saying.
Science is not about authority figures and accepting their proselytizing, it is about thinking for oneself and proving a point. I have proved my point and all you can do is whine in response using one-liners.
It has occurred to me what the difference might be between Newton’s reference to curvilinear ‘motion’ and what we mean today by curvilinear ‘translation’. It has to do with axes.
Translation in physics is just another word for motion of a particular type. With rectilinear motion, all particles in a body are required to move from A to B along a straight line with all particles moving in parallel and at the same speed.
THERE CAN BE NO ROTATION!!!
There has to be an equivalent motion along a curved path and such a motion is called curvilinear motion. Newton used the term in the 1600s. However, to keep that in line with rectilinear translation we must apply the same stipulation that all a particles in the body move in parallel and at the same speed. Then we can call it curvilinear translation.
There Science World, it have been defined for you, now all that’s left is to prove it. Here’s the proof.
If you track a body moving on a curved path, using 0,0 as a reference in an x-y plane, with the tail of a rotating vector at 0,0 and the arrow at the COM of the body, the only time it represents both curvilinear motion and translation is with a pure circle. With an elliptical path, there is a difference when using such a reference frame.
Any motion along a curved path is curvilinear. However, translation is a word we appear to use to represent all particles in a body moving in parallel and at the same velocity. It appears Newton did not use the word translation because it is a modern invention that even today lacks clarity.
If anyone disagrees with my definition of curvilinear translation they are most welcome to offer a rebuttal. Thus far, I have seen no such scientific rebuttals. only pompous asses declaring me wrong.
If the Moon was moving on a purely circular orbit, it’s motion could be tracked by a radial vectors from 0,0 on an x-y plane representing the Earth-Moon orbital plane. At each point on the circular orbit, the motion of the Moon is described as having all particles along the radial vector moving in parallel at each instant. I claim that for the obvious reason that the same side of the Moon always points toward the Earth.
Since each particle of the Moon along the radial vector must orbit in the same time as the rotating vector, it means each particle has the same angular speed at any one instant.
That fulfills, for a pure circle, the requirement of a definition of curvilinear translation based on the equivalent definition of rectilinear translation.
You won’t find such a definition in mechanical engineering text books because they are hopelessly lost as to the meaning.
Note, there can be no libration with a purely circular orbit.
This for Tim F….
With an elliptical orbit, we must change reference frames. It is the lunar motion that concerns us, not the motion of a radial line from 0,0 on the Earth-Moon orbital plane. Therefore, we must describe the lunar motion based on a radial line that applies to that motion.
At each instant of it’s orbital path, the Moon moves as if it was on the circumference of a large circle. If we can find the radius of that circle, we have the radial line to the Moon’s near-face at that instant.
Such a radial line can be found in two ways:
1)by finding the tangent line to any point on the curve and drawing a line perpendicular to the tangent line. Of course, the slope of the tangent line is the first derivative of the curve equation.
2)by finding a circle with an arc portion that corresponds to the curve at any point, and employing the radius of that circle as the radial line to the curve at that point.
Note: such a derived radial line will deviate from a radial line drawn from 0,0 on the Earth-Moon orbital plane to the COM of the orbiting body, except at either end of the major axis. The angle of deviation is the angle of longitudinal libration.
Note, however, that at each point represented by the Moon’s COM, all points on the Moon are moving in parallel, a basic requirement of the definition of curvilinear translation, as related to the definition for rectilinear translation.
The other requirement is that each of those points orbit the Earth in the same time. To prove that, we go back to the radial line between 0,0 and the Moon’s COM. It is no longer a requirement that the radial lines align, we are interested only in the change in angle the radial line makes with the x-axis.
Since all points on the Moon must orbit the Earth in the same time as the radial line that proves each point on the Moon is moving at the same angular speed.
Note that I did not use the word velocity, here I am concerned only with the average velocity of all parts, which is the scalar quantity speed.
I predict that maguff rebuttal will be to count the words in my response and declare it wrong because it is too long.
Come on, Gordo.
Has it ever occurred to you that your concept of parallel was the one from circular geometry?
Think.
You were the one claiming that Newton did not use the word ‘translation’.
“There has to be an equivalent motion along a curved path”
There is. It keeps all particles in the object pointing at a fixed star. Just as Newton claimed it would. In order for them to move in anything other than straight lines, such as in curved paths i.e. rotation about their axis, requires some energy being imparted to them.
“If we can find the radius of that circle, we have the radial line to the Moons near-face at that instant.”
No. You don’t. [This would be much easier if I could sit down and draw pictures with you. But I think I can make this clear.]
Draw the line from the center of the Moon to the Moons near-face at the instant of perigee (when the earth is closest to the earth and at one end of the major axis). Pick a crater near this point so we can keep track of it. (Call this the ‘crater line’.)
At the instant the moon reaches the minor axis, the ‘radial line’ will point straight to the center of the ellipse. But the ‘crater line’ will NOT be pointing to the center of the ellipse. It will be facing slightly away from the earth.
Or stated another way, at the end of the minor axis, the moon has traveled exactly 1/4 of the distance around the orbit, but has travelled less than 1/4 of the time around the orbit. The ‘radial line’ has changed by 90 degrees, but the ‘crater line’ has changes by less than 90 degrees.
tim f…”Draw the line from the center of the Moon to the Moons near-face at the instant of perigee (when the earth is closest to the earth and at one end of the major axis). Pick a crater near this point so we can keep track of it. (Call this the crater line.)
At the instant the moon reaches the minor axis, the radial line will point straight to the center of the ellipse. But the crater line will NOT be pointing to the center of the ellipse. It will be facing slightly away from the earth”.
***
I covered this in my reply. I pointed out that the only time a radial line through the near face aligns with a radial line from Earth to the Moon’s centre coincide is at apogee and perigee. During the rest of the orbit, the radial line from the near face points a few degrees away from a line from Earth’s centre to Moon’s centre and claimed that is longitudinal libration.
Besides, this is a major red-herring argument. It tries to negates and deflect the point I am trying to make.
If all you have is such a nit-picking reply, you have lost the argument.
rlh…”There is. It keeps all particles in the object pointing at a fixed star. Just as Newton claimed it would. In order for them to move in anything other than straight lines, such as in curved paths i.e. rotation about their axis, requires some energy being imparted to them”.
***
This reply reveals that you are grasping at straws and fail to grasp the underlying orbital mechanics. How can all particles in the Moon be pointing at a fixed star? Each particle points everywhere in the universe, only lines of particles, or vectors representing each particle’s motion could point at a fixed star and that is not happening. In the latter case, you are claiming the motion of each particle is focused on a distant star, which is nonsense.
A vector representing each particle points in a direction parallel to the velocity vector at any one instant. The direction of that velocity vector changes each instant through 360 degrees. During the course of an orbit, the particles, based on the linear velocity of the Moon, must point at every star in the universe that aligns with the orbital plane.
This reply is not for you, I gave up on getting an intelligent reply from you long ago. This is for a 3rd party reading your jargon and interested in a scientific reply.
Come on, Gordo.
How can one negate and deflect from a point at the same time?
Your geometry intuition fails you again.
Little Willy, please stop trolling.
“I pointed out that the only time a radial line through the near face aligns with a radial line from Earth to the Moons centre coincide is at apogee and perigee.”
This is true. But it misses the point I made.
When the moon reaches the minor axis (“C” on the diagram), this ‘radial line’ based on the ellipse points to the exact center of the ellipse (vertically on the diagram). So the point on the moon’s surface that had been pointing straight at the earth would be pointing straight at the center of the ellipse if it followed your rule.
But according to everyone else, the point that had been facing the earth would be pointing ~ 30 to the right of vertical, instead. (Further away from earth)
Only one of these can be correct.
“It tries to negates and deflect the point I am trying to make.”
Yes. I am ‘deflecting’ from your pretty mathematical model to focus instead on data.
“If all you have is such a nit-picking reply, you have lost the argument.”
If you can’t see the differences in the two models — and can’t see that data is the way to resolve it — then you have not even entered the argument!
A full week later, Tim? In response to Gordon, who you know moves down-thread pretty quickly?
Tim, please stop trolling.
[TYSON MCGUFFIN] Synchronous rotation is common among moons throughout the Solar System.
[Gordon Robertson] Has it never occurred to you how unlikely it is that an orbiting body would rotate exactly once on a local axis per orbit. There is no physics to explain such a situation.
[TYSON MCGUFFIN] List of known tidally locked bodies https://en.wikipedia.org/wiki/Tidal_locking#List_of_known_tidally_locked_bodies
Your turn…
What you have supplied is a list from believers, not true scientists. True scientists, like Nicola Tesla, work it out using math and physics and prove it is impossible for the Moon to rotate on a local axis.
Try this then Synchronous Locking of Tidally Evolving Satellites https://tinyurl.com/Sinchronous-Rotation
Your turn…
Again Gordon Robertson runs away when asked to provide his “math and physics” from “true scientists” that “prove it is impossible for the Moon to rotate on a local axis.”
The reason? They don’t exist.
“What you have supplied is a list from believers, not true scientists. True scientists, like Nicola Tesla …”
In other words “believe my appeal to authority, not yours.”
Also, the “no true Scotsman” fallacy. https://en.wikipedia.org/wiki/No_true_Scotsman
Tim still can’t admit his earlier error!
☺️
I know I make mistakes occasionally. Specifically what supposed error are you referring to? If it is truly an error, I will happily admit to it.
You agree that a movement like the MOTL can be described as "one motion". Yet you won’t accept that this means the MOTL can be described as not rotating about an internal axis!
tim…”In other words believe my appeal to authority, not yours. ”
***
The difference being Tim, that I offer my own scientific explanations and use the explanation of Tesla as a back up corroboration, even though his proof differs significantly from mine. Also, I can explain what Tesla offered as proof.
When you offer a rebuttal of my POV, you simply brush it off as being not right even though you fail to demonstrate you have understood what I said or without offering a counter-explanation.
maguff…”Again Gordon Robertson runs away when asked to provide his math and physics from true scientists that prove it is impossible for the Moon to rotate on a local axis.”
***
That’s just another appeal to authority. I don’t need the approval of ‘true scientists’ to express my proofs. I have sufficient background in engineering physics to back my explanations. You, however, lack the background in physics to offer a scientific rebuttal.
Gordon Robertson you are nothing but a charlatan!
Again Gordon Robertson, where are your “math and physics” from “true scientists” that “prove it is impossible for the Moon to rotate on a local axis.”
Crickets…
“When you offer a rebuttal of my POV, you simply brush it off as being not right even though you fail to demonstrate you have understood what I said or without offering a counter-explanation.”
I offered a rather specific rebuttal to your radial line / angle bisector / same radius of curvature. So I have to conclude the you simply brush off what I say.
https://www.drroyspencer.com/2022/12/uah-global-temperature-update-for-november-2022-0-17-deg-c/#comment-1420039
Here — again — is the rebuttal. Consider this diagram of a generic elliptical orbit: http://hildaandtrojanasteroids.net/KeplerII.jpg
Your radial line at “A” points straight along the major axis. This goes through some point “x” on the surface of the moon; the spot closest to the earth.
At “C” the moon has gone 1/4 of the DISTANCE around the planet, but only 1/6 of the PERIOD.
You predict the moon would have turned (1/4)*360 = 90 degrees and “x” would point along the radial line to the center (toward “K”).
Scientists predict the moon would have turned only (1/6)*360 = 60 degrees and “x” would point this direction (vaguely toward “I” or “J”).
What we need is data to confirm one way or the other which prediction accurately describes the orientation of the moon. Does “x” point to the center of the ellipse, or does it point to the right of center. I don’t personally have that data handy (and I am sure you don’t either), but people have been accurately measuring the motion of the moon for decades (and centuries and millennia).
If you DO have the data, that would settle it. If not, I will stick to the side with 1000’s of scientist and well-honed theories about conservation of angular momentum, not one engineer with a fun but unsupported hypothesis.
tim f…”What we need is data to confirm one way or the other which prediction accurately describes the orientation of the moon. Does x point to the center of the ellipse, or does it point to the right of center”.
***
Thanks for diagram but it’s not pertinent to the Earth-Moon system for two reasons. The lunar orbit is nearly circular and this diagram fails to show the second focal point which is far more important than the centre of the ellipse.
I searched for a better depiction of the Earth-Moon orbital system but its seems hopeless. The issue seems to be that for an orbital view to scale, the distances are so immense compared to the relative sizes of the the Earth and Moon that it would be impossible to see either at a scale that is clearly visible. I imagine it could be done to scale using point sources.
The missing 2nd focal point is crucial with an ellipse because it can be used to find the exact tangent line and radial line to the near face. If you draw lines from either focal point to the Moon’s centre, at any point on the orbital path, then bisect the angle formed, the bisector gives the exact radial line from the near face. A line perpendicular gives the tangent line at that point.
What we need to do is compare the difference in angle between any lunar near face radial line using the method above to a line joining the Earth centre to the lunar centre. That angle would be the angle of longitudinal libration.
Even at that, you can apply the method loosely on your diagram by imagining the other focal point at roughly the same distance from the orbital path along the major axis as the principal focal point where the Sun is located. From that, imagine lines draw from each focal point to any point on the given orbital plane, bisect it in your mind, and apply a perpendicular line to the bisector at that point. That would be your tangent line.
For example, if you do that when the Moon is at apogee or perigee, the radial line from the near face is in alignment with the line between Earth’s centre and the lunar centre just as it would be in a circular orbit. At any other point, there is a deviation of up to 5 degrees between the lines and that is longitudinal libration.
That 5 degree deviation is a hint as to how circular the orbital path must be. You could try drawing it to scale. I have meant to do that but have lacked the time.
We are not interested in how such a radial line points wrt the ellipse centre, only to the direction it points relative to a line joining the Earth, at the principal focal point to the radial line from the near face, that represent the gravitational field. Obviously, those lines align at apogee and perigee but don’t deviate anymore than 5 degrees anywhere on the orbital path.
Gordon says: “Thanks for diagram but its not pertinent to the Earth-Moon system for two reasons. The lunar orbit is nearly circular and this diagram fails to show the second focal point which is far more important than the centre of the ellipse.”
It is pertinent.
2) There is no need to ‘show’ the 2nd focal point. It is the same distance from “G” as the sun is from “A”. That is how focal points works! There is no need to ‘imagine the other focal point at roughly the same distance’.
1) Yes, this diagram exaggerates the eccentricity, but that only serves to emphasize the key points. All the same arguments still hold in principle for more eccentric orbits or less eccentric orbits.
“For example, if you do that when the Moon is at apogee or perigee, the radial line from the near face is in alignment with the line between Earths centre and the lunar centre just as it would be in a circular orbit. At any other point, there is a deviation of up to 5 degrees between the lines and that is longitudinal libration.”
Again, whether the eccentricity is larger (like my diagram) or smaller (like the real moon), there is a distinct difference in the orientation of the moon in the two model. Your model always predicts a smaller libration than the standard model.
Only one can be correct. And simply discussing it here will never resolve that. Only precise measurements and precise calculations will resolve the issue. A rough ‘about 5 degrees’ is not going to distinguish the two.
TM doesn’t understand any of this. He believes “tidal locking” has scientific foundation. He’s wrong. Gravity can not produce a torque on Moon.
In the case of Moon, the cult’s “tidal locking” means Moon keeps one side facing the inside of its orbit. REAL scientists know that means Moon is NOT rotating, as in, it has NO axial rotation.
> REAL scientists
Names and relevant refereed publications, C00ky.
Braindead Brandon, REAL science coincides with reality. Your cult nonsense remains nonsense no matter how many “publications” are thrown against the wall.
Reality always wins.
REAL scientists publish, C00ky.
Names and papers pretty please.
Many people can publish. The trick is sorting the nonsense from science. That’s where reality comes in.
Maturity helps also.
Obviously the REAL scientists of whom you speak are imaginary, C00kie. If they existed you’d be able to name them and show their work.
Seek help.
Brandy Guts loses another one to a better human being. Story of his life.
Wrong again, Brandon.
Some REAL scientists are in the pages of physics books. That’s probably why you haven’t found them.
C00kie waves his arms even harder.
Brandon, I’m sorry your troll tactic did not work. It’s tough when you’re fighting reality, huh?
Better luck next time. We know there will be a next time, because you can’t learn. You’re braindead.
That’s why this is so much fun.
Good to see your arms moving, Pup.
Now move those hips and do the Poll Dance Experiment.
As usual, we get further and further away from the original point being made.
Yes, the original point is that you were again trying to move the goal posts with your “Synchronous rotation is a misnomer” whine.
"…trying to move the goal posts…"
False accusation.
"…whine"
False accusation.
More importantly, Tyson, Gaslighting Graham is trying to equivocate on the concept of rotation.
Synchronous rotation is perfectly fine for those who understand that orbit and spin are complex motions.
Synchronous rotation is a misnomer for those who reject the Moon spin and cling to pure rotation.
https://www.drroyspencer.com/2022/12/uah-global-temperature-update-for-november-2022-0-17-deg-c/#comment-1419877
DREMT should have accepted the Reference Frames gambit when he had the chance. That would have given him a way out of the corner he’s painted himself into, and kept some semblance of dignity.
Now all he can do is deny and prevaricate about tidal locking and synchronous rotation as if these are new discoveries.
Personally, I don’t have a problem with the tidal locking mechanism. It results in motion like the MOTL, which the “Non-Spinners” see as “no rotation on its own internal axis”. So, you’re wrong again, Tyson.
“motion like the MOTL, which the ‘Non-Spinners’ see as ‘no rotation on its own internal axis’.”
Have you ever ridden a train>? https://youtu.be/AKhvqO5UBsA
It’s all about Reference Frames!
As Bindidon agrees, the moon issue is not resolved by reference frames.
maguff…”Have you ever ridden a train>?”
***
Many times, as far as real trains go.
In a local park they have a toy train that pulls passenger cars kids can sit as the train runs around an oval track. The oval is about 1/2 mile long, through the trees.
A child sitting in a car is pulled CCW around the track yet he/she remains seated in the car through the trip. At no time does the child rotate about his/her COG. That would mean rising out of his/her seat, turning 360 degrees on the spot, then sitting down again.
The mistake you spinner make is confusing a 360 degree rotation around a local axis with a 360 degree re-orientation of a face on a body through 360 degrees.
But, hey, keep at it. Maybe one day the light will go on.
Come on, Gordo.
Even Graham and Pup accepts that orbits do not follow pure translations.
Give it a rest.
Let’s see…scanning Gordon’s 8:01 PM comment for any mention of the word "translation"…no, not getting anything.
Gaslighting Graham gaslights a little more:
If there is no rotation, there is only translation.
I just saw it as a general point that a change in orientation does not necessarily indicate rotation about an internal axis.
Either Gaslighting Graham gaslights a little more, or he forgot to read Gordo’s output for years on this issue, e.g.:
https://www.drroyspencer.com/2019/07/lunar-living-9-weird-aspects-of-living-on-the-moon/#comment-364365
So in Gordo’s world the geometry of the universe is a big circle centered around the Moon’s axis of rotation.
Gordo’s demonstration isn’t very different than Flop’s or the CSA Truther, except for the fact that he reaches diametrically opposite conclusions…
Think what you like. Never any point in talking to you.
And so Gaslighting Graham gently gaslights a little more.
Not in the least. Well aware of what Gordon’s arguments are…and I still I just saw his comment as a general point that a change in orientation does not necessarily indicate rotation about an internal axis.
And so Gaslighting Graham gently gaslights a little more.
Little Willy, please stop trolling.
rlh…”MOTL is 2 motions, not one. A rotation about an axis of the Moon and an orbit around the Earth”.
***
Just curious, Richard. You do understand that the Sun does not rise in the east and set in the west, don’t you? You do understand that the apparent solar motion is just an illusions based on the observer moving on a rotating body while observing the Sun?
If you get all that, why are you having so much trouble with the lunar orbit? The lunar motion is exactly the same as a ball on a string, a car driving around an oval without losing traction on the curves, a wooden horse bolted to the surface of a carousel, etc.
It is blatantly obvious that lunar motion is curvilinear translation without local rotation. You have turned it into an illusion akin to the Sun orbiting the Earth.
What has the human convention about which is West or East to do with the Moon’s rotation?
A wooden horse is actually part of the mgr, something you fail to observe about the Moon/Earth duo.
rlh…”What has the human convention about which is West or East to do with the Moons rotation?
***
Everything. The illusion that the Sun rises in the east and sets in the west is based on the same illusion that a re-orientation of the lunar near face due to orbital motion represents a rotation about a local lunar axis.
****************
“A wooden horse is actually part of the mgr, something you fail to observe about the Moon/Earth duo”.
***
One could claim that the Moon is attached to the Earth via Earth’s gravitational field. The Moon has, in fact, been captured by the same.
I realize the means of capture between the horse being bolted to the mgr floor and the Moon being held by Earth’s gravity are different physically, but in the final analysis, both accomplish the same end. The horse is held in an orbit around the mgr centre and the Moon is held in an orbit about the Earth as centre.
It’s true that the horse does not have a momentum independent of the MGR, that is the major difference. As far as modeling the Moon’s motion, however, they are similar.
Part 3.
Carl Sagan joins a panel to testify in Congress on climate change and the greenhouse effect.
DECEMBER 10, 1985
I think that what is essential for this problem is a global consciousness, a view that transcends our exclusive identifications with the generational and political groupings into which by accident we have been born. The solution to these problems requires a perspective that embraces the planet and the future because we are all in this greenhouse together.
Thank you Mr chairman.
Another good example of Sagan’s attempts to pervert reality. We don’t live in a “greenhouse”.
Thanks TM.
Too right, as my Kiwi/Aussie friend would say. I doubt that Sagan ever spent time in a real greenhouse.
rlh…”You agree that a movement like the MOTL can be described as one motion’
MOTL is 2 motions, not one. A rotation about an axis of the Moon and an orbit around the Earth”.
***
You advised me in another post to ‘see Newton’.
I have read Newton carefully and he describes the lunar motion as linear, being bent into a curvilinear motion by Earth’s gravity. That meets the requirements of curvilinear motion without rotation.
I read another article about the original translation of Principia in the 1700s as being so vague as to be indecipherable from Newton’s works in Old Latin. The author of the article, who had 5 years of Latin, found it impossible to translate Newton’s Old Latin.
Obviously, translators have taken license with their translations, adding meaning to them that was never intended by Newton. The proof of that is what I have written above.
Newton knew the Moon moved with a linear velocity in a straight line (rectilinear) motion. He knew that gravity bent that rectilinear motion into a curvilinear path. He states that in Principia and I gave the page(s) number. He also knew the Moon keeps the same side pointed at Earth.
That means the translation of Newton in which he allegedly claimed the Moon rotated about a local axis must be wrong, or at least, poorly translated. It is totally inconsistent with his claims of linear motion being converted to curvilinear motion that the Moon would also rotate on a local axis while keeping the same side pointed at the Earth.
Newton also states in Principia that the Moon ***REVOLVES*** about its axis. Clearly, in the context of the Moon’s linear motion converted to curvilinear motion, that suggests the Moon is revolving about the Earth as its axis.
I suggest that the interpreter of his statement amended it out of confusion to coincide with the author’s concept that the Moon rotated on a local axis.
It is impossible for the Moon to move with a curvilinear motion, while keeping the same side pointed at Earth, to also rotate about a local axis. I have proved that and you have failed to prove otherwise. All you have is an appeal to an uncertain authority, the interpreter of Newton’s Principia.
“curvilinear motion” is an orbit. Not only a translation but a rotation about an axis too. 2 motions.
maguff…”Yes, the original point is that you were again trying to move the goal posts with your Synchronous rotation is a misnomer whine”.
***
Let’s talk about synchronous rotation, in the real world.
A synchronous induction motor uses synchronous rotation. The motor has a stator inside which a rotor turns. The stator has coils to which a 3-phase supply can be connected. Since a three phase voltage features three sine waves with alternating amplitudes which are 120 degrees out of phase, the connection supplies an electric field that rotates around the stator windings at 60 HZ.
Since the rotating electric field produces a magnetic field, the magnetic field turns at the same frequency. So, what you have is a set of rotating magnetic poles inside which is located a magnetic pole, which naturally follows the rotating magnetic field.
If the rotor has a D*C powered winding, it crates a N-S pole. That pole can be made to rotate within the stator field by following the alternating 3-phase rotating field. When the rotor gets up to speed, it becomes synchronized to the rotating field and turns at the frequency of the field.
That is true synchronous rotation. You have a magnetic field synchronized to a rotating magnetic field. It works because the N-S action of the magnetic poles in the stator winding cause the N-S pole in the rotor winding to rotate.
You are suggesting that the same kind of forces are involved with tidal bulges produced when the Earth and Moon somehow interact to not only slow the Moon’s orbital period but also to hold the Moon’s in a 1 to 1 holding pattern when the Moon reaches one alleged rotation per orbit.
It’ absurd. Tidal bulges have nothing to do with lunar motion. There are no forces to interact with the tidal bulges.
Somehow, some idiots have likened the interaction of tidal bulges and gravitational fields to magnetic interactions in electric motors. Such interactions in electric motors work only because the stator and rotor are separated by only a few millimetres. Separate them by several inches and no torques will be experienced by the rotor to turn it.
With the immense distance between the Moon and the Earth, speaking of such interactions between forces and tidal bulges is ludicrous. There are no torques produced that could possibly affect the rotation of the Moon, if it did rotate on a local axis. And if those fictitious forces could slow the rotation of the Moon they would not stop at a 1:1 synchronous rate, the Moon would continue to slow down till it was stopped rotating completely.
Lunar synchronous rotation is fiction.
[Gordon Robertson at 7:39 PM] With the immense distance between the Moon and the Earth, speaking of such interactions between forces and tidal bulges is ludicrous.
[Gordon Robertson at 3:42 PM] Newton knew the Moon moved with a linear velocity in a straight line (rectilinear) motion. He knew that gravity bent that rectilinear motion into a curvilinear path.
Which is it?
Me and Isaac agree that gravity is strong enough to bend the Moon off its linear motion into a curvilinear motion. It’s just not strong enough to slow the rotation of a planet down by affecting its tidal bulges via a torquing action.
Anyway, instead of nit-picking my arguments, why not try something original, like proving you understand what you are talking about instead of rushing off to find appeals to authority.
“…strong enough to bend the Moon off its linear motion into a curvilinear motion. It’s just not strong enough to slow the rotation…”
That’s your opinion.
“…instead of rushing off to find appeals to authority.”
But you started this post by appealing to Isaac Newton’s authority.
You’re nothing but a charlatan.
TM, instead of taking things out of context and insulting, why not impress us with your knowledge of the subject?
What is the change in angle of the imaginary spin axis, based on the angles given by your cult, between the high and low points of Moon’s orbit?
It’s an easy question. But none of your cult can even start. So, I’ll give you a hint:
https://en.wikipedia.org/wiki/Orbit_of_the_Moon#/media/File:Lunar_Orbit_and_Orientation_with_respect_to_the_Ecliptic.svg
You are confused as to the meaning of an appeal to authority.
An appeal to authority is when the subject that you are discussing is outside of that authority’s field of expertise, it is fallacious. An expert’s opinion is only to be appealed to in the field that they are an expert in.
So, the fallacy occurs when a figure of authority is appealed to just for being a figure of authority.
What you are describing is technically called the “appeal to false authority”.
Whereas an “appeal to authority” is the fallacy of thinking someone is correct because they are an authority – and yes, that can even be a legitimate authority in the subject under discussion. It’s a fallacy because even though they are an expert, they could still be wrong.
It’s also a separate type of ad hominem fallacy to suggest someone is wrong because they are not an expert on the subject under discussion.
DREMT suggest that he should not be taken seriously as he is not an expert in any of this.
Nobody is obliged to take me seriously by responding to my comments; nevertheless they do, thus affirming that they take me seriously.
I hereby state that I do not take you seriously.
Yeah, I was only kidding…I respond to people that I don’t take seriously all the time. Like now.
RLH, you do not take reality seriously.
That is why you’re a worthless troll.
“Its a fallacy because even though they are an expert, they could still be wrong.”
So that means that you guys will stop deferring to the ‘expertise’ of FTOP and other outlier ‘authority’ figures, who disagree with established geometric principles, definitions, and well-tested physics?
OK, fantastic.
What Gaslighting Graham is describing is not a fallacy. The fallacy obtains when the grounds for supporting the claim is illegitimate:
https://plato.stanford.edu/entries/fallacies/
Were Gaslighting Graham right, every forms of reasoning except formal deductions would be invalid or infelicitous.
More generally, X never implies Y unless it does, and the only time X implies Y is if Y logically follows from X.
So Gaslighting Graham gently gaslights a little more.
Well, according to the Wikipedia entry on “appeal to authority”, I’m correct.
Gaslighting Graham gaslights a little more:
https://en.wikipedia.org/wiki/Argument_from_authority
He simply switched from the belief in X to the veridicality of X.
“An argument from authority (argumentum ab auctoritate), also called an appeal to authority, or argumentum ad verecundiam, is a form of argument in which the opinion of an authority on a topic is used as evidence to support an argument.[1] Some consider that it is used in a cogent form if all sides of a discussion agree on the reliability of the authority in the given context,[2][3] and others consider it to be a fallacy to cite the views of an authority on the discussed topic as a means of supporting an argument.“
“Fundamentally, the fallacy involves accepting as evidence for a proposition the pronouncement of someone who is taken to be an authority but is not really an authority. . This can happen when non-experts parade as experts in fields in which they have no special competence”
FTOP on geometry and physics, check.
Tesla on astronomy, check.
[GASLIGHTING GRAHAM] an “appeal to authority” is the fallacy of thinking someone is correct because they are an authority and yes, that can even be a legitimate authority in the subject under discussion. Its a fallacy because even though they are an expert, they could still be wrong.
[WIKI] Some consider that it is used in a cogent form if all sides of a discussion agree on the reliability of the authority in the given context, and others consider it to be a fallacy to cite the views of an authority on the discussed topic as a means of supporting an argument.
[GASLIGHTING GRAHAM] according to the Wikipedia entry on “appeal to authority”, I’m correct.
The idea that possibly being wrong implies a fallacy is ludicrous.
The fallacy lies in assuming someone is correct just because they are an authority.
Nullius in verba.
Another source:
“Appeal to Authority
Appeal to authority is the misuse of an authority’s opinion to support an argument. While an authority’s opinion can represent evidence and data, it becomes a fallacy if their expertise or authority is overstated, illegitimate, or irrelevant to the topic.”
https://thebestschools.org/magazine/15-logical-fallacies-know/#appeal-to-authority
“Be very careful not to confuse “deferring to an authority on the issue” with the appeal to authority fallacy. Remember, a fallacy is an error in reasoning. Dismissing the council of legitimate experts and authorities TURNS GOOD SKEPTICISM INTO DENIALISM. The appeal to authority is a fallacy in argumentation, but deferring to an authority is a reliable heuristic that we all use virtually every day on issues of relatively little importance. There is always a chance that any authority can be wrong, thats why the critical thinker accepts facts provisionally. It is not at all unreasonable (or an error in reasoning) to accept information as provisionally true by credible authorities. Of course, the reasonableness is moderated by the claim being made (i.e., how extraordinary, how important) and the authority (how credible, how relevant to the claim).”
https://www.logicallyfallacious.com/logicalfallacies/Appeal-to-Authority
As usual, people jump to a whole lot of conclusions about what they think I’m saying, rather than simply looking at what I’m actually saying. It really does get boring.
As usual, Gaslighting Graham gently gaslight a little more.
Tyson wrote:
“You are confused as to the meaning of an appeal to authority.”
Then proceeded to write a description of the “appeal to false authority”. A different, though connected, fallacy.
I corrected him.
There is nothing more to it than that. Yet some people are convinced that there is.
Gaslighting Graham can’t bring himself to concede that according to the Wikipedia entry on “appeal to authority Tyson is correct.
The Wikipedia entry confirms that what Tyson described is the “appeal to false authority” fallacy and not the “appeal to authority” fallacy.
Gaslighting Graham gently gaslights a little more –
The Wikipedia entry confirms that what Tyson described as the fallacy behind the argument from authority was an appeal to a false authority.
Wrong. There are two separate fallacies:
1) “Appeal to authority”.
2) “Appeal to false authority”.
Gaslighting Graham gaslights a little more:
“Fundamentally, the fallacy involves accepting as evidence for a proposition the pronouncement of someone who is taken to be an authority but is not really an authority.”
An appeal to an authority does not imply a fallacy.
“…and others consider it to be a fallacy to cite the views of an authority on the discussed topic as a means of supporting an argument.”
[GASLIGHTING GRAHAM] Wiki supports my view.
[WIKI] Well, actually, those who support Graham’s view are a professor in experiential learning and an associate professor of economics who happens to be a libertarian freak.
https://yourlogicalfallacyis.com/appeal-to-authority
https://www.logicallyfallacious.com/logicalfallacies/Appeal-to-Authority
More gentle gaslighting from Gaslighting Graham.
His first source reads:
And the last bit has already been covered: nothing except analytical truths have any intrinsic bearing upon whether a claim is true or not.
The sources again confirm that there are two separate fallacies:
1) Appeal to authority.
2) Appeal to false authority.
and that what Tyson described is the second one, not the first, which remains as I described e.g:
“appeal to authority
You said that because an authority thinks something, it must therefore be true It’s important to note that this fallacy should not be used to dismiss the claims of experts, or scientific consensus. Appeals to authority are not valid arguments, but nor is it reasonable to disregard the claims of experts who have a demonstrated depth of knowledge unless one has a similar level of understanding and/or access to empirical evidence. However, it is entirely possible that the opinion of a person or institution of authority is wrong; therefore the authority that such a person or institution holds does not have any intrinsic bearing upon whether their claims are true or not.”
People seem to believe that I was saying appeals to authority can be used to dismiss the claims of experts, but they will not be able to actually quote me saying so.
P.S: Here is the second source on “appeal to false authority”, a separate (but connected) fallacy:
https://www.logicallyfallacious.com/logicalfallacies/Appeal-to-False-Authority
That is the one Tyson described.
Gaslighting Graham misreads false authorities (a paper by an education guy, an economist who should know better, and a psychologist who decided to become a fallacy guru) to rediscover the naive version of an ad verucundiam. He could think properly and understand the issue – appealing to infallibility is absurd for empirical questions.
But no, he absolutely needs to gaslight a little more.
The ad verecundiam is indeed connected to authority since the beginnings, i.e. Locke. There are ways to analyze sub genres, depending on the kind of authority we are dealing with: reputation, expertise, administrative power, etc. The overall idea to test if appealing to an authority if we can legitimately trust we can lend to that authority.
The long and the short of it is that it is perfectly fine to appeal to authorities. What does Graham think citations are? What isnt fine is to assume inerrancy.
Therefore Tyson has the right of it. And Gaslighting Graham once again appeals to bogus authorities because he really really needs to waste time with a topic he pretends to know more than he does. Just like when he clings to a content farm article for his own version of the notion of an orbit, or when he appeals to Holy Madhavi, a handbook that has yet to be completed and is full of typos.
Tyson’s 10:13 PM comment was wrong, my 4:21 AM comment was right, as has been established. That’s that.
*All* invalid ad verucundiams posit an authority that is dubious at best. *Any* authority can be wrong, To claim that appealing to an authority is invalid because it could be wrong vitiates the very concept of authority. By clinging to authorities that should know better than to pontificate on argumentation theory, Gaslighting Graham illustrates the fallacy very well.
To become an adult is to realize that authorities exist even if sometimes they can be wrong.
Little Willy can’t bear it when one of the people he chooses to support is shown to be wrong.
Gaslighting Graham cannot accept that he has been proven wrong.
Worse, that he illustrates the very point he purports to have refuted.
He soldiers on.
I wouldn’t have any problem with being proven wrong, Little Willy. It’s just not what has happened. As anyone can see by simply reading through the discussion above.
"Worse, that he illustrates the very point he purports to have refuted."
I don’t purport to have refuted a "point". I simply corrected an error made by Tyson, in which he described as an "appeal to authority" that which actually applies to the separate, but related fallacy "appeal to false authority".
Gaslighting Graham, a Moon Dragon crank who has been trolling this website for 77 months at least over trivial issues he keeps rejecting the opinion of just about everyone in the universe, pretends that he would accept being proven wrong.
His own fallacy guru shows that there is a problem with considering appeals to authorities as invalid:
The error in reasoning Dr Bo commits is to believe that because an authority can be wrong we cannot trust that authority. Were that the case, we would *never* defer to any authority. So of course Dr. Bo has to make another page, this time to the real ad veruncundiam:
https://www.logicallyfallacious.com/logicalfallacies/Appeal-to-False-Authority
Had our fallacy guru studied fallacies for real, he would not illustrate the
So once again Gaslighting Graham clings to a specific wording instead of trying to understand the problem at hand, and will repeat himself ad nauseam The ad nauseam can be a fallacy, btw:
https://en.m.wikipedia.org/wiki/Ad_nauseam
The Wikipedia page on "appeal to authority" also has a separate section on "appeal to false authority", indicating once again that they are two separate, but related, fallacies.
They Wiki takes pain to underline that appeals to authority are not *all* invalid. To distinguish it from the invalid form, one can use its latinism – the ad verecundiam. It is also called the appeal to a false authority.
The ad verecundiam is invalid *exactly* because it would be unjustified to lay our trust in the authority presented as one. It has *nothing* to do with the possibility for that authority to be wrong. It is a question of fiability, not infallibility.
Since Gaslighting Graham *cannot* concede any point *ever*, he soldiers on, clinging on citations that are *not* authoritative.
It’s never "valid" to conclude a claim is correct based on the authority of the person making the claim alone. End of story.
Watch Gaslighting Graham arguing by assertion while injecting an *alone*.
You’re right – the "alone" was superfluous.
"It’s never "valid" to conclude a claim is correct based on the authority of the person making the claim. End of story."
That’s better.
For once Graham is right –
It is better in the sense that is more obviously wrong, according to *all* the authorities cited so far, including the false ones.
Little Willy obviously thinks it’s "valid" to conclude a claim is correct based on the authority of the person making the claim.
That explains so much about him.
What do you call it when you cite the work of others?
A citation.
[GASLIGHTING GRAHAM] Tyson’s 10:13 PM comment was wrong, my 4:21 AM comment was right, as has been established.
[ALSO GASLIGHTING GRAHAM] It’s never “valid” to conclude a claim is correct based on the authority of the person making the claim alone. End of story.
Correct, and no contradiction. That Tyson was wrong and I correct is based on the evidence and logic presented. Not based on anyone’s word.
That "appeal to authority" is a fallacy of thinking someone is correct because they are an authority is backed by the following simple logic: we all make mistakes, and thus you cannot just take someone’s word and conclude that they are correct, even if they are an authority on the subject in question. They could still be wrong. Or, to put it another way:
"However, it is entirely possible that the opinion of a person or institution of authority is wrong; therefore the authority that such a person or institution holds does not have any intrinsic bearing upon whether their claims are true or not."
This does not mean we should just dismiss the claims of experts, of course.
The "appeal to false authority" is obviously a different (though related) fallacy, it contains the additional word "false" and that specifies that the fallacy lies in appealing to a "false authority", not just "authority".
This is all also supported by the differing definitions found for both "appeal to authority" and "appeal to false authority".
Gaslighting Graham gaslights a bit more.
*Everything* we use as arguments can be false, except perhaps pure stipulations, e.g. “let G be an a gaslighting assat.” We are fallible creatures. Errare humanum est.
If we presume (like Gaslighting Graham does) that fallibility implies a fallacy, then the only time when we would not risk committing a fallacy is with pure deductions that work only with stipulations as premises.
Besides, he still does not realize that he’s appealing an authority to argue that appealing to an authority is fallacious!
I’m not appealing to authority, Little Willy, because I’m not arguing that something somebody has said is correct because they are an authority.
[GASLIGHT GRAHAM] I’m not appealing to authority
[ALSO GASLIGHTING GRAHAM] Well, according to the Wikipedia entry on “appeal to authority”, I’m correct.
The Wikipedia entry corroborated what I had said. That doesn’t mean I’m saying I’m correct because Wikipedia is an “authority”. It just adds some evidence in my favour, that’s all.
🤦
Little Willy, please stop trolling.
December UAH Global will probably not be too different from November’s +0.17C.
I’m going with slightly up, say +0.19C.
Ok, I’ll go out on a limb. I am reasoning that the inordinate cold in November/December in the Northern Hemisphere should be good for a 0.2C cooling, so I’ll go with 0.14C.
I said, less than +0.0.
But to give a number -0.05
Sounds like https://youtu.be/2V3CfD8TPac
Off by .1 C,
Gorden was closer
Well CFSR daily has
https://oz4caster.files.wordpress.com/2022/12/d1-gfs-gta-daily-2022-12-30.gif
+0.24
One thing Ive found truly remarkable about JWST this past year is just how many people want to talk about it, University of Washington astronomer James Davenport told me in an email. Of course I knew every astronomer would be excited these images of young stars and ancient galaxies are something weve only dreamed of until now but almost every week I meet someone in the grocery store or the airport and they know about this mission! Theyve seen some of these iconic pictures and are moved.
Davenport said thats what he loves about astronomy, and about JWST: It strikes a chord deep within, and brings us together in awe and wonder of the universe.
https://www.geekwire.com/2022/artemis-webb-jwst-year-space-aerospace/
From: https://cosmiclog.com/
Sort of like music.
–A researcher said: Remarkably, the data suggest that the ice sheets can change in response to more than just global climate, calling into question some long-held ideas. A professor connected to the study commented: These findings appear to poke a hole in our current understanding of how past ice sheets interacted with the rest of the climate system, including the greenhouse effect. Well, fancy that. The commentary notes that global temperatures were relatively stable at the time of the fall in sea level, raising questions about the correlation between temperature, sea level and ice volume. In short, the ice sheets grew faster than scientists had thought.–
https://tallbloke.wordpress.com/2022/12/30/bering-land-bridge-formed-surprisingly-late-during-last-ice-age-say-researchers/
It not very surprising.
I wonder when are going get that snow causes global warming.
That would be very surprising.
Gaslighting Graham gently gaslights furthermore.
Little Willy, please stop trolling.
NEW YEAR ENIGMA
if the Moon stopped from spinning, how can it be impossible for it to spin?
The same way a bicycle rider’s foot can spin while their a$$ does not, of course.
Sorry for your loss. Happy New Year!
Little Willy, Brandy Guts, please stop trolling.
No.
Brandy Guts, please stop trolling.
THIS is trolling: December 12, 2022 at 11:02 AM
Points 1 to 3 were immediately agreed with by someone from Team "Spinner", so I guess not.
Being fed is the troll’s goal, and does not make it any less of one.
It’s OK, I’ll try to avoid feeding you.
Or you could not raise the topic on the December update when it’s published.
I was not the first to raise the moon topic in this update, and I doubt I will be the first to raise the moon topic in the December update.
Someone makes Graham troll, therefore he does not troll.
Raising the subject of the moon issue is not trolling. If people don’t want to discuss it, they can simply not discuss it. Instead, Little Willy chooses to heavily involve himself in the discussion. Then complains that I’m trolling by raising the subject!
You overlook the desire of *readers* to easily find on-topic comments.
Gaslighting Graham portrays troll slaying as trolling.
And then he wonders why he is called Gaslighting Graham.
You’re not troll-slaying, Little Willy. You’re a troll.
________
Then don’t be a part of the problem, Brandy Guts, if that’s the way you feel.
Roy’s is not my home ice, I could care less what clutters it.
OK, great, I’ll continue to discuss the moon issue then, as and when others bring it up.
Near as I can tell gb was the first to mention the Moon in this post … in a complaint about it’s non-topicality.
…and there was a small exchange between Clint R and Bindidon on the topic. I think Little Willy may have got involved, too. All before my post.
Just because someone lights a match does not absolve your role of adding accelerant to the arson.
Sure, but I don’t see the problem with discussing the moon issue. Some discuss politics on here, I stay out of that. My choice…and I don’t condemn those that do discuss it.
> I dont see the problem with discussing the moon issue.
It’s OT for starters. However one can be on-topic and still troll, but that’s the advanced class.
*Intent* to disrupt is probably the key condition.
It may have escaped your attention, Brandy Guts, but 95% of what is discussed here is off topic. You think Dr Roy’s blog gets the amount of comments it does because people want to discuss the temperature update each month!? I’m not a troll, I’m just a regular here…and as a regular here, I expect most of the discussions to be off topic.
> You think Dr Roys blog gets the amount of comments it does because people want to discuss the temperature update each month!?
Of course not, silly. But I don’t have difficulty supposing he’d prefer his regulars — especially one who elected himself a moderator — to be on topic 95% of the time.
Well, maybe, but that’s not how his blog has panned out. I’m sure he must be fairly happy with having one of the most commented on blogs certainly that I’ve ever seen. It’s an achievement in itself, and a testament to the power of free speech that so many people want to comment so much in an environment where they are free to say what they wish. Long may it continue.
Gaslighting Graham gently gaslights a little more.
Little Willy, please stop trolling.
Gaslighting Graham kinda forgets to tell BG that once he understood the points, Binny rescinded his agreement.
Is lying by omission truth telling?
No, he rescinded his agreement on point 2) only…which isn’t a problem, as there is another "Spinner" in agreement on point 2).
Binny recanted on point 2, therefore it is perfectly truthful to say that he agrees on point 1-2-3.
Gaslighting Graham gently gaslights a little more.
Is it more truthful to point out that initially he agreed on all 3 points than trying to imply he rescinded his agreement on all 3 points when you know that isn’t the case?
A simple explanation as to why Graham omitted to mention to BG that Binny washed his hands over Grahams baiting is that Graham tried to exploit the possibility that BG might not have noticed Binnys recantation.
He is not called Gaslighting Graham for no reason.
It would be irrelevant if BG had noticed Bindidon rescinding his agreement on point 2 or not, since there is another "Spinner" in agreement on point 2 in any case. In fact, there is even a "Spinner" in agreement on point 4. So, between them, "Spinners" actually agree on all 4 moon-related points.
It would be very relevant to say that Binny recanted once he realized that Graham was trolling him.
For some reason Graham prefers to gaslight instead.
I wasn’t trolling Bindidon. I was glad he had the courage to agree, and it was a shame he rescinded his agreement on 2. Especially as it was basically only because he "doesn’t want anything to do with all that MOTL/MOTR stuff" rather than anything to do with the validity of the proposition.
Trolling need not be aimed at a particular individual to be so.
Well, you’re the expert on trolling, Brandy Guts, as a self-confessed troll. According to Little Willy, that means anything you say on the subject is automatically true.
If only you could own your own behavior instead of blaming others for it.
I do own my own behaviour. I just don’t see what’s so wrong with it. Unlike you guys, who obviously find me to be objectionable in some way. It’s OK, I feel the same way about you.
Gaslighting Graham gently gaslights a little less.
Little Willy, please stop trolling.
Gaslighting Graham gently gaslights a little more.
#2
Little Willy, please stop trolling.
Perhaps, BG, but two half turns on the crank *cannot* equal a turn, so your argument is invalid.
Happy New Year!
That 0.5 + 0.5 = 1 does not in any way negate the fact that 2 is greater than 1.
*2* is one token of a number.
*1* and *1* are two tokens.
Two tokens are more than one token.
Gaslighting Graham gaslights a little more.
"Two tokens are more than one token"
Yes, 2 is greater than 1. Thanks for agreeing with me.
Tokens:
https://en.wikipedia.org/wiki/Typetoken_distinction
No wonder Graham sucks at semantics.
The point went over your head. No surprises there.
Gaslighting Graham gaslights a little more.
Two tokens is twice one token.
*1* + *1* > *2*
Lol, yes I got your point, Little Willy.
[rolls eyes]
Gaslighting Graham gaslights a little more.
One half-turn and another half-turn equals one full turn.
(Funnily enough that works with the half-turn going either way.)
One + one = one.
Little Willy, please stop trolling.
There is nothing “magical” about being able to describe a motion in multiple ways simultaneously. Tim “the Mighty” Folkerts
Yes, I agree with that quote.
[MIGHTY TIM] There is nothing “magical” about being able to describe a motion in multiple ways simultaneously.
[GASLIGHTING GRAHAM] I agree with that quote.
[ALSO GASLIGHTING GRAHAM] That 0.5 + 0.5 = 1 does not in any way negate the fact that 2 is greater than 1.
No contradiction, except in the deep, dark, recesses of your fevered imagination.
Gaslighting Graham gently gaslights a little more:
[W] If the Moon stopped from spinning, how can it be impossible for it to spin?
[BG] The same way a bicycle riders foot can spin while their a$$ does not, of course.
[W] Perhaps, BG, but two half turns on the crank *cannot* equal a turn, so your argument is invalid.
[GG] That 0.5 + 0.5 = 1 does not in any way negate the fact that 2 is greater than 1.
If Mighty Tim is right, then of course two half turns on the crank equals a turn!
Two descriptions. One with one motion. The other with two. Same result.
Yep. So what’s the problem, exactly?
And so Gaslighting Graham returns to playing dumb.
If Mighty Tim’s point is correct, then then whole “2 is greater than 1” line of argument falls apart.
The CSA Truther simply omits the possibility that one could represent an orbit using two independent motions, not just one.
Two independent motions, when joined, does not equal more than one motion. It equals one complex motion.
The Moon’s motion can be described in many ways. The most common one involves an orbit and a spin. There’s nothing Gaslighting Graham, Gordo or even the CSA Truther can do about that.
The "2 is greater than 1" argument doesn’t relate to what you’re talking about, though.
Tim accepts that movement like the MOTL can be described as "one motion". However, he refuses to acknowledge (against all logic and reason) that this necessarily means the MOTL can be described as not rotating on its own internal axis. In fact, he still argues that the MOTL can be described as rotating about both an external and an internal axis (so, two motions). So I thought I should point out to him that two motions are more than "one motion".
Gaslighting Graham aggressively gaslights a bit more.
The “1+1” argument is simply the idea that *as soon as* the Moon spins, it could not keep the Man on the Moon oriented toward the Earth. That the Moon spins would then be I M P O S S I B L E.
This argument is trivially false, as two motions can cancel one another. The Moon spins at the same rate as it orbits.
Either Gaslighting Graham accepts the trivial fact that Mighty Tim just offered him, or he accepts the CSA Truther’s demo. Can’t be both. And a Motte-and-Bailey won’t cut it.
Little Willy switches from the "2 is greater than 1" argument to the "1 + 1" argument, hoping that nobody will notice, whilst simultaneously accusing me of gaslighting!
OK, you want to now discuss something different. I will follow your change of topic, but I will state here and now – it’s a change of topic.
Our moon can be both "orbiting" and "spinning" only if "orbit without spin" is as per the MOTR. If "orbit without spin" is as per the MOTL, then of course it is impossible for our moon to be both orbiting and spinning. It could only be orbiting. All of this should be so obvious as to go without saying, and yet…Little Willy still doesn’t get it.
Gaslighting Graham egregiously gaslights again:
https://www.drroyspencer.com/2022/03/why-recent-warming-blamed-on-humans-is-largely-a-matter-of-faith/#comment-1230623
He’s tap dancing around variations on the same argument. “Rotation about an external axis plus rotation about an internal axis cannot possibly result in motion like the MOTL.”
It actually can, trivially and easily.
All he needs to realize that is to ponder on what it means to have two equivalent descriptions of the same phenomenon.
Like I told him the very first comment I submitted to him on this.
“The “2 > 1 argument” is not the “1 + 1 > 1 argument”” my ass.
“It actually can, trivially and easily”
Wrong. The motion of the MOTL can be described as:
1) Rotation about an external axis with no rotation about an internal axis.
2) Translation in a circle with rotation about an internal axis.
So there you go. The same motion can be described in different ways. However, for the MOTL, rotation about an external axis with rotation about an internal axis is not one of the ways it can be described. I don’t expect you to understand. That’s OK with me.
Gaslighting Graham gently gaslights a little more.
The motion of the Moon could be described with an infinity combination of motions. And we have a shit ton of numerical models in which the Moon orbits and spins.
Why does he keep alluding to a silly GIF when he’s talking about can be observed in the sky every day using an acronym that he never introduces properly?
More importantly, where are the numerical models of the Moon Dragon cranks?
Readers wonder.
No, kinematically, motion as per the MOTL can be described in only two ways. Not an infinity of ways. You are hopelessly wrong again, as you are on most subjects.
Gaslight Graham gently gaslights a little more:
Let the Moon translate one degree. By that time it rotates one degree. Result? The Man on the Moon still faces the Earth.
Trivial.
It’s as if Moon Dragon cranks never really thought where the concept of degree comes from.
Yes, Little Willy. Option 2). As I already said.
Gaslighting Graham gaslights a little more.
Let’s DESTROY his false choice:
If the motion of the Moon was pure translation, it’d be circular. It’s not circular. Therefore it’s not pure translation. His first horn is a dud.
If the motion of the Moon was pure rotation, the Moon would fly on a path without any change of orientation ever. In 3D. The Moon obviously changes orientation, if only because it’d be akward to have a reference frame centered around the Moon. His second horn is a dud.
The motion of the Moon is complex. Scientists have not built numerical models of it that involves advanced mathematics just for the fun of it. It cannot be solved by geometry alone.
Once we accept that the motion of the Moon is complex, an infinite combination of rotations or translations could account for it.
That should be the end of it, but Gaslighing Graham will continue to gaslight a little more.
Damn. I should have edited. Let’s rewrite that part:
If the motion of the Moon was pure rotation, it’d be circular. It’s not circular. Therefore it’s not pure rotation. His first horn is a dud.
If the motion of the Moon was pure translation, the Moon would fly on a path without any change of orientation ever.
Lol, God knows what Little Willy was thinking there. All over the place. Very comical. Thanks for your failure, it brightened up my evening no end.
Gaslighting Graham gaslights a lot more.
#2
Little Willy, please stop trolling.
Gaslighting Graham has been trolling this website for 76 months over a trivial point he simply asserts because he has no idea how to prove anything –
Let A, B, and C form a triangle. The ABC triangle is such that the AB line can be dropped on the AC line.
Thus AB = AC.
To go from B to C, one can do two things:
(T1) One can rotate the AB line onto the AC line.
(T2) One can translate the B point onto the C point.
If we abstract away the lines and consider only what happens on B and C, these are equivalent motions.
There’s nothing else to Graham’s silly point.
Except perhaps that neither can apply to the Moon motion. Pure rotation would be too restrictive. Pure translation would rest on an absurd convention.
#3
Little Willy, please stop trolling.
If the motion of the Moon was pure rotation, it’d be circular. It’s not circular. Therefore it’s not pure rotation.
Gaslighting Graham’s first horn is a dud.
…and yet, only a few comments ago Little Willy was arguing that it was a trivial matter to demonstrate that the moon could be described as rotating about an external axis whilst rotating about an internal axis…
Gaslighting Graham gently gaslights a little more.
That pure translation and pure rotation can be interchanged does not imply that the motion of the Moon can be interpreted as pure translation or pure rotation.
It’s a false choice.
The real choice is between interpreting the motion of the Moon as simple or complex.
We have every reason to interpret it as a complex motion.
Little Willy, describing the motion of the MOTL as a “pure translation” was not one of my two choices. You get that, right?
Also…rotation and translation are not interchangeable.
Gaslighting Graham does not always claim that two descriptions are equivalent, but when he does he categorically rejects that they are interchangeable.
🤦
It is not rotation and translation that are equivalent, idiot. In the case of the MOTL, it is the two descriptions I listed earlier.
And so Gaslighting Graham suggests we must imagine that the Moon really rotates and translates, as if rotations and translations were real things, and not descriptions of physical motion…
🤦
No wonder he stick to his pet GIF!
Little Willy just makes stuff up.
It is not rotation and translation that are equivalent […] it is the two descriptions – Gaslighting Graham
You interpret what I say in the most bizarre ways. Always funny to see your confusion on full display. Thanks for the chuckles.
If the motion of the Moon was pure translation, the Moon would fly on a path without any change of orientation ever.
In 3D.
The Moon obviously changes orientation, if only because it’d be akward to have a reference frame centered around the Moon.
So Gaslighting Graham’s second horn is a dud too.
“If the motion of the Moon was pure translation…”
Where are you getting the idea that this is one of the two options!?
[GASLIGHTING GRAHAM] The Moon can be described as a translation in a circle with rotation about an external axis.
[GASLIGHTING GRAHAM, A FEW HOURS LATER] Where are you getting that a pure translation is one of the option?
You cannot see the difference between “pure translation” (meaning “with no rotation about an internal axis”) and “translation in a circle with rotation about an internal axis”?
Gaslighting Graham fails at logic once again.
What goes for pure translation in general goes for any pure translation or any subset of pure translations in particular. Let us turn the screw a little more on Grahams gimmick:
1. *Any* pure translation needs to keep the same orientation.
2. *Any* pure rotation needs to change orientation *without* any translation.
These requirements follow by definition.
3. *Only* motions along a circular path could be described as pure rotation or pure translation.
This fact follows from the definitions.
4. The Moon has *not* a circular orbit.
5. Gaslighting Graham insists on his pet GIF to troll for his 77th month on this website.
These facts follow from observation.
So no, you cannot see the difference.
☺️
Gaslighting Graham gently gaslights a little more.
What can be said of pure translation in general would apply to a Moon that goes in a straight line forever.
It could be said of any moon that does not change orientation.
It *all* depends on how we define said orientation.
Another reason why Gaslighting Graham is wrong about reference frames, incidentally.
…but a moon that it is translating in a circle whilst rotating about an internal axis is changing its orientation…
[rolls eyes at idiot]
And so Gaslighting Graham *never* understood his own pet GIF argument.
🤦
Perhaps he should consult his own Holy Madhavi:
https://tinyurl.com/Holy-Madhavi
and report.
It confirms I’m correct. Thank you.
[HOLY MADHAVI] A motion is said to be a translation if any straight line inside the body keeps the same direction during the motion.
[ALSO MASHAVI] Rotation should not be confused with certain types of curvilinear translation.
Gaslighting Graham gaslights a bit more.
"[HOLY MADHAVI] A motion is said to be a translation if any straight line inside the body keeps the same direction during the motion."
That’s absolutely correct. So an object that is translating in a circle, without rotating about its own internal axis, does not change its orientation whilst it moves. Motion like the MOTR. That is one of the two ways that motion like the MOTR can be described. From this definition we can also deduce that an object that is translating in a circle, whilst rotating on its own axis, must change its orientation whilst it moves. Exactly as I said, above. Thank you for providing a quote that proves what I said to be absolutely correct.
"[ALSO MADHAVI] Rotation should not be confused with certain types of curvilinear translation."
Indeed. Another very important quote. It is important to remember that "rotation about an external axis with no rotation about an internal axis" (shown in Fig. 2(b)) is a different motion to "curvilinear translation in a circle with no rotation about an internal axis" (shown in Fig. 2(a)). The eagle-eyed should note that those two motions are the same as the MOTL and the MOTR, respectively.
Gaslighting Graham *still* does not get his own 1+1 argument.
*Either* a motion is interpreted as pure rotation or as pure translation.
The two definition are mutually exclusive.
Otherwise, pace Holy Madhavi, it is a general motion.
🤦
"*Either* a motion is interpreted as pure rotation or as pure translation.
The two definition are mutually exclusive.
Otherwise, pace Holy Madhavi, it is a general [plane] motion."
Sure, that’s correct. So let’s go through it.
MOTL:
1) Rotation about an external axis with no rotation about an internal axis [pure rotation, in other words]
2) Translation in a circle with rotation about an internal axis [general plane motion]
MOTR:
1) Rotation about an external axis with rotation about an internal axis, in opposite directions [general plane motion]
2) Translation in a circle with no rotation about an internal axis [pure translation, in other words]
Gaslighting Graham gaslights a once again.
There is *one* motion to explain. The motion of the Moon.
*Either* we can describe that motion with pure translation or pure rotation, or we need complex motion.
Pure rotation would imply a circular orbit, pure translation would imply one and only one direction.
False or absurd?
Moon Dragon cranks need to choose.
Meanwhile, let us appreciate that Gaslighting Graham does not grasp his own 1+1 argument.
"Meanwhile, let us appreciate that Gaslighting Graham does not grasp his own 1+1 argument."
Lol, how could I possibly not grasp my own argument? You do talk some complete nonsense at times. It’s you that doesn’t understand, as you prove time and time again.
After everything we just discussed, you’re still coming back to, "an orbit is not circular, therefore it can’t be a rotation". That’s it. All the rest of the nonsense aside, that’s ultimately all you’re saying.
You say that, whilst earlier saying that the motion of the MOTL could be described as "rotation about an external axis with rotation about an internal axis".
You just can’t help yourself. In your desire to contradict me on every single detail of every single point I make, you end up getting yourself all confused, and wind up contradicting yourself. Then you never admit you made a mistake, about anything.
Then in a few days time, you’ll just repeat all the same confused nonsense. You’re completely incapable of learning.
Gaslighting Graham gaslights more and more and more.
The reason why he keeps returning to his pet GIF is simple.
His 1+1 argument does not work for complex motion.
#4
Little Willy, please stop trolling.
brandon…”You overlook the desire of *readers* to easily find on-topic comments”.
***
To people like you who lack the intelligence to understand the basis of the Moon conversation, it’s an indictment of the GHE/AGW theory. Since most posters defending the nonsense that the Moon rotates on a local axis are also climate alarmist, by exposing their utter lack of basic science knowledge we are exposing their stupidity on global warming/climate change issues.
It was not until we began discussing the lunar orbit that I got it how utterly confused climate alarmists are about basic science. Then you came along, Brandon, and cemented the notion firmly in my mind that climate alarmists are not only ignorant of science, they are just plain ignorant.
Imagine if primary literature were full of articles in the form of X theory is wrong because its proponents are wrong about wholly unrelated theory Y, Gordon.
brandon…you make my point. When an alarmist has no rebuttal he resorts ad homs, insults, and red herring arguments.
The irony is too delicious. Don’t ever change, Gordon.
Good point, Gordon. We see the same efforts to avoid reality with both the GHE and Moon.
I don’t know who brought the Moon issue here, but it has been a great learning tool. It got me to start commenting, rather then just lurking. I never realized people would go to such efforts to pervert reality. It is truly cult behavior. They are opposed to truth, science and reality, simply because their false beliefs get destroyed. They’ve got passenger jets flying backwards and ice cubes boiling water!
The strangest of all is the concept that the earth is stationary and the moon goes around it in a perfect circle, without rotating about its axis, as if tied to the earth by a string.
Perhaps Clint could remind us of the source of the nonsense.
Ken…it surprises me that you, as a climate skeptic and someone opposed to the nonsense promulgated on behalf of covid, would fail to understand the basis of the non-spinner argument.
None of the non-spinners have claimed the Earth stands still or that the Moon orbits it in a perfect circle, or like a ball on a string. We have used the BoS only as an example of a body that keeps the same face pointed to it’s axis of rotation and which cannot rotate on a local axis due to the tension on the string.
By the same token, we have offered examples like a wooden horse bolted to the floor of a carousel, a car driving around an oval without spinning out and rotating on it COG, a locomotive running around a circular track, which cannot rotate on its COG without jumping the tracks and being lifted by a crane. and an airliner flying around the Equator at a constant altitude.
I have gone deeply into how the Moon remains in orbit yet you have failed to respond to me once in a positive manner. It disappoints me that a fellow Canuck with whom I agree on AGW and covid cannot understand even a simplified explanation of the lunar orbit.
It’s a new year and I am hoping you will come around in your thinking.
This “Ken” is an example of how the cult works. “Ken” clearly knows nothing about the science. He’s clueless about physics and celestial motions. He’s STILL confusing the simple ball-on-a-string with Moon’s orbit. The simple model is ONLY about “orbital motion without axial rotation”. “Ken” just can’t learn, so I predict he will make the same mistake again.
I’m not even sure “Ken” is a true AGW skeptic. I suspect he’s just a wandering troll, looking for a home. Like several of the others, he contributes NOTHING of value here.
> Im not even sure Ken is a true AGW skeptic.
There’s a word for groups whose members are fiercely intolerant of any dissension of their rigid orthodoxy, C00kie.
I know you know what it is.
There is another word, skeptic.
Disagreeable, rude, stubborn, crackpots, irreverent,
and generally, arguing endlessly.
And also, adorable.
“Theres a word for groups whose members are fiercely intolerant of any dissension of their rigid orthodoxy…”
***
Fiercely intolerant??? Do you mean like alarmist politicians trying to ban free speech for anyone disagreeing with their meme? Or, the Canadian government pulling out a never-used war measures act to shut down a peaceful truckers’ protest? The PM of Canada claiming anyone who disagreed with him on covid vaccines was misogynist, racist, and essentially, illiterate.
That’s part of the reason we non-spinners defend our science so aggressively. We are fighting for science itself, as it is being dismantled by those who don’t understand it.
The “fiercely intolerant” label goes with cults, not realists. Cults reject reality and must constantly work to discredit reality. That’s why they’re a cult.
That’s also why this Moon issue is so relevant. The cult idiots will say/do anything to protect their false beliefs, including making up things like passenger jets flying backwards.
Not clear you know what a cult is.
Define ‘cult’ in a way that puts all astronomers, physicists, and us in it.
In simple terms (“Keep it simple, stupid”.) a cult is a group all having the same false beliefs. Cults reject reality and must constantly work to discredit reality. Cult members will say/do anything to protect their false beliefs, including making up things like passenger jets flying backwards, and ice cubes boiling water.
A defining feature of a cult is that they are a relatively small group holding beliefs or values which are radically different from the mainstream.
That feature applies to our Moon Dragon Cranks, no matter how much C00ky pretends to be defending REAL Science.
I hold that the following points are true:
1) A ball on a string is not rotating on its own axis.
2) "Rotation about an external axis with no rotation about an internal axis" is motion as per the "moon on the left".
3) The moon issue is not resolved by reference frames.
4) "Revolution/orbit" is defined as a rotation about an external axis.
None of these points are "radically different from the mainstream". In fact, various "Spinners" at this blog agree with all 4 points. Not all at the same time, but various "Spinners" agree with some of the points, such that all points have at least one "Spinner" in agreement overall.
The mainstream view is that the Moon rotates on its own axis at the same rate as it orbits the Earth.
That is not your view.
True…but if you take all four points, and logically connect the dots, you get "the moon does not rotate on its own axis". It’s not my fault that "Spinners" are unable to see that, or to argue amongst themselves to get to the truth.
Brandon, “mainstream” is NOT always science. Consensus is NOT always science. Science MUST be based on reality, or it’s NOT science.
Also, “Moon Dragon Cranks” and “Cooky” are immature nonsense associated with 8 year-olds.
Thanks for being such a great example of a cultist.
Ranting on blogs is not doing science, C00ky.
Brandon, you may be good at ranting, but you don’t have a clue about science.
Before you start learning about science, you need to first understand reality. Can you even admit that ice cubes can not boil water?
Well I *am* good at ranting, C00kie, thank-you ever so much.
The difference between us is that I don’t elevate my rants to the level of established mainstream science. I recognize that they are simply venting my spleen at random nitwits on the Internets. That evident intolerance of your opinions is where any similarity in my behavior to cultists ends. Your failure to meaningfully address your minority views in the primary literature is where the insularity of your cultlike behavior comes into full swing.
As the Piano Man says, “you may be right, I may be crazy”, but until you can convince the mainstream of the veracity of your arguments and change their views, it is you and your coterie of non-spinners who better match the definition of “cult”.
You’re good at both ranting and blah-blah, Brandon. IOW, you’re a good troll.
But, you can’t face reality. You avoided the question: “Can you even admit that ice cubes can not boil water?”
Red herrings aren’t REAL Science either, C00ky.
If the ice cubes/boiling water has you stumped Brandon, how about a question related to the Moon issue — Do passenger jets fly backwards?
It’s okay if you need to ask an adult. The effort is to see if you can face ANY reality. I bet you can’t. Prove me wrong.
“Truebut if you take all four points, and logically connect the dots, you get”
Sorry no can do. Mainstream Astronomers don’t agree with #4 and this view is consistent with their definitions of orbital motion and the Moons rotation, of tidal locking, etc.
Some people are unable to put together all available facts about rotation and elliptical orbits and realize that #4 is not correct.
brandon…”The mainstream view is that the Moon rotates on its own axis at the same rate as it orbits the Earth”.
***
It’s a view…a belief…not fact. It’s also an illusion. If you try to prove it you can’t.
It is rather difficult to believe that what physicists and astronomers are doing is
‘constantly working to discredit reality. Or “saying/doing anything to protect their false beliefs,”
There is no evidence that this is the case.
More likely the person claiming this is living in an alternate reality, perhaps drug induced.
I have previously addressed your arguments related to your mantra that fluxes don’t add, C00kie. That said, your belief that they do not is not the mainstream view, and is yet more evidence of your cult-like behavior.
Gordon,
Same response to you as my prior one to Clint; my argument here does not rely on whether my view or yours is correct, only that yours is not mainstream and therefore the more cult-like.
To change this state of affairs requires you to convince the mainstream that your model is better than theirs, and you’re not going to do that by simply ranting at random people in blog comment sections.
Quit evading reality, Brandon. The questions were NOT about physics. They were simple common sense, based on reality, that any responsible adult could correctly answer. But, you can’t answer because you fear reality.
1) Can ice cubes boil water?
2) Do passenger jets fly backwards?
Reality is going to get you — BOO!
Quit pretending that I’ve not already answered your questions in prior exchanges, C00kie.
Wrong Brandon, you haven’t answered these questions because I haven’t asked them before. You’re trapped in your cult nonsense so you have to start making things up, as usual.
One more time:
1) Can ice cubes boil water?
2) Do passenger jets fly backwards?
You can’t answer because you’re trapped in your cult nonsense. Prove me wrong.
I know we’ve discussed your boiling ice cubes before, C00kie. If memory serves, jets flying backward was Gordon’s example. I concede that I don’t remember whether you asked it yourself nor if I responded to it or not, and I’m not going to in this thread. So take your half a point and rejoice.
I have fielded countless of your other questions and examples, so for you to claim that I have some sort of fear facing your arguments is pure gaslighting on your part.
Meanwhile, my point stands; you and your merry band of malcontents are in the minority. Not only that, you’re not even in the mainstream discussion, which is the only place where your arguments stand a chance of overturning the status quo.
Why that is the case is self-evident: you are incapable of it, else you would be doing it.
Brandon, you now admit you haven’t answered these questions, although you claimed earlier you had. You got caught by reality.
Reality catching you is NOT “gas lighting”.
You can’t answer because you’re trapped. There’s no way out, so your endless blah-blah won’t help.
One more time:
1) Can ice cubes boil water?
2) Do passenger jets fly backwards?
You can’t answer because you’re trapped in your cult nonsense. Prove me wrong.
Question, singular, C00kie. About the jet airliner. Countless others I have faced, hardly the behavior of someone who fears answering same.
It’s like you’re a compulsive liar or something. That’s not necessarily an example of cult behavior, more evidence of a personality disorder.
Brandon, if you want to see how desperate you are, just go back and review your failed efforts here. You’ve exhausted all your troll tricks, so now you bring out the “L” word.
When you deny reality, that’s like lying to yourself.
One more time:
1) Can ice cubes boil water?
2) Do passenger jets fly backwards?
You can’t answer because you’re trapped in your cult nonsense. Prove me wrong.
(You keep proving me right!)
> review your failed efforts here
I’ll leave it to interested parties to research my prior postings and judge for themselves, C00kie. I doubt anyone will, but what I wrote stands for itself.
In the meantime I’ll simply reiterate that the views your questions are meant to address are in the minority and thus the “cult” label applies more to you than it does to me.
Whether your arguments are correct or not is a different question. After all, Galileo once held the minority opinion. But he did something you haven’t: publish where it mattered.
Until you do so I’ll continue to take your ravings with the barest pinch of salt.
Toodles.
What “interested parties” will observe is your desperation, Brandon.
It’s like you can’t wait to prove me right!
Thanks.
So you say, C00kie. By the way, did you ever figure out whether the universal law of gravitation is a First Principle or not?
What today’s effort verified, beyond a shadow of a doubt Brandon, is that you don’t understand any of the science, and you can’t face reality.
IOW, you’re a braindead cult idiot posing as an ignorant troll. Each of your childish spews just further proves that.
That’s why this is so much fun.
Keep making me look good.
Actually, C00kie, you’re hoist on your own petard. But I’ll make you a deal: quid pro quo.
You know the right thing to do.
“Also, ‘Moon Dragon Cranks’ and ‘Cooky’ are immature nonsense associated with 8 year-olds.”
Yeah Brandon, why arent you using mature insults like Clint’s:
“Youre a confirmed braindead cult idiot.”
“Youre a braindead cult idiot posing as an anonymous troll.”
Or come up with ‘clever’ mature names for opponents:
“Fraudkerts, you cant answer the simple question so you throw your slime against the wall. Thats why you are such a fraud.”
If it weren’t for his double standards, C00kie would have NOTHING.
Brandy Guts, please stop trolling.
You should be thanking me for the job security.
#2
Brandy Guts, please stop trolling.
“3) The moon issue is not resolved by reference frames.”
Most people get started down this rabbit hole because they look up and ‘see’ the Moon not rotating from their geocentric rotating frame of reference.
Gordon and Clint and the video claiming no Moon rotation ALL use a geocentric rotating reference frame to argue that the Moon is not rotating.
If one adopts the inertial frame the can see the moon is indeed rotating.
The issue of axis is red herring, since the Moon is observed to have a tilted rotational axis which cannot be the same as its orbital axis.
Thanks for the reminder about Moon’s imaginary rotational axis, Nate. None of you has been able to answer the simple question:
What is the change in angle of the imaginary spin axis, based on the angles given by your cult, between the high and low points of Moon’s orbit?
I even gave TM a hint:
https://upload.wikimedia.org/wikipedia/commons/4/46/Lunar_Orbit_and_Orientation_with_respect_to_the_Ecliptic.svg
It’s almost like your cult doesn’t understand any of this, huh?
nate…”Gordon and Clint and the video claiming no Moon rotation ALL use a geocentric rotating reference frame to argue that the Moon is not rotating.
If one adopts the inertial frame the can see the moon is indeed rotating”.
***
We are on an inertial frame that is also rotating. However, our brains are capable of realizing that and accommodating. For example, when I view the stars at night, I am aware that my reference frame is rotating west to east and that the stars are not moving east to west. Same with the Sun during the day.
The Moon orbits west to east and we cannot take in its motion in one night. In order to see the lunar motion we must observe on successive nights, no small feat when you live in a climate like ours in Vancouver, Canada where it is more likely than not to be overcast in winter.
However, we can note that all we can see is the near face of the Moon and that is all anyone can see at any point on Earth. So, when Australians on the other side of the Earth from us look at the Moon, they see exactly the same side.
If you are on a rotating reference frame and you make adjustments for the motion, you can make things out clearly.
C’mon, Gordo.
You’re just one of the few cranks who believe that the Moon doesn’t spin. What goes for the Moon goes for the greenhouse effect.
Even Graham believes in the greenhouse effect, btw. But don’t tell him that.
Nothing to do with belief, Willard, it’s a fact that it doesn’t rotate about a local axis.
C’mon, Gordo.
The term “belief” refers to an attitude you, me, human beings in general have whenever we take something to be the case or regard it as true.
It is a fact that LRO captured the Moon spin:
https://www.youtube.com/watch?v=sNUNB6CMnE8
A few years of ranting and you still can’t even get a coherent geometry story.
Pity.
Would anything go amiss if we stopped believing? I have found non-belief does no harm. In fact, it tends to clear the mind to clear the way for truth.
C’mon, Gordo.
It’s obvious you entertain many beliefs. You ranted about them each and every single day for more than a decade. I suppose you could argue that you’re ranting for no reason whatsoever, without any sincerity or forthrightness whatsoever, just like Pup trolls. Few might believe you.
If the universe did not contain any brain to ascertain factuality, would there be any truth at all left?
I talk only proved scientific fact. You are the one who doubts what I claim yet you lack the expertise to rebutt my claims.
C’mon, Gordo.
All the LRO captured was the Moon re-orienting in space wrt the stars. That’s because the LRO uses the stars as a reference frame, not the Moon.
It did not capture the Moon rotating 360 degrees about a local axis.
C’mon, Gordo.
You keep talking about reference frames:
https://lunar.gsfc.nasa.gov/library/LunCoordWhitePaper-10-08.pdf
It might not mean what you make it mean.
Little Willy, please stop trolling.
Yet another duplicate error that never shows up…
maguff…”An appeal to authority is when the subject that you are discussing is outside of that authoritys field of expertise, it is fallacious. An experts opinion is only to be appealed to in the field that they are an expert in”.
***
You are moving this into a different context than what was intended by critics. My beef with you and other alarmists appealing to authority is your lack of proof that you have made an effort to understand a subject. In lieu of your lack of understanding, you have simply offered the opinion of authority figures.
Many climate alarmists offer the IPCC as an authority figure even though the IPCC has been proved to be corrup.t. Not only that, they are seriously biased in that their mandate is to find only evidence of anthropogenic warming. In other words, they have no interest in presenting evidence that contradicts their mandate. In fact, they have gone so far as to block papers from their review process that are skep.tical of the AGW theory.
Then there is your current authority figure, Carl Sagan, who made a fool of himself by broad.casting rhetoric about the atmosphere of Venus. He has since been proved wrong since the surface of Venus is far too hot at 450C to have been produced by a runaway greenhouse effect.
I would much rather see you offer your own opinions based on your own research and have the courage to be wrong. That’s how you learn.
> based on your own research
Not too many people can afford to build super-colliders in their own backyard, Gordon.
How about chickens?
Good one, Willard.
C’mon, Gordo.
BG used to have chickens.
Happy New Year!
Don’t forget the duckies! 😛
No one has ever seen an electron yet I have made a career based on the little critters. There are other means by which science can be done.
It’s true that we are at the mercy of those who study sub-atomic particles, then again, no one is forcing us to believe them. Their studies have lead to monstrous lies like the big bang theory and I can’t think of too many applications for studies using super-colliders.
They can’t even replicate the so-called actions inside the Sun. Much of nuclear theory was developed by people like Fermi who did ad hoc experiments in school gymnasiums. It was hit or miss but eventually they began to hit more than they missed, thankfully without blowing themselves sky high.
C’mon, Gordo.
Here is an atom:
https://www.popularmechanics.com/science/a17804899/here-is-a-photo-of-a-single-atom/
> There are other means by which science can be done.
I’m fairly certain ranting against the mainstream on the Innert00bs isn’t one of them, Gordon.
Little Willy, Brandy Guts, please stop trolling.
” It was hit or miss but eventually they began to hit more than they missed, thankfully without blowing themselves sky high.”
Yeah. no.
It was not hit or miss at all. Fermi’s reactor was DESIGNED to work and not blow them sky high, based on solid theory and previous experiments.
“Their studies have lead to monstrous lies like the big bang theory … ”
How can a theory be a lie? Think before you post.
To believers the big bang is a fact, to me it’s a theory, and a lie. Capice?
There isn’t a greenhouse effect theory.
That big bang is theory, seems like an improvement- comparatively.
It probably will be disproven to some extent, within 10 years,
because it’s theory- and we getting more and better telescopes.
Steady state doesn’t seems to me to count as theory- what does
predict?
What else is there which is better or competing a theory
to big bang?
Speaking of comparatively.
Earth has ozone layer, Venus has smaller ozone layer.
If Venus was at 1 AU, it doesn’t seem Venus would get a larger
ozone layer.
At 1 AU, Earth has larger Ozone as compared to Venus at 1 AU, is any
warming effect related to having stronger ozone. Or is Venus cooler
due to having less ozone?
The “Big Bang” theory is not even a theory. The scientific process goes roughly like this:
1) An idea
2) An hypothesis
3) A theory
4) A law
To even get to step 2, no known laws of science can be broken. Big Bang violates the laws. And “idea”, in violation of the laws, is “sci-fi”.
🤦
I will start with 4) A law
If Mars is hit enough with big enough space rocks, it will create
water in the surface of Mars.
A lie involves deliberate misdirection while knowing the truth.
Simply disagreeing with somebody’s truly held belief does not make them a liar.
You have overstepped the line.
Gordon is our leader in monstrous hyperbole.
2023 starts very well for Team Dragon:
🤦
Yes, you still don’t understand what an appeal to authority fallacy is. You apparently think any source presented in corroboration of your claims is an appeal to authority!
Gaslighting Graham is gently gaslighting furthermore:
https://www.drroyspencer.com/2022/12/uah-global-temperature-update-for-november-2022-0-17-deg-c/#comment-1421036
To appeal to an authority becomes a fallacy when that authority does not caution the support we assign to them.
Some call it the “appeal to a false authority.”
See what I mean?
[GG] You apparently think any source presented in corroboration of your claims is an appeal to authority!
[W] The long and the short of it is that it is perfectly fine to appeal to authorities. What does GG think citations are?
[GG] See what I mean?
An appeal to authority is a fallacy. So no, it is not “perfectly fine”.
Being a little bit pregnant is not one of the options.
Gaslighting Graham still twists himself into a pretzel:
https://en.wikipedia.org/wiki/Argument_from_authority
The sources cited that are on my side are two argumentation theorists, Lewinski and van Eemeren. The sources cited for his naive conception is a paper by an education guy, and a paper by an economist who should know better. He also cited a psychologist who decided to become a fallacy guru without reading about argumentation theory.
If Gaslighting Graham knew anything about argumentation theory, he’d realize that he’s appealing to false authorities, which means he commits the fallacy he’s so keen in crying about.
And since he’s caught in a bind, he’ll equivocate on the verb “to appeal.”
https://yourlogicalfallacyis.com/appeal-to-authority
“appeal to authority
You said that because an authority thinks something, it must therefore be true.
It’s important to note that this fallacy should not be used to dismiss the claims of experts, or scientific consensus. Appeals to authority are not valid arguments, but nor is it reasonable to disregard the claims of experts who have a demonstrated depth of knowledge unless one has a similar level of understanding and/or access to empirical evidence. However, it is entirely possible that the opinion of a person or institution of authority is wrong; therefore the authority that such a person or institution holds does not have any intrinsic bearing upon whether their claims are true or not.”
The above is what I agree with. If people instead want to think it is a valid argument to assume that what somebody has said is definitely correct because they are an authority on the matter, then that js their choice…but it makes no sense to me.
Gaslighting Graham gaslights gorgeously:
[GASLIGHTING GRAHAM’S AUTHORITY] Appeals to authority are not valid arguments, but nor is it reasonable to disregard the claims of experts who have a demonstrated depth of knowledge unless one has a similar level of understanding and/or access to empirical evidence.
So it’s not reasonable to disregard invalid arguments???
🤦
An appeal to authority, suggesting that somebody is correct because they are an authority, is not a valid argument. Nevertheless, claims from experts should be taken seriously, perhaps considered as more likely to be correct.
For example, if my doctor told me I had a serious illness, I would take it seriously. Perhaps assume she was likely to be correct…but I might ask for a second opinion. I would consider that she could be wrong, and so it would not be a valid argument to assume she must be correct, just because she is an authority.
DREMT, you’ve done a great service by babysitting the worthless trolls, willard and brandon. Good job.
As you keep them wrapped up in their nonsense, they don’t have time to bother others.
Dr. Spencer needs to give you a raise!
Graham is about to get to sleep, Pup.
Shhh.
Gaslighting Graham gaslights a bit more, rediscovering the ad verecundiam along the way.
Here is Frans van Eemeren, whom stands on my corner:
https://anekawarnapendidikan.files.wordpress.com/2014/04/a-systematic-theory-of-argumentation-by-frans-h-van-eemeren1.pdf
Here is the author Graham prefers for the ambiguity of his wording:
http://www.jesserichardson.com/
🤦
Thanks Clint. Always happy to help out the blog.
☺️
Graham’s gaslighting looks a little more than a little pregnant, BG.
Little Willy, please stop trolling.
Farewell to Dark Sky
Knowing the weather is one of our oldest desires. After millennia of wishing, we have wired up the earth; satellites and instrumented balloons, thermometers, barometers and anemometers, supercomputers and a purpose-built telecommunications system to tie it all together, in order to see ahead of time. This weather machine relies on nearly every major invention of the last three centuries, Newtonian physics, telecommunications, spaceflight and computing.
The ability to forecast the weather is among humanity’s greatest adaptations to life on earth.
“Perhaps some day in the dim future it will be possible to advance the computations faster than the weather advances and at a cost less than the saving to mankind due to the information gained. But that is a dream.” Lewis Fry Richardson
maguff…the scenario your article describes would no longer be forecasting. What good would real time reporting of weather systems do?
andrea…”The ability to forecast the weather is among humanitys greatest adaptations to life on earth”.
***
Although weather forecasting has become reliable it is still not a sure thing. A weather forecaster explained recently that forecasts are often based on an educated guess. Forecasters have available to them an in-depth database of past weather systems. Applying this data in a model, they can see several scenarios and they select the best fit. However, they are ready to amend that selection to other possible scenarios at a moments notice.
Unfortunately, climate modelers think the same applies to climate predictions, which cannot be made with any amount of accuracy.
https://youtu.be/a2y0FTRaUEM
They’re dividing Oxford up into six zones that you can only leave a certain amount of times, and Canterbury have announced a similar thing with five zones, putting cameras across the city to monitor people’s movements.
The idea of zoning cities really frightens people. There’s something sci-fi about it isn’t it.
1984 was supposed to be a warning, not an instruction manual!
Sincerely,
George Orwell
Amazing how Maguff, the climate alarmist, fails to mention that the lockdown intended in Oxford and Cambridge is about…ta da…the climate change myth. Yes, the good folks of the UK government are taking away the freedoms of UK citizens based on a seriously bad theory.
I predicted this Nazi mentality and the proposed loss of freedoms during the covid hysteria. They got away with it then and now they think they can go farther, removing the democratic rights of people based on another hoax.
Usually, the climate change hoax is blamed on left-wingers but here we have a Conservative government, who are so far right they make Attila the Hun look like a socialist, planning to take away the democratic rights of UK citizens.
Looks like the so-called conspiracy theorists were not far off the mark when they branded this Nazi mentality, ‘the Great Reset’. There are idiots out there who really believe they can bypass democracy and get away with it. There are some of us who think they can shove it in a dark place.
“Amazing how Maguff, the climate alarmist, fails to mention…”
First off, had you watched my video before going into your usual paroxysm of hysteria you’d know that at 0:50 it unequivocally says:
“…and I believe the rationale for this is to save the planet it’s to reduce the carbon footprint of Oxford.”
Second, I don’t appreciate your calling me a “climate alarmist” because I am a dyed in the wool doomist.
I’ve been watching this slow motion train wreck develop since I first became aware of it in the 1970s. Although I derive no joy from seeing the earliest scientific predictions come true, I take comfort in being able to understand this “large scale geophysical experiment” we’re conducting.
maguff…”Second, I dont appreciate your calling me a climate alarmist because I am a dyed in the wool doomist.
Ive been watching this slow motion train wreck develop since I first became aware of it in the 1970s. Although I derive no joy from seeing the earliest scientific predictions come true, I take comfort in being able to understand this large scale geophysical experiment were conducting”.
***
The earliest scientific predictions from the 1970s was for global cooling. It was not till the late 1980s that con men like Al Gore and James Hansen of GISS began spreading the bs about anthropogenic warming.
Gore thought he was spreading theories he thought he had learned at university from professor Roger Revelle. When Revelle co-authored a paper in the early 1990s, with Fred Singer, advising people not to read too much into anthropogenic warming theories, Gore went ballistic. He implied through a third party that Revelle had become senile and that Singer had taken advantage of him by manipulating him into producing the paper.
Singer sued in court and won. Unfortunately, Revelle died in the early 1990s and was unable to defend himself, but his daughter spoke on his behalf. Meantime, Gore went on sponsoring Hansen, saving him from being fired from NASA as the director wished.
Meantime, in the late ’80s, the IPCC was formed. It was a political body from the start and it’s co-chair, Houghton, being a climate modeler, steered it in the direction of climate model theory. Even though the IPCC declared in TAR that future climate states cannot be predicted, they did exactly that, using unvalidated climate models.
Maguff, you don’t have a leg to stand on. All your sources are about as corrupt as they can be, as proved by the Climategate email scandal. Some of the emails involved top IPCC officials like Phil Jones of Had-crut and Kevin Trenberth of NCAR. The latter admitted the warming had stopped in the mid-2000s and the former implicated him in blocking papers from skeptics to IPCC reviews.
Both were Coordinating Lead Authors on IPCC reviews and had the ability to do what Jones bragged about.
If you are as serious as you claim, then please open your eyes.
> The earliest scientific predictions from the 1970s was for global cooling.
Manabe and Wetherald published in ’67, building on works undertaken in the ’50s based on observations gathered by the USAF. Theirs was the mainstream view, there being far fewer cooling papers, despite the fact that at the time temperatures had been declining since the late ’40s.
“The earliest scientific predictions from the 1970s was for global cooling.”
That is a myth, and a review of the climate science literature from 1965 to 1979 shows the myth to be false. The myth’s basis lies in a selective misreading of the texts both by some members of the media at the time and by some observers today. In fact, emphasis on greenhouse warming dominated the scientific literature even then.
Your opening paragraph is bullshit. Given your track record, I expect the rest of your post to contain more of the same so I will ignore it.
Brandy Guts, Tyson, please stop trolling.
willard…”What can be said of pure translation in general would apply to a Moon that goes in a straight line forever.
It could be said of any moon that does not change orientation.
It *all* depends on how we define said orientation”.
***
Speaking of gas-lighting, Willard moves it to a new level.
You got the first part right, if the Moon was suddenly released with gravity being turned off completely and instantly, the Moon would continue in a straight line with its natural rectilinear translation.
The Moon is incapable of moving along a curved path, it can only ever move in a straight line, as is true of any mass with momentum. Unless another force is applied to divert it from the linear path, it will always move along a linear path.
With regard to orientation, the Moon is obviously not rotating on a local axis, otherwise it could not keep the same face pointing toward Earth. The Moon’s near face is always oriented toward Earth yet it re-orients through 360 degrees wrt the stars. That can only be explained via curvilinear translation.
A body moving with both curvilinear motion and local rotation is the Earth. If you could view the Earth from the Sun, you would see every side of the Earth as it rotated on its axis, 365+ times per years. If, on the other hand, all you saw from the Sun was the Americas, you’d know the Earth was not rotating about its local axis but performing only curvilinear motion.
It stands to reason then, that if the Moon was rotating on a local axis, we could see every side of the Earth during one orbit.
Come on, Gordo.
You are not helping Gaslighting Graham right now. In fairness, you seldom do. Try this experiment:
Put an apple in the middle of your table. Stand parallel to the table, and walk around it while looking at the apple.
Tell me if that is impossible.
If I walk around a table looking at an apple, the motion requires hundreds of automatic actions available to the human body. The Moon has none of those actions/adjustments, all it has in a linear velocity/momentum.
So, replace the table with a round table (apologies to King Arthur) and walk around it while walking only forward (no side-stepping or rotating one’s body about an axis) while keeping the head and face pointed at the apple.
This is similar to a scenario I offered a while back. Rather than an apple at the centre of the round table we have a vertical pole. on the pole is an axle that rotates about the pole independently on a bearing and to the axle is attached a hook.
You are wearing a harness that fits over your shoulders like a proper safety harness, so it cannot rotate on your body, or you within the harness. On the side of the harness is a hook to which you can attach a rope, with the other end of the rope attached to the hook on the bearing at the pole.
The rope is just long enough to clear the round table edge. When you start walking, say CCW, you can keep looking at the pole by turning your head to the left, then you can walk right around the table without rotating your body about the vertical COG axis while keeping the left side of your body always pointed at the pole.
Your motion is curvilinear translation without local rotation and it is the same motion experienced by the Moon. The only difference is you being attached to the external axis by a rope and the Moon being attached to the Earth via a gravitational field.
Come on, Gordo.
When you walk, you use your hips and your legs and your feet. When you look at the table, you use your neck and your head and your eyes.
Two different group of muscles. Unless you walk in a perfect circle (good luck with that) your synchronization will be quite approximative. Why do you think I keep asking Pup to do the Pole Dance Experiment?
What you call a demonstration is beyond ridiculous.
The walker is wearing a safety harness that is attached by a rope to the central axis. He cannot rotate about his vertical COG axis because the rope is too short to allow him to rotate once and he cannot rotate within the harness.
Your concept of local rotation is so messed up, I doubt that you’ll ever understand.
Come on, Gordo.
No, you do not wear a safety harness.
You would not need one to prove that to translate and to rotate at the same time is quite possible.
Photo or it does not exist.
I limited the walker’s motion to demonstrate a point. Are you claiming that without the harness and rope, the person would begin rotating about a local axis?
Come on, Gordo.
You cannot make a general point by limiting the scope of your argument.
All you proved was that you had to limit your motion.
This proves you wrong, but you are too much of a crank to think things through properly.
Nice try, tho.
You can’t win, Gordon. You make it so that the person is physically unable to rotate on their own axis, they still think the person is rotating on their own internal axis. Hell, they even think a chalk circle drawn towards the edge of a merry-go-round platform is rotating on its own internal axis.
They can describe movement like the MOTL as being "one motion", but then still somehow not get that this necessarily means "not rotating on its own internal axis".
Nate even goes so far as to say the motion of the moon around the earth can be fully described by an equation for an object moving in a straight line.
Gaslighting Graham gently gaslights a bit more, this time trying to intimate that when someone rotates their head while they walk they only think that they do.
And then he whines about being called Gaslighting Graham.
As to Bill, who cares about what Bill tries to say.
Little Willy, please stop trolling.
“Nate even goes so far as to say the motion of the moon around the earth can be fully described by an equation for an object moving in a straight line.”
Bill lies more when things aren’t going his way. He and DREMT make a good pair…of con artists.
brandon is in Manitoba…”To change this state of affairs requires you to convince the mainstream that your model is better than theirs…”
***
My background is in engineering, I don’t do models. Whatever I present to you is based on engineering observation and calculations based on a mind-numbing number of actual engineering problem sets. Engineers learn to work out problems using a scientific approach which isolates the motions at hand.
I have spent a considerable amount of time offering detailed analysis of the spinner POV. I have yet to receive the courtesy of one spinner detailed commentary on my offerings.
I know the reason why. In the spinner’s mind, there is an illusion that the Moon rotates exactly once about a local axis per orbit. That leads to thought-experiments that are seriously missing data. None of you can fill in the missing data because there is none, therefore you resort to appeals to authority and obfuscations of science.
> My background is in engineering
Yes, I got it that this is your particular handicap, Gordon. It’s ok, you’re in good company, and nobody is as bad as *physicists* when it comes to thinking they can solve any problem set to them.
I hate to break it to you, but every equation you put to paper is a model — a reduction or simplification of a process that is more complex than the sum total of your mind-numbing scribbles.
Your “detailed analyses” are wasted in this forum. If you really want to make a difference in the world, the proper place for them is in refereed primary literature. They should include some math, something I see very little of under your byline.
brandon…”I hate to break it to you, but every equation you put to paper is a model a reduction or simplification of a process that is more complex than the sum total of your mind-numbing scribbles”.
***
That makes you a blithering idiot, then, doesn’t it? You are incapable of addressing my so-called scribbles because you apparently lack the ability to understand them.
Then again, I have an advantage on you. I actually studied the underlying physics and can not only offer equations, I can explain them as well as the underlying physics.
On the other hand, even the IPCC with their reviewed papers cannot explain how CO2 warms the atmosphere. The best they can offer is that 19th century scientists said it could and that it began warming some 100 years after CO2 levels began rising in the atmosphere.
About the same time as they claimed it began warming, a mini ice age, the Little Ice Age, ended. Anyone with half a lick of sense would consider that occurrence extremely significant. Not the IPCC, they are not allowed to consider the Little Ice Age because there mandate is to find only evidence of anthropogenic warming.
People like you who support such chicanery have to be terminally stupid.
On the contrary, Gordon, being self-aware of my own limitations is a sign of intelligence, not stupidity.
That said it doesn’t take much smarts to distinguish between qualified scientists who’ve published and gaseous windbags on the Interwebz.
Prove me wrong; publish.
dremt…”Its important to note that this fallacy should not be used to dismiss the claims of experts, or scientific consensus. Appeals to authority are not valid arguments, but nor is it reasonable to disregard the claims of experts who have a demonstrated depth of knowledge unless one has a similar level of understanding and/or access to empirical evidence”.
***
Good point.
To me, an appeal to authority is not the same as a reference to an authority figure. When authors write a book, or paper, they are obliged to quote references to authority figures they quote. Even if they use a quote from an experts book or paper, they must acknowledge the citation, otherwise it is plagiarism.
Besides all the legal matters, it is plain courtesy to acknowledge a source, if it is not your own. It’s the same in songwriting, where a writer is limited to the use of so many bars or words from an existing song. It becomes impossible, however, to know whether an idea is original or based on a song one has heard in the past.
My beef with an appeal to authority, especially on this blog, is people offering quotes from authority figures as their sole source of evidence. I quote Clausius all the time, on the 2nd law and entropy, almost verbatim, but I can, and do, explain the 2nd law and entropy without reference to Clausius. In fact, I have applied quantum theory to the proof of the 2nd law and Clausius had no access to quantum theory.
Even at that, rebuttals of Clausius are never based on an understanding of the 2nd law or entropy, but on bs science created by people who have no understanding of his work and how he arrived at his observations.
Clausius did not arrive at his theorems using thought experiments, he applied hard physics theory via heat engine theory. In his works, he offers lessons in differential calculus and work theory that could be used today in universities.
Although he did that over a century ago, and his understanding of quantum theory was non-existent, his conclusions re the 2nd law and entropy have stood the test of time. In other words, no one has ever proved them wrong as written.
That’s not true of other authority figures quoted, like NOAA, NASA GISS, and the IPCC. All three have been challenged and proved wrong.
Come on, Gordo.
To appeal to an authority is perfectly fine when that authority is legitimate.
The fallacy obtains when that authority does not support the claim under dispute.
For instance, Gaslighting Graham cites the opinion of an economist, a psychologist, an education guy, and a design guy to support his naive conception of the fallacy.
Would he look at real authorities on the matter, he would need to revise his opinion.
Think.
When all you have is such an appeal to authority, and you cannot explain the theory in your own words, you have nothing.
That’s why you have nothing because all you ever offer are appeals to authority. You cannot even understand a very simple model I presented about someone walking around a round table while constrained so he could not turn about a local axis.
Gordon,
Even preeminent scientists in their field aren’t expert in every aspect of it, to say nothing of their peers in completely different fields. With their intelligence and training they stand a better chance than the average layperson of understanding and digesting scientific arguments outside their main expertise to the point they could offer meaningful rebuttal — but that assumes they have time available to put in the required study … which could be *years* depending on the question at hand.
The simple fact of the matter is that REAL scientists absolutely rely on reputation, authority, the process of peer review and, yes, *consensus* building to guide their *beliefs* about the nature of reality and thus inform their own research efforts. They could not be as efficient truth-seekers without doing so.
Of course cranks such as yourself decry these necessary mechanisms; they have not the skills to develop the reputation necessary to influence mainstream scientific opinion, thus their only recourse is to complain loudly about the playing field not being lowered to their level.
brandon…”With their intelligence and training they stand a better chance than the average layperson of understanding and digesting scientific arguments outside their main expertise to the point they could offer meaningful rebuttal …”
***
Outside of their field of expertise, I would regard the average scientist as being about as useless as breasts on a bull. Scientists can learn to think more precisely and scientifically but that does not mean their analysis outside their fields of expertise is anywhere nearly correct.
Even in their field of expertise, many can be obtuse. In our EE classes we were still required to accept that electrical current flows from positive to negative. Even though we were taught that electrical current is based on the electron, a charged particles that can only move in a circuit from a negative potential to a positive potential, we were required to accept the theory based on a convention established around 1930, that an electrical current is comprised of mythical positive charges, hence moves from positive to negative.
Don’t get me wrong, I liked and respected most of my profs at university. At a later date, one of them, a physics prof, was instrumental in me converting to the obvious view that time was invented by humans. He did not hesitate when I raised the subject, he stated with authority that humans invented time to keep tract of change.
That was a perfect example of me accepting the word of an authority figure but I went on over the ensuing years to develop my own reasoning to back the fact.
There are many scientists I admire for their clarity of thought and their courage in remaining with their ideas despite pressure to drop their skepticism. We have two at UAH in Roy Spencer and John Christy.
It was not till recently that I began to realize how many scientists go along to get along, and who are willing to spew forth rubbish in order to be accepted. Not only that, many are quite willing to denounce their rivals with a zeal that would have been admired in the Holy Inquisition.
It has just been released in a book by Robert F. Kennedy Jr., The Real Anthony Fauci, that Fauci, the western guru on covid, was instrumental over the years with ruining the careers of scientists who opposed him. One of his victims was Dr. Peter Duesberg, the youngest scientist of his time inducted into the National Academy of Science. Why??? Duesberg stood up to the popular view that HIV causes AIDS. That myth has been denounced for years now by scientists who are informed even if Fauci and his minions work overtime to keep the myth alive.
The scientist who is credited with discovering HIV, the late Dr. Luc Montagnier, verified over 10 years ago that HIV cannot harm a healthy immune system. He offered that AIDS is caused by oxidative stress related to lifestyle, something Duesberg was vilified for claiming 20 years before.
Astronomers that believe in Moon rotation, or tidal locking, don’t understand orbital motions or physics.
Come on, Gordo.
Argumentation theorists study argumentation theory.
They are the GOATs, not cranks like you.
Sorry not sorry.
Come on, Gordo.
The question is not about when all you got is an appeal to authority.
The question is how to evaluate an appeal to authority.
Stop squirming and think.
It actually doesn’t matter who supports the different "appeal to authority" arguments – it’s a matter of simple logic.
It cannot be a valid argument to suggest that an authority’s claim is correct simply because they are a relevant authority on the subject in question, because they could still be wrong, even so.
That’s that.
Little Willy trying to suggest that his sources are correct on the matter because they are "better authorities" is, amusingly, a great example of an appeal to authority fallacy. He is solely making the case that they’re right because they’re authorities.
Gaslighting Graham gaslights again.
An argument is supported by premises.
Premises can contain citations.
When this is done well, no harm.
When this is not, there is a fallacy.
We must the infer that the appeal to authority was unjustified.
A false authority, so to speak.
There is nothing else to that episode.
Once again, Graham cannot concede the most elementary of points.
That’s right, Willard, arguments have premises, e.g:
P1) X is an expert on Y.
P2) X says Z about Y.
C) Z is correct.
…and still, that conclusion cannot be justified from those premises, because X could still be wrong about Z, even though they are an expert on Y. Nobody is infallible.
And so Gaslighting Graham falls back once again on the silliest argument he ever produced here. And he is a full blown Dragon crank.
If premise P can be wrong, then the argument it supports is a fallacy.
Pay no attention to the fact that he conflates soundness and validity.
Imagine what this entails regarding how we ought to use empirical arguments.
*Every* single empirical argument can be wrong.
*Every* single empirical argument is thus a fallacy!
🤦
No, Little Willy. The premises aren’t wrong. The premises are correct. It’s the reasoning to get to the conclusion that is fallacious.
You are, once again, arguing against things I’m not saying.
Once again Gaslighting Graham fails to master his own argument.
He said that appealing to an authority is invalid because (when would be more precise) the authority can be wrong. So presumably his model is:
Premises that can be wrong => truth claims
Thus is overall argument is that from fallible claims one cannot infer certainty or absolute truth.
*This* is the appeal to a false authority. *No* authority can provide such support.
In fact NOTHING does, at least insofar as a empirical claims are concerned.
*This* is the point that destroys Gaslighting Grahams argument. Few appeals to authorities as if they were inerrant nowadays. *Everybody* uses them like Gaslighting Graham does, i.e. as sources that corroborate their own stances or undermine their opponents.
Contrarians always fall for that strawman because it helps them fancy that they are the real truth seekers. And cranks are worse, for they portray their tin foil hattery as some kind of red pilling exercise.
Take Pup who asserts that astronomers know NOTHING. Is that empty assertion plausible? Not in the least!
He could still be right. How should he proceed to support his assertion? Certainly not by arguing by assertion!
And that is the memo.
Little Willy, all that waffling will not mean that statements are correct just because relevant authorities say them.
Sure, we all offer support from various sources that help corroborate our views. That’s not an appeal to authority, though. The fallacy is to think that what our sources say is correct simply because they are relevant authorities. When we offer support from various sources, we’re simply trying to add evidence that we are more likely to be correct. We’re not (or shouldn’t be) saying that it makes us "absolutely right".
Citations are not "appeals to authority". Here is a list of reasons I found online for why citations are important:
"It’s important to cite sources you used in your research for several reasons:
1) To show your reader you’ve done proper research by listing sources you used to get your information.
2) To be a responsible scholar by giving credit to other researchers and acknowledging their ideas.
3) To avoid plagiarism by quoting words and ideas used by other authors.
4) To allow your reader to track down the sources you used by citing them accurately in your paper by way of footnotes, a bibliography or reference list.
Note that none of the reasons are "because statements from the people you cite, if they are valid authorities, are thus correct".
And so Gaslighting Graham continues to redefine what appeal to means.
Just because he really really wants appeals to authorities be fallacies.
The rest of the world will move on, understanding that somethings appealing to an authority is perfectly fine, other times less so.
One day he will grow out of it.
The thing is, you can’t define what you mean by "perfectly fine".
Does "perfectly fine" mean that statements are correct because a relevant authority has said them?
And so Gaslighting Graham throws his hands in the air and asks – but what *is* an authority, really? What *are* judgments? How do we decide that we can trust them? What is *trust*.
Readers might appreciate that this move has already been parried:
https://www.drroyspencer.com/2022/12/uah-global-temperature-update-for-november-2022-0-17-deg-c/#comment-1420628
OK, so you’re saying that statements from a relevant authority can be "believed" to be true…in other words, considered more likely to be correct, but not taken to be absolute truth.
In which case, if you’d been paying attention to my comments, there’s no actual disagreement between us.
And so asI already said Gaslighting Graham rediscovers the ad verecundiam.
I am glad that we can all agree that Tyson was right all along.
No, Tyson was wrong. On that we still disagree. He described as an "appeal to authority fallacy" that which actually relates to an "appeal to false authority fallacy".
To rebut Tyson, Gaslighting Graham had to caricature tappelas to authority.
Now that we day establshed how stupid was his caricature, Gaslighting Graham recanted it.
But he *still* insists having shown Tyson wrong.
77 months of trolling like that.
I didn’t "recant" anything, and yes, Tyson is wrong.
The "appeal to authority fallacy" is as I described.
The "appeal to false authority fallacy" is a separate, but related fallacy.
Tyson wrote about the latter whilst claiming it was the former. He was wrong.
Gaslighting Graham gaslights a little more.
Yesterday he was all in on the claim that a appeals to authority are *never* OK.
I proved him wrong, and predicted he would go for one of the silly semantic games we know and love him for.
Here he is today, pretending we agreed all along.
Twas prolly because we do not define an appeal to authority the same way.
🤦
He might as well argue that we agree because we both believe that only fallacious appeals to authority are fallacies!
"Yesterday he was all in on the claim that a appeals to authority are *never* OK."
They’re not. My position has not changed one iota.
What we agree on is that statements from a relevant authority can be "believed" to be true…in other words, considered more likely to be correct, but not taken to be absolute truth.
…and what I describe there is not an "appeal to authority".
Gaslighting Graham gaslights furthermore.
An authority can *only* increase the likelihood of a claim.
An appeal to an authority inherits that property.
In which case appealing to an authority *is* felicitous.
Gaslighting Graham argues that *all* appeals to authorities are invalid.
This is false.
It is always a fallacy to suggest that an authority’s claim is correct simply because they are a relevant authority on the subject in question. That is an “appeal to authority”.
It is not a fallacy to suggest that an authority’s claim might be more likely to be correct because they are a relevant authority on the subject in question. That is not an “appeal to authority”.
It is a fallacy to suggest that a false authority’s claim is more likely to be correct simply because they are an authority on some unrelated subject, or if it turns out they are not really an authority on the subject in question. That is an “appeal to false authority”.
According to Gaslighting Graham, *any* appeal to authority is a fallacy. But when he appeals to an authority, it’s fine. That’s because he does not really “appeal” to an authority. It’s not as an “authority” anyway. It’s a source.
Always the same silly semantic games from our Gaslighting Graham.
He will never grow up.
He will never learn.
https://www.logicallyfallacious.com/logicalfallacies/Appeal-to-Authority
“Exception: Be very careful not to confuse "deferring to an authority on the issue" with the appeal to authority fallacy. Remember, a fallacy is an error in reasoning. Dismissing the council of legitimate experts and authorities turns good skepticism into denialism. The appeal to authority is a fallacy in argumentation, but deferring to an authority is a reliable heuristic that we all use virtually every day on issues of relatively little importance. There is always a chance that any authority can be wrong, that’s why the critical thinker accepts facts provisionally. It is not at all unreasonable (or an error in reasoning) to accept information as provisionally true by credible authorities. Of course, the reasonableness is moderated by the claim being made (i.e., how extraordinary, how important) and the authority (how credible, how relevant to the claim).”
“Dismissing the council of legitimate experts and authorities turns good skepticism into denialism.”
Like Astronomy’s observations of the Moon’s tilted rotational axis, lunar poles, polar celestial coordinates, understanding of synchronous rotation, tidal locking, and libration?
Gaslighting Graham returns to his false authority:
https://plato.stanford.edu/entries/fallacies/
He learns nothing,
It’s you that cannot learn, Little Willy.
Many fallacies take the written form "appeal to x".
It makes no sense to make an exception for "appeal to authority".
So we distinguish between the fallacy "appeal to authority", which is suggesting that an an authority’s claim is correct simply because they are a relevant authority on the subject in question…
…and "deferring to an authority on an issue", which is taking on board that a relevant authority’s claim might be more likely to be correct, but is not to be taken as absolute truth.
That way, nobody gets confused by thinking that something of the written form "appeal to x" may be a fallacy, or maybe not. They know where they stand.
"Appeal to false authority" is a separate, but related, fallacy.
“”Appeal to false authority” is a separate, but related, fallacy.”
And DREMT ought to be quite familiar with this type, with his many appeals to the false Astronomy authorities, Tesla and FTOP. And his appeals to false authority Joe Postma on heat transfer, the GPE and the GHE. But notably not on the Moon, for which he could claim some authority.
And so Gaslighting Graham once again keeps repeating his mantra instead of thinking things through.
His own false authority gets into trouble when he mentions an exception.
That false authority uses the same silly argument Graham did: can be wrong, I therefore is a fallacy.
That false authority uses the same semantic trick I predicted Graham would use:
Appeal, bas.
Deferral, good.
No wonder that false authority cites nobody who would support this crap.
I didn’t repeat any mantra, I actually introduced a new argument, which you have completely failed to even address.
Gaslighting Graham pretends to introduce an argument we already said he would rely on, and forgets that I already introduced it for him three days ago:
https://www.drroyspencer.com/2022/12/uah-global-temperature-update-for-november-2022-0-17-deg-c/#comment-1421083
🤦
All this time he could have studied.
But he cannot learn, so he saved time, in a way.
Little Willy is still not addressing the argument made. So, that’s that. This old argument winner retires in victory, once again.
Gaslighting Graham will deny that his silly argument has already been addressed.
He soldiers on.
The point you have ignored is that logical fallacies often take the written form "appeal to x".
It makes no sense to ignore this convention just for an "appeal to authority", and to have a situation where some say it’s a fallacy, and some say it’s not a fallacy.
What I have written at 7:32 PM, and what I quoted my source saying at 2:40 AM, makes complete sense.
Otherwise we get people going around saying you’re "appealing to authority" every time you link to something. Then some people think that’s a fallacy, and other people don’t. It’s all just a state of total confusion on the matter. All of which can be resolved by sticking to what has been outlined. Which as far as I’m concerned, is correct, in that it makes complete sense.
So that’s that.
[ME, no the January 1, 2023 at 8:11 PM] And since he’s caught in a bind, hell equivocate on the verb “to appeal.”
[GASLIGHTING GRAHAM, THREE DAYS LATER] The point you have ignored is that logical fallacies often take the written form “appeal to x”.
So only appeals are fallacies, and all appeals are fallacies, because why else call them “appeals”?
Graham is a genius.
Meanwhile, back at the ranch:
Those who consider that an appeal to authority can be fine are argumentation theorists.
Those who deny it and regurgitate the silly stuff they memorized in their critical thinking classes are not. Some of them sit on domains and receive passive income without having spent ten minutes thinking about what they wrote. The other is a libertarian freak.
Yeah…you still haven’t really addressed the point.
"So only appeals are fallacies, and all appeals are fallacies, because why else call them “appeals”?"
It makes complete sense, if there is a convention that many fallacies take the form "appeal to x", not to buck that trend for one specific fallacy. Of course, Little Willy can’t see that, because he’s so blinded by the appeal to authority fallacy he keeps making (he is continually claiming, over and over again, that his sources are correct simply because they are relevant authorities).
You obviously prefer the "state of total confusion on the matter" that I referred to previously. I guess it suits your particular style of trolling.
Gaslighting Graham gaslights a little more.
By *defining* appeals as fallacies, he trivializes the problem.
He’s also trying to enforce an interpretation that isn’t the dominant one, a move for which he has no authority.
Even if we grant him the convention he roots for, he’s still wrong on historical grounds.
Graham could have spent his three days reading about fallacy theory instead, but no, he needs to repeat his silly arguments to save face.
🤦
…you obviously prefer the "state of total confusion on the matter" that I referred to previously. I guess it suits your particular style of trolling.
Gaslighting Graham gently gaslights once more.
*Either* the issue is definitional, *or* it’s confusion.
So of course he’ll *define* appeals as fallacies.
(They’re called ad-arguments, but whatever.)
So GG’s argument is straightforward:
Let appeals be fallacies, ergo all appeals are fallacies.
It’s not invalid, so it’s not a fallacy, right?
🤦
…obviously prefer the "state of total confusion on the matter" that I referred to previously. I guess it suits your particular style of trolling.
Gaslighting Graham gently gaslights once more.
Here’s Graham favorite fallacy:
https://en.wikipedia.org/wiki/Ad_nauseam
…prefer the "state of total confusion on the matter" that I referred to previously. I guess it suits your particular style of trolling.
Gaslighting Graham gently gaslights once more.
Little Willy, please stop trolling.
brandon…”Of course cranks such as yourself decry these necessary mechanisms; they have not the skills to develop the reputation necessary to influence mainstream scientific opinion, thus their only recourse is to complain loudly about the playing field not being lowered to their level”.
***
This is why I regard you as an idiot. I get criticized for my long comments, which I find necessary to provide the required detail to support my arguments. Yet idiots like you can manage no more than a couple of lines of ad homs and insults as a rebuttal.
I don’t recall you ever replying to me with anything more than an insult or an ad hom.
Gordon,
You constantly rail against and disparage mainstream scientists, and have been doing so long before I washed up on this shore. You should not expect to get better behavior than you give. Especially not on the Internet.
Brandon, if a “mainstream scientist” can’t accept reality, he’s really not much of a scientist.
C00kie hasn’t a single paper in refereed literature, yet he feels qualified to judge the works of those who do.
Cult-like is not really the best way to describe this. Nuts is more like it.
“C00kie hasnt a single paper in refereed literature, yet he feels qualified to judge the works of those who do”.
***
Here we go again with the appeal to authority, as if having a peer reviewed paper means anything.
Ask Roy and John Christy about peer review. They have trouble getting published simply because they are skeptical of the extremes of anthropogenic warming theory. And here you are, commenting on Roy’s site on the side of those who oppress his right to publish a paper.
Ask Richard Lindzen, who has taught at MIT and published 200+ papers on non-modeled atmospheric science. When he asked about a long-term delay in publishing a paper several years ago, he was advised by the journal editor they were taking so long because of his skeptical views.
Seriously, the rubbish you call science is like a plague slowly spreading through the scientific community. These creeps are blocking science with their biased views about what should be published and what should not be published.
For my part, I am only too happy to have a forum on which to criticize these cretins. I have a deep respect for many scientists but not the idiots who go along to get along and publish trash.
Brandon, you’re not paying attention. Your cult “science” is so bad it can easily be debunked just from basic physics. “Literature” means NOTHING if it defies reality.
Pup,
You are a silly sock puppet who keeps repeating that same silly talking points whatever comment you reply to.
If at least you did the Poll Dance Experiment.
Worthless willard, you still got NOTHING.
Grow up.
That’s where you’re wrong, Jiggly Pup.
I got YOU.
No, Little Willy…you really have nothing.
Keeping crap out of the journals is part of scientists’ *job*, Gordon, not evidence of some sort of conspiracy. And papers which especially challenge current consensus *warrant* special scrutiny.
OTOH, I’m cognizant of Planck’s observation: “A new scientific truth does not triumph by convincing its opponents and making them see the light, but rather because its opponents eventually die, and a new generation grows up that is familiar with it.”
So maybe the luckwarm perspective will eventually become the consensus. Nobody would be happier to see that happen than me.
"And papers which especially challenge current consensus *warrant* special scrutiny."
Not at all. Surely all papers warrant the same level of scrutiny, regardless.
Surely not. A consensus view is typically established by multiple researchers writing multiple papers covering multiple lines of evidence, often from multiple disciplines, over multiple decades.
One would reasonably expect a *single* paper successfully challenging all that to be longer than the average three-pager (or 10-20 if you count the supplementals). For example, Einstein’s original papers (plural) ran to just over 250 pages in total, and that was just barely getting started.
Darwin wrote a whole book as well. Same for Galileo. Both relied extensively on prior works as well as their own observations and novel reasoning.
They, however, are rare examples. More representative of the normal process is the development of plate tectonic theory, which is consistent with what I wrote in my initial paragraph.
What Drs. Spencer and Christy face looks to me to be no more unusual than what any researcher going against the grain of current consensus would … and *have*.
Once again, I write a perfectly reasonable statement, only to be told that somehow it isn’t reasonable.
Sorry for your loss.
OK, let’s deal with your point.
All papers should be given equal amounts of "scrutiny per page".
There you go. Point dealt with.
Allow me to clarify that I’m using page count only as a rough metric. The content of those pages matters — some text is denser than others, especially when math is involved.
I don’t know to which paper of Dr. Spencer’s Gordon was referring, so I don’t know anything about its topic or page length, but I’m probably safe in assuming it’s a small fraction of the prior work done to establish the current consensus of whatever the topic.
As well, that they didn’t simply reject the thing out of hand actually tends to undermine Gordon’s argument here.
OK, let’s adjust the statement accordingly:
"All papers should be given equal amounts of "scrutiny per page", with the exception of densely written pages, especially those containing math, which require greater scrutiny."
Will that be allowed to stand as a perfectly reasonable statement? Or must I be argued with further?
My comments are meant to be illustrative, rather than taken as an exact formula. I doubt any qualified reviewer would give you a hard and fast simple formula either … I imagine it all depends on the complexity of the claims being made and how far they are away from the conventional wisdom.
TL;DR: the best you’re going to get out of me is a fuzzy answer. Sorry.
…but my point is, how far away from the conventional wisdom the claims are should not enter into it. That’s bias. All claims should be equally scrutinized. How is that not anything but completely fair and reasonable?
I can get you a less fuzzy answer, BG:
https://andthentheresphysics.wordpress.com/2020/09/18/the-auditing-problem/
I would not mind if Moon Dragon cranks publish their results on ArXiv.
At this point, *any* model would do.
It definitely would top of episodes with Graham gaslighting. Not that there is no merit in trying to inculcate a rudimentary critical thinking toolkit into him. There is.
Little Willy can’t seem to make a comment without including some personal remarks about me.
Gaslighting Graham cannot fail to gaslight a little, as if he still did not know that almost all papers are never cited or that the replication crisis happened and why it did.
If he wanted to publish a new way to prove that two plus two equals four, few would bother to check than if he wanted to publish that two plus two equals five.
So once again he presumes some kind of pristine principle that he must have learned about in college instead of growing up and realizing that reality works by economics.
So it is not completely fair and reasonable to suggest that all claims be equally scrutinized? OK. I’ve learned something new today.
Graham still ignores that from greater provocative power comes greater responsibility to show your homework. Hitchens said something similar. Hitchens can eff off.
There are many algebras in which 2+2=5, btw.
Graham still ignores that from greater provocative power comes greater responsibility to show your homework. Hitchens said something similar. Hitchens can take a hike.
There are many algebras in which 2+2=5, btw.
OK, Little Willy. I’m learning that you always think you are right, and I am wrong, about literally everything. I can’t even express an ideal without being told I’m "wrong".
…and it doesn’t even matter what position I take. If I’d taken the opposite position, and backed Brandy Guts, you would no doubt have come in arguing against me (but not BG, of course).
Brandon R. Gates says:
”Keeping crap out of the journals is part of scientists *job*”
Not true! If you want to top your toilet from spilling crap off your bathroom floor; you hire a professional, not a fly by nighter who thinks he can do the job.
If you need to hire a plumber to unclog your toilet, Bill, may I suggest that you work on your manual skills?
If all I need is a plunger the crap doesn’t end up on the floor in the first place Willard.
Sometimes you would need more than that, Bill:
https://www.canadiantire.ca/en/pdp/mastercraft-toilet-auger-0638793p.html
Your example sucked, but I agree with you – scientists should get paid to review.
Only two left! Bill should hurry … he might need them both.
Willard if you and Brandon are stupid enough to think that device is likely to keep shit off the bathroom floor you are probably stupid enough to keep crapping in a clogged toilet.
Funny you mention that, Bill, for I used an auger less than one month ago.
Something tells me you are not the one who does the repairs around your house.
Never had a need for one of those. The only time I ever had a clog that I couldn’t clear properly using a plunger the clog was nearly 50feet from the toilet and required a powered sewer snake run through an exterior cleanout. Do you think that the only thing a professional plumber does is run a Rotorooter truck?
So once again you shit on something you know nothing about, Bill.
There you go again having an opinion on something you know practically nothing about.
I once spent about 3 months doing plumbing for a property management service before deciding I didn’t like the job. Most of the work but not all involved clogs in lines. Very few morons called us to use a plunger and none called us to a job that a toilet auger would have been the best choice. Most people can figure that out how to use a plunger, perhaps not you. Maybe you can regale us with your experience of when and why a toilet auger was necessary.
Fact is if you get shit on the floor from a clog that you can clear with that stupid toilet auger it is only because somebody was stupid enough to keep shitting in the clogged toilet as I said above.
The other way to get shit on the floor is in a two story structure where the clog is clogging up the main sewer line and all the shit from the 2nd floor bathroom exits out the 1st floor toilet.
As they say a plumber assistant only needs to know two things 1) Shit rolls down hill; and 2) payday is on Friday. Shit doesn’t roll up hill from a clogged toilet unless you continue to stupidly use it but shit will pour out of a downhill toilet if the sewer is clogged
You actually have a better chance of doing it with a plunger if you know how to seal the branch and vent lines. But there are simpler methods. The plunger works fine for trap clogs if you know how to use one.
Bill, Bill,
You don’t know what you’re talking about, and you often pontificate on stuff you know nothing about.
And I’m an expert on *that*.
That’s true. Little Willy is indeed an expert at pontificating on stuff he knows nothing about.
Willard says:
”You dont know what youre talking about, and you often pontificate on stuff you know nothing about.
And Im an expert on *that*.”
How could you be? Even your reply is 100% pure bluster.
I don’t expect anything. You on the other hand seem to have an unrealistic adoration of scientists. They are human beings like everyone else, even the likes of Einstein, and like other humans they are susceptible to error.
Scientists are not gods, even though in their minds, some of them think they are.
Einstein has been raised to the status of a god and when I was younger I succumbed to that illusion even though I knew nothing about him. It has not been till recently that I have been open to criticism about Einstein and what I am seeing is not flattering.
The inventor of the atomic clock, Louis Essen, criticized Einstein as follows. He claimed Einstein’s theory of relativity is not even a theory, but a collection of thought-experiments. He went further, claiming E. did not understand measurement.
So, do you examine these critiques or do you fall in line and reject Essen out of hand simply because he dared to criticize Big E? Many have automatically fallen in line. That is not in my constitution, especially since I had been questioning the existence of time long before reading Essen.
Obviously you are the type who feels comfortable getting in line, the type of sheeple who will follow the lemmings off the edge of the cliff simply because everyone else is jumping. From that perspective, you will never understand why people like me become skeptical.
“you will never understand why people like me become skeptical.”
Yes we do. It is called conservatism, mixed in with some dementia and paranoia. It must be a lonely place for you in this modern world.
stupidb….I don’t recall ever seeing your post something intelligent. You would be an authority on dementia and paranoia.
…. and also because like all engineers, you were failures at the hard science subjects.
I bet you still use a slide rule, have a pen in the top pocket of your shirt, and have a crew cut.
> Obviously you are the type who feels comfortable getting in line
Very much no, Gordon. I’m simply aware of my limitations as a non-scientist to judge their work. Ultimately I have no choice but to rely on their own process to separate the wheat from the chaff. That does NOT mean that I don’t ever take a skeptical and critical eye to their claims, or that they are infallible super-humans, it just means I’m realistic about my (in)ability to properly understand and comprehensively evaluate what I read in the primary literature.
YOU are in the same boat as I. Ultimately so are scientists themselves as they cannot analyze every claim with the same diligence that was put into making it. Trust in the process is essential to function in science, especially for working scientists, and it is wrong for you to disparage that trust.
Finally, it is preposterous for you as an unpublished individual to place yourself at the same level as those who are and expect to be treated as a credible authority.
Brandon, you can abuse your keyboard endlessly, but you never get things right.
You’re so impressed with “peer review” and “publishing” that you can’t see it’s a failed system. How did “tidal locking” ever get past “peer review” when it’s clearly a violation of physics. You just don’t understand any of this, and you can’t learn.
You don’t even have any common sense. You can’t answer simple questions like:
1) Do passenger jets fly backwards?
2) Can ice cubes boil water?
You’re just a braindead cult idiot posing as an ingnorant troll.
Re: ice cubes
https://www.drroyspencer.com/2022/07/updated-atmospheric-co2-concentration-forecast-through-2050-and-beyond/#comment-1338142
Why must you lie, C00kie?
Re: jet airliners. You ducked my question about the universal law of gravitation being a First Principle or not.
Quid pro quo.
So your answer to 2) was "no". Why not just say that?
a) I shouldn’t have had to.
b) His question was a red herring in that subthread.
Well, if it’s OK to not have to answer questions because you’ve already been over similar ground in previous discussions, then I guess I never have to answer any questions about the moon issue, or the plates issue, ever again. Excellent.
Yes you’re perfectly within your rights to refer to previous answers so long as they do actually address the question at hand. And to call a liar those who claim you haven’t … just as I have done with C00kie.
Odd that you don’t credit me that point.
But not really.
I can sort of half credit you that point…only half credit you, because you didn’t actually volunteer a direct, straightforward "no"…it had to be inferred from your wafflings.
Thanks, I’ll take it.
…and I’ll take that I don’t have to answer any more questions on the issues that I’ve discussed a hundred times over already. Bliss.
Gaslighting Graham gaslights a little less, then a little more.
You’re attempting to gaslight the "audience" through argument by repeated assertion that I "gaslight". You’re apparently hoping that if you say this lie enough times, it will stick. I can see through it, I assume others will too.
Gaslighting Graham gaslights the audience by portraying himself as some kind of hall monitor who applies quid pro quo even handedly but never does.
Since he lost the Moon argument and the authority argument, it is obvious that he is baiting BG toward another Dragon Crank talking point.
You’re apparently hoping that if you say this lie enough times, it will stick. I can see through it, I assume others will too.
So Brandon tentatively, cautiously, timidly almost admits that ice cubes can not boil water.
Will his cult discipline him?
His cult has the made-up formula that means that ice cubes can boil water. In fact, using the same nonsense, ice cubes could melt steel.
Brandon has a lot to learn….
So C00kie continues tediously strawmanning like the PRATT that he is.
I would be worried if he didn’t.
brandon…”Im simply aware of my limitations as a non-scientist to judge their work”.
***
Can you read? Can you think objectively? If so, where is it written that you cannot critique scientists? And even if it is written, why do you pay it any heed?
There is no reason why you could not teach yourself physics or math to the level of a Ph.D in a university system. However, you don’t need to learn to that level to understand physics at a general level.
Many of us in society have been brow-beaten into not thinking for ourselves, therefore we turn to authority figures. Some of us have become aware of our conditioning and taken steps to break out of it.
If you go on a blog and offer your opinion that a scientist is wrong, you will likely get very little in the way of positive feedback. You will receive much in the way of ad hom attacks, insults, red-herring arguments, etc., but very little in the way of positive feedback or criticism.
Occasionally, you will find some who agree with you but you don’t want to take that so seriously that you become blinded to the reality. So, you keep refining, trying to clarify what you understand to be true.
Having attended university studies in engineering, I am only too familiar with the mindset that thinks he/she knows something and gets hung up on ‘knowing’. We must always beware knowing…having knowledge. Once it sets in, insight and learning stops.
For me, one of the worst scenarios is suddenly realizing what you thought was right was completely wrong. I went back to university with experience in electronics, having been self-taught in transistor theory. It was not till I got into transistor theory formally that I realized my error. Still, I had been able to repair transistor circuits with my incorrect understanding.
When I present my theories on this blog, I am totally aware that what I claim could be proved wrong. However, when you study engineering, you learn methods to ensure you keep errors to a minimum. Furthermore, those of you who think I am full of it cannot prove me wrong.
No one on Roy’s blog has come near to proving the catastrophic anthropogenic warming theory or proving the Moon rotates on a local axis. Extending that to the authority figures like the IPCC or NASA, neither of them has proved CO2 is warming the atmosphere or that the Moon rotates on a local axis. When I challenged NASA on the subject, they did not disagree with me, they simply move the goalposts from a local inertial reference frame to the stars.
You can critique anyone all you want, Gordon. The question is why I should listen to you. Those who have the training to understand the arguments can judge that on the merits of them, or lack thereof as the case may be. The rest of us can only really rely on trusting the review process despite its warts and fallibilities.
As I mentioned before, even scientists themselves must trust the same process — they don’t have time to evaluate every single piece of crap that comes down the pipe.
Your work is cut out for you. It ISN’T posting screeds on this blog.
Good luck.
brandon…”YOU are in the same boat as I”.
***
No, we’re not. I have studied physics and learned to apply it. Engineering is called Applied Science and before you can apply it, you have to fully understand basic physics. My field, my specialty, electronics, is part of physics and based in quantum theory. I studied the basic of quantum theory as part of my engineering and electronics training.
Today, they actually offer courses in quantum theory. When I studied, no mention was made of quantum theory, it was only in looking back at what I studied in electronics and chemistry courses that I realize I was studying quantum theory. When you do any kind of study related to atoms and electron orbitals, you are studying quantum theory.
However, we also did a course in physical chemistry which goes deeply in the theory of thermodynamics. Again, I had no idea why I was taking the course, some of them were aimed at students going in engineering disciplines that used thermodynamics, like chemical engineering.
I have never claimed to be as smart as or on par with scientists who specialize in a field. Then again, the scientists we are discussing here in general have no particular specialty for which I am not trained to discuss.
For example, Gavin Schmidt of NASA GISS revealed a complete lack of understanding of positive feedback. I have far better training in the field as well as applying positive feedback principles. The scary part is Schmidt uses positive feedback principles in climate models. Here we have a guy applying a theory he cannot explain.
> I have never claimed to be as smart as or on par with scientists who specialize in a field.
Yet you claim major flaws with well-established theory, Gordon. There’s a disconnect here.
Brandy Guts, please stop trolling.
Thanks for the win!
#2
Brandy Guts, please stop trolling.
“The earliest scientific predictions from the 1970s was for global cooling. It was not till the late 1980s that con men like Al Gore and James Hansen of GISS began spreading the bs about anthropogenic warming.”
The myth of the 1970s global cooling scare arose not from citations to the scientific literature but to news media coverage. Topping the list of this “evidence” was the frequently cited Newsweek story from 1975 titled “The Cooling World” https://iseethics.files.wordpress.com/2012/06/the-cooling-world-newsweek-april-28-1975.pdf.
The climate science literature of the time shows that emphasis on greenhouse warming dominated the literature even then. The literature shows that the temperature graph in the Newsweek article was dominated by the Northern Hemisphere trend, whereas the Southern Hemisphere trend seemed to be headed in the opposite direction.
Extraordinary claims require extraordinary evidence. Carl Sagan.
The world’s inhabitants, including scientists, live primarily in the Northern Hemisphere. It is quite natural to be concerned about events that occur close to home and neglect faraway events.
Both my study and research by others support the conclusion that the global cooling hoax was based, in large part, on a Northern Hemisphere cooling trend that was out of phase with a warming trend in the Southern Hemisphere.
It’s time that sceptics woke up to this fact and stopped endorsing that conjecture.
Maybe…if you stopped changing nyms, people might take you seriously.
Where is a link to your study and research? Most scientists would have no problem linking to theirs.
Are you accusing NCAR of a deliberate hoax?
Why do you insist on quoting false prophets like Sagan?
Perhaps you’ll like this quote better:
After eating an entire bull, a mountain lion felt so good he started roaring. He kept it up until a hunter came along and shot him… The moral: When you’re full of bull, keep your mouth shut.
TYSON MCGUFFIN says:
”The myth of the 1970s global cooling scare arose not from citations to the scientific literature but to news media coverage. Topping the list of this evidence was the frequently cited Newsweek story from 1975 titled The Cooling World https://iseethics.files.wordpress.com/2012/06/the-cooling-world-newsweek-april-28-1975.pdf.”
Thats pretty good post Tyson. If you look at the NCAR cooling data provided to the article for 1940-1970 you should note that NCAR managed through the grant funding to erase about 50% of that cooling. Heck maybe if we wait another 50 years it will all be gone.
Do you suppose that the cooling that disappeared was the 50% of the cooling that was anthropogenic in nature?
Heck they were even talking about then to pollute the arctic with soot to counteract the cooling!! Do you suppose that led to getting China involved in ramping up dirty coal plants?
The world’s inhabitants, including scientists, live primarily in the Northern Hemisphere. It is quite natural to be concerned about events that occur close to home and neglect faraway events.
Both my study and research by others support the conclusion that the global cooling hoax was based, in large part, on a Northern Hemisphere cooling trend that was out of phase with a warming trend in the Southern Hemisphere.
It’s time that sceptics woke up to this fact and stopped endorsing that conjecture.
Where is your paper?
Here is mine, Bill:
https://climateball.net/but-70s/
Where is yours?
You aren’t keeping up Willard.
Gordon said: ”The earliest scientific predictions from the 1970s was for global cooling.”
Tyson put up a supporting link from the National Center for Atmospheric Research that doles out large portions of grant money for scientific research out of Boulder Colorado that supports Gordon’s statement. https://www.drroyspencer.com/2022/12/uah-global-temperature-update-for-november-2022-0-17-deg-c/#comment-1422577
Tyson then explained: ”The myth of the 1970s global cooling scare arose not from citations to the scientific literature but to news media coverage.”
And indeed NCAR was established a MIT in 1960 by the National Science Foundation. There mission is provide the atmospheric and related Earth system science community with state-of-the-art resources, including supercomputers, research aircraft, sophisticated computer models, and extensive data sets. You know feed information to scientists and the public!
I think its a bit odd to call NCAR the news media but I guess that is part of their mission. They do provide information for the media and that is apparent in Tyson’s link.
So to get to the point Tyson said he had some papers on why all that was wrong and I was just asking him to show us.
Yes Willard your linked page says it best, and I quote: A comprehensive study of the papers at the time reveals that AGW dominated the peer-reviewed literature even then.
It even references the April 28, 1975 Newsweek story linked in my original post.
Are you suggesting that I should keep as much as the toilet you cannot unclog, Bill?
You think a lot of things but never offer any evidence.
For an auditor, that sucks eggs.
"A comprehensive study of the papers at the time reveals that AGW dominated the peer-reviewed literature even then."
Sure, but there was still a 1970s global cooling scare, even so. So it’s not a "myth", is it?
As usual with the climate narcissists, they want to go so far the other way in "debunking" claims that they try to eradicate from history things that we all know happened.
No, it’s not a "myth". There was a 1970s global cooling scare. That it wasn’t backed by "the science" is par for the course. It’s kind of like the so-called 97% consensus claims that were sensationalized by the media that turn out not to be the case.
Gaslighting Graham gaslights a little more.
The myth is this:
https://archive.vn/6N39i#selection-525.0-567.161
Graham just can’t resist redefining words.
If you agree there was a 1970s global cooling scare, we have nothing to argue about. Sorry, I know you hate that.
Way to move the goalposts!
Graham just can’t resist redefining words.
Little Willy can’t resist redefining words, and Brandy Guts moves the goalposts.
https://climateball.net/but-70s#myth
Was there a 1970s global cooling scare or not? Yes or no?
> It’s kind of like the so-called 97%
https://climateball.net/but-consensus#97
Oh, there’s a consensus. It isn’t (or at least, wasn’t) as high as 97%, though. I remember reading through the various studies and discussions on the issue, back in the day. Kind of tedious to go through it all again.
https://www.forbes.com/sites/uhenergy/2016/12/14/fact-checking-the-97-consensus-on-anthropogenic-climate-change/?sh=233367ad1157
https://climateball.net/but-consensus#97
Yeah, it’s definitely not that high.
Nat. Academy of Science Report 1975 on this issue that was referenced in the Newsweek article.
https://archive.org/stream/understandingcli00unit/understandingcli00unit_djvu.txt
Pretty clear that their main message is
‘We don’t know enough about climate change. We cannot currently predict it. We need to do research.’
“Our knowledge of the mechanisms of climatic change is at least as fragmentary as our data. Not only are the basic scientific questions largely unanswered, but in many cases we do not yet know enough to pose the key questions. What are the most important causes of climatic variation, and which are the most important or most sensitive of the many processes involved in the interaction of the air, sea, ice, and land components of the climatic system? Although there is evidence of a
strong coupling between the atmosphere and the ocean, for example, we cannot yet say that we understand much about its consequences for climatic change. There are also indications in paleoclimatic data that the earth’s climates may be significantly influenced by the long-term astronomical variations of the sun’s radiation received at the top of the atmosphere. But here again we do not yet understand the processes that may be involved.
There is no doubt that the earth’s climates have changed greatly in the past and will likely change in the future. But will we be able to recognize the first phases of a truly significant climatic change when it does occur? Like the familiar events of daily weather, from which the
climate is derived, climatic changes occur on a variety of space scales. These range from the change of local climate resulting from the removal of a forest, for example, to regional or global anomalies resulting from shifts of the pattern of the large-scale circulation. But unlike the weather, variations of climate take place relatively slowly, and we may think in terms of yearly, decadal, and millenial climatic changes. But the system is complex, and the search for order in the climatic record
has only begun.
Even the barest outline of a theory of climate must address the key question of the predictability of climatic change. This question is closely tied to the limited predictability of the weather itself and to the predictability of the various external boundary conditions and inter-nal transfer processes that characterize the climatic system. Although there is evidence of regularity on some time scales, the climatic record includes many seemingly irregular variations of large amplitude. How
do we separate the genuine climatic signal from what may be un-
predictable “noise,” and to what extent are the noise and signal coupled?
These are important questions, and ones to which there are no ready answers. The determination of the climate’s predictability will require the further development and application of both theory and dynamical models, along with a greatly expanded data base. The answers, when they are found, will determine the limit to which we can hope to predict future climatic variations.”
“
…it’s definitely not that high.
“Was there a 1970s global cooling scare or not? Yes or no?”
No. Not according to scientists at the time.
The Newsweek article was very flawed, IMO.
The chart shows a drop of about 0.5 F, since the peak in 1940s, in the Northern Hemisphere.
‘Others regard the cooling as a reversion to the little ice age’
But the NH Temperature had only reverted to its ~ 1920s value, the middle century slightly warmer period was only a brief 30 years, and it also stated that
“around the equator the T had risen by a fraction of a degree”
BTW the article author later stated:
“Gwynne concedes that he got a little ‘over-enthusiastic’ in the original article and highlights some of the failings of science journalism in generalscience writers should ‘seek out what the science doesn’t imply as well as what it does,’ he suggests.
…definitely not that high.
Nate says:
”Gwynne concedes that he got a little over-enthusiastic in the original article and highlights some of the failings of science journalism in general science writers should seek out what the science doesnt imply as well as what it does, he suggests.”
Apparently hardly anybody has taken that advice yet. Does Gwynne follow his own advice today?
It appears he is just spouting off.
stupid b….”. and also because like all engineers, you were failures at the hard science subjects”.
***
That proves your ignorance. Engineers study the same physics as physics students but at an honours level. Not only that, engineers have twice the workload of a science student. You don’t get into engineering if you are a snotty-nosed science fairy.
Scientists generally have PhDs based on many years of intense study. They are trained researchers.
Engineers generally only have degrees and are trained to make widgets.
An engineer commenting on scientific topics is like a farmer commenting on brain surgery.
Stupidb, your PhDs in physics have a pathetic record here. One incompetent PhD teaches that fluxes simply add which would result in ice cubes boiling water. One believes Sun can raise Earth’s temperature to 800,000K! and one believes that because something very hot can burn you that “proves” CO2 can heat the planet.
And, all 3 believe in the GHE nonsense.
So, a PhD in physics means NOTHING.
Why limit it to 800,000k? They claim there is no limit.
I suppose they could be right though if they can figure out how to make an ice cube go nuclear.
They seem to be imagining an entirely new chapter of the book on thermodynamics though.
Two lightbulbs make a surface brighter than one lightbulb. Those two fluxes do ‘simply add’. Irradiances add. Period. Nothing in this statement suggests ice could boil water.
******************
For the record, the quote is:
“In a single second, Earth absorbs 1.22E27 joules of energy from the Sun. Distributed evenly over the mass of the planet, the absorbed energy would raise Earth’s temperature to nearly 800 000 K after 1 billion years, if Earth had no way of getting rid of it.” (emphasis added).
Clearly there is no expectation that that sun *can* actually raise Earth’s temperature to 800,000 K, since there clearly *is* a way for earth to get rid of energy (ie thermal radiation).
This is hyperbole, to make the point that IR radiation is crucial to understanding earth’s energy balance.
********************
I have no idea what the last claim is about.
********************
More fraud, Fraudkerts?
The issue is NOT about reflection. The issue is about two fluxes, F1 and F2, being absorbed by a surface, and then resulting in a temperature that emits F1+F2. That does NOT happen. Saying it does is FRAUD.
***
Yes, it is “hyperbole”, aka bullshit. Responsible people do not do that.
***
“I have no idea what the last claim is about.”
You have no idea about any of this, fraudkerts.
“The issue is NOT about reflection. ”
Of course not. No one said it was.
“The issue is about two fluxes, F1 and F2, being absorbed by a surface, and then resulting in a temperature that emits F1+F2. ”
This is about the clearest statement you have made about the issue. Congratulations.
And this is exactly what happens. At steady state, the total power in to a surface must equal the total energy out from the surface.
A single flux F1 being absorbed ultimately results in a flux of F1 being emitted (at the appropriate temperature to emit F1).
A single flux F2 being absorbed ultimately results in a flux of F2 being emitted (at the appropriate temperature to emit F2)
But if you can get BOTH fluxes there simultaneously, then a net flux F1 + F2 being absorbed ultimately results in a flux of F1+f2 being emitted (at the appropriate temperature to emit F1+F2).
************************
The idea of “ice boiling water” is purely Clint’s misunderstanding. If a flux of 315 W/m^2 is being absorbed at a surface, and if that flux comes from ice emitting 315 W/m^2, then the only possibility is that the ice is every direction from the surface (the entire dome over the surface). Geometry precludes adding any more ice and getting any more flux (which is exactly what physics says).
On the other hand. if a surface is emitting 630 W/m^2, then it only needs to be in only half of the directions (cover half the dome; cover half of the solid angle above the surface). And then it provides 315 W/m^2 to the surface. This would be F1. Then consider a second flux, F1, coming from the other half of the dome. These two fluxes can be added with no geometry problem.
“Of course not. No one said it was.”
You tried to use lightbulbs, fraudkerts. Light is being REFLECTED when it arrives at a surface, fraudkerts. This issue is NOT about reflection.
Thanks for being such a good example of a fraud. You rarely make a comment without committing fraud.
More examples, please.
How about the Pole Dance Experiment, Pup?
How about please stop trolling, Little Willy?
Gaslighting Graham gaslights a little more.
Little Willy, please stop trolling.
Little Willy is questioning his own sanity.
“Light is being REFLECTED when it arrives at a surface…”
and the rest is non-reflected.
When there are two light sources providing a flux to a surface, the total reflected flux is the sum of the two individual reflected fluxes. [making the surface look twice as bright]
When there are two light sources providing a flux to a surface, the total non-reflected flux is the sum of the two non-reflected individual fluxes. [warming the surface twice as effectively]
When there are two light sources providing a flux to a surface, the total arriving flux is the sum of the two arriving individual fluxes.
Since you seem to agree that the first is true, then logically, the other two must also be true.
“You tried to use lightbulbs, fraudkerts. Light is being REFLECTED when it arrives at a surface, fraudkerts.”
Which WAS true when shining lights on reflective surfaces, used simply to demonstrate that fluxes arriving at the same surface do indeed ADD.
But in your problem, you stated that F1 and F2 are abso.rbed so those must be black surfaces, and naturally Tim analyzed what would happen in THAT case.
“This issue is NOT about reflection.”
Nor did he try to make it about reflection!
And unless you think Conservation of Energy is invalid, he obviously did the analysis correctly.
And why are you not rebutting anything in his analysis?
Go back to farming.
stupidb…how many engineers with Ph. D’s have you observed? Philip Latour, has a Ph.D in chemical engineering. Here’s a link to a paper by him…
https://principia-scientific.org/thermodynamics-is-essential-for-understanding-effect-of-co2-on-temperature/
You have a jaundice view of engineers. No doubt, in your ignorance, you are comparing engineers (applied scientists) to locomotive engineers.
Remember the challenger disaster. Guess who was called in to solve this engineering stuff-up?
Richard Feynman, theoretical physicist and winner of the 1965 Nobel Prize in Physics.
Feynman didn’t have to use much physics to find the cause of the disaster. The engineers had already warned NASA, IN WRITING, that the O-rings would fail in freezing temps. Feynman merely took the word of the engineers, dropping the O-rings in his ice-cooled soft drink, to verify they became inflexible.
Feynman was a great physicist, he always embraced reality.
NASA was sued by the families of the astronauts killed. The settlements were not disclosed, but the money came from taxpayers. No NASA management got jail time, so another disaster occurred killing 7 more astronauts. Lawsuits, undisclosed settlements with taxpayers dollars, and no jail time.
Rinse and repeat.
NASA is just as corrupt today as back then. Funding is more important that truth, science, or reality.
“Principia Scientific International (PSI) is an organisation based in the United Kingdom which promotes fringe views and material to claim that carbon dioxide is not a greenhouse gas. PSI was formed in 2010 around the time they published their first book, titled Slaying the Sky Dragon: Death of the Greenhouse Gas Theory.
In 2013, PSI also began to promote unfounded claims that wind turbines make people sick and that childhood vaccines were one of the largest most evil lies in history.
The two named directors were John OSullivan, of the UK, and a Walter James OBrien.”
Need I say more? (I will if asked..)
stupid b…”Principia Scientific International (PSI) is an organisation based in the United Kingdom…”
***
Very scientific, attack the messenger while ignoring the content of an article by an expert, who also happens to be a chemical engineer.
I can tell you from experience that there is a strong correlation between the status of the publisher and crap arguments.
John O’Sullivan has form – believe me.
> attack the messenger
I’ll double down, Gordon. Latour isn’t an atmospheric scientist and his article is not published in a refereed journal. The opinions expressed are directly contrary to the consensus of a large number of qualified published researchers. Those facts alone are sufficient to dismiss it as probably false and not waste any further time with it.
But I’ll rehash one point just for kicks: that the “greenhouse effect” violates 2LOT. This argument is easily falsified by the common everyday experience of putting on clothing to keep warm.
Sorry Brandon but you’re all messed up, again.
Clothing, as insulation, does NOT violate 2LoT. The heat transfer is from “hot” to “cold”, not a violation. Earth’s atmosphere acts as insulation between Earth and the cold of space. Again, that is NOT a violation of 2LoT.
The violation of 2LoT comes when your cult claims a cold sky can warm a warmer surface. THAT is your GHE violating 2LoT.
As always, C00kie fails to mention that insulation is an example of a cooler object keeping a warm object warmer than it would be otherwise.
As always, Brandy Guts fails to mention that GHGs are not the planetary insulators.
As always, Graham fails to understand how greenhouse gasses make the atmosphere a more effective insulator than it would be without them.
Good point, DREMT.
Brandon doesn’t seem to understand how Earth loses energy to space. He also errs by trying to compare Earth to an “Earth” that doesn’t have an atmosphere? That’s as stupid as comparing Earth to an imaginary sphere.
What his cult fails to understand is that science deals with reality. Making things up aint science.
Maybe Brandon will understand, when he grows up.
C00kie fails to understand that the outermost layer of his jacket is also how his body loses heat to the environment.
Doesn’t look like he’s in any rush to grow up, Clint.
Looks like Gaslighting Graham is gaslighting a little more, BG.
Little Willy’s feeling left out again.
Pup feels out of shape.
He should do the Pole Dance Experiment.
It would also help him grow.
You’re not even on the right topic.
brandon…”As always, Graham fails to understand how greenhouse gasses make the atmosphere a more effective insulator than it would be without them”.
Maybe you could explain how a gas making up 0.04% of the atmosphere acts like an insulator. According to your theory, a few threads of a blanket or jacket could keep you as warm as a full jacket.
Maybe you could ask C00kie how a trace gas cools the atmosphere, Gordon.
brandon…”The opinions expressed are directly contrary to the consensus of a large number of qualified published researchers. Those facts alone are sufficient to dismiss it as probably false and not waste any further time with it.
But Ill rehash one point just for kicks: that the greenhouse effect violates 2LOT. This argument is easily falsified by the common everyday experience of putting on clothing to keep warm”.
***
Latour has a Ph. D in chemical engineering and a large part of his work over the years has involved thermodynamics. He has designed systems to control heat process. I don’t care what your mythical published wusses have written, Latour has walked the walk.
Putting on clothing to keep warm has nothing to do with the 2nd law per se. However, it does corroborate the fact that heat can only be transferred, by its own means, from hot to cold.
As Swenson likes to point out, if the body wearing the insulation is dead, it will produce no heat, and no amount of insulation will keep it warm.
The means by which GHE and AGW violate the 2nd law is by claiming a heat transfer from a colder atmosphere to a warmer surface that provided the energy to heat the GHGs via radiation. The 2nd law as stated by Clausius is that heat can NEVER be transferred, by it’s own means, from a colder body to a hotter body.
The GHE gets even more stupid, claiming that infrared energy trapped by glass is warming the greenhouse. R. W. Wood proved in 1909 that the theory is wrong. He reached the obvious conclusion that a greenhouse warms because heated air molecules are trapped by the glass. The GHE claim that molecules of CO2 in the atmosphere can do the same is sheer nonsense.
In other words, you could remove all CO2 and WV from a greenhouse and it would warm just the same. IMHO, removing all CO2 and WV from the atmosphere would do the same. In other, other words, we build greenhouses to do what the atmosphere cannot do. I believe that came from Joe (forgot last name).
> Latour has a Ph. D in chemical engineering and a large part of his work over the years has involved thermodynamics. He has designed systems to control heat process. I dont care what your mythical published wusses have written, Latour has walked the walk.
See, Gordo?
That is an appeal to authority.
Ask Graham for details, he might not try to gaslight you.
Little Willy can learn! Amazing.
And since I showed that appealing to an authority can be infelicitous, I obviously corroborated Gaslighting Graham’s thesis that all appeals to authority are so…
🤦
Oh, you have regressed again.
🤦
> As Swenson likes to point out, if the body wearing the insulation is dead, it will produce no heat, and no amount of insulation will keep it warm.
The presumption was that your heart was beating and you were breathing when you got dressed, Gordon.
“…was…”
Brandy Guts “was” very quick to take just a tiny portion of Gordon’s comment and make some snide little remark, whilst ignoring all the rest.
Gaslighting Graham, whose interpretation of “of its own accord” in one formulation of the Second Law, is….
wait
isn’t that the same silly semantic games he’s playing with “authority,” “appeal,” and all the rest?
You are the one with all the “silly semantic games”, Little Willy.
Gaslighting Graham gaslights with yet another No U.
A well-warranted no U.
Education. Reputation. Track record. Station. Dignity.
None of this matters to Gaslighting Graham.
FALLACY MAN STRIKES AGAIN
Little Willy seems to be completely losing it.
Willard says:
Education. Reputation. Track record. Station. Dignity.
————————
Wow! Little Willy is going to try playing his privilege card.
Oh, Bill.
Please remind me how many times you handwaved to your auditing status.
> Brandy Guts was very quick to take just a tiny portion of Gordons comment and make some snide little remark, whilst ignoring all the rest.
Graham should review my January 4, 2023 at 4:50 PM and note that his snarky response didn’t address my single point at all.
Not really sure what your point actually was, Brandy Guts. Happy to deal with your 3:58 PM response, which you addressed to me, rather than Clint, however.
"As always, Graham fails to understand how greenhouse gasses make the atmosphere a more effective insulator than it would be without them."
That’s not the GHE, Brandy Guts. It is not argued by GHE defenders that the non-GHGs in the atmosphere are the planetary insulators, whilst the GHGs just add to their efficacy. It is not, for instance, argued that 32 K of the mythical 33 K temperature difference is accounted for by non-GHGs, whilst GHGs just add that 1 K of extra insulation. It is argued that GHGs are entirely responsible for the 33 K.
So your response to me rings hollow.
Dr Roys Emergency Moderation Team says:
”So your response to me rings hollow.”
——————————
Yep that is their ‘game’. You ask them to explain how the climate is getting warmer and they accuse you of denying the climate is getting warmer. As if the climate getting warmer is the only needed evidence of the cause.
And Willard is right there fretting over respect for his superior status. A self appointed leader still looking for affirmation of his privileged status as a leader.
Willard says:
Oh, Bill.
Please remind me how many times you handwaved to your auditing status.
————————–
Nope I am not handwaving like you are doing Willard.
I am asking questions and when challenged about my qualifications to ask questions I point out that is what auditors do.
Its not my job to answer the questions also; yet that is the only response one gets when being shined off. Auditors, Detectives, and Columbo see right through that approach.
studentb says:
”Principia Scientific International (PSI) is an organisation based in the United Kingdom which promotes fringe views”
——————–
Not something I fret over.
More concerning is when the inventor of mRNA vaccines gets blocked by social media when talking about vaccines and their risks.
willard…”See, Gordo?
That is an appeal to authority.”
***
No, it’s not. I was not using Pierre Latour as a source, I was explaining his credentials. I had originally presented Latour as an example of an engineer with a Ph. D who knew what he was talking about.
Some idiot implied that engineers are not scientists and don’t understand physics, which could only come from a mind that fails to understand what engineers study. By the end of 2nd year we have covered all the math that a B.Sc covers in 5 years.
The truth is that engineers are among the elite of academia and a chemical engineer like Latour is at the top of that heap.
bill hunter…”More concerning is when the inventor of mRNA vaccines gets blocked by social media when talking about vaccines and their risks”.
***
Or when a former VP at Pfizer speaks out against mRNA vaccines and is censored by the same media.
I have referenced Stefan Lanka on this blog only to have him slammed by alarmists. Lanka discovered the first virus in the ocean and successfully convinced a German Superior court that no scientific evidence exists to support the discovery of the measles virus. He proved it to the court and a court-appointed expert on viruses agreed with him.
It’s important to note that he did not claim measles does not exist, only proof that a virus has been physically isolated as the cause. The point of Lanka offering 100,000 Euros as a prize to anyone who can prove a measles virus exists was to draw attention to the non-science behind virology in general. We have all been conned into believing that viruses exist when few of them have been properly isolated.
For the more obtuse among us, neither Lanka nor I have claimed viruses don’t exist, only that the proof offered of their existence is either no-existent or very poorly presented. Lanka bases his claim on a painstaking investigation into the history of viruses.
Anyone performing such an investigating must feel aghast at the lack of actual science done to prove viruses do exist. By 1935, one scientist lamented that no virus known could meet the demands of Koch’s hypothesis, at the time, the gold standard for identifying an infectious agent like a virus or bacteria.
The turning point came in the early 1950s when a scientist received a Nobel for claiming a viral infectious agent without supplying any proof to back his theory. He received the Nobel for a theory.
In the 1970s, the Louis Pasteur Institute put forward a method for physically isolating and identifying a virus. The final step was to view the virus on an electron microscope. When Luc Montagnier tried the method on HIV he could see nothing on the EM, so he inferred a virus. He openly admitted that on a hour long interview that is still available on the Net.
Since then, all major viruses identified have been done using Montagnier’s inferential method. None of them, like any of the SARS viruses, including covid, have been seen on an EM. There are certainly fraudulent fakes of such viruses on the Net but an expert like Lanka can dismiss them quickly.
An EM can produce only images in black and white and a size-marker has to be included to show the relative sizes. There is no way the spikes, alleged to be the means by which a virus attaching itself to a cell, could be seen at that size. In order to view the alleged virus, the viral material has to be sliced into slices about 100 nanometers thick so the electrons can penetrate it and pass through. That rules out over 99% of viruses seen on the Net.
About 15 years after he received a Nobel for discovering HIV, Montagnier went on record as claiming HIV will not harm a healthy immune system and that AIDS is caused by oxidative stress due to lifestyle. Although Montagnier was essentially admitting HIV was not the cause of AIDS, he clung to his delusion that he had isolated a virus.
Good scientists have known all along that AIDS is caused by the practices of male homosexuals and IV drug users. AIDS in Africa is caused by malnutrition, contaminated water, and diseases like malaria. HIV, if it exists, has been a passenger virus, as claimed years ago by Peter Duesberg. AIDS is caused by lifestyle.
So, what is covid? We know that people have died in relatively large numbers from a problem that features severe pneumonia. Unfortunately, the cause of the pneumonia has never been determined, only inferred. No one has ever physically isolated covid and the vaccines for it are fraudulently produced based on inference.
Graham,
> Not really sure what your point actually was
I guess your response can be safely ignored then.
> It is not argued by GHE defenders that the non-GHGs in the atmosphere are the planetary insulators, whilst the GHGs just add to their efficacy. […] It is argued that GHGs are entirely responsible for the 33 K.
33 K of insulation is better than 0 K of insulation, is it not?
You will of course want to refer to our previous discussion where I said that I don’t have a problem with O2 and N2 being considered insulators. I still don’t, but I thought I made it clear then that it’s only because GHGs in the lower atmosphere capture outbound IR and transfer it collisionally to N2 and O2. Without the GHGs there, outbound IR from the surface would have a straight shot into space, never having a chance to warm the lower atmosphere, thus negating any insulating effect to the surface.
If that wasn’t clear then I hope this clears it up now.
"33 K of insulation is better than 0 K of insulation, is it not?"
I have no idea how this responds in any way to the point I made.
"You will of course want to refer to our previous discussion where I said that I don’t have a problem with O2 and N2 being considered insulators."
OK, so that means you should accept that at least some of the supposed 33 K is due to O2 and N2.
"…I still don’t, but I thought I made it clear then that it’s only because GHGs in the lower atmosphere capture outbound IR and transfer it collisionally to N2 and O2. Without the GHGs there, outbound IR from the surface would have a straight shot into space, never having a chance to warm the lower atmosphere, thus negating any insulating effect to the surface."
Oop, no, it’s all of the 33 K due to GHGs again.
Try this:
Without the GHGs there, the O2 and N2 can be warmed via conduction and convection, during the day, but have no way to efficiently cool, not being able to radiate to anything like the extent that GHGs can. In fact the O2 and N2 could only really cool through contact with the surface, at night. Not a very efficient way to cool vs. a reasonably efficient way to warm…
> I have no idea how this responds in any way to the point I made.
Obviously an insulator causing a 33 K rise is more effective than an insulator which isn’t insulating at all. Dunno how I can be clearer than that.
> OK, so that means you should accept that at least some of the supposed 33 K is due to O2 and N2.
No, I don’t think it’s appropriate to partition like that since *it’s my understanding* an atmosphere completely transparent to IR would have no insulating effect whatsoever. It might even be the opposite. I’ll get back to this further down.
> Oop, no, its all of the 33 K due to GHGs again.
Never changed from that, *but I could be wrong* in my understanding.
> Without the GHGs there, the O2 and N2 can be warmed via conduction and convection, during the day, but have no way to efficiently cool, not being able to radiate to anything like the extent that GHGs can. In fact the O2 and N2 could only really cool through contact with the surface, at night. Not a very efficient way to cool vs. a reasonably efficient way to warm
That doesn’t work because — just as the last time we discussed this — you don’t recognize the role GHGs *also* have in warming the N2 and O2 (and surface) above and beyond what they’d obtain if the GHGs weren’t there. That bit I’m sure about.
Let’s consider two Earth analogs, one with an all N2/O2 atmosphere in the same proportions and mass as the real Earth, and one with no atmosphere at all. Same composition, albedo, emissivity … all else equal. No ice or oceans, completely bone dry.
It should be incontrovertible in both cases the hottest point will be more or less directly under the Sun. We should also agree that heat will naturally want to flow from hot to cold.
The planet with atmosphere has three ways to do this: direct IR emission to space, advectively by the atmosphere, and conductively through the rock/dirt and yes the air itself.
The planet with no atmosphere can only radiate to space and conduct through the rock, both of which *I believe* are less efficient than advection via the atmosphere, thus the airless planet will have a higher average temperature than the one with an IR-transparent atmosphere.
Looking for references but this should give you something to chew on.
> The planet with no atmosphere can only radiate to space and conduct through the rock, both of which *I believe* are less efficient than advection via the atmosphere
I goofed here. The proper comparison is conduction vs. advection. Radiative loss is more efficient than both and indeed the only way the planet can finally dissipate the abs.orbed solar energy short of losing mass.
"Obviously an insulator causing a 33 K rise is more effective than an insulator which isn’t insulating at all. Dunno how I can be clearer than that."
You can’t be any clearer in expressing that. I just have no idea how it in any way addresses anything that I said. Never mind.
"That doesn’t work because — just as the last time we discussed this — you don’t recognize the role GHGs *also* have in warming the N2 and O2 (and surface) above and beyond what they’d obtain if the GHGs weren’t there. That bit I’m sure about."
That’s not a rebuttal to my point. That’s just stating your own beliefs, again.
"The planet with atmosphere has three ways to do this: direct IR emission to space, advectively by the atmosphere, and conductively through the rock/dirt and yes the air itself.
The planet with no atmosphere can only radiate to space and conduct through the rock, both of which *I believe* are less efficient than advection via the atmosphere, thus the airless planet will have a higher average temperature than the one with an IR-transparent atmosphere."
Ah, I see what you’re doing. You’ve switched to discussing the surface temperature…the temperature of the physical ground surface itself. You must be, because you’ve now introduced a planet with no atmosphere.
I was talking about the temperature of the atmosphere. Once again:
Without the GHGs there, the O2 and N2 can be warmed via conduction and convection, during the day, but have no way to efficiently cool, not being able to radiate to anything like the extent that GHGs can. In fact the O2 and N2 could only really cool through contact with the surface, at night. Not a very efficient way to cool vs. a reasonably efficient way to warm…
> Auditors, Detectives, and Columbo see right through that approach.
Bragging like that appeals to your own authority, Bill.
When you’ll be able to act like an auditor I’ll revise my position that you’re just a phony.
> Youve switched to discussing the surface temperaturethe temperature of the physical ground surface itself.
That’s implicit in any discussion of the greenhouse effect, Graham.
> I was talking about the temperature of the atmosphere.
The temperature of the ground affects the air temperature at the boundary and vice versa, Graham.
***
We’ve unsurprisingly come far afield my initial argument on this thread which rebutted Latour’s claim that the greenhouse effect violates the 2LoT. After both Clint and Graham conceded that passive insulators such as clothing don’t violate 2LoT, Graham hurriedly abandons the Sky Dragon Slayer’s master argument and switches gears to claim that GHGs are not THE planetary insulators.
Which is like, not rebutting my arguments, just stating his own beliefs again.
And he ends his latest post with another repetition, verbatim.
You can’t make this up.
Brandy Guts could actually be Little Willy. There is literally no difference in their personality or written mannerisms. Not saying they’re the same person, it’s just scary how similar they are.
Oh, and Brandy Guts had no real rebuttal to my argument.
Graham states an irrelevance and then declares victory by fiat while lecturing on what is and is not a rebuttal.
Looks like it’s time for me to go back to trolling.
Brandy Guts vomits out some nonsense like a pathetic, obnoxious, argument-losing failure.
And so Gentle Graham wins again.
For point > belief.
Basic logic.
Little Willy feels obliged to comment again.
I believe Gentle Graham made a point.
Oh noes.
Keep on squawkin’, I’ll just PST it all tomorrow.
Basic logic.
Absolutely. You troll, I ask you to stop.
“The planet with no atmosphere can only radiate to space and conduct through the rock, both of which *I believe* are less efficient than advection via the atmosphere, thus the airless planet will have a higher average temperature than the one with an IR-transparent atmosphere.”
A planet with a more uniform temperature will tend to have a higher average temperature. I know there is some fancy name for the principle, but it relates to the T^4 relationship for temperature.
As a simple example, a planet that is 255 K everywhere radiates the same as a planet that is half @ 200 K and half at 288 K = 244 K average.
The atmosphere would make temperatures more uniform (cooling the hottest places and warming the coolest places). Thus the airless planet will have a LOWER average temperature.
Brandon R. Gates says:
”After both Clint and Graham conceded that passive insulators such as clothing dont violate 2LoT, Graham hurriedly abandons the Sky Dragon Slayers master argument and switches gears to claim that GHGs are not THE planetary insulators.”
Wee Willy, clothing only works because like a greenhouse it traps convection. You should study up on the subject before making stupid analogies. And since there is no Sky Dragon master argument you screwed up on that too.
Silly Billy invokes the Sky Dragon Crank master argument even as he claims its non-existence.
He should ask himself whether double-pane windows block more convection than single-pane ones.
> The atmosphere would make temperatures more uniform (cooling the hottest places and warming the coolest places). Thus the airless planet will have a LOWER average temperature.
Thanks for this, Tim. Would be nice to find a reference.
I’ve been reading this:
https://arxiv.org/pdf/0802.4324.pdf
but it doesn’t compare a rotating planet with a transparent atmosphere to the same planet with no atmosphere. Still a good resource.
Brandon R. Gates says:
”Silly Billy invokes the Sky Dragon Crank master argument even as he claims its non-existence.”
The so-called ”Sky Dragon Crank master argument” is something I have never heard defined. Until it is defined how can it be real. Can you provide its definition?
and to be fair I will answer your question. A single pane window completely blocks convection. A dual glazed window completely blocks convection twice.
> Until it is defined how can it be real.
Does a tree falling in the forest make a sound if nobody is there to hear it?
Does it fall at all?
> A single pane window completely blocks convection. A dual glazed window completely blocks convection twice.
This is a thing of beauty, Bill.
well then your post sounds just like it fell in a forest with nobody to hear it.
Families filmed ‘burning corpses of Covid victims on streets’ as China’s cases explode
https://youtu.be/JSpNGpwH4qo
maguff…The irony and the crime here is that covid tests are fraudulent. They test for RNA that has never been related to a virus.
The main test for covid is the RNA-PCR test. The inventor of the PCR method for DNA amplification, the late Dr. Kary Mullis, was adamant that PCR could not be used diagnostically to detect a virus that could not be detected by the standard method, using an electron microscope.
The same condition applied to HIV and Dr. Luc Montagnier, credited with discovering HIV, even though he claimed only to ‘inferring’ the virus, admitted in an hour-long interview that he did not physically isolate HIV, he inferred it.
That method of inferring a virus has become the standard since, and it has been revealed as being fraudulent. Covid was inferred by scientists in Wuhan and they admitted as much, that they did not physically isolate a virus.
Based on the report of the Wuhan scientists in January of 2020, German scientist, Christian Drosten, rushed off a test to the WHO, who distributed it to the US CD.C and other health authorities. That test is now the gold standard RNA-PCR test now used to determine a covid infection.
The test was never peer reviewed or even challenged, the WHO rubber stamped it as ‘approved’. There is not a shred of proof that the test measures for a covid infection and Drosten admitted that he did not isolate covid physically. He too inferred it.
There is no doubt that something is acting to harm people the past few years but the presump.tion that is due to a scientifically isolated virus is fraudulent. Furthermore, the vaccines issued based on this fraudulent science are equally fraudulent.
Data since the issue of the so-called vaccines, which are in realty, modified genetic material, has made it obvious that people fully vaccinated are being infected far more than people who are not vaccinated.
I know people personally who have become seriously ill with the so-called covid infection even though they are doubly and triply vaccinated. I have not been vaccinated, and since the outbreak of covid in 2020, I have experienced no fevers or issues related to pneumonia experienced by covid victims.
British Columbia Vaccination Data
As of Tuesday at 8:21 pm CST, 14,046,044 doses of approved COVID-19 vaccines have been administered in British Columbia.
4,987,540 people have received at least one dose.
95.642% of all people in British Columbia have received at least one dose.
99.936% of people 5+ in British Columbia have received at least one dose.
85.083% of all people in British Columbia have received at least two doses.
88.902% of people 5+ in British Columbia have received at least two doses.
56.883% of all people in British Columbia are fully vaccinated with a third dose.
https://www.reuters.com/article/uk-factcheck-pcr/fact-check-inventor-of-method-used-to-test-for-covid-19-didnt-say-it-cant-be-used-in-virus-detection-idUSKBN24420X
Social media users have been sharing a quote attributed to the inventor of the PCR test currently being used to detect COVID-19. The posts have been shared over 1,000 times on Facebook.
This quote appears not to be a direct quote from the inventor, Kary Mullis, has lost some context and does not mean COVID-19 testing is fraudulent, as suggested by some social media posts.
Even if Mullis had voiced a similar statement before his death in 2019, this quote does not mean the PCR test is unable to detect the presence of SARS-CoV-2 – the virus that causes COVID-19 – rather that it cannot determine whether the individual tested is infectious.
“There is no doubt that something is acting to harm people the past few years but the presump.tion that is due to a scientifically isolated virus is fraudulent. Furthermore, the vaccines issued based on this fraudulent science are equally fraudulent.”
That’s a great synopsis of your attitude towards science.
To date, Covid-19 has infected 655,888,355 and killed 6,704,337 worldwide since January 2020, and those are the official figures which are likely low.
“The truth may be puzzling. It may take some work to grapple with. It may be counterintuitive. It may contradict deeply held prejudices. It may not be consonant with what we desperately want to be true. But our preferences do not determine what’s true.”
– Carl Sagan
Or, if you prefer,
“Science is what we do to keep from lying to ourselves.”
– Richard Feynman
“They test for RNA that has never been related to a virus.”
Uhhh….the Covid-19 virus contains RNA. That is what is detected in the test.
https://upload.wikimedia.org/wikipedia/commons/thumb/e/e5/Coronavirus_virion_structure.svg/1024px-Coronavirus_virion_structure.svg.png
It works.
https://discoverysedge.mayo.edu/2020/03/27/the-science-behind-the-test-for-the-covid-19-virus/
“PCR only works on DNA, and the COVID-19 virus uses RNA as its genetic code. RNA is similar to DNA, but only has a single strand. Fortunately, viral enzymes to convert RNA into DNA were discovered decades ago, and have been harnessed, along with PCR, to find unique signatures in RNA, too. In this case, PCR is referred to as reverse transcription PCR, or RT-PCR.”
Yet another internal error…testing…
brandon…
The disconnect is not on my end, it lies with people like you who must lean on appeals to authority rather than working out physics problems for yourself.
Well-established theory is just that…theory. If it’s wrong, it’s wrong. The thing that makes me wonder is how people like you can still subscribe to the theory of the Moon rotating on a local axis when it can be so easily proved wrong. The motion is plainly curvilinear motion without local rotation.
The Earth performs curvilinear translation with local rotation and anyone observing its orbit from within the orbital plane would see each side of the Earth 365 times per orbit.
It was proved wrong by Nicola Tesla about a century ago but the paradigm is so strong that no one has the initiative to corroborate his proof, which is solid. It’s the same with Einstein and his theory of relativity. He arbitrarily added a time factor, which is based on the speed of light, to the Newtonian equation of motion, and no one questioned it.
Later, Louis Essen who invented the atomic clock, and who apparently understood time much better than Einstein, claimed that Einstein’s theories are not even theories but thought-experiments with no proofs, he was dismissed by people like you with strong appeals to authority.
Why?? Because he was the mighty Einstein. Hitherto his theories on relativity, he had done essentially nothing other than propose the photoelectric effect and come up with an equation that essentially means nothing, E = mc^2.
To which energy does E apply? Does mechanical energy or electrical energy depend on the speed of light? No. So, E means electromagnetic energy and the equation suggests light absorbed by the Earth must change its mass.
> people like you who must lean on appeals to authority
Like Graham, Gordon fails to understand when citing an authority is fallacious and when it is not. Then after criticizing me for relying on expert opinion he cites the opinions of some experts. I couldn’t make this up.
If you read through the arguments carefully, you’ll find I’m not saying anything remotely controversial about appeal to authority.
"Like Graham, Gordon fails to understand when citing an authority is fallacious and when it is not."
This is a false accusation.
“Then after criticizing me for relying on expert opinion he cites the opinions of some experts. I couldnt make this up”.
***
You fail to grasp the obvious. I take time to corroborate my appeals to authority by explaining them. I don’t merely claim, for example, that Clausius stated the 2nd law, therefore it must be correct, I go into detail on why it is correct. I use both his own proofs and independent proofs from quantum theory to support my argument.
With Newton on the Moon, I don’t merely quote the words of a translator, I prove, using Newton’s own words that he could not have condoned the theory that the Moon rotates on a local axis. Therefore, the translation was incorrect. That’s not hard for me to accept, a scientist with 5 years of Latin could not translate the original Principia in Latin.
None of us no-spinners have relied on authority figure as proof. We have introduced concept like a ball on a string, a car driving around a track, a horse bolted to a carousel, a locomotive moving on a circular track, and an airliner circumnavigating the Equator at a constant altitude.
Not one of you spinners have introduced a coherent, scientific proof that the Moon rotates on a local axis. All you do is argue that the myth has been supported by authority figures, therefore it must be right.
Same with the climate change myth. You appeal to the IPCC, who cannot provide a scientific proof that CO2 is warming the atmosphere.
C’mon, Gordo.
Gaslighting Graham appealed to Tesla, to Flop, to the CSA Truther, to Holy Madhavi, to Perigal, and that’s just for the Moon Dragon business.
Your actual argument is pure ad hominem, BTW. It does not matter much whether BG understands what he says. What he says is true or false independently of whatever he believes.
And you forget that you rely on your own authority.
Fallacy fluff sucks. Let go of it.
I cited various people, but was never claiming they were correct because they were authorities. Thus I was never making the appeal to authority fallacy. Some of the people I cited could be said to be false authorities, however I never claimed that what they said was more likely to be correct because of their authority. Thus I was never making the appeal to false authority fallacy.
[GASLIGHTING GRAHAM] I never claimed that what they said was more likely to be correct because of their authority.
[ALSO GASLIGHTING GRAHAM] The Wikipedia entry corroborated what I had said.
[AND GORDO] I offer my own scientific explanations and use the explanation of Tesla as a back up corroboration, even though his proof differs significantly from mine.
Not seeing the claim that what they said was more likely to be correct because of their authority?
Did anyone see Gaslighting Graham say the word “appeal”?
How can anyone say that he’s appealing then?
He’s merely citing.
Therefore it’s OK.
What a wonderful conceptual world Team Dragon lives in.
They always get everything for free.
Little Willy, everybody links to various sources for support, or corroboration. Whether or not those sources make the person’s claim more likely to be correct is really up to the critical thinking faculties of the reader, the audience. I cited Tesla on the moon, on various occasions, partly because it is a good introduction to the moon issue, and partly because some people will not even take the issue seriously until some authority is introduced. That is on their critical thinking faculties, not mine…but there you go. I linked to the CSAItruth video because it’s a good demonstration of the motions from the “Non-Spinner” POV. Certainly not because I expected people to be swayed by the mighty authority of CSAItruth! I mention Ftop_t because he made some good arguments, which I assume people remember. I am not saying he is most likely right because he is some sort of authority, I just thought the arguments were particularly good, and again supported by demonstrations, this time via Desmos.
So…that’s that.
dremt…”I cited various people, but was never claiming they were correct because they were authorities”.
***
Agreed. You introduced the work of Tesla so we could all read it and verify it for ourselves. Obviously, it was way over Willard’s head or any of the spinners.
Gaslighting Graham does not always cite Tesla on the Moon issue, he certainly does not cite him because he’s Tesla or anything.
It’s just a good introduction.
That just happens to *corroborate* his position.
He could be citing some other rando.
Or his pigeon.
But Tesla has to do.
After all, corroboration works only because another source says what he says.
Nothing else.
🤦
What you are trying to do is accuse me of appealing to authority…
…and you want the audience to mentally connect that with a fallacy.
Then, when it suits you, what you call “appeals to authority” will be fine again.
Funny that.
After playing dumb all evening, Gaslighting Graham gaslights a little more.
It does not matter much how we *name* an infelicitous move.
What matters is that we can explain the infelicity.
And so far Gaslighting Graham failed to provide any reasonable explanation of the ad verecundiam.
He decided that, in contrast to the real authorities on that question, an appeal to authority was a fallacy, and that was that. Because the fontifications of a dragon crank at the bottom of a dead thread is what settles that kind of thing.
He’s the King of Fallacies, just like he’s the Captain of Team Dragon.
Ah, I got you bang to rights in my last comment, and you know it.
Gaslighting Graham lost about 15 points so far in this silly debate he knows little about, but he soldiers on.
Sure, sure. We all see through your silly semantic games, Little Willy.
Poor Graham. Cannot win *one* word game,
No wonder he has to go for gaslighting.
“I cited Tesla on the moon, on various occasions, partly because it is a good introduction to the moon issue, and partly because some people will not even take the issue seriously until some authority is introduced.”
OK so it is clear you thought he would appeal to people as an authority. But he was not an astronomy authority. Thus this was an appeal to false authority.
People, like me, pointed out where his arguments were flawed, like when he stated something, ‘but it is merely an illusion’ that the Moon is spinning, without ever explaining WHY it is an illusion.
“I mention Ftop_t because he made some good arguments, which I assume people remember. I am not saying he is most likely right because he is some sort of authority, I just thought the arguments were particularly good, and again supported by demonstrations, this time via Desmos.”
You thought his demo was convincing to people, but in fact you and most others were not familiar enough with the programming to decipher exactly what he had done to create it. Thus you accepted, on his authority, that he knew what he was doing and that his math and programming were correct.
It took time for me to understand the programming and then see that his math, demo and interpretations were, in fact, quite flawed, and it was used to obfuscate.
They want what they call an “appeal to authority” to be “valid” when one of their own cites an authority who says the things they agree with, and “invalid” when their opponents cite the authorities who say the things they disagree with. It is utterly transparent, and goes completely against everything the fallacy ever stood for in the first place.
Gaslighting Graham fumbles on the very first sentence of the Wiki entry on appeal to authority.
He soldiers on, with his trivial solution to redefine the concept so that when he does it, it’s fine, but when otters do it it’s not.
Sorry, Little Willy, but just because I link to Tesla on the moon issue, or refer to Ftop_t’s arguments, does not an “appeal to authority” or “appeal to false authority” make. If people are swayed by Tesla’s authority alone, and not his arguments, that’s on them. Same with Ftop_t.
Gaslighting uses the opinion of Tesla as evidence to support an argument. According to thy Wiki, that’s an appeal to authority.
According to Gaslighting Graham, it’s not. Also according to the opinions he cites as evidence to support his argument. Which, according to thy Wiki, is another appeal to authority.
And the reason he invokes is exactly the same as the one we can find in the Stanford Encyclopedia of Philosophy to characterize an appeal to authority!
You just can’t make this up.
“Gaslighting uses the opinion of Tesla as evidence to support an argument“
Completely false. It is his arguments that are the support. His authority is irrelevant, as far as I am concerned, though it may convince others. Arguments are not opinions.
The rest of your comment thus fails, accordingly.
[GASLIGHTING GRAHAM] His authority is irrelevant, as far as I am concerned, though it may convince others.
[ALSO GASLIGHTING GRAHAM] As is the Foucault pendulum argument, which was answered by Tesla some time ago.
https://www.drroyspencer.com/2022/11/canadian-summer-urban-heat-island-effects-some-results-in-alberta/#comment-1403883
🤦
Answered by Tesla via him making an argument, Little Willy. Tesla didn’t just say, “the Foucault Pendulum isn’t a problem…I’m Tesla, by the way”.
I can’t take credit for his arguments.
Gaslighting Graham does not always make an argument, but when he does he cites gurus who make the same argument only because they make the same argument as he does.
🤦
I "cite gurus" in that case because they made the same argument as I would make…but they did it first. So I shouldn’t take credit for their argument. If it makes people aware that Tesla wrote three papers on the moon issue, so much the better. People can read them, listen to the arguments made, and decide for themselves what they think.
[GRAHAM] So I shouldnt take credit for their argument.
[ALSO GRAHAM] everybody links to various sources for support, or corroboration.
Just an endless series of attempted gotchas. That’s all we ever get from Little Willy.
Where, from "support", or "corroboration", do you get "claiming that because the authority said something, they are correct"?
And so Gaslighting Graham, after tripping up yet another time, whines about tripping up. He had the solution all along:
[GG] Whether or not those sources make the person’s claim more likely to be correct is really up to the critical thinking faculties of the reader, the audience.
All he needed is the generalizing his pragmatic stance: the audience decides what is a fallacy.
Gaslighting Graham can only pretend that he knows that the audience will determine that citing Tesla is fine, whereas citing the Wiki on appeal to authority is not.
So once again he wants his cake and eat it too.
The audience will determine that you’re a relentless troll, who just went to the ends of the Earth to try and accuse me of making an appeal to authority fallacy, only to turn around and say that "the audience will determine that citing Tesla is fine".
In other words, you concede the point.
Having been shown wrong about the appeal to authority, Gaslighting Graham soldiers on.
Wow, I must have missed that. Where was I shown wrong!?
Gaslighting Graham gaslights a little more.
Little Willy, please stop trolling.
“just because I link to Tesla on the moon issue, or refer to Ftop_ts arguments, does not an ‘appeal to authority’ or ‘appeal to false authority’ make.”
Yes indeed they were appeals to False Authority.
Did you understand FTOPs programming or math? No. You never discussed it or defended it.
When people pointed out the flaws, you offered no rebuttal.
Did you rebut the flaws people pointed out with Tesla’s logic and missed facts?
Certainly not mine.
In both cases you just kept reposting their junk, definitely appealing to their false authority.
You totally misunderstand, BG.
Citing is OK.
Appealing is not.
Hope this helps.
Silly Little Willy.
A NOTE TO TEAM DRAGON
https://dictionary.cambridge.org/fr/dictionnaire/anglais/corroboration
Please note that I am only citing the Cambridge Companion.
It does not corroborate what I thought of the concept of corroboration.
My comment therefore contains no traces of fallacy.
Silly Little Willy. So confused by the simplest of things.
Gaslighting Graham gently gaslights a little more.
Little Willy, please stop trolling.
— Just as the Moon’s brightness varies with phase, so does the Earth’s a day-old terrestrial crescent shines around magnitude 6, while the Full Earth glares at 16, fifteen times brighter than the full Moon. When the Moon is new and draped in darkness, the full Earth provides a useful source of nighttime illumination, enough to pick your way among the lunar rocks . . . provided you were dressed for the 200C temperatures. —
https://skyandtelescope.org/astronomy-blogs/explore-night-bob-king/observing-earth-from-the-moon/
So, where do want your swimming pool?
I was thinking at lunar equator where Earth is near zenith.
So, have dome with two layers, top layer air, and layer below it
water, each layer 1 meter thick.
Top of dome is glass and it will 24 meter diameter and 12 meter high
[1/2 sphere]. And within it, 22 meter diameter which also of make of glass, And within that, 20 meter diameter which is made of plexiglass which 1″ thick. The air at top is kept at 1 psi pressure, and water is also kept a 1 psi [and top of dome- it will have more pressure at bottom of dome]. Since top water is 11.5 meter high, with Earth’s gravity it’s 11.5 times 1.47 psi = 16.905 psi. Moon is about 1/6 so, 2.8175 psi and plus the 1 psi = 3.8175 psi.
Now for swimming pool.
Swimming pools on the Moon should be deeper than swimming pools in Earth. But we make this moderately deep, about 30 or 10 meter deep- since gravity about 1/6, pressure different is like a 5 to 6 foot deep pool on Earth. Should have it diving board. You don’t need one.
And diving board might called a flying board. One can fly on the
Moon and diving board just makes it easier. Let’s give ramps, flying should be done in bigger arenas.
Pool can 12 meter diameter, in middle of dome. It could be 1 meter above ground and 9 meter under the ground. And from the ground one some ramps which should one can use as diving broads- oh, and you probably could jump across the pool, hmm.
Air pressure in pool area, say 6 psi.
So, I was thinking looking Earth at nite, but could look at Earth during the day. Probably.
And how hot is it when sun is near zenith {Earth at full moon as seen from Earth- and New Moon when at night.
As we know, 1 meter of water absorbs about 1/2 of sunlight and mostly shortwave IR, so similar to sunlight on Earth.
ANOTHER NOTE TO TEAM DRAGON
https://en.wikipedia.org/wiki/Argument_from_authority
According to Gasliting Graham, *this* should be a fallacy.
More than that, his convention is supposed to make like easier.
🤦
Little Willy starts to misrepresent, as usual. This is what I have stated:
It is always a fallacy to suggest that an authority’s claim is correct simply because they are a relevant authority on the subject in question. That is an “appeal to authority”.
It is not a fallacy to suggest that an authority’s claim might be more likely to be correct because they are a relevant authority on the subject in question. That is not an “appeal to authority”.
It is a fallacy to suggest that a false authority’s claim is more likely to be correct simply because they are an authority on some unrelated subject, or if it turns out they are not really an authority on the subject in question. That is an “appeal to false authority”.
Gaslighting Graham *cannot* bring himself to admit that what he identifies as an appeal to authority is *not* what is usually understood by the term.
He soldiers on and gaslights a little more.
Yes, it is what is usually understood by the term. I have already linked to other sources defining it exactly as I have done. People like you are trying to twist the meaning to suit your own ends.
Gaslighting Graham does not always links to other sources defining it exactly his favorite way that suits his own ends, but when he does he is certainly not using “the opinion of an authority on a topic is used as evidence to support an argument.”
That would be an appeal to authority as defined by thy Wiki.
And God knows how fallacious an appeal to authority is.
🤦
That’s just the point, Little Willy. Defining it the way I have stated does not “suit my own ends”. It is just the only way it logically makes sense. It doesn’t benefit me in any way, though, if you think it through. Whereas having this defined the way you want it does suit your own ends. You can say an appeal to authority is “valid” when you want it to be, and “invalid” when you want it to be. The ambiguity suits your purpose. If you make it so that every citation is an “appeal to authority”, you can pick and choose when you want to insinuate someone is making a fallacy, and when they are not.
Gaslighting Graham would *never* prefer a definition from that would make him save face instead of just accepting that he fumbled the ball right from the start by invoking thy Wiki himself.
He soldiers on.
“…is a form of argument in which the opinion of an authority on a topic is used as evidence to support an argument”.
Well, that’s kind of a tricky one. “Used as evidence” does suggest that the authority’s word alone is being used as though it demonstrates truth. Though you could read it the other way. Ambiguously worded. Not the best, Wikipedia, not the best.
And so Gaslighting Graham, after touting the simplicity of his position, falls to the first wrench thrown his way.
What will it be when he’ll have to own the fact that his “ends” talk is pure ad hominem?
…but, overall, the Wikipedia entry does argue that “appeal to authority” and “appeal to false authority” are two separate, but related fallacies, just as I said.
Gaslighting Graham doggedly dodges.
His misidentification of the false authority fallacy is not the same mistake as his failure to realize that appealing to an authority can be perfectly fine.
I have already made clear that "deferring to an authority on an issue" is perfectly fine. In other words:
"It is not a fallacy to suggest that an authority’s claim might be more likely to be correct because they are a relevant authority on the subject in question. That is not an "appeal to authority"."
You wish to call that an "appeal to authority", thus confusing the issue as to what is a fallacy and what isn’t…and I can only see nefarious reasons for you wanting to do that.
If it’s not for nefarious reasons, how about you convince me by making an argument as to why it’s beneficial to have the "appeal to authority" the way you want it.
[GASLIGHTING GRAHAM] It is not a fallacy to suggest that an authoritys claim might be more likely to be correct because they are a relevant authority on the subject in question. That is not an “appeal to authority”.”
[THY WIKI] The general form of this type of argument is:
Person or persons A claim that X is true.
Person or persons A are experts in the field concerning X.
Therefore, X should be believed.
Again, ambiguous wording. You could take "therefore, X should be believed" as:
1) X should be taken as being true.
or
2) X should be taken as being more likely to be true.
Instead of looking for more gotchas, how about you make that argument as to why it’s beneficial to have the "appeal to authority" the way you want it?
More word games from Gaslighting Graham.
He soldiers on.
Readers are going to start to notice that you don’t seem to have any argument as to why seeing the "appeal to authority" the way you want to is beneficial, Little Willy.
Perhaps one day Gaslighting Graham will realize that his “why it’s beneficial” looks a lot like an argumentum ad consequentiam.
So…you’ve got nothing. It’s not beneficial to see the appeal to authority the way you want to see it, because it is open to abuse. If it’s an "appeal to authority" every time you link to something, then people can throw the term around all the time, implying a fallacy, when there is none…and indeed, that’s what we see happening at this blog, all the time. If it’s an "appeal to authority" every time you link to something, then the "appeal to authority" fallacy no longer even really exists, and all you have is the "appeal to false authority" fallacy. Gradually, the entire original purpose of the fallacy is eroded…
…and we end up with people thinking that authority determines what is correct. Only the "right" authorities, mind you…
> If it’s an “appeal to authority” every time you link to something, then the “appeal to authority” fallacy no longer even really exists, and all you have is the “appeal to false authority” fallacy.
🤦
Little Willy, please stop trolling.
“Fundamentally, the fallacy involves accepting as evidence for a proposition the pronouncement of someone who is taken to be an authority but is not really an authority.”
Vintage December 31, 2022 at 9:07 PM.
Graham soldiered on since then, and will continue to do so, gaslighting along the way.
That would be the "appeal to false authority" fallacy. Or, it should be.
Gaslighting Graham once again decides that he’s King Fallacy and that reality and history should follow what, He, decided.
No, logic is King. Logic dictates that it should be the "appeal to false authority" fallacy, and that this should be a separate, but related fallacy to the "appeal to authority".
Gaslighting Graham falters once again.
Logic is *not* what makes him cling to his conception.
It’s just pure ego.
That’s another false accusation.
Gentle Graham gaslights once again.
And once again he fails to distinguish facts from norms.
That appears to be another false accusation. In fact, two false accusations.
[GENTLE GRAHAM] That “appeal to authority” is a fallacy of thinking someone is correct because they are an authority is backed by the following simple logic: we all make mistakes, and thus you cannot just take someones word and conclude that they are correct, even if they are an authority on the subject in question.
[ALSO GENTLE GRAHAM] Logic dictates that it should be the “appeal to false authority” fallacy, and that this should be a separate
Ah! The days when Gentle Graham appealed to fallibility.
I said “appealed”: shouldn’t that be a fallacy?
🤦
Little Willy just tries to conjure something up. The sub-thread had reached its end, but he just had to try and add something more.
OK…logic dictates that it is the "appeal to false authority" fallacy. Happy?
Gentle Graham just keeps gaslighting.
First he tried to say what an appeal to authority was.
Now he backtracked to what it should be.
I suppose he has heard about how to derive an *is* from a *ought*?
It’s not impossible, BTW. It’s just hard and often circumstancial.
I’ve not changed my arguments in any way. From the beginning.
Gentle Graham gaslights furthermore.
#2
Little Willy, please stop trolling.
Gaslighting Graham soldiers on, this time with “so you’ve got nothing,” which is not unlike the post hoc ergo propter hoc fallacy.
Well, it certainly comes across more and more like you have nothing when you keep failing to come up with something. Though of course you could have an answer, but just be playing childish games…
Gaslighting Graham gently gaslights a little more.
An appeal to an authority refers to “a form of argument in which the opinion of an authority on a topic is used as evidence to support an argument.”
Sometimes this is OK. Sometimes it is not.
Form alone does not if it’s invalid or not.
The whole formalist project has been deprecated in the 80s.
Once again Gaslighting Graham misreads the first sentence of an encyclopedic entry and ties himself into knots.
When he cites stuff it’s fine. When his opponents do it’s not.
Because reasons.
Gaslighting Graham definitely has a problem with authority.
"When he cites stuff it’s fine. When his opponents do it’s not."
This is a ridiculously blatant false accusation.
You’re still not making your case, by the way.
"Sometimes this is OK. Sometimes it is not."
Yes. You seem to love that ambiguity. I’ve explained why I think so, and you’re not exactly coming up with any sort of decent rebuttal. Or even denying it.
Gaslighting Graham soldiers on, conflating indeterminacy with ambiguity along the way.
Readers might notice how his own criteria so far failed.
…you’re not exactly coming up with any sort of decent rebuttal. Or even denying it.
Gaslighting Graham gaslights once again to get out of a tough spot.
An argument from authority (argumentum ab auctoritate), also called an appeal to authority, or argumentum ad verecundiam, is a form of argument in which the opinion of an authority on a topic is used as evidence to support an argument.
It is a fallacy the authority is irrelevant, i.e. it is a false authority.
Since he’s a crank who has issues with almost all scientific authorities known to mankind, he goes for the criteria that undermines them.
When Little Willy’s in a tough spot, he simply claims his opponent is in a tough spot.
He quotes the beginning of the Wikipedia entry on appeal to authority again, and then adds:
"It is a fallacy the authority is irrelevant, i.e. it is a false authority."
Which is not in keeping with the Wikipedia entry. The entry, despite suffering a bit from ambiguous wording, still makes it clear enough that the "appeal to authority" and "appeal to false authority" are different, though related, concepts. This is where his whole argument starts to collapse. If it was only a fallacy when the authority is false, there would be no need to have separate descriptions for the "appeal to authority" and "appeal to false authority".
"Since he’s a crank who has issues with almost all scientific authorities known to mankind, he goes for the criteria that undermines them."
The "appeal to authority" and "appeal to false authority" fallacies in no way "undermine" scientific authorities. They simply prevent any authority from being taken as the final word in any matter…and I have been clear throughout that relevant authorities should be considered perhaps more likely to be correct…just not taken as "gospel truth".
Little Willy still fails to find any reason why we should take his version of "appeal to authority" as being the right one.
Gentle Graham gaslights once again.
The Wiki’s Overview recalls that not everyone agrees on the appeal of authority. On the one hand, there are argumentation theorists who say it can be fine. On the other, there are folks who should know better.
Of course Gentle Graham will side for the second camp. And he will cite opportunistic chaps who piggyback domains.
The Wiki even provides a general form that contradicts him. It is perfectly fine to believe an authority under the right conditions. That does not imply we should abide to it blindly.
It’s just corroboration, as Gentle Graham himself admits.
So in the end the whole issue is semantical:
Gentle Graham simply refuses to name felicitous acts of supporting one’s argument by appealing to the authority as appeal to authority.
Four days and he still persists, recognizing that he’s not even making a factual claim.
It’s just the way he’d like things to be.
🤦
Little Willy still fails to make any argument at all as to why the "appeal to authority" should be the way he thinks it should be.
Besides insinuating once again that the authorities who support his way of looking at it are "better authorities"!
He seemingly has no actual, valid, logical reasoning behind thinking it should be that way.
…and, as usual, his form of defense is always "attack".
Gentle Graham still gaslights after being refuted fair and square.
It is a historical fact that ad arguments were first arguments, not fallacies.
It is a theorical fact that ad arguments are not identified with fallacies. Ad arguments are fallacies of relevance.
It is a logical fact that relevance isn’t a property that lends itself to easy formal derivations.
It should be obvious to anyone that Gentle Graham fails to distinguish what is and what should be, according to his authority as Captain Dragon Crank and King Fallacy.
It should be obvious to readers that all Gentle Graham has left is to try to redefine to what “appeal to authority” refers.
That he keeps gaslighting is, well, par for his course.
So all
> Ad arguments are fallacies of relevance.
Let’s add the words missing:
Ad arguments are fallacies insofar as they are fallacies of relevance.
I see from further down-thread that you actually reject the logic behind the "appeal to authority" fallacy.
Clearly it has been a waste of time talking to you, as you can’t even be reasoned with on the most basic of things, if that is the case.
You failed to provide any argument in defense of your own position. All you ever do is attack. Me first, and my arguments, secondarily. You simply cannot defend. You only have one setting. It gets very old, very fast.
Gentle Graham gaslights furthermore.
He’s just gaslighting.
Stupid silly gaslighter that he is.
Little Willy, please stop trolling.
[W] It is a historical fact that ad arguments were first arguments, not fallacies. It is a theorical fact that ad arguments are not identified with fallacies. Ad arguments are fallacies of relevance. It is a logical fact that relevance isnt a property that lends itself to easy formal derivations.
[GG] You failed to provide any argument in defense of your own position.
OK, Little Willy.
Putin tried to engineer a winter energy crisis in Europe that would break public support for Ukraine. But a concerted effort to cut demand and stockpile fuel, and a lot of luck on the weather front, has helped Europe avert a crisis. It turns out that invading your neighbor and waging an energy war on your best customer is not a good strategy; European Natural Gas prices are back down to where they were before the start of the war.
andrea…I see you have bought into the bs being spread by the western media.
If you want the truth on this war, I suggest you start by watching the video by Oliver Stone, call Ukraine on Fire. I was not prepared to accept whatever Stone claimed in the video so I spent hours researching. It was not so much wanting to spend that amount of time, it just happened that each point raised lead to another and another.
The beginnings of the current war took place in 2014 in the Ukraine when armed Ukrainian nationalist infiltrated a peaceful protest against a democratically-elected, pro Russian president. The ensuing riot ended with the president being forced to flee the country. The Ukraine is presented as a democratic country that was invaded by Russian bullies. What sort of democracy has its army and police stand by while a democratically-elected president is ousted from office by force?
When the president was ousted in a coup, pro-Russian Ukrainians in the eastern Ukraine rebelled. They had voted him in and they were seriously annoyed that the president had been ousted. Here in the West, the media presented this as a load of malcontents griping about nothing and harassing the Ukrainian government in Kyiv.
The truth was suppressed and it continues to be suppressed by the western media.
The Russians were asked to help in 2014 but did nothing till 2022. We need to remember that the Ukraine was formed by the USSR circa 1918 and was a part of the USSR till 1990. They exist today only because Russia let them go. As a result, pro-Russian Ukrainians were trapped in the new Ukraine. They got Crimea only because Khrushchev, a Ukrainian, granted it to the soviet in the 1950s. It was still part of the USSR.
I have no interest in defending Putin, I know very little about him. However, I have no interest in defending the blatant propaganda we are fed here in the West. The truth is that Putin declared his intention during the invasion. He wanted to deal ith Nazi elements in the Ukrainian army that were wreaking havoc in eastern Ukraine and to carved out the states in the Donbas region in support of eastern Ukrainians.
From what I can see, that’s exactly what he has done. He eliminated the Ukrainian Azov battalion, a known Nazi division in the Ukrainian army. He has not tried to take any of the rest of the Ukraine.
We need to give credit where credit is due and to examine our support of the Ukraine who are essentially controlled by fascist nationalists. Although Zelensky, the president, is a Jew, that does not mean he is running the show.
In 2016, Ukrainian nationalists threatened the sitting president and forced him into passing a law that honoured Ukrainian Nazis, like Stepan Bandera, and the SS Galacia, a Nazi division comprised of Ukrainians in WW II.
The truth is that we in the West helped start this war. We have been pushing the Ukraine to join NATO, knowing full well that Putin would never allow that, as he had stated many times.
“I have no interest in defending Putin.”
False, you keep pushing his propaganda.
“I know very little about him.”
He has stated Ukraine is not a real sovereign country. It is.
He invaded Ukraine, though he had treaty obligations to never invade. He has annexed parts of a sovereign country. He is killing thousands of Ukrainian civilians.
What else do you need to know?
nate…”False, you keep pushing his propaganda”.
***
I see you have fallen for the western bs as well. What’s new, you have been spewing climate alarm here for years.
I see you have not commented on the 2014 putch when a democratically-elected Ukrainian president was run-off by armed Ukrainian nationalist while the army stood by and cheered.
Too complicated for you to verify???
I have stated several times that I know nothing about Putin. Everyone else seems to be experts on him.
Everyone else can read about the events of the war in the free press of their choosing. You should try it.
Whatever internal politics has occurred in Ukraine is their business. Their desire to engage more with Western Europe is their business.
The excuse of ethnic Russians rights in Ukraine, is a repeat of the one used by Hitler to invade Czechoslovakia, Poland, etc.
It is not justification to invade, bombard, occupy, and annex someone else’s country. Is it?
It can’t possibly be justification for wholesale destruction of that country and mass murder of its population.
Is it?
Oliver Stone is a Putin fanboy. Always has been. Stone also fell for Hugo Chavez.
This is a war over resources.
Oil and gas prices have been continuously climbing back to their highest level seen in a decade, and the price of oil finally recovered to its 2014 era levels by February of 2022, the very same month that Putin decided to launch his full-scale invasion across Ukraine.
Moscow always takes riskier foreign policy decisions when oil and gas prices are high, dating back to Crimea, Georgia and even Afghanistan in the Soviet era; so this shouldn’t have really come as much of a surprise.
Ukraine holds the second largest known proven reserves of natural gas in Europe only behind Norway’s. Recent discoveries by western companies indicated potentially as much as three and a half times more natural gas than Norway. Ukraine also has one of the world’s largest pipeline networks from the Soviet era already built out across the country directly towards Europe and could have easily all of a sudden become an enormous provider of natural gas to Europe and cut tens if not hundreds of billions of dollars into Russia’s biggest market. Moreover, Ukraine’s gas infrastructure also includes storage sites capable of holding more than 31 billion cubic meters worth of gas and they have been severely underutilized for decades. The entire European Union can currently only store 100 billion cubic meters and thus if Ukraine were to ever join the EU they would increase their gas storage capabilities by a third and thus severely reduce the ability of Moscow to pressure European governments during the winter precisely when they need their gas the most.
Andrea…when did this ‘full-scale’ invasion take place? I have seen no other action than in the SE sector of the Ukraine. Early on, the Russians faked an attack on Kyiv from the north to draw Ukrainian forces north and away from the intended invasion site.
You don’t need to take Stone’s word for anything, you can verify what is said in the video frame by frame if you like. I was surprised by the accuracy of the video. It can all be corroborated by independent soutces.
It’s not enough to claim he is a Russian supporter, you need to discredit what he has claimed. That’s what I set out to do because I had bought into western propaganda. By the time I was 1/3rd of the way through the video, I had corroborated everything claimed. I did not take the word of uncorroborated sources, I relied partly on an award-winning reporter, Robert Parry, and an expert on US foreign policy, Dr. John Merescheimer.
There are parts in the video where the ousted Ukrainian president is interviewed. I tended to dismiss much of his rhetoric simply because he had pro-Russian sentiments. However, the part I found very disturbing was the degree to which Ukrainian militants are connected to past Ukrainian Nazi movements like the UOW, lead in part by Stepan Bandera. He was wanted for war crimes at Nuremberg and managed to escape thanks to the early CIA, who wanted to use him.
Factions of the current fascist movement actually sit in the Ukrainian parliament, before it was dissolved by the current dictator, Zelensky. I can dig out names, if you like.
“However, the part I found very disturbing was the degree to which Ukrainian militants are connected to past Ukrainian Nazi movements like the UOW, lead in part by Stepan Bandera. He was wanted for war crimes at Nuremberg”
Gordon you are STUCK in WWII thinking. All those people are dead, along with the USSR.
The President of Ukraine is a Jew!
Every country in Europe and North America has fringe, far right or neo-Nazi groups including Russia and Belarus, but we don’t invade, bombard, or occupy any of them because of it.
nate…”Gordon you are STUCK in WWII thinking. All those people are dead, along with the USSR.
The President of Ukraine is a Jew!”
***
I am very much in the present. There are Ukrainian nationalists still celebrating Bandera and the SS Galacia with canlelight vigils.
Wake up, Nate. The nationalists forced a president in 2016 to pass a law honouring these Nazi SOBs.
The Unite the Right Rally in Charlottesville had some ‘very fine’ neo Nazis marching to prevent the removal of statues of Confederate Generals.
Should we have invaded, bombed, occupied the city?
It seems in 2016 there was a similar march in Ukraine honoring Bandera.
https://www.euronews.com/2016/01/02/ukrainians-march-in-honour-of-controversial-nationalist-hero-stepan-bandera
Also the far-right party supporting that 2016 march for Bandera was SVOBODA.
“Since then (2014), Svoboda has been polling below the electoral threshold, and it currently has one seat in the Verkhovna Rada. (the Ukrainian Parliament)”
https://en.wikipedia.org/wiki/Svoboda_(political_party)
“…and a lot of luck on the weather front, has helped Europe avert a crisis.”
Yes, this warm winter weather has provided an enormous political and economic lifeline to Europe and Ukraine and may push Putin to negotiate and shorten the war. Unfortunately, when dealing with a mad man you can’t depend on reasoning or rationality.
P.s.: The most consequential deals signed by the Ukrainians include ExxonMobil’s to explore for shale gas reserves across the country, Shell’s to explore the Yuzivzka gas field in the Donbass, and Chevron’s to explore the fields in the far west near the Carpathians.
Ukrain has confronted mad men many times in its long and proud history.
45,00043,000 BC: Neanderthal mammoth hunters build their dwellings in Ukraine.
42,00040,000 BC: Humans between the Danube and Dnieper Rivers domesticate the horse.
45003000 BC: Tribes of the Neolithic Cucuteni-Trypilian culture, producers of clay statues and colored pottery, call lands between the Danube and the Dnieper their home.
750500 BC: Greek trading colonies are established on the northern shore of the Black Sea.
1100: Romans establish their presence in the Greek colonies. Strabo identifies the Don River as the eastern border Europe, leaving present-day Ukrainian territories on the European side of the Europe-Asia divide.
250375: Goths defeat the Sarmatians and establish their rule over Ukrainian lands.
11871189: A Kyivan chronicler first uses the word Ukraine to describe the steppe borderland from Pereiaslav in the east to Galicia in the west.
1850s Oil exploration begins in Galicia, turning the Drohobych region into the world’s most productive oil fields.
andrea…the Ukraine as we know it now, as an entity, did not exist till 1922 when the neophyte USSR created it as a soviet. The area before 1922 was inhabited by factions who could not agree on anything. That form of disagreement has led to the current issues which were there before the Russian invasion.
The truth is, modern Ukraine has pro-Russian people trapped within its borders and until that problem is solved, there will never be peace in the Ukraine. Perhaps the solution proposed by the Russian invasion is drastic but it’s one way of solving the issue that the Ukrainians were unprepared to address.
The same applies to Lithuania, Estonia, and Latvia. If they don’t work out a peace with Russians trapped in their countries they are heading in the same direction as the Ukraine.
BTW, the Crimea was handed to the Ukraine by Khrushchev, the former USSR dictator who was Ukrainian by birth.
maguff…”Shells to explore the Yuzivzka gas field in the Donbass…”
Good luck with that one. They will be negotiating with the Russians.
This did not post first time and I forgot where I had posted it.
bill hunter…”More concerning is when the inventor of mRNA vaccines gets blocked by social media when talking about vaccines and their risks”.
***
Or when a former VP at Pfizer speaks out against mRNA vaccines and is censored by the same media.
I have referenced Stefan Lanka on this blog only to have him slammed by alarmists. Lanka discovered the first virus in the ocean and successfully convinced a German Superior court that no scientific evidence exists to support the discovery of the measles virus. He proved it to the court and a court-appointed expert on viruses agreed with him.
It’s important to note that he did not claim measles does not exist, only proof that a virus has been physically isolated as the cause. The point of Lanka offering 100,000 Euros as a prize to anyone who can prove a measles virus exists was to draw attention to the non-science behind virology in general. We have all been conned into believing that viruses exist when few of them have been properly isolated.
For the more obtuse among us, neither Lanka nor I have claimed viruses don’t exist, only that the proof offered of their existence is either no-existent or very poorly presented. Lanka bases his claim on a painstaking investigation into the history of viruses.
Anyone performing such an investigating must feel aghast at the lack of actual science done to prove viruses do exist. By 1935, one scientist lamented that no virus known could meet the demands of Koch’s hypothesis, at the time, the gold standard for identifying an infectious agent like a virus or bacteria.
The turning point came in the early 1950s when a scientist received a Nobel for claiming a viral infectious agent without supplying any proof to back his theory. He received the Nobel for a theory.
In the 1970s, the Louis Pasteur Institute put forward a method for physically isolating and identifying a virus. The final step was to view the virus on an electron microscope. When Luc Montagnier tried the method on HIV he could see nothing on the EM, so he inferred a virus. He openly admitted that on a hour long interview that is still available on the Net.
Since then, all major viruses identified have been done using Montagnier’s inferential method. None of them, like any of the SARS viruses, including covid, have been seen on an EM. There are certainly fraudulent fakes of such viruses on the Net but an expert like Lanka can dismiss them quickly.
An EM can produce only images in black and white and a size-marker has to be included to show the relative sizes. There is no way the spikes, alleged to be the means by which a virus attaching itself to a cell, could be seen at that size. In order to view the alleged virus, the viral material has to be sliced into slices about 100 nanometers thick so the electrons can penetrate it and pass through. That rules out over 99% of viruses seen on the Net.
About 15 years after he received a Nobel for discovering HIV, Montagnier went on record as claiming HIV will not harm a healthy immune system and that AIDS is caused by oxidative stress due to lifestyle. Although Montagnier was essentially admitting HIV was not the cause of AIDS, he clung to his delusion that he had isolated a virus.
Good scientists have known all along that AIDS is caused by the practices of male homosexuals and IV drug users. AIDS in Africa is caused by malnutrition, contaminated water, and diseases like malaria. HIV, if it exists, has been a passenger virus, as claimed years ago by Peter Duesberg. AIDS is caused by lifestyle.
So, what is covid? We know that people have died in relatively large numbers from a problem that features severe pneumonia. Unfortunately, the cause of the pneumonia has never been determined, only inferred. No one has ever physically isolated covid and the vaccines for it are fraudulently produced based on inference.
willard…”…we all make mistakes, and thus you cannot just take someones word and conclude that they are correct, even if they are an authority on the subject in question”.
***
That’s the entire point. We should never accept anyone’s word as an authority figure, that what they claim is correct. Doesn’t matter if it’s Einstein or Newton posing as the authority. Problem is, most people lack the ability to question either since it takes so long to understand what either has said.
These days, some take that to the other extreme. They claim under the ruse of a ‘fact check’ that certain experts are wrong based on trumped up evidence. What they are really trying to do is censor free speech by drawing ridicule on anyone who thinks outside the box.
For example, when Dr. Robert Malone, referenced earlier by Bill Hunter on mRNA, tried to explain the issues with an MRNA vaccine, he was censored by amateurs offering no evidence that they had the slightest understanding of mRNA. They simply referenced a nobody.
Malone is an expert in the field and should have been heard widely. The appeal to authority can be very dangerous when employed by nincompoops who are only interested in furthering an agenda.
C’mon, Gordo.
First, you’re quoting Graham.
Second, it’s a bogus argument.
No empirical argument resists fallibility.
Worse, the possibility to falsify a claim is like a big thing.
You would not like science to work by definition like Gentle Graham keeps doing, wouldn’t you?
No, that’s not the worst in your rant.
Worst is that you’re appealing to the bogus authority of Malone:
https://www.theatlantic.com/science/archive/2021/08/robert-malone-vaccine-inventor-vaccine-skeptic/619734/
Robert might be a biggest blowhard than you are. That’s such a feat that in matters of blowhardness I would defer to him. Just as I defer to you in ranting to no end without any fact or logic on your side.
"Second, it’s a bogus argument."
You’re telling me this:
"…we all make mistakes, and thus you cannot just take someone’s word and conclude that they are correct, even if they are an authority on the subject in question…"
is a bogus argument!? I didn’t think you actually rejected the logic behind the "appeal to authority"!
Gentle Graham just can’t take a hint:
https://www.drroyspencer.com/2022/12/uah-global-temperature-update-for-november-2022-0-17-deg-c/#comment-1421036
Silly Little Willy.
More hints Gentle Graham should have taken:
https://www.drroyspencer.com/2022/12/uah-global-temperature-update-for-november-2022-0-17-deg-c/#comment-1421124
He has to gaslight furthermore.
There is nothing bogus about the argument, Little Willy. It’s just basic logic.
No hint can ever travere Gentle Graham’s cranium:
https://www.drroyspencer.com/2022/12/uah-global-temperature-update-for-november-2022-0-17-deg-c/#comment-1421327
Vintage January 1, 2023 at 12:03 PM.
He has to gaslight.
Silly silly gaslighter.
There is nothing bogus about the argument. Hint away for the rest of your life. It changes nothing.
Gentle Graham gaslights furthermore.
It’s just basic logic.
Little Willy, please stop trolling.
(P1) Gentle Graham is fallible.
(P2) Whatever is fallible is a fallacy.
(C) Gentle Graham is a fallacy.
#2
Little Willy, please stop trolling.
Willard says:
Worst is that youre appealing to the bogus authority of Malone:
There are hundreds of scientists who contributed more to mRNA vaccines than he did.
Robert might be a biggest blowhard than you are. Thats such a feat that in matters of blowhardness I would defer to him. Just as I defer to you in ranting to no end without any fact or logic on your side.
———————-
This is why you are such an idiot Little Willy.
I said nothing about at all if Robert Malone was the best expert in the world, yet it appears from your post above it seems you already think you know the answer.
My comment was on an idiot like you having the power to censor Robert Malone for ignorantly hand selecting their preferred expert as the only legitimate voice and you actually believing that person was sufficiently qualified to make that selection without even knowing who that person was.
I thought I was responding to Gordo, Bill.
Malone invented mRNA. Don’t know if you can get any ‘stupider’.
BTW…Malone was the first to advise the public that the mRNA vaccine cannot prevent a covid infection. I guess that must have hurt poor old Pfizer because many medical types were upset at Malone for revealing that truth.
Thanks for link above, it confirms Malone discovered mRNA…
https://tinyurl.com/4dw3bm4e
C’mon, Gordo.
Why did Bill answer as if he wrote your comment?
Bill Hunter says:
”Worst is that youre appealing to the bogus authority of Malone:”
———————-
Bogus authority? Thats why I responded. Not only should he not be banned because he is not a bogus authority but folks running around calling out people as bogus authorities should rank much higher on the potential ban list. Nothing wrong with disagreeing with Malone but it is on you to say clearly exactly what you disagree with and why. Without that you are just a troll.
C’mon, Bordo.
Here’s what you said:
Next time – wait, no.
There’s no next time.
Here’s a little gift for you.
who is bordo? It was Bill h who wrote that line.
Come on, Bordo.
No need to play dumb:
Unless you prefer *Bordon*?
*Bordon* suits me fine,
Little Willy, please stop trolling.
”https://www.thefreedictionary.com/orbit”
orbit
noun
1. path, course, track, cycle, circle, revolution, passage, rotation, trajectory, sweep, ellipse, circumgyration the point at which the planets orbit is closest to the sun.
—————————-
Nate! I used your own dictionary link!!!
It is NOT a thesaurus! Though a thesaurus only provides words that are exactly the same or close enough to be used interchangeably. As you well know DREMT has provided you references showing astronomers calling an orbit a rotation.
You are so full of shit and stupid its ridiculous. You couldn’t win an argument with a 3 year old! Perhaps its a integrity problem or a psychological problem of always needing to be right. I think they call that narcissistic! do you need the definition of that?
Yep, its definitely the Thesaurus, giving a bunch of synonyms. Just stop being ridiculous.
Bill skips over the lengthy dictionary definitions at the link, https://www.thefreedictionary.com/orbit
and finds this under the THESAURSUS section.
“orbit
noun
1. path, course, track, cycle, circle, revolution, passage, rotation, trajectory, sweep, ellipse, circumgyration the point at which the planets orbit is closest to the sun.”
These are clearly SYNONYMS, but Bill FALSELY identifies them as DEFINTIONS.
Shameless.
“Though a thesaurus only provides words that are exactly the same or close enough to be used interchangeably.”
Hilarious.
Reminds me of a foreign student I worked with who had used the word FLEXIBLE to describe the wide applicability of an experimental method. He wanted to reiterate this point later with a different word so he consulted a Thesaurus.
Upon editing the paper I saw the phrase:
‘This technique is quite STRETCHY.’
nate…”This technique is quite STRETCHY.”
***
He was close. Had he changed ‘stretchy’ to ‘a stretch’, he’d have nailed it. Then again, he’d have needed to look up a dictionary on the vernacular. I think they might call them urban dictionaries these days although urban dictionaries seem written by idiots.
Nate says:
”Reminds me of a foreign student I worked with who had used the word FLEXIBLE to describe the wide applicability of an experimental method. He wanted to reiterate this point later with a different word so he consulted a Thesaurus.
Upon editing the paper I saw the phrase:
”This technique is quite STRETCHY.””
———————————-
first of all stretchy would be understood by anybody but an idiot.
And here is a counterpoint:
”Elliptical rotation is the motion of a point on an ellipse through some angle about a vector.”
https://arxiv.org/abs/1503.07895#:~:text=Elliptical%20rotation%20is%20the%20motion,product%20and%20elliptic%20vector%20product.
That vector be gravity in the case of the moon.
And Can a translating body have angular momentum. ”Yes, a body in translatory motion shell have angular momentum, unless the fixed point about which angular momentum is taken lies on the line of motion of the body. This follows from
|L|=rpsinϕL=0, only when ϕ=0∘orϕ=180∘.”
You lose as the point about which orbital motion has angular momentum is not on the line motion (by definition of an orbit) and it is approximately equal to Lorb+Lspin and it is NOT equal to Lorb.
The dangers of using a Thesaurus without understanding the language is clear for non-idiots.
Bill, whenever you mention angular momentum it is a sh*t show. Again so here.
Dont even bother.
Elliptical rotation is the motion of a point on an ellipse through some angle about a vector.”
This makes no sense!
We already have a perfectly good definition of ROTATION from Madhavi. What is wrong with that one?
”Elliptical rotation is the motion of a point on an ellipse through some angle about a vector.”
Then I suspect that you probably don’t have the qualifications to go to Cornell University.
And nothing is wrong with the Madhavi descriptions. She uses circles for examples because her areas of expertise doesn’t involve orbits. You have to look elsewhere like Cornell University to get their take on orbital rotation.
Gill,
First sentence from your own cite:
The study is about a numerical method to rotate an ellipsoid, not about a way to draw an ellipse using one single rotation.
“And nothing is wrong with the Madhavi descriptions. She uses circles for examples because her areas of expertise doesnt involve orbits.”
Bill you are a loser and a fraud.
You STILL doesnt understand the difference between a DEFINITION (what Madhavi gives) a SYNONYM (what you tied to pass off as a definition) and an EXAMPLE (NOT what Madhavi’s definition is).
Given multiple opportunities to DEFINE rotation, you are mute on the subject.
Bill scours the internet and finds an obscure out-of-context reference to the phrase ‘elliptical rotation’, in an mathematics paper, and somehow imagines that finding two words together is somehow DEFINING one of those words as the other, or something like that.
It is quite pathetic.
bill…”You [Nate] couldnt win an argument with a 3 year old!”
***
That’s an insult to 3 year olds.
Attempt at humor??
You guys are better off focusing on getting your facts right before posting.
2023-01 Gama launches its Gama Alpha solar sail mission
Keywords: Radiation pressure, photon momentum
Solar Sail Demonstration Mission.
A new spacecraft could soon be soaring through Earth orbit while gently being pushed by photons emitted from the Sun.
French aerospace company Gama launched its Gama Alpha solar sail mission to test out photonic propulsion technology, which keeps spacecraft in orbit without the need for fuel. The Gama Alpha cubesat was loaded on board a SpaceX Falcon 9 rocket and lifted off on Tuesday morning from Space Launch Complex 40 at Cape Canaveral Space Force Station.
The cubesat is roughly the size of a shoebox, while its large solar sail is about the size of a tennis court. The plan is for the sail to unfurl in Earth orbit at an altitude of 340 miles (550 kilometers).
Solar sails collect photons from the Sun, causing small bursts of momentum that propel the spacecraft. Solar sails do not need to carry any fuel, and they can operate indefinitely as long as there is sunlight available.
Video: Gama Alpha – Solar Sail Mission
From Foundations of Modern Physics by Steven Weinberg:
With the advent of special relativity it became clear that since Einstein’s quanta would have to travel at the speed of light, as particles they would have to have momenta equal to the energy divided by c, or hv/c.
This was confirmed by Compton’s experiment in 19221923 on the scattering of X-rays by electrons in atoms; Compton’s measurements removed the last doubt about the existence of Einstein’s radiation quanta. A few years later, they were given their present name, photons, by chemist G. N. Lewis (18751946).
You’ve heard of the Pioneer Anomaly (https://en.wikipedia.org/wiki/Pioneer_anomaly), no?
NASA engineers noticed an unexpected small deceleration of the early deep space probes Pioneer 10 and 11 as they moved away from Earth.
It was later determined that thermal radiation pressure exerted by emitted radiation from thermoelectric generators heated by small nuclear power sources, plus waste heat from the electronics, was the culprit.
The forward facing surface, radiating outward along the spacecraft trajectory, exerted a deceleration of 7-10×10^-10 m/s^2.
Cool!
P.s.: I have Weinberg’s Foundations book in my library. I also have The First Three Minutes – A Modern View of the Origin of the Universe by Steven Weinberg among others. 👍
🚀 🌌 👍
maguff…”The First Three Minutes A Modern View of the Origin of the Universe by Steven Weinberg”
***
The question for me was what he was taking when he wrote the book.
maguff…”It was later determined that thermal radiation pressure exerted by emitted radiation from thermoelectric generators heated by small nuclear power sources, plus waste heat from the electronics, was the culprit”.
***
No such thing as thermal radiation let alone thermal radiation pressure. Photons are defined as having momentum but no mass. How does a massless particle exert a force on anything?
f = ma, capisce?
Gordon,
F = dp/dt.
You acknowledge that photons have momentum. every time a photon gets absorbed, the photon loses that momentum and the object gains the momentum. The rate that the momentum is absorbed is the force.
tim…I have never claimed that a photon has momentum I simply said the definition claims that. I don’t think photons exist as defined.
momentum = p = mv
so, dp/dt = m.dv/dt = ma
f = ma = m.dv/dt
This tells you if a mass, m, is moving at a constant velocity. it has a constant momentum, like the Moon. In order to change the momentum, a force is required to either increase the momentum, slow it, or stop it.
If a photon has no mass, none of the above applies. When m = 0, dp/dt must be 0.
The concept of a photon to me is nonsense science. It was invented only to aid in the visualization of a quantum of EM.
andrea…”his was confirmed by Comp.tons experiment in 19221923 on the scattering of X-rays by electrons in atoms; Comp.tons measurements removed the last doubt about the existence of Einsteins radiation quanta”.
***
This statement is incorrect. It’s along the lines of the nonsense that the Sun bends light due to its mass. The Sun is a huge EM field and light is EM.
An electron is a particle that carries a negative charge. X-rays are very high frequency EM. EM is made up of an electric field orthogonal to a magnetic field and is produced by the electric field carried by electrons in atomic orbitals. Due to its electric charge, when it moves, the electron also produces a magnetic field.
Einstein knew nothing about the relationship between electrons and EM when he wrote his first paper on relativity, since the theory was not developed till 1913 when Bohr introduced it. I don’t know if Einstein blocked out Bohr’s theory, or thought it was wrong, but he failed to grasp the import of it, continuing to develop his theory of relativity which he began to issue in 1905.
The Sun is a massive ball of electrons and protons, hence it has a massive EM field. Light is EM of different frequencies/wavelengths. An EM field interacting with an EM field. Something is going to get bent.
sorry for posting in chunks. I m getting Internal Server error and cannot figure out what is causing it.
Come on, Bordon.
If you keep spamming with different emails and names, WP will start to believe you are spamming.
If you are so stupid as to think I am posting under different nyms, there’s nothing I can do but humour you.
C’mon, Bordon.
You seldom humor me.
Little Willy, please stop trolling.
P.s.: published in 1873.
Much as I admire Maxwell for his mathematical derivations, to be fair to him, he lived in an era before Bohr’s discovery of quantum theory. Also, he got some of his info from Faraday, who did actual experimentation involving electromagnetic fields.
Maxwell was a lot more mathematically astute than Faraday but he catered to mathematicians who refuted much of Faraday’s work because they did not understand it. To appeal to his math buddies, Maxwell had to translate Faraday into proper math terms.
He did brilliant work in that regard but he also put forth theories that don’t hold water today.
I an guessing that he got the concept of light pressure from Faraday’s work with magnetism. Magnetism can be created using an electric current through an inductor. Possibly, Maxwell tried to expands the concept to light since he knew it was an electromagnetic field. Unfortunately, they had no means of verifying that in those days. Furthermore, his concept of Em as theorized by Bohr was not as similar to eletromagnetism as he thought.
Although Maxwell was a fellow Scot, he was wrong about radiation pressure. Wonder if you have seen the device enclosed in a bulb that has tiny sails, black on one side and white of the other. It has 4 sails attached to an axle.
When light shines on it, the sails turn. Turns out the reason it turns is heating on black side. It affects air molecules, making them more dense on the black side than the white side, therefore the air currents turns the sails.
If there’s no air in space, they won’t turn.
from the article…
“Additionally, the minuscule size of the resonators employed in these experiments often makes it difficult to distinguish between two competing driving mechanisms: radiation pressure and photo-thermal effects…”
Good explanation of the light sails I mentioned (Crooke’s radiometer).
https://en.wikipedia.org/wiki/Crookes_radiometer
There are also idiots out there searching through physical space looking for the origins of the universe. There search is based on the fantastically stupid theory that all the mass in the current universe originated out of a nothingness in a tiny fraction of a second.
That in itself is based on the stupidity of E = mc^2. Some idiots believe that energy can be converted to mass, and vice-versa. The Big Bang theory is claiming, in essence, that a hidden energy was present in the beginning that suddenly, for no known reason, converted to the humungous mass we currently know as the universe.
You can believe that pseudo-science if you want but I am calling b***s**t. The same applies to evolution theory, time as a physical reality, and light driving a space sail-boat.
Andrea Weinberg at 8:24 AM
“With the advent of special relativity it became clear that since Einstein’s quanta would have to travel at the speed of light, as particles they would have to have momenta equal to the energy divided by c, or hv/c.”
Yes, that is the quantum description of radiation pressure.
Richard Feynman also gave the classical description as follows:
“That light carries energy we already know”.
***
Duh!!! The energy is known to be electrical energy and magnetic energy.
If you have light moving through empty space, there is nothing to absorb energy from it. Furthermore, no one…Feynman or anyone else….knows what electrical or magnetic energy is. Claiming it has momentum, a property of mass, is plainly ridiculous.
I know you and I head-butt over this but my motivation is to get you to think for yourself rather than quoting authority figures like Feynman.
I get it that Feynman was a brilliant physicist, but while listening to his lectures, I began to question his overall authority in physics. There are areas where he is plainly out of his league. No human has the corner on intelligence and he has alluded to that himself.
You quoted Feynman above…”The momentum that the light delivers is always equal to the energy that is absorbed, divided by c:
(dW/dt)/c”.
That is typical of the equation that Bohm deemed as garbage. Momentum requires mass, and light has no mass.
Feynman fancied himself as a bongo player, so much so, that he took trips to Brazil to drum in their percussion groups. He even taught at university in Brazil. Can you imagine Einstein or any serious scientist indulging in such frivolous past-times?
When Feynman worked at Los Alamos, helping develop the atomic bomb, he was nothing special. Just another run-of-the-mill physicist. He did nothing to enhance his reputation as a top-flight physicist, he appeared far more interested in playing bongos in Brazilian rhythm sections. Much of what Feynman contributed was in highly theoretical areas of physics.
One thing that bothered me about Feynman was a smart-assed know-it-all quality. Other equally gifted physicists, like David Bohm, had a humility through which they were willing to express questions about physics. For example, Bohm once claimed that any equation with no reality to back it, was garbage.
In a discussion with Jiddu Krishnamurti, in the book, The Ending of Time, Bohm declared that it is not clear to some people that humans invented time. In the book, he describes how we humans have integrated time as an illusion into our minds then regard it as a reality.
C’mon, Bordon.
Eistein played violin.
GR at 3:55 PM
DunningKruger much?
This also seems appropriate: https://en.wikipedia.org/wiki/Argument_from_incredulity
Argument from incredulity
Arguments from incredulity can sometimes arise from inappropriate emotional involvement, the conflation of fantasy and reality, a lack of understanding, or an instinctive “gut” reaction, especially where time is scarce.
This form of reasoning is fallacious because one’s inability to imagine how a statement can be true or false gives no information about whether the statement is true or false in reality
andrea…”Argument from incredulity….”
***
Once again we have someone using an ad hominem attack because he/she lacks the ability to present a scientific rebuttal.
maguff…”DunningKruger much?”
***
Actually, this applies to you, who relies on an appeal to authority. When your appeal authority fails, you resort to ad hom attacks and any other obfuscation handy, like looking up definitions on the net with which to assail those criticizing you.
andrea…”Argument from incredulity”
***
Anything but address the critique offered, eh Andrea?
What you call an appeal to authority I call Standing on the shoulders of giants, which interestingly is also a quote from Isaac Newton. Great minds think alike!
“Argument from incredulity” is not an ad hominem attack.
It perfectly describes your complaints, Gordon.
You are clearly saying that YOU are incredulous of much of 20th century physics.
And so what if you are? You being personally in doubt is not a sound argument against anything.
Especially not science that has lots of experimental evidence.
A friend of mine uses a ‘laser tweezer’ to manipulate small particles with laser light. It only works because of radiation pressure.
The forces that a laser tweezer applies are tiny yet easily calculated with the equations for radiation pressure.
nate…”You are clearly saying that YOU are incredulous of much of 20th century physics”.
***
Not so. I know nothing about 99.9% of the science performed in the 19th and 20th centuries. I comment only on science that falls within my ability to comment on it.
I knew by grade 10 that my interest lay in electronics. I did not know at the time that electronics is a branch of physics and based in quantum theory. That’s because electronics theory was never taught with quantum theory as its basis. I have always had an interest in anything scientific but like most others I simply accepted what I was taught or told.
Even when I studied EE at university I did not get the connection between bonds in chemistry, electron theory, and quantum theory, yet quantum theory itself is based on the relationship between electrons in atomic orbitals and the nucleus of the atom.
To hear many people talk about quantum theory one would think it a mysterious field filled with magic. The so-called magic is a product of delusionery minds attaching meaning that is not there. Quantum theory, a la Bohr, is a simple observation that relates electromagnetic energy to electrons in atoms. Even Schrodinger’s math representation is based on differential equations explaining that relationship.
There are a few matters related to science on which I comment, like anthropogenic warming, the non-rotation of the Moon, the non-existence of time, evolution theory, etc., which account for a tiny percent of science theory.
I am fully aware of the folly of questioning scientific principles based on a whim. It takes a gross contravention of logic or scientific theory to gain my attention. I am beginning to notice that many people pushing a paradigm rely heavily on an appeal to authority rather than logically thinking the matter through.
“I know nothing about 99.9% of the science performed in the 19th and 20th centuries. I comment only on science that falls within my ability to comment on it.”
I would hope that one would not be dismissive of what they know little about. So pls try to do that.
Keywords: Radiation pressure, photon momentum, Standing on the shoulders of giants
James Clerk Maxwell (1873), Einstein (Nobel – Physics 1923), Compton (Nobel – Physics 1927), Feynman (Nobel – Physics 1965), Weinberg (Nobel – Physics 1979).
There was a lot of theoretical bs being offered in the early 1920s as theoretical physicists tried to formulate explanations for Bohr’s quantum theory of 1913. Bohr’s theory could precisely explain one electron orbiting one proton in the hydrogen atom, but atom with multiple electrons were not covered. In the early 1920s, there was an explosion of theory offered to explain atoms with multiple electrons.
A lot of good came from that explosion, like a better understanding of chemical bonds and electronics theory, but in the end, it was nothing more than theory.
Linus Pauling, who was an expert on the chemical bond, went to Europe in the 1920s to study Bohr’s quantum theory. Hitherto that experience, he had gained expertise in xray diffraction, a practice of shooting xrays through thin sheets of a metal to reveal a partial atomic structure of the constituents atoms in the sheets.
Pauling discovered that quantum theory could not be applied directly to the molecular structures and he set about modifying the quantum equations to make a better fit. Circa 1923, scientists like Compton would have been guessing liberally about what was going on with radiation, especially as it applied to its interaction with matter.
Once again, I ask you to consider the facts. A photon as defined has no mass, but is given a property of momentum. How is that possible other than by mathematical trickery?
Physicist/meteorologist, Craig Bohren, in his book on atmospheric physics, once referred to such a momentum. He cautioned us to be careful in dismissing momentum as requiring mass, but he did not elaborate. There is food for thought in his claim, then again, proof is the essence of science.
For example, acceleration is mathematically related to a force and a mass through time, which has no physical existence. However, acceleration is also a real, physical phenomenon in that we can see a body changing velocity. So, we have the reality and we have the mathematical description.
No one can see or measure a momentum related to photons. All we have is the mathematical relationship, which relies heavily on Planck’s constant of proportionality, h. Unfortunately, by his own admission, Planck fudged the constant.
This is another case, as proposed by Feynman, that quantum theory works but no one knows why. Personally, I think quantum theory would work fine without the photon, as defined. We know electrons in atoms emit and absorb something that has a frequency and a magnitude, but why do we have to define it as having a momentum when we cannot prove that?
You just can’t learn. You are ruled by mysticism!
Again:
1) Arthur H. Compton demonstrated in laboratory experiments that photons carry momentum, and reported it in his paper published May 1923. http://users.isy.liu.se/icg/jalar/kurser/QF/references/Compton1923.pdf
2) This was predicted by Paul Dirac,
E^2=(pc)^2 + (mc^2)^2
3) You mistakenly believe that this is some obscure theoretical construct with no practical application. There are many industrial processes based on Compton’s discovery.
4) You keep arguing from incredulity which is a fallacious argument.
https://www.drroyspencer.com/2022/12/uah-global-temperature-update-for-november-2022-0-17-deg-c/#comment-1426597
“This was predicted by Paul Dirac”
***
Dirac was another one of the theorists I mentioned who prevailed in the early 1920s. They were grasping at straws, trying to explain the application of Bohr’s 1913 theory to atom with multiple electrons.
Why no one has questioned this pseudo-science is the question. We’ve had a century of scientists following a paradigm like a load of lemmings rushing off a cliff behind the leader. In universities, in EE courses, they still teach that electric current flows positive to negative because none of them have the guts to buck the status quo.
Now we have idiots teaching in universities that gravity is not a force but some kind of space-time anomaly. Science is going to hell in a hand-basket and people like you and Andrea are rushing to support the movement.
Gordon Robertson at 3:29 PM
“Once again, I ask you to consider the facts. A photon as defined has no mass, but is given a property of momentum. How is that possible other than by mathematical trickery?”
That is the best example of the Argument from incredulity (https://www.drroyspencer.com/2022/12/uah-global-temperature-update-for-november-2022-0-17-deg-c/#comment-1426597)!
This too good!
From the wiki page:
Arguments from incredulity can take the form:
1) I cannot imagine how F could be true; therefore F must be false.
2) I cannot imagine how F could be false; therefore F must be true.
Gordon Robertson has “left the building” rather than acknowledge the fact that he was wrong about photon momentum.
“The truth may be puzzling. It may take some work to grapple with. It may be counterintuitive. It may contradict deeply held prejudices. It may not be consonant with what we desperately want to be true. But our preferences do not determine what’s true.”
– Carl Sagan
maguff…”Gordon Robertson has left the building rather than acknowledge the fact that he was wrong about photon momentum”.
***
Maguff is still mired in the old thread. Dropped back to see you still blethering about radiation pressure. If you, or Andrea, had the slightest idea what it means, you would have posted a rebuttal to my argument. Instead, you rushed off to Wiki to find better ad homs.
As far as I can tell, your only argument is this:
“Once again, I ask you to consider the facts. A photon as defined has no mass, but is given a property of momentum. How is that possible other than by mathematical trickery?”
I told you that Compton proved in the laboratory that photons not only have energy but also momentum.
Then I told you that there are many commercial applications of Compton’s discovery in use every day.
You ignored both because you can’t disprove it.
So go ahead and run away, just remember that faccs ignored are still facts!
> Then I told you that there are many commercial applications of Compton’s discovery in use every day.
One of the most compelling, and lucrative, applications of Compton’s discovery is in geophysical formation density logging. It involves measuring the “transmissibility” of a portion of the subsurface formation adjacent to a well bore to gamma rays; this is done by bombarding the formation with gamma rays and measuring the intensity of back-scattered radiation a short distance away. With appropriate spacings, energy levels of source and detectors, and collimation techniques, an accurate correlation can be obtained between back-scattered gamma-ray intensity and formation bulk density.
The degree of Compton scattering is primarily a function of the density of the material. The source-detector arrangement for density logging is such that the greater the degree of Compton scattering and absorp-tion to which these gamma rays are subjected (hence the higher the density of the formation), the lower the response at the detector.
The source utilized can either be Cobalt-60 (half-life about 5 years) or Cesium-237 (half-life about 30 years). Detectors used were the Geiger Mueller counter in the early days, and scintillation counters now.
To perform a surveying operation the measuring instrument is housed in the logging tool and lowered into the borehole on the end of an insulated electrical cable after the drilling tool is pulled up. The cable itself is used as the depth measuring device, so that properties measured by the tools can be related to particular depths in the borehole. The measurements from the instruments are recorded digitally at intervals of between 3 and 15 cm.
The measurement is pre-processed in the logging tool itself and transmitted to the surface over several kilometers of wireline for further processing and storage in the surface computer.
https://en.wikipedia.org/wiki/Density_logging
As an undergrad I interned at Schlumberger-Doll Research working with the team charged with improving this tool and expanding its capabilities.
http://media.corporate-ir.net/media_files/irol/97/97513/2017ar/interactive/research-center.html
Yes AW, I think that application wins the prize for ingenuity.
Other applications that I’m aware of are:
1) Detecting corrosion hidden beneath an obstructing surface layer.
2) Inspection of concrete structures to detect local defects and discriminate between materials of different density and composition such as concrete, void, and steel.
3) Non-destructive testing for finding flaws in composite materials.
4) Density profile measurement in vessels containing mixtures of fluids with different densities.
It’s undeniable that Compton’s discovery is the gift that keeps on giving.
andrea…”As an undergrad I interned at Schlumberger-Doll Research ….”
***
What was your job, sweeping floors? Interns get grunt jobs.
andrea…”With appropriate spacings, energy levels of source and detectors, and collimation techniques, an accurate correlation can be obtained between back-scattered gamma-ray intensity and formation bulk density”.
***
What dies this have to do with the myth that EM has momentum?
maguff…”I told you that Compton proved in the laboratory that photons not only have energy but also momentum”.
***
You can tell me what you want, I am looking for proof that a mass-less particle has momentum. In fact, I am looking for proof a photon exists at all. The fact that a free electron can recoil when confronted with en EM field has nothing to do with momentum. It’s all about an EM field interacting with a negatively charged particle.
Compton was wrong. When he formulated his theory he knew nothing about the real nature of electrons and EM fields.
In fact, the same evidence used by some to claim a verification of Einstein’s theory of relativity makes the same mistake. Part of the proof offered is the Sun apparently bending light, the presumption being it is the mass of the Sun bending light. This is another case where the Sun, a teeming ball of electric charge, is interfering with light, a form of energy made up of an electric field perpendicular to a magnetic field.
“Maguff is still mired in the old thread.”
There are many science and engineering sites where I spend my time more constructively, where real experts provide insightful and stimulating discussions.
This site is what I call a twinkie for the mind.
Evidence that alarmists are coming here to discredit the great work of Roy Spencer and John Christy.
I might add, and getting their butts kicked for their effort.
Rare Green Comet is Coming
https://science.nasa.gov/comet-2022-e3-ztf
Wonder if the comet will keep the same side pointed at the Sun? If it rotates on a local axis, it won’t be able to do that.
maguff…”The DunningKruger effect is defined as the tendency of people with low ability in a specific area to give overly positive assessments of this ability”.
***
The irony here is people pointing at others as suffering the alleged effect while piously omitting themselves.
Low ability is emphasized by the fact that people like Maguff cannot explain, using physics, what is wrong with explanations offered by people like Myself. Rather they think nothing of rushing of to Wiki for the source of an ad hominem attack.
maguff…”I told you that Compton proved in the laboratory that photons not only have energy but also momentum”.
***
I got that. I am asking you to prove, without resorting to authority figures or equations, to prove that a particle defined as having no mass can have momentum.
Do you agree that momentum = p = mv = mass x velocity?
You’ll find in quantum theory that momentum is defined as an imaginary quantity. To me, that means it is defined mathematically using complex number theory but, in essence, there is nothing there.
The person making the extraordinary claim has the burden of proving that his belief has more validity than the one almost everyone accepts.
Your pathological aversion to authority figures and equations is the reason why you believe so many weird things, like that the Earth’s shadow causes the Moon’s phases https://www.drroyspencer.com/2021/03/uah-global-temperature-update-for-february-2021-0-20-deg-c/#comment-632695
The most important questions to ask when seeking an expert’s opinion are, how did they come by their conclusions? Were they guided by science?
When you say that “You’ll find in quantum theory that momentum is defined as an imaginary quantity” you need to provide a citation because it sounds like you have misunderstood something. You’re probably confused about a transform.
You may have misapprehended the lesson on imaginary numbers, that they are legitimate mathematical objects, and there is nothing “imaginary” about them at all!
That’s a mega blunder. Every grade schooler knows that the Greek philosopher Anaxagoras correctly explained the phases of the moon some 2500 years ago.
Why do people cling to false beliefs?
Gordon Robertson at 4:42 PM
“I am asking you to prove, without resorting to authority figures or equations, to prove that a particle defined as having no mass can have momentum.
Do you agree that momentum = p = mv = mass x velocity?”
In classical mechanics we have p = mv and KE = p^2/(2m), thus showing that kinetic energy is momentum, and vice versa.
Equivalently in quantum mechanics we have p = h/λ and E = pc, thus showing that, just like in the classical view, energy is momentum and vice versa.
To prove this you would irradiate an electron with a high energy photon and measure the λ of the scattered photon. By conservation of momentum the scattered photon will have less energy (longer λ) than the incident photon, thus proving that some of the incoming photon’s momentum was transferred to the electron.
And that’s all I have to say about that.
maguff..”In classical mechanics we have p = mv and KE = p^2/(2m), thus showing that kinetic energy is momentum, and vice versa”.
***
Kinetic energy is not energy per se, it is a descriptor for energy in motion. KE can represent any kind of energy as long as that energy is in motion. Momentum, on the other had, is reserved for the ability of a mass to resist a change in its motion, either from rest or from maintaining a specific velocity.
There is an equivalence between KE and p just as there is an equivalence between heat and work. However, neither quantities equal each other for obvious reasons.
More specifically, KE is a scalar quantity whereas momentum is a vector quantity. The equation, KE = p^2/2m shows only how momentum and KE are related at different velocities.
Also, KE has a quadratic relationship with velocity (v^2) whereas momentum has only a linear relationship with velocity.
If we write KE = 1/2 mv^2 and p = mv, we are talking about two different phenomena. The first represents the energy in a moving mass and the second describes the ability of that mass to resist a change in motion, or the impact it might have if it collides with another body.
With regard to quantum theory, it comes down to the supposition that the Lorentz relationship is accurate. In Einstein’s relativity, the so-called change of time alleged is based on the Lorenz relationship = y = 1/(1-v^2/c^2)
y = gamma
Lorentz put forward the idea that as a mass increased in velocity, it did so with the relationship above. Einstein bought into that theory and if it’s wrong, so his his relativity nonsense.
So, p = ymv in Einsteinian notation, and
KE = (y – 1) mc^2
Maybe you have bought into that nonsense but I have not. What it comes down to in essence is that the gamma factor must be applied to common expressions such as s = vt, which measures the distance covered by a mass with velocity, v, over the time period, t.
Time now become t’ = yt
An length becomes s’ = s/y
This is major bs since Einstein arbitrarily added a multiplier and divider to time and length to make them change as velocity -> c. He provided no proof that such changes are valid.
***********
“Equivalently in quantum mechanics we have p = h/λ and E = pc, thus showing that, just like in the classical view, energy is momentum and vice versa”.
***
p = h/lambda and E = pc do not apply as written since KE and p are operators not actual physical quantities. Quantum theory is heavily dependent on math, in particular differential equation theory, and the application of the related wave equations becomes seriously convoluted.
Your p and E should have little hats over them to show they are operators and not real physical quantities.
I accept your Gish gallop as a concession to my argument.
maguff finally reveals his true identity with the use of gish gallop. A quick scan of the blog, looking for alarmists who use gish gallop, one finds three names:
Svante, Ross Brisbane, and Nate. It seems Ross Brisbane would have been banned for taking shots at Roy. So, his current nym would be used by someone who is more careful.
Svante is long gone, but still a possibility. That leaves maguff and Nate. Hard to pick, they are equally stupid when it comes to science.
Still, the use of gish gallop is nothing more than an ad hom attack from a loser who cannot do physics.
You conceded the argument and now you’re just being silly.
>Your p and E should have little hats over them to show they are operators and not real physical quantities.
Why do you hate science?
The momentum operator corresponds to the possible values the momentum can take on in a given measurement.
There are also operators for angular momentum, energy, etc.
Stop corrupting science!
“The momentum operator corresponds to the possible values the momentum can take on in a given measurement”.
***
Not so. They apply to Schrodinger’s wave equation which is a mathematical model for quantum theory. The wave equation tries to describe the motion of electrons in orbits around a nucleus.
There is no way to equate momentum or KE as applied to quantum theory with the equivalent p and KE in Newtonian physics.
You know nothing about quantum mechanics, now do you?
Even wikipedia is too advanced for you but it is the most elementary source I can think of at the moment. Go to this site and study up on the section on Operators in Quantum Mechanics before you blunder further.
“The mathematical formulation of quantum mechanics is built upon the concept of an operator.
Any observable, i.e., any quantity which can be measured in a physical experiment, should be associated with a self-adjoint linear operator.
In the wave mechanics formulation of Quantum Mechanics, the wavefunction varies with space and time, or equivalently momentum and time (see position and momentum space for details), so observables are differential operators.”
Stop corrupting science!
Why am I debating quantum theory with an idiot who makes up nyms on the fly? From your description of quantum theory I know which one of us knows nothing about it, and it’s not me.
Quantum theory is entirely about the electron and its interaction with the nucleus. That’s what Schrodinger’s wave function addresses.
Refutation of False Science at 1:58 PM
“Why do people cling to false beliefs?”
First of all I would define a false belief as one that:
1) is unaccepted by most people in that particular field of study,
2) is either logically impossible or highly unlikely, and/or
3) the evidence for it is largely anecdotal and uncorroborated.
Then I can say that there is not a single answer to the question.
One is because they want to. It feels good. It is comforting. It is consoling.
Another is immediate gratification. Simple explanations for an often complex and contingent world makes false beliefs easier since scientific explanations are often complicated and require training and effort to work through.
The latter certainly fits the case at hand.
maguff…”First of all I would define a false belief as one that:
1) is unaccepted by most people in that particular field of study,”
***
Don’t have to look far to refute such a statement.
A while back, it was believed by the entire medical community that duodenal ulcers were caused by excess stomach acid due to stress. When Australian researcher, Barry Marshall, discovered those ulcers were produced by h. pylori, a bacteria that could thrive in stomach acid, he was essentially laughed out of town by you dweebs who appeal only to authority.
When Marshall submitted a paper to a journal it was not only rejected, the editor laughed off the paper as one of the ten worst ever submitted.
You have tried to reject many of my thoughts based purely on the same idiotic appeal to authority. Not once have you tried to reason against what I have claimed using your own words, based on your own understanding of science.
I have claimed time does not exist and I have offered irrefutable proof. You have offered no proof to counter my claim. I have offered that a mass-less quantity cannot have a momentum because momentum requires mass. You have thrown back at me garbage collected from authority figures.
“You have thrown back at me garbage collected from authority figures.”
Here’s a quote from David Bohm whose name you brought up January 8 at 3:35 PM.
Exactly what I said in my own words, but I can not take ownership of the discovery. Nevertheless, great minds think alike.
Having read Bohm extensively, it is apparent to me that you have cherry picked your quote from a much broader explanation.
You quoted hims as follows…”…when a radiation oscillator is excited to its nth quantum state, it has energy E = nhv, and momentum p = nhk, where n can change by one unit at a time”.
What is a radiation oscillator? No such thing, such a device is a thought experiment. Therefore any oscillation performed is entirely hypothetical.
DO you not understand, that in order to emulate the quantum world, license has to be taken. A quantum of EM was called a photon, defining it as a quantum of EM that has no mass but with a momentum. There is no proof a photon exists and Einstein acknowledged as much.
There is no way to compare the momentum of a real mass with that of a quantum of EM.
Obviously you have not read Bohm at all.
Also from Bohm:
“Note that the scattered quantum always has a longer wavelength than the incident quantum. Compton’s experiments verified eq. (5) and thus demonstrated that the energy and momentum of light are quantized according to E = hv, P = hk, and also that energy and momentum are conserved in individual scattering processes.”
Exactly as said. Great minds think alike!
I have wasted way too much time on this with someone who believes the Moon’s phases are caused by Earth’s shadow no less!
Parler has reportedly cut ‘majority’ of staff in recent weeks.
Parler parent company Parlement Technologies has cut the “majority” of its staff in recent weeks. The Verge reports that the company has slashed close to 75 percent of staff, including several executives, in recent weeks with “approximately 20” workers remaining between both entities at the end of 2022.
The layoffs seem to roughly coincide with other difficulties for the “free speech” social media app.
Parler was originally launched in 2018 but rose to prominence in 2020 as several high profile Republicans announced they were leaving Twitter in favor of Parler. The app billed itself as a “free speech” social network that eschewed the “censorship” of mainstream social media platforms like Twitter. It gained popularity as a free-wheeling alternative that had few rules or moderation policies.
This seems to be following the path that has already been taken by Twitter, Meta and other social media sites. Is it a temporary phenomenon or a sign of changing attitudes?
https://www.theverge.com/2023/1/10/23549198/parler-parlement-technologies-layoffs-gettr-george-farmer-candace-owens
I’m surprised it’s still around.
Parler was hacked two years ago and all the user data (including photos of verified state id cards) were retrieved and posted online. Not only that, but also posts that had been deleted, including selfies and videos by the insurrectionists who attacked the Capitol on 1/6.
The “hack” was comically straightforward since Parler imposed no password-like limits on who could use its API to query its site (or how often) to retrieve a particular piece of user content, and all of that user content was hosted at a series of sequential URLs in the order that each piece had been posted.
In retrospect it turns out that there were no violations of the federal anti-hacking statute, the Computer Fraud and Abuse Act. The “hacker” simply automated the collection of the same information that a user with no special privileges could have retrieved by hand. Just another tried and true technique that researchers have every right to rely on.
So, the FBI was actually following the law.
Good to know.
Testing
Anyone going to guess what Jan will be?
I am just give my wrong guess for Dec- to be twice
wrong, maybe.