Canada is Warming at Only 1/2 the Rate of Climate Model Simulations

January 21st, 2021 by Roy W. Spencer, Ph. D.

As part of my Jan. 19 presentation for Friends of Science about there being no climate emergency, I also examined surface temperature in Canada to see how much warming there has been compared to climate models.

Canada has huge year-to-year variability in temperatures due to its strong continental climate. So, to examine how observed surface temperature trends compare to climate model simulations, you need many of those simulations, each of which exhibits its own large variability.

I examined the most recent 30-year period (1991-2020), using a total of 108 CMIP5 simulations from approximately 20 different climate models, and computed land-surface trends over the latitude bounds of 51N to 70N, and longitude bounds 60W to 130W, which approximately covers Canada. For observations, I used the same lat/lon bounds and the CRUTem5 dataset, which is heavily relied upon by the UN IPCC and world governments. All data were downloaded from the KNMI Climate Explorer.

First let’s examine the annual average temperature departures from the 1981-2010 average, for the average of the 108 model simulations compared to the observations. We see that Canada has been warming at only 50% the rate of the average of the CMIP5 models; the linear trends are +0.23 C/decade and +0.49 C/decade, respectively. Note that in 7 of the last 8 years, the observations have been below the average of the models.

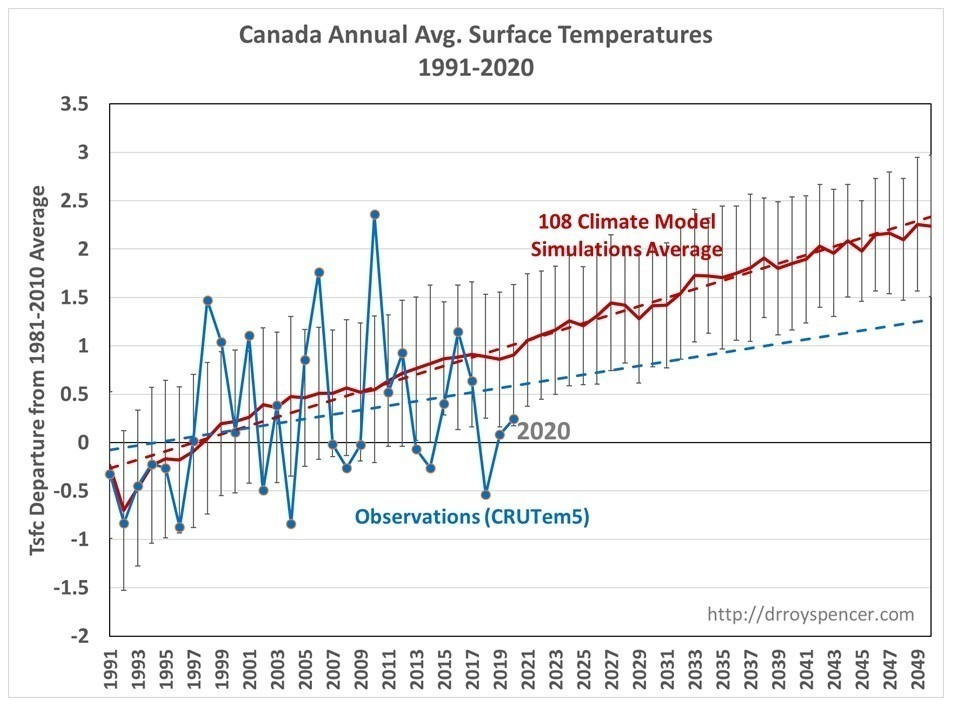
Fig. 1. Yearly temperature departures 1991-2020 from the 1981-2010 mean in Canada in observations (blue) versus the average of 108 CMIP5 climate model simulations (red). The +/-1 standard deviation bars indicate the variability among the 108 individual model simulations.

Next, I show the individual models’ trends compared to the observed trends, with a histogram of the ranked values from the least warming to the most warming, 1991-2020.

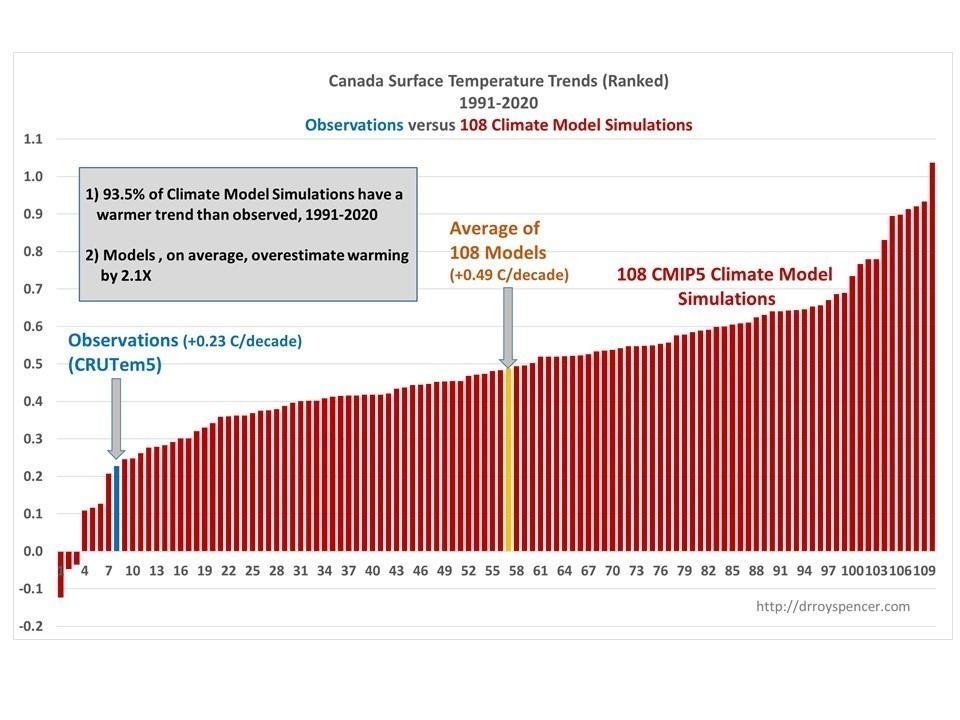
Fig. 2. Ranked Canada surface temperature trends (1991-2020) for the 108 model simulations and the observations.

Note that the 93.5% of the model simulations have warmer temperature trends than the observations exhibit.

These results from Canada are generally consistent with the results I have found in the Midwest U.S. in the summertime, where the CMIP5 models warm, on average, 4 times faster than the observations (since 1970), and 6 times faster in a limited number of the newer CMIP6 model simulations.

Implications

The Paris Climate Accords, among other national and international efforts to reduce greenhouse gas emissions, assume warming estimates which are approximately the average of the various climate models. Thus, these results impact directly on those proposed energy policy decisions.

As you might be aware, proponents of those climate models often emphasize the general agreement between the models and observations over a long period of time, say since 1900.

But this is misleading.

We would expect little anthropogenic global warming signal to emerge from the noise of natural climate variability until (approximately) the 1980s. This is for 2 reasons: There was little CO2 emitted up through the 1970s, and even as the emissions rose after the 1940s the cooling effect of anthropogenic SO2 emissions was canceling out much of that warming. This is widely agreed to by climate modelers as well.

Thus, to really get a good signal of global warming — in both observations and models — we should be examining temperature trends since approximately the 1980s. That is, only in the decades since the 1980s should we be seeing a robust signal of anthropogenic warming against the background of natural variability, and without the confusion (and uncertainty) in large SO2 emissions in the mid-20th century.

And as each year passes now, the warming signal should grow slightly stronger.

I continue to contend that climate models are now producing at least twice as much warming as they should, probably due to an equilibrium climate sensitivity which is about 2X too high in the climate models. Given that the average CMIP6 climate sensitivity is even larger than in CMIP5 — approaching 4 deg. C — it will be interesting to see if the divergence between models and observations (which began around the turn of the century) will continue into the future.


580 Responses to “Canada is Warming at Only 1/2 the Rate of Climate Model Simulations”

Toggle Trackbacks

  1. Nate says:

    Why select Canada? Why not all land in NH?

    • Roy Spencer says:

      Because I promised my Canadian audience I would do this.

      • Graydon Tranquilla says:

        Thank you Dr. Aroy Spenser for this highly valued data re: Canadian climate temperature compared to the erroneous climate modeling.

        Sadly the Canadian federal government is hellbent on destroying their own economy by fighting against its own natural resources Energy Industry!

        The Gods of Energy Planning Foolishness! A chapter from Prof Emeritus David Sanborn Scotts book entitled Smelling Land focusing excessively on Hydrogen as the silver bullet solution for our planets transportation challenges.

      • Just to nit pick, I would prefer this alternate title for the article: “The average climate model predicts double the actual warming in Canada”

        Does your analysis really consider 108 DIFFERENT models, or fewer than 108 models, with multiple simulations from some, or many, of the models?

        Of course a computer only projects whatever the programmers want projected. The computer output is just a complex version of the personal opinions of the programmers. Computers do not produce real data. The computer programs should be called “climate models” ONLY if thire climate projections are accurate … and that could be a lucky guess too.

        I would not care if climate models were accurate for one specific nation, even a large nation like Canada. But for the entire planet, on average, the computer games predict roughly double the warming that is measured, since 1979. So it is no surprise that Canada would have similar results.

        I would expect a Canadian audience to cheer for MORE global warming. Here in Michigan USA, the global warming since the 1970s, when I moved here, has not been sufficient. Anyone who does not like their slightly warmer climate is welcome to package some of their heat, and send it here. I’m hoping to retire my snow shovels someday.

        With climate predictions averaging 2x actual warming, except for the Russian IMN model, I think what we really have are climate computer games.

        Real climate models would provide accurate simulations / projections / predictions of the future climate.

        They would be getting MORE accurate over the decades.

        The climate computer games were not accurate in the 19780s and appear to be getting LESS accurate over time with CMIP6.
        It seems that accurate climate projections are NOT the primary goal for the computer games.

        I happen to know, with 101 percent confidence, that the future climate will be warmer, unless it gets colder. I’m hoping for warmer! A cooling climate would be an existential climate crisis.

      • Jimbo J says:

        You promised your audience you’d continue cherry picking. Why not for a little neutrality analyse, lets say a country like Australia aswell? Oh wait. You have no interest in neutrality, that’s right. Sorry, my bad.

        • WizGeek says:

          @Jimbo: Framing your comment as a polite request would likely be received far more warmly than an accusatory presumption (bordering on ad hominem) of non-neutrality. Maybe wording it like this: “Dr. Spenser, I would be very interested in seeing your same analyses applied to the Australian climate to see how they compare to the Canadian implications.” Something about “catching more flies with honey” applies here 🙂

      • Rune Valaker says:

        Dr. Spencer, your claim that climate models show too much warming is simply not true, please do not dispel this myth. This was true a few years ago when the temperature rise was lower probably due to a long-term negative PDO / IPO, after 2014 we have had a sharp rise in temperature and the models are now approximately where the temperatures are. Given the complexity of the system and the fact that we are not able to predict short-term (10 – 20 years) natural variations, I think this is pretty good;

        https://www.carbonbrief.org/factcheck-climate-models-have-not-exaggerated-global-warming

        Looking back at the data from 1850, one sees decadal variations up and down of a few tenths of a celsius, after 1975 this has only gone one way without the declines we have seen before, the natural fluctuations are now too weak to offset the underlying forcing, they can only impair the rate of heating.

      • Blaz says:

        While it is fine to cherry pick one country to show how they compare to the predictions, it doesn’t prove that the modelling got it wrong with the predictions of the whole planet. This is where statistics used selectively can be misleading. Were the predicted projections based on Canada’s predicted warming or was it just averaged out on world temperature predictions (one size fits all)?

        • Stephen Paul Anderson says:

          Blaz,
          Models become great in hindsight. Don’t you think?

          • bdgwx says:

            I can agree with that. That’s usually how things play out in all disciplines of science. Models get refined and our explanations of past observations get better and better.

      • Bill Watson says:

        In 2003 the Canadian Council of Ministers of the Environment,
        that is federal, provincial and territorial ministers,
        determined that most of the warming of the past century was at the low end of the scale, resulting not in warmer summers so much as less cold winters. In the context of global warming alarmism, Canada has seen negligible global warming and even at 1/2 the rate of Climate Model Simulations is overstating
        any warming. The CCME put it this way on page 6:

        “What all of this means is that except for the
        northeastern corner of the country more warming
        has gone on at the lower end of the temperature scale
        than at the higher end. The reduction in the number of
        cold winter nights has been more noticeable than the
        increase in hot summer days. So far, then, a warming
        climate has not made Canada appreciably hotter, but it
        has made it less cold.”

        https://www.ccme.ca/files/Resources/climate_change/cc_indicators_e.pdf

        • Paul Schmidt says:

          The only thing I would like to point out is that our Canadian Ministers of the Environment also say in their Tweets that Greenhouse Gases are Pollutants -just saying what they are saying,’don’t shoot the messenger’.

          Paul

    • Stephen Paul Anderson says:

      Nate,
      Maybe Dr. Spencer should confer with you before he posts anything?

      • Nate says:

        Stephen,

        You do know that Roy thinks Berry is completely wrong about atmospheric CO2.

        So it seems that either Roy or Berry is wrong.

        • Stephen` Paul Anderson says:

          Yeah, so what? They’re both entitled to their opinions. You, on the other hand, don’t think they are.

        • Nate says:

          Roy and Berry are entitled to their different opinions, as am I.

          “You, on the other hand, don’t think they are.”

          How do you get that from me asking Roy a question? Weird.

        • Nate says:

          Stephen you are always able to find evil intent, where none is evident.

          I can see now why you have authoritarian tendencies, as you cant deal with your heroes being questioned or doubted.

          Real scientists expect to be questioned and doubted.

  2. Mark says:

    Hello

    Can you share any historical temperature graphs of Canada pre 1991?

  3. bdgwx says:

    Dr. Spencer,

    What happens if you select Siberia?

    • Roy Spencer says:

      as mentioned above, I did this for a Canadian audience.

    • Richard Greene says:

      Siberia has had a lot of warming. I’m sure the few people who live there are thrilled. Yes, those warmer winter nights in Siberia are an existential climate crisis — a climate emergency … ha ha ha !

    • Richard Greene says:

      Lots of warming in Siberia.
      It’s a climate crisis.
      Existential crisis.
      Climate emergency.
      Warmer winter nights in Siberia !

      • bdgwx says:

        I don’t see the warming as an existential crisis or even an emergency. There is nothing in the IPCC AR5 report or SR15 report that makes those proclamations either. So I’m curious…where are you getting this idea climate change will be an existential threat and why do you choose to grant them legitimacy?

        • Richard Greene says:

          bdgwx sez:
          “I dont see the warming as an existential crisis or even an emergency.”

          That sensible statement is very disappointing because I was hoping you were a climate alarmist. Please say something more radical in future comments.

          The Green New Deal, and similar legislation, both passed and proposed, DOES assume a climate emergency / crisis / catastrophe.

          Almost any prediction of bad news in the future due to climate change (100% of predictions) is accepted without question by the mass media.

          Perfesser Gore, perfesser Thunberg and prefesser AOC have declared climate emergencies, and their proclamations are accepted as facts by most leftists.

          President Joe Biden calls climate change an “emergency”.

          Laws that mandate a rapid reduction of CO2 emissions must assume they are needed to prevent an existential crisis. What other reason could there be for replacing inexpensive and reliable sources of electric power, at great expense, with intermittent, unreliable sources of electric power, requiring
          the greatest expansion of mining and manufacturing (and CO2 emissions) in human history?

          The climate alarmists’ rush to spend a lot of money on THEMSELVES, to phase out fossil fuel electricity generation, is apparently much more important than spending that money to help the one billion people on our planet who will continue to live without any electricity?

          Maybe I can get you going by declaring that I love CO2 — it is the staff of life on our planet. CO2 is not a pollutant — that claim is anti-science.

          Adding CO2 to the atmosphere, when done using modern pollution controls, has helped ‘green’ the planet with minimal air pollution. And if that added CO2 caused any of the warming after 1975, which is a reasonable assumption, but not a proven fact, that’s more good news.

          The only bad news from fossil fuels is when they are burned without modern pollution controls. The resulting air pollution, visible over many Asian cities, is something that so-called environmentalists seem to ignore.

          • bdgwx says:

            Sorry to disappoint. I think I’m still an “alarmist” though because my position on the matter is pointed towards what the abundance of evidence says. That seems to be all it takes to fit into the “alarmist” box these days.

            And sorry for punting on the policy and political discussion…not my thing. I’m only passionate about the science. I’ll leave policy and politics for someone else.

      • Bill Watson says:

        That seems to be the extent of Canadian warming as well:
        What “all of this means is that except for the
        northeastern corner of the country more warming
        has gone on at the lower end of the temperature scale
        than at the higher end. The reduction in the number of
        cold winter nights has been more noticeable than the
        increase in hot summer days. So far, then, a warming
        climate has not made Canada appreciably hotter, but it
        has made it less cold.
        –Canadian Council of Ministers of the Environment in
        a 2003 publication.

        https://www.ccme.ca/files/Resources/climate_change/cc_indicators_e.pdf

        So instead of the -35*C to -39*C lows we have enjoyed in a
        recent week-to-10-day period, alarmist global warming would
        give us balmy -34*C to -38*C instead. Let the bells ring out and the banners fly.

  4. Hi Dr Spencer

    I found a similar result in the NASA GISTEMP LOTI Gridded temperature anomaly data. My article is called

    Most of Canada is currently cooling

    https://agree-to-disagree.com/most-of-canada-is-currently-cooling

    • Richard Greene says:

      A good article, Mr. Walker

      • If Canada warms by another 8 degrees Celsius, then it will have a climate similar to what America has today

        In case you wonder what that means, America is a fairly cold country

        Here are America’s temperatures (in degrees Celsius)

        – average = +12.1

        – winter = -5.4

        – summer = +30.5

        So if Canada warms by another 8 degrees Celsius, it will still be a cold country

  5. Ken Gregory says:

    Very interesting! Seven simulations show a smaller warming trend than the surface station measurements and 101 simulations show a larger warming trend than the measurements. We should only use the lowest 14 simulations for policy purposes and through out the too-high 49 simulations.

    I was surprised that you chose latitude 51 N as the southern extent of the area block used to represent Canada. The southern border of Canada’s four western provinces is 49 N. Much of the population of eastern Canada is south of 49 N. Note that Canada’s population centroid is at latitude 46.4 N, longitude 87.0 W, which is located south of Lake Superior in Michigan, USA.

    Here is a graph of Alberta’s daily average high temperatures in Summer (July & August) and daily average low temperatures in winter months;
    https://friendsofscience.org/assets/files/Alberta-ave-high-low-temp.jpg

    The high temperature from 1920 have an insignificant cooling trend of -0.040 °C/decade. The low temperature have a significant warming trend of +0.38 °C/decade. The warming is only of the cold temperatures. The Urban Heat Island Effect is about half of the land warming since 1980 according to several studies.

    I wonder how the measured daily average high temperatures of Canada compares with the climate models. I expect the discrepancy would be greater than the average temperatures.

  6. Harves says:

    And rather than the usual alarmists actually pondering what Roys data shows, all we get from them is look over there. What about Siberia? So typical and so funny.

    • barry says:

      The real answer to this is that regional projections are less certain than global, and that while global climate change is measured over 30 or years, sub-hemispheric temperature trends takes longer to determine (to rise to statistical significance). Dr Spencer has already pointed to the reason why, though he didn’t make the connection – annual temperature variability is more extreme regionally than for global.

    • For science, it doesn’t make sense to pick one nation or area, whether Canada, Siberia, or North Dakota.

      But the results for Canada since 1991 are about the same same as the results for the whole planet since 1979, so it’s hard to complain about cherry picking Canada. The results for Canada are not unusual.

      Climate models, on average, grossly over predict warming, except for the Russian INM model. so I call them computer games.

    • barry says:

      The time period is different. You’re not comparing like with like.

      Your point is also not correct. The Canadian trend Dr Spencer has indicated (0.23 C/decade since 1991) is higher than the global trend since 1979 regardless of which data set you use. The closest surface data is the Berkeley data set at 0.19 C/decade since 1979. The lowest trend is NOAA’s at 0.17 C/decade.

      • Richard Greene says:

        The average climate model over predicts warming, whether you look at Canada since 1991, or at the whole planet since 1979.

        So cherry picking Canada, and using 1991 as the start point, does not make the climate models look worse (or better) than the usual comparison looking at the entire planet since the 1970s.

        I would be the first to complain if cherry picking start and end dates, or looking at just one nation, created a misleading picture of how climate computer games, on average, have (over) predicted global warming since the 1970s.

        For a Canadian audience, I would have asked how many people were disappointed that the climate models were wrong, and they did not get all the warming they “deserve”!

      • barry says:

        So you’re not interested in getting the facts right, just pushing the message.

        Global surface temperatures have generally been within the model ensemble envelope – that is, if you put all the model runs together, so you can see the full range of year to year variability, the observations mostly fall within that envelope.

        Dr Spencer’s own data set, UAH, also shows global warming – with less difference in trends between UAH and the rest of the data sets than between the comparisons you called “about the same.”

        https://climatefeedback.org/claimreview/caleb-rossiter-falsely-claims-that-climate-models-are-running-very-hot/

        • Richard Greene says:

          Climate alarmist Barry
          The climate models are computer games. They over predict global warming. That generalization is correct even if one model, the Russian INM, seems accurate, or some simulations with other models seem “in the ballpark”.

          Accurate predictions do not seem to be the goal of climate models. The only goal must be to scare people about imagined future global warming.

          No one here denies that the planet has been warming for a few hundred years — about 20,000 years, to be more precise.

          The claim that adding CO2 to the atmosphere, and the assumption that it causes global warming is bad news … is leftist scaremongering. And the claim that electing leftists is the only way to prevent a climate crisis, is a self-serving lie.

          Adding CO2 to the atmosphere, and the mild warming for the past few hundred years, are both good news. If warming continues for another 100 years, that would be MORE good news.

          If environmentalists really wanted to benefit our planet, they would work to reduce air pollution, water pollution and land pollution. Burning fossil fuels without modern pollution controls is one cause of air pollution. But that doesn’t mean all uses of fossil fuels are evil — only deluded anti-science leftists believe that.

          • bdgwx says:

            They over predict global warming.

            CMIP6 overestimates the warming by a small amount.

            CMIP5 underestimates the warming by a small amount.

            The observations are within the 95% CI of both and are consistent with unforced variation.

            No one here denies that the planet has been warming for a few hundred years

            You haven’t been paying very close attention then. A lot of people here reject the evidence that the planet is warming.

            about 20,000 years, to be more precise.

            The planet had been in a secular cooling trend from the Holocene Climate Optimum until the industrial revolution.

            Adding CO2 to the atmosphere, and the mild warming for the past few hundred years, are both good news. If warming continues for another 100 years, that would be MORE good news.

            If you desire more warming then you should advocate for policies that encourage putting more GHGs into the atmosphere.

          • Stephen Paul Anderson says:

            No, they don’t support the notion there has been warming. They reject the notion that man has caused the warming or a reason to be alarmed.

          • Stephen Paul Anderson says:

            That is, they know there has been warming. There isn’t cause for alarm or caused by man.

          • bdgwx says:

            There are people here that reject the evidence of warming altogether saying that evidence is “fudged”.

          • barry says:

            Yes, right here in this very thread:

            “The global temperature is not rising but temperature data is being altered.”

            http://www.drroyspencer.com/2021/01/canada-is-warming-at-only-1-2-the-rate-of-climate-model-simulations/#comment-597130

          • Stephen Paul Anderson says:

            They’re saying the adjustments are designed to make the warming look more pronounced. I believe there has been recent warming. At some point, there will be cooling. Based on Berry, Salby, Harde, et al., the warming is mostly natural, is my belief. Leftists and media are using the recent warming to push their agenda, bigger government, and corporate taxes.

          • bdgwx says:

            That doesn’t make any sense. Over the instrumental record the net effect of all adjustments reduce the overall warming rate.

    • bdgwx says:

      I was wondering if some areas are underestimated by the same amount that other areas are overestimated.

      • Swenson says:

        b,

        In other words, is there an equal and opposite guess?

        Your guess is as good as mine, I suppose.

        What do you think?

      • Gerald Machnee says:

        No the NASA/NOAA are increasing the temperatures for the last 20 years. See Realclimatescinece for the numbers.

  7. Andrew Roman says:

    Hello Dr. Spencer,

    Thank you for your video presentation and your calculations for Canada. I found it amusing that while you can show that the average model is running twice as hot as the observations, the Canadian government is telling us that Canada is warming at twice the global average.

    After doing some research I found that many other countries had also announced that their country was warming at twice the global average. I wrote an opinion piece published in a Canadian newspaper and also provided a more detailed discussion of this phenomenon here: https://andrewromanviews.blog/2019/11/06/every-country-is-warming-twice-as-fast-as-the-average/

    • barry says:

      Would you be referring to the 2019 Canadian report on national climate change?

      The period examined in that report was 1948 to 2018.

      Had.CRU4 global trend 0.115 C/decade = 0.82 C total warming.

      That report said Canada had warmed by 1.7 C over the same period.

      • Richard M says:

        Barry, what is obvious is 1948 was a cherry pick to avoid the warm period from 1920-1945. When a person sees that kind of anti-science behavior they can only surmise the authors are also anti-science activists. Their report is not science.

      • barry says:

        Failing to read the report and making claims about it is not just anti science, it is anti education.

        When you get a chance, read up, see why they went with 1948 as a start date, and then form an opinion.

        • Richard M says:

          Barry, their reasons might be reasonable but are completely destroyed by the obvious cherry pick. You can have 100 reasons why you picked the rotten apple from the tree but it’s still rotten.

          • Tim Folkerts says:

            Richard, I don’t think you understand “cherry picking”. Here is one definition (from wikipedia).
            “Cherry picking, suppressing evidence, or the fallacy of incomplete evidence is the act of pointing to individual cases or data that seem to confirm a particular position while ignoring a significant portion of related and similar cases or data that may contradict that position. “
            As the report states, there simply is not a lot of data pre-1948 from broad swathes of northern Canada. Since there is not a “significant portion of related and similar cases or data” to look at, there is not “cherry picking”. There is nothing being suppressed if the data does not exist!

          • barry says:

            Richard,

            You didn’t even read what you gave an opinion on. The link was right there for you and you didn’t muster up the energy to click.

            You are free to say whatever pops into your head, and everyone else is free to understand that you are full of shit.

          • Richard M says:

            Tim, the excuses don’t matter. If the choice of dates has a significant effect on the results it is cherry picking. A real scientist would not have reported the obvious disinformation created as a result of that choice.

          • Tim Folkerts says:

            Richard, there was no “choice” to start in 1948 — that is all the good available data. Just like Roy didn’t “choose” to start in 1979. These are not “excuses” — they are limits imposed by the data available.

            I am also curious what “obvious disinformation” you are referring to. Do you have access to data from northern Canada from 1920-1945 that establishes the data trend in that region?

          • Richard M says:

            Tim,

            You know as well as I do that there is data before 1948 in Canada. In fact, if you statement was true it would mean no one has any right producing a global data set before 1948. Canada is one of the largest nations on the planet.

            I suspect Canada has more data than Siberia, all the southern oceans, most of Africa, most of South America, etc. Do I really need to go on?

        • Gerald Machnee says:

          The 1948 is a cherry pick as is that whole fictitious Changing Climate Report. It is filled with nothing but “humans are causing the temperature increase” using words like “very likely” and providing zero proof and measurements of CO2 causing change.
          They used 1948 with a poor excuse of missing data but then show charts of the world from 1850 and 1880. Nonsense! Most of the world and especially the oceans had no reporting stations. They filled the vacant areas, in other words FAKE data.
          Now if you go to Realclimatescience, you will find that more than half the observations used to give the public misinformation are now INFILLED.
          This is given to the gullible public and media.

  8. CO2isLife says:

    Dr. Spencer, would you publish the formula backing those “Models?”

    My bet is that they are basically Temperature = f(CO2) and not much more. That relationship is linear, so all they are doing is finding some coefficient to apply to the atmospheric CO2. Why is this an obvious flaw? CO2 isn’t the Independent variable, ΔW/M^2 is. The linear relationship proves these “experts” don’t even understand the basics of modeling.

    • Entropic man says:

      You might find this a useful gateway into the code and forcing used in the CMIP5 model.

      https://pcmdi.llnl.gov/mips/cmip5/guide.html

    • Entropic man says:

      “My bet is that they are basically Temperature = f(CO2) and not much more. ”

      IIRC you have it backwards.

      CMIP5 solves the Navier-Stokes equations for 40 variables to describe the energy status and energy flows in 25,000 grid squares. CO2 concentration is just one of the variables.

      Temperature change, climate sensitivity, etc are not input variables. They are the output of the model runs. Indeed, a big reason for running the models is to find out the ∆T and climate sensitivity outcomes of different forcings or different policy decisions.

      Ironically, in view of your comment, the main lessons from the output model runs are that short term variation ( decade or less) is due to forcings such as albedo, volcanoes and ENSO.
      The long term trend (30 years+) can best be explained as Temperature = f(CO2).

      • CO2isLife says:

        “CMIP5 solves the Navier-Stokes equations for 40 variables to describe the energy status and energy flows in 25,000 grid squares. CO2 concentration is just one of the variables.”

        They can have 1,000 variables. If the betas on those variables are 0.00, they are irrelevant. It is all smoke and mirrors.

        Those models clearly show a linear trend in temperatures. Almost all climate variables are variable. The only one that I know of that shows a near-linear trend over the past 150 years is CO2. Adding random variables to a model simply adds noise.

        Climate Science has clearly placed their stake in CO2 drive temperature. If now, why call it Anthropogenic? Man makes the CO2 that they claim is causing the Climate Change.

        100% of this fraud is directed at blaming man for climate change so the Government tax energy and fund their socialist utopian vision.

        • Richard M says:

          I think you will find the models follow “the science” they are based on. The smoke and mirrors is in “the science”. They have ignored saturation effects, natural cycles and negative high altitude water vapor feedback.

          Essentially, models have nothing to do with real science. I suspect if they were to incorporate the items I mentioned, they would track temperatures much closer and produce a very low climate sensitivity.

        • Tim Folkerts says:

          The models are not secret. Anyone who wonders how they work is free to learn more.

  9. Eben says:

    Is Canada the place to worry about warming ? Siriusly ???

    • Richard Greene says:

      Eben, how dare you bring common sense to this discussion !

    • Ken says:

      Is Canada the place to worry about warming?

      According to Paul Beckwith (alarmist extraordinaire) the modest warming is putting at risk the release of massive quantities of methane that is currently locked into the permafrost.

      I don’t think much of Beckwith’s projections. The part where it falls is the reconstructions that show it was warmer for most of the Holocene than it is now. If methane was going to melt out of the permafrost then it should have already done so. However, I don’t know that he is wrong either.

      If massive methane release from Permafrost is imminent then yes, warming in Canada is the place to worry about warming.

  10. Entropic man says:

    Two concerns regarding your method.

    1) May I ask why you took the average of 108 models? The models are based around a range based on possible forcings. They define an expected range within which the actual temperatures are likely to occur.
    The actual temperature depends on the actual forcings, which remain unknown except in retrospect. There is no reason to expect those forcings to be average, only to expect that they would be within the upper and lower boundaries of the range.

    2) Your graph shows 1 standard deviation either side of your average. If the ensemble average accurately reflects the actual temperature there is a 68% probability that the actual temperature will be somewhere within 1SD of the model average.
    That is true of the majority of the observed years.

    A statistically significant difference between model and actual result would be 2SD. You are a long way from demonstrating that.

    • Swenson says:

      EM,

      It is well known amongst modellers that averaging at least 107 wrong answers will miraculously give a correct one.

      Or, in laymans terms, one guess is as good as another.

      Alarmists pretend this is science.

  11. Dr. Luke Warmer says:

    Canada would have been beautiful during the Cretaceous when there was a tropical intra-continental sea. These geologic deposits are famous for oil and gas and extend into the US (in Colorado the Niobrara and in Texas the Eagleford unconventional oil plays). I was sort of hoping for a return to that! Beachfront property in Manitoba.

  12. DTurkfvkey says:

    roy wrote:
    “As part of my Jan. 19 presentation for Friends of Science about there being no climate emergency, I also examined surface temperature in Canada to see how much warming there has been compared to climate models.”

    so now roy only publishes before old ladies drinking tea, and not in the peer reviewed literature.

    old age, huh roy?

  13. DTurkfvkey says:

    plus roy expects $15 for his non-peer-reviewed thoughts!

    quite the racket. what is the evidence he’s worth that?

  14. DTurkfvkey says:

    trivia question #5: what was the last paper roy snuck into a journal that didn’t cause an editor to resign in disgrace?

  15. Nate says:

    Asia over the same period warming @ 0.40 C/decade.

    https://tinyurl.com/yyymwc9n

    And Europe @ 0.53 C/decade.

    https://tinyurl.com/y6db6pfo

    We can now see why Canada was selected!

    • bdgwx says:

      Thanks. That answer’s my question above.

      Obviously there are significant discrepancies between prediction and observation especially on small spatial and temporal scales. But the discrepancies are double-edged swords. The difference cuts both ways. Sure, models overestimate warming in Canada, the mid troposphere tropical region, etc. But they also underestimate warming like in Asia, Europe, Arctic, etc. They also severely underestimate Arctic sea ice decline. There is clearly still a lot of room for improvement.

      I do take issue with this statement though…“I continue to contend that climate models are now producing at least twice as much warming as they should”

      No they don’t. As of 2020 the global mean surface temperature is actually running slightly higher than the CMIP5 mean and slightly lower than the CMIP6 mean according to Dr. Hausfather’s updated state of the climate article. https://tinyurl.com/y35gbkkp

    • Nate says:

      I checked the same model Roy used for Europe (Lat,Lon: 0-60E,40-70N) and Asia (60-150E, 30-70N).

      https://climexp.knmi.nl/data/icmip5_tas_Amon_modmean_rcp45_0-60E_40-70N_n_+++_1991:2020_a.png

      I get ~ 0.44 C/decade for both.

  16. CO2isLife says:

    I’ll say this for the nteenth million time. That graphic showing a linear forecast of temperatures is simply a linear extrapolation of the trend in CO2. Their models may have a lot of smoke and mirrors in them, but CO2 is the only climate variable that shows a near linear trend over the past 150 years that I know of.

    Their model is clearly Temp = f(ΔCO2), that is a linear model, and that is a complete fraud.

    The only real model that will ever model the temperatures in Temp = f(ΔW/M^2), and W/M^2 = f(InvLog(CO2)), W/M^2 is not a linear function of CO2.

    • bdgwx says:

      Dr. Hausfather overlays observations with CMIP5 and CMIP6 over a much longer time period and for the global mean temperature as opposed to a select regional mean temperature. You can see that it is not linear. Notice the cooling periods from Agung, El Chichon, and Pinatubo. There is a lot of factors in play other than CO2. https://tinyurl.com/y35gbkkp

    • Entropic man says:

      Agreed. It is not increasing CO2 which does the warming, it’s the greenhouse effect. The change in temperature is due to the reduction in OLR energy flow in W/m^2 which results from increasing CO2.

      I put this up earlier.

      globalwarmingequation.info/eqn derivation.pdf

      “W/m^2 is not a linear function of CO2. ”

      In theory it is not linear. The decrease in W/M^2 is natural logaritmic, (∆F=5.35ln(C/Co)) so each doubling produces about 80% as much decrease in OLR as the preceding doubling.

      In practice, at current concentrations and rates of CO2 release the difference between linear and logarithmic is too small to notice.

      • Entropic man says:

        “The decrease in W/M^2 is natural logaritmic, (∆F=5.35ln(C/Co)) so each doubling produces about 80% as much decrease in OLR as the preceding doubling. ”

        Sorry, that came out wrong.

        The decrease in W/M^2 is natural logaritmic, (∆F=5.35ln(C/Co)) so each extra 280ppm of extra CO2 produces about 80% as much decrease in OLR as the preceding 280ppm.

        • Entropic man says:

          Try it.

          Going from 280ppm CO2 produces a direct decrease in OLR of

          5.35ln(560/280) = 3.7W/m^2

          Going from 560ppm to 840ppm

          5.35ln(840/560) = 2.17W/m^2

          Going from 840 ppm to 1120ppm

          5.35ln(1120/840) = 1.53W/m^2

      • Richard M says:

        Entropic Man,

        The 5.35 ln(C/C0) is the effect you would see from CO2 if it were the only GHG in the atmosphere or was not overlapped with water vapor. It’s not. The overall GHE is completely saturated due to all the other factors that come into play. All the energy that can be absorbed is already being absorbed.

        The GHE is real. It just doesn’t have any more energy available to increase its power. And, there are probably already enough absorbers that would increase the temperature if more energy somehow became available without needing more CO2.

        • bdgwx says:

          The 5.35*ln(C/Co) formula comes from Myhre 1998. It includes all spectral lines that saturate out. It is valid for any range of CO2 concentration that may be reasonably expected. Schmidt 2010 also has a good run down of the 2xCO2 and even 2xH2O forcings. We are no where close to an overall saturation of the GHE.

          • Clint R says:

            bdgwx, that nonsense “formula” is one of the first layers of your belief system. It is NOT science.

          • Richard M says:

            bdgwx,

            You have the wrong view of saturation. You are thinking of the saturation caused by CO2. I’m talking about the saturation of the available energy. There’s no more energy available. It’s already all getting absorbed. If existing CO2 hasn’t gobbled it up then water vapor did. More CO2 will not absorb what’s not available.

            The 5.35 number is probably correct if there was more energy available for CO2 to absorb.

          • Tim Folkerts says:

            “Theres no more energy available. Its already all getting absorbed. “

            Again, no. MODTRAN shows a clear change in energy emitted when CO2 changes. More CO2 absorbs more energy. The effects are small, but that is exactly what is expected.
            http://climatemodels.uchicago.edu/modtran/

          • Richard M says:

            Tim,

            Modtran is a model. CERES is observational data. The model shows more energy getting absorbed. The measurements indicate no change in the amount of energy getting radiated from the planet. Which are you going to believe?

            OK, trick question. I suspect the answer is they are both right. CO2 will absorb more energy when you increase its concentration. However, more total energy is not absorbed by ALL the GHGs. The reason is because water vapor adjusts and absorbs less energy. Of course, that is ignored by alarmists.

            I believe this has already been demonstrated in the data collected from 1997-2011 using ground based sensors. Under clear sky conditions they found more DWIR in the CO2 bands but not an overall increase in total DWIR.

    • Nate says:

      “That graphic showing a linear forecast of temperatures is simply a linear extrapolation of the trend in CO2. ”

      Nope. Where from?

      • CO2isLife says:

        1) The Models are wrong, so right off the bat I’m right
        2) The Models show a linear Trend in Temperature Forecasts
        3) Name me a single climate variable that shows a linear upward trend over the past 150 years?
        4) If this whole exercises isn’t a fraud to blame man for the warming and tax and regulate everything in the economy, why do they name it ANTHROPOGENIC Global Warming? The only variable they claim is changed by man is CO2 and maybe Farm Animals’ methane and crop production.

        • Entropic man says:

          The energy forcing due to CO2.

          The rate of increase of CO2 concentration is increasing exponentially and the effect of each increment of concentration is decreasing algorithmically (see my 10.24, 10.34 and 11.00am posts)

          The two cancel out, so the forcing effect in W/m^2 is increasing linearly, as is the recent increase in temperature.

          Plug the two into the relevant physics and you find that the increase in CO2 forcing accounts for the observed increase in temperature.

          • Richard M says:

            Entropic Man,

            Where does CO2 find the extra energy that would increase the temperature? All the energy in the relevant frequencies is already being absorbed.

            There’s a part of this picture I think you are missing. The atmosphere has the ability to radiate energy to space which is based primary on its emissivity. The only way to warm the atmosphere would be to increase the available energy (not happening) or to lower the emissivity.

            From CERES there is no evidence the emissivity of Earth is changing.

            The obvious conclusion is that the overall GHE is already saturated.

          • Tim Folkerts says:

            Richard says: “All the energy in the relevant frequencies is already being absorbed.”
            Nope. For example, look here. The “wings” of the bands are not saturated, and more CO2 leads to less energy emitted outward to space.
            http://climatemodels.uchicago.edu/modtran/

            [NOTE: MODTRAN is *not* a climate model. It is “used worldwide by research scientists in government agencies, commercial organizations, and educational institutions for the prediction and analysis of optical measurements through the atmosphere.”]

          • Richard M says:

            Tim,

            As I indicated earlier you are going by a model (I realize it’s not a climate model) vs. real observations.

            CERES shows no reduction in OLR which would be necessary.

            Gero/Turner 2012 found no increase in clear sky DWIR from 1997-2011. Meanwhile Feldman et al 2015 did find increases in DWIR from CO2 bands from 2000-2010.

            The obvious conclusion is some other gas is compensating for the CO2 increase. Obviously, that has to be water vapor. This is exactly what would be expected if all the radiation is already being absorbed. If one absorber increases another MUST decrease.

          • Richard M says:

            Tim, the wings of the CO2 is clearly a potential source for finding more energy. That’s why I referred to observational data. Two different sources cannot find more energy.

            The wings are available due to something called pressure broadening. This is the result of more collisions. As far as I can tell the overall atmospheric pressure is not changing in any measurable way. This is largely due to CO2 molecules replacing O2 molecules and many of them now getting absorbed into the carbon cycle. The net may be a lowering in atmospheric pressure.

            The amount of pressure broadening is therefore miniscule.

          • Tim Folkerts says:

            Richard

            1) I agree that measuring the small changes in upward IR would be tough. The satellites would be looking for around a 1% change (a couple W/m^2 out of an average of a couple hundred W/m^2). Further, that average is calculated from a sampling over a wide range of conditions (night/day, summer/winter, land/ocean, clear/cloudy, tropics/arctic). So the inability to find the signal in the noise does not surprise me. But that does not mean the signal is not there.

            2) “The wings are available due to something called pressure broadening. ”
            Not really. There are two broad issues here.
            First, quantum mechanics predicts a whole series of vibrational/rotational transitions for molecules. For CO2, there is a series of transitions resulting in series of possible photons with wavelengths around 15 um. But that “band” extends several um on either side. As you get away from 15 um, the ability to absorb drops rapidly (like many orders of magnitude).
            Try https://www.spectralcalc.com/spectral_browser/db_intensity.php with CO2, a linear scale, and wavelengths from 14-16 um. This shows the well-known predicted transitions.
            Also try a log scale from 5-40 to see the bigger picture.

            Secondly, what pressure broadening (and natural broadening and doppler broadening) does is to turn each of those perfectly sharp lines into a smeared out peak. This is important, but it NOT what causes the “wings”. The “wings” are from the allowed quantum transitions.

  17. Ken says:

    I want to move south before the glaciers are a mile deep again. Someone built a wall that will impede my passage.

    • Entropic man says:

      Don’t worry. Best recent estimate is that the glaciers won’t be a mile deep over New York for another 40,000 years.

      Plenty of time for the Wall to rust away.

  18. John Reader says:

    Dr. Spenser,
    Can you direct me to some further information on the SO2 cooling effects to which you refer in the blog? I would like to understand how the emissions were quantified and over what period, and also how the cooling effect could be estimated. Thanks.

  19. They are all stuck on current and past trends and will be left in the lurch if the temperature trend reverses.

    They however will never admit to a temperature trend reverse even if it should happen. They will come up with a 1000 and 1 excuses.

    I will simply say wrong and leave it at that. It is very likely to happen I think sooner rather then later but impossible to pin it down.

    Wish I could.

  20. CO2isLife says:

    Here is the problem Climate “Science” faces:
    This is not linear: (W/M^2)/CO2PPM
    http://theinconvenientskeptic.com/wp-content/uploads/2010/10/CO2-Forcing1.png

    This is near Linear: CO2 Concentration
    https://e360.yale.edu/assets/site/_800xAUTO_stretch_center-center/KeelingCurve_mlo_full_record_May-12-2019_web.jpg

    The Models are Near Linear:
    http://www.drroyspencer.com/wp-content/uploads/FoS-Canada-temperature-blog-post-Fig01.jpg

    The models simply defy physics, and will always over estimate temperatures, 100% of the time. Simply take this problem over to the Math Dept and they will tell you that I am right and Climate Science is a joke.

    • Entropic man says:

      I’m beginning to think that the only way to get anything into your head is to use a trephine.

      I’ve been saying all afternoon that in recent decades that the forcing effect of increasing CO2 has increased at a fairly constant rate and so has temperature. The amount of forcing matches and explains the amount of temperature change.

      The CO2 forcing is decreasing OLR directly by about 0.25W/m^2/decade.
      Add in the effect of midrange climate sensitivity and that increases to 0.75W/m^2/decade.

      Temperatures are increasing at 0.2C/decade. At 3.7W/degree C that represents an increase in incoming energy of 3.7/5 = 0.74W/m^2/decade.

      The direct and indirect effects of CO2 produce a change in rnergy imbalance of 0.75W/decade.

      Warming of 0.2C/decade requires a change in energy imbalance of 0.74W/decade.

      They match. One explains the other.

      If you can produce a similar calculation which demonstrates that another climate variable is increasing forcing by 0.75W/m^2/decade then I will take you seriously. Until then the match between CO2 forcing and temperature, the existance of a mechanism to explain it and the lack of an alternative will lead me to default to CO2 AGW.

      • Richard M says:

        Entropic Man,

        Your argument is essentially correlation = causation. Don’t think you’re going to convince many people with science backgrounds.

        The warming also correlates with ocean warming. Another perfectly acceptable scientific explanation.

        • CO2isLife says:

          “The warming also correlates with ocean warming. Another perfectly acceptable scientific explanation.”

          Yes, and that opens another can of worms. How can 15µ LWIR, which is consistent with a black body of temp -80C° possibly warm water? Ice, frozen water, emits 15µ LWIR. If 15µ LWIR actually warmed water, ice would melt itself. That is how absurd these claims are that CO2 warms the oceans.

          • Tim Folkerts says:

            “How can 15µ LWIR, which is consistent with a black body of temp -80C° possibly warm water?”

            Please learn some physics so you will stop with the “consistent with -80C” malarkey. 15 um LWIR is “consistent with” any temperature. -70C surfaces emit more 15 um IR than -80C surfaces. 20 C air over the ocean emits more 15 um radiation to the ocean than 15 C air over the ocean. It is the INTENSITY at a given wavelength that matters, not the wavelength per se. Until you include INTENSITY into your thinking, you will never understand.

      • CO2isLife says:

        “If you can produce a similar calculation which demonstrates that another climate variable is increasing forcing by 0.75W/m^2/decade then I will take you seriously. ”

        The oceans are warming. 15µ LWIR won’t warm the oceans, only high energy visible radiation provides the necessary level on incoming radiation to warm the oceans.

        To address your claim, show me a data set that accurately records the cloud cover over the oceans and the amount of radiation that is actually reaching the ocean.

        You can’t, and that is why Climate Science is a joke. Clearly to explain the climate you have to explain the oceans, and you don’t even bother to collect the basic data needed to do that. You focus on CO2 when you should focus on the cloud cover over the oceans.

        Simply identify a dry or cold desert and look at the temperature trend. There will be no warming over the past 120 years even though CO2 has increased from about 270 to 410. Explain how CO2 can warm some areas and not others and then I’ll take your “science” seriously, but trust me, the physics of a CO2 molecule are constant, and don’t change to satisfy the wishes of some political party.

    • Nate says:

      CO2. This is a science based blog. That means evidence based.

      Your declared ‘truths’ just don’t fly here.

      • CO2isLife says:

        “CO2. This is a science based blog. That means evidence based.

        Your declared truths just dont fly here.”

        Science Based? To be Science based you must rely on the Scientific Method, experimentation and rejection of a Null. Computer models isn’t evidence, especially when they don’t model the variable they claim to. Your “science” produces models that are inaccurate. That isn’t science, that is nonsense.

        I’ve explained how a real science would address this issue:
        1) Take the temp data for the entire holocene.
        2) Divide it into Per-Industrial and Industrial
        3) Calculate the mean and variation
        4) Is the Industrial mean statistically different from the pre-industrial mean to the 95% level?

        The answer is no. We are actually colder than many earlier parts of the Holocene, even though CO2 is much higher.

        Doubt me? Simple Google “Thermopylae” on Google Maps and then read about the Battle of Thermopylae and how the Spartans chose a location with the Ocean on one side and mountain on the other allowing only a 20 meter wide path for the Persians. Also google where the once coastal City of Troy is now located, of look at the Carthage Harbor. Sea Levels are much lower today than they were in Ancient times.

      • barry says:

        You have not stated your premise. That’s not science.

        If the methods is to divide the holocene into 2 parts, average temps and compare, then picking out smaller resolution periods to make a point is inconsistent application of method.

        You’re not doing science. You’re hunting for any framework of ‘reasoning’ that disproves a theory. That is not how science is done. That is how politics is done.

        • CO2isLife says:

          Nate Says: “You have not stated your premise. That’s not science.”

          Really? Here I will spell it out for you:

          Null Hypothesis: Climate Change is of Natural Causes

          To reject that, you have to prove that climate change mean and variation in the Pre-Industrial Data is statistically different than during the Industrial age. That is how real science is done. You state the Status Quo as the Null. Prior to the Industrial Age Climate change was caused by Natrual Forces. Do you disagree?

          Then a bunch of socialists discover that there is a lot of money to be made taxing Carbon, so they manufacture ANTHROPOGENIC Global warming. Problem is, they simply dictated that conclusion and got a bunch of like-minded socialists to form a “consensus.” Science by Dictate, not experimentation.

          Problem is, no one ever bothered to produce an experiment that rejected the Null that had existed since the beginning of time.

          So I say it again, will someone point me to the study that demonstrates that the Pre-Industrial Age Mean temperature is statistically lower than the Industrial Mean, or even current temperatures, at the 95% Confidence level? Show me that basic experiment that would have to have been run for Climate “Science” to be considered a true science that embraces the Scientific Method.

          BTW, look at the “Hockeystick.” The variability of temperatures before the Industrial age is enormous. Even using the Hockeystick and applying basic scientific and statistical analysis, you can’t reject the Null. That is how much a joke Climate “Science” is. They don’t even know how to interpret their own charts.

  21. Nate says:

    I had asked why not whole NH land?

    Following Dr. Roy’s approach I was able to find that trend for the observations CRUT 5 for last 50 y.

    https://climexp.knmi.nl/data/icrutem5_northern_hemisphere_1971:2020.png

    and for the rcp4.5 Model for Land Lat 0-80 Lon -180-180 for the last 50 y.

    https://climexp.knmi.nl/data/icmip5_tas_Amon_modmean_rcp45_-180-180E_0-80N_n_5lan_+++_1971:2020_a.png

    I found the trends were

    0.333 C/dec for the observations

    0.324 C/dec. for the RCP4.5 Model

    starting in 1991 is a bad choice because of the Pinatubo volcano.

    However if we start in 1996, we get

    0.346 C/dec for observations
    0.351 C/dec for the RCP 4.5 Model

    So is the idea that the Models arent working fake news?

    • bdgwx says:

      Oh…I didn’t think about Pinatubo. I’d like to see Dr. Spencer redo his analysis from 1980 (or earlier event) up to present.

    • barry says:

      I’m not sure if starting from 1991 makes a whole lot of difference considering the 30-year time frame. Here are trends from 1981, 86, 91, 96, 2001.

      https://tinyurl.com/y4wu4j29

      The trend from 1991 is pretty much the same as from 86 and 81.

      • Richard M says:

        Barry, the trend from 2001 is probably negative for Canada. This article is not about global data.

      • barry says:

        We are discussing the utility of using 1991 as a start date considering the Pinatubo eruption of that year and the subsequent 2-3 year cooling as a result. The aerosol dimming was a global event, so I chose global.

        But if I choose NH to match the hemisphere being discussed above, there is no difference to the result.

        https://tinyurl.com/y25zlo8m

        I noticed I had given the wrong graph, which didn’t include trends since 1981 and 2001, which I’ve rectified for the NH graph. So you’ve managed to do something useful by commenting for once.

      • Nate says:

        You can see in the model a deep dive in 1991-95 due to Volcano. In the model, the trend from 91 is affected.

        I think it has to make some guesses about the volcano strength. And maybe overestimates. Easy enough to avoid it.

    • Nate says:

      Also, looking at Land only.

      Dont miss the larger point that the models do seem to work, capturing the correct trends for NH land.

      Roy presents to the public only a region where models dont work well.

      Hmmm, I wonder why?

  22. ren says:

    Let’s look at the tropospheric counterpart of the stratospheric polar vortex. The temperature in winter in the northern hemisphere is closely related to the condition of the polar vortex in the stratosphere. The temperature in different regions of the Northern Hemisphere is variable and depends on the current stratospheric polar vortex pattern. As the surface temperature at high latitudes in winter depends on the stratosphere, CO2 has no effect on the winter / spring temperatures.
    https://earth.nullschool.net/#2021/01/23/0000Z/wind/isobaric/500hPa/overlay=temp/orthographic=-69.42,89.90,296

  23. SHanslien says:

    Dr. Spencer
    You use some local Canadian temperature data to support your contention:
    “ I continue to contend that climate models are now producing at least twice as much warming as they should, probably due to an equilibrium climate sensitivity which is about 2X too high in the climate models. “

    Some 6-7 years ago one of your favorite charts was this one, comparing global temperature with the CMIP5 models. https://docs.google.com/presentation/d/1J_wALfqiVIqOvcB_KHY-G9sggih_anqKVFINXn4dLVU/edit?usp=sharing
    This seems to be a far more relevant chart than comparing the models to the local Canadian temperature. I wonder why you no longer use an updated version of this chart to make your point? Is it because the subsequent data no longer support your assertion?

    • Rune Valaker says:

      There is a startling correlation between climate “skepticism,” the election was stolen and covid “skepticism.” The beauty of covid “skepticism” is that skeptics have already been exposed.

  24. Entropic man says:

    “Your argument is essentially correlation = causation. ”

    More the other way round. Causation = correalation

    In science if you have causation you usually see correalation. It is often the first step,the clue that causation is going on.You then investigate further.

    Three things to look for.

    A causes B.

    B causes A.

    A and B are caused by C.

    The chains may be more complex, but follow one of these basic patterns.

    Correlation is not enough on its own. To fully establish causation you need four more things.

    1) Obervational and or laboratory evidence.

    2) A mechanism.

    3) The absence of a credible alternative.

    4) The three Cs. Your theory must be coherent, consistent and consilient.

    CO2 caused AGW meets all the criteria.

    “The warming also correlates with ocean warming. Another perfectly acceptable scientific explanation. ”

    The climate system has four main parts. Ocean, land, atmosphere and ice.

    The ocean covers 70% of the planet and is the largest heat sink. Most of the energy entering the system enters the ocean before moving elsewhere and most of the warming would therefore be expected in the ocean. Indeed, if you audit the increasing energy content 90% goes into increasing the ocean heat content, 6% is warming the land and atmosphere, 4% is melting ice.

    You would expect all the different warmings to correalate with each other, but the cause is not any of them. It is reduced outward longwave radiation due to extra GHGs.

    A causes B,C,D and E

    Suggesting that heat generated in the ocean is warming the rest of the planet would not be a viable theory. Correalation, but no mechanism, no evidence, no 3Cs and a more credible alternative

    • Entropic man says:

      This was a reply to Richard M’s 4.22pm post. As often happens to me, it ended up at the bottom.

    • Clint R says:

      Ent, that’s “circular reasoning”. Here’s your nonsense, in a nutshell:

      1) C02 causes warming.

      2) Because CO2 causes warming.

      • bobdroege says:

        No poor widdle snowflake, that’s just restating a hypothesis and not circular reasoning.

      • Entropic man says:

        No.

        I am saying that CO2 caused warming because I have observational and laboratory evidence and a viable mechanism. The theory is coherent, consistent, consilient and there is no credible alternative.

        Rather better than your position that you don’t believe in it, therefore it must be wrong.

        • Clint R says:

          Ent, you can’t provide any REAL science to support your beliefs. Your nonsense is based on assumptions, guesses, and circular reasoning.

          That ain’t science.

          • Swenson says:

            Clint,

            Ent implies he has a theory! He is totally delusional. He cannot even describe the GHE in any cogent way, let alone propose a testable GHE hypothesis. He apparently just plucks a theory out of thin air – fully formed. Pity he cannot produce his imaginary theory. I always enjoy a good laugh!

            Usual alarmist fantasy. Cannot actually demonstrate that CO2 causes anything to get hotter, but obviously has faith that self styled experts like Hansen, Schmidt, Mann, Pierrehumbert, and their ilk, must surely know what they are talking about!

            What a sad, gullible creature.

          • Entropic man says:

            What is this REAL science you keep going on about?

            You won’t give examples, so I presume you can’t.

            Your REAL science is actually UNREAL science.

        • Carbon500 says:

          Entropic man: you say that you have observational and laboratory evidence that CO2 causes warming.
          Just what I want to see – a bench experiment, under standardised conditions (room temperature, pressure, and water vapour content along with convection available to the apparatus) which demonstrates conclusively how much warming incremental increases of 1ppm cause.
          I also want to see verification of the results by independent laboratories so that there is no doubt whatsover regarding the result.
          Can you supply the details of the laboratory evidence to which you refer?

          • Entropic man says:

            Go to your local university Physics Department and ask them to set up a gas tube. These are metal tubes with a mirror lining and rock salt windows at either end to allow IR to pass through. The students will fall over each other in their eagerness to help.

            At one end position a tunable IR source. Beside it add an infrared spectrometer to measure back radiation and another at the far end to measure transmitted radiation.

            Pressurise the tube with oxygen/nitrogen mix until you have an amount equivalent to the troposphere. Since the troposphere is 10km deep, a 10m gas tube might be pressurised to somewhere between 500 and 1000 bar.

            Shine IR into the tube equivalent to the black body emission at 288C.

            With no CO2 almost 100% will be transmitted with negligible back radiation. Increase the CO2 concentration in the tube in 1ppm steps and measure the amount of back radiation. Use the SB equation to calculate the heating effect of that back radiation.That takes care of the effect of downwelling longwave radiation.

            For emission to space at TOA reduce th pressure to 1/10 of its previous value and use the IT emission spectrum to 233K.

            Measure the effect of changing CO2 on transmitted radiation and you will see the decrease in OLR. Again use the SB equation to calculate the equivalent temperature change.

          • Carbon500 says:

            Entropic man: in no way can your suggested experiment reproduce what actually happens in the atmosphere.
            Meteorology it ain’t.

    • Richard M says:

      Entropic Man,

      There is no reduced outgoing radiation according to CERES. The OLR data matches UAH almost perfectly.

      The mechanism is increasing salinity as evidenced by Thirumalai et al 2018 along with known ocean cycles.

      Simple and supported by all the available evidence.

      • barry says:

        Roy Spencer – “Even the global LW energy loss isn’t known to 10 W/m2 absolute accuracy from CERES measurements. The instrument isn’t good enough.”

        http://www.drroyspencer.com/2019/09/critique-of-propagation-of-error-and-the-reliability-of-global-air-temperature-predictions/#comment-386887

        • Swenson says:

          b,

          Exactly. No useful measurements at all. Just dogmatic and nonsensical assertions.

          No heat trapping. Thats why the temperature drops to a minimum at night, and winter is colder than summer.

          Only gullible fools accept the stupidity called radiative forcing. A mythical part of the climatological double speak, based on strange concepts like heat trapping and accumulation, and adding temperatures.

          CO2 warms nothing. Heat does that, and CO2 provides none.

          None.

          • studentb says:

            Too complex for you old man?
            Time to give up.

          • Swenson says:

            s,

            Typical witless, fact free, pointless comment from another sadly pathetic science denier.

            No GHE description? No testable hypothesis? No theory?

            Just dogma and faith. Go on, trap some heat – do it during the summer, and you will make a fortune selling it during the winter. Try selling CO2 insulation at the same time. You might need to use some radiative forcing (or threats of violence) to make people believe such idiocy.

            Are you a supremely gullible nitwit, or just an ordinary nitwit?

          • studentb says:

            Maybe stick to your ball on a string problem. Any fool can opine on that topic.

        • Richard M says:

          Barry, I agree that the data isn’t accurate enough. So, let’s look at little further. Consider Gero/Turner 2012 and Feldman et al 2015.

          The sensors measured DWIR from 1997-2011. Feldman found that the CO2 bands increased from 2000-2010. However, the overall clear sky readings reported by Gero/Turner showed no overall increase in DWIR.

          Now you have two measurements which support the saturation hypothesis. Both are completely explained if the changes in the CO2 concentration simply change the percentage of total IR being absorbed by water vapor and CO2.

          As CO2 increases in concentration it absorbs more energy but because the total energy is unchanged we find water vapor absorbs less energy. It’s called a zero sum game.

          It also explains the MODTRAN results which don’t provide any information about water vapor.

      • Entropic man says:

        “There is no reduced outgoing radiation according to CERES. ”

        That turns out not to be the case.

        Go to the CERES link here and scroll down to the energy budget diagram based on their data products. They quote an energy imbalance of 0.71 W/m^2 with 95% confidence limits of +/- 0.1.

        https://ceres.larc.nasa.gov/science/#ceres-top-of-atmosphere-radiative-flux

        • Clint R says:

          Ent, the CERES data aren’t accurate enough. Models aren’t accurate to within +/- 0.1!

        • Richard M says:

          EM, the number you are referring to is basically missing energy. Its source is unknown. What you would need to see is an increasing trend. Did your reference mention any increasing trend? Nope.

          • Entropic man says:

            Richard M

            It’s not missing energy. It is energy accumulating in the system. Rather like your bank account where the balance increases when your spending is less than your income.

            The energy imbalance stays roughly constant while the rate of CO2 increase remains constant. If we stabilised the CO2 concentration tomorrow the increase in surface temperature would increase OLR at other wavelengths until the imbalance disappeared. Given the thermal inertia in the system that might take 25 years.

          • bdgwx says:

            EM described that pretty well already. Let me make a few more comments though.

            The current Earth Energy Imbalance (EEI) is +0.87 W/m^2 +/- 0.12. https://tinyurl.com/y9dzpkc3

            If we stabilize all forcing agents (GHGs, aerosols, solar, etc.) today the temperature would continue to increase. This drives broad spectrum OLR higher which works to lower the EEI. Once the EEI drops to 0 W/m^2 the temperature stops increasing and the climate system is said to have equilibrated. It takes 20-30 ‘ish years for the temperature to rise high enough to drive the EEI to zero because the oceans have a huge amount of thermal mass.

            It should be noted that the EEI is consistent with the expectations from the consensus theory of AGW.

          • Richard M says:

            EM,

            Some of us think the method of measurement is open to a lot of possible errors. Look at how long it took Roy to get the diurnal orbital problems fixed. There’s no telling how many errors exist in the CERES system.

            The imbalance is very likely due to errors.

            The good news is whatever errors exist the majority of them are likely to be constant. Hence, you can look at the data over time with a little more confidence. That’s what you need to do with this imbalance. Since CO2 is increasing the imbalance also needs to be increasing if CO2 is the cause. Is it increasing? No evidence that is the case. Sorry.

          • bdgwx says:

            The imbalance is very likely due to errors.

            The error on the EEI is +/- 0.12 W/m^2.

            Since CO2 is increasing the imbalance also needs to be increasing if CO2 is the cause.

            If the net radiative force is increasing by 0.30 W/m^2 per decade with a transient climate sensitivity of 0.65 per W/m^2 then the surface can warm at 0.2C/decade without the EEI increasing or decreasing.

      • Entropic man says:

        Is this the paper you referred to?

        https://agupubs.onlinelibrary.wiley.com/doi/pdf/10.1029/2020GL087613

        It is the only Thirumalai et al 2018 paper I found and it discusses the effect of precession cycles on long term variations in methane.

        • Richard M says:

          EM, here is the paper I was referring to.

          https://www.nature.com/articles/s41467-018-02846-4

          • Entropic man says:

            The paper discusses a correlation between Atlantic salinity and European rainfall. (I thought you weren’t a fan of correlation?)

            I’ve no problem with that. In the Younger Dryas Lake Aggasiz drained hundreds of cubic kilometres of fresh water into the Atlantic. The decrease in salinity shut down the thermohaline circulation and without the Gulf Stream Europe cooled.

            Using salinity changes to explain modern warning is a much bigger stretch, for which you have no evidence and no mechanism. Not have you any indication that it is coherent, consistent and consilient.

            If you want this hypothesis to stand up as an alternative to CO2 AGW you will need to do a lot more work.

          • Richard M says:

            EM, sorry you missed the key information in the paper. The paper itself is about other things. Try to get over being told what to believe and look at the data they collected. Specifically this figure:

            https://www.nature.com/articles/s41467-018-02846-4/figures/2

            You will note the DATA show increasing salinity along with increasing SSTs since the depths of the LIA. That is all the information I used out of this paper.

            We have observational evidence of a salinity increase matching increasing SSTs (that also is supported by basic physics). That is called “evidence”. Your denial is extremely hilarious.

          • Entropic man says:

            As I said before, the correlation is just the starting point.

            There’s no indication of causation. Is the rise in salinity due to the rise in SST or is the rise in salinity driving the rise in SST?

            There is precedent for the former.As the Gulf Stream travels, the high SSTs drive evaporation and increases salinity. By the time it reaches the Greenland Sea the Gulf Stream water is saline and dense enough to sink below the cooler and fresher Arctic water.

            From a physical viewpoint the best hypothesis is that increased SST causes increased evaporation. The increased evaporation causes the increased salinity and delivers more water vapour to Europe causing increased rainfall.

            Salinity correlates with increased European rainfall because higher SETs cause them both to increase.

          • Richard M says:

            EM,

            Higher salinity water requires more energy for evaporation. Try to put 2 and 2 together. This is not rocket science.

            The warming started 400 years ago. No CO2 increase to drive any warming. By far the most logical analysis would be that the salinity increase reduced evaporation letting the ocean mixed layer temperature rise.

            As the warmer waters neared the Arctic they would lead to more ice melting. This is a positive feedback opening up more water surface which allows even more energy to be released and more warming.

            BTW, the salinity is measured back in the Gulf of Mexico. Not near Europe where your idea would need the changes to occur.

            I do find your panic at the idea of a perfectly natural cause for the warming of the last 400 years to be informative.

          • Nate says:

            Richard,

            This is another ‘how to prove all of climate science wrong with this one simple trick’: salt.

            Skeptics all have their own pet theories. You all agree that it can’t be CO2, but little agreement on the alternative.

            Its the sun, its water vapor, its the ocean, its a ‘recovery’ from the LIA. Now its salt.

            Show us proper theories that are fleshed out in the literature, and supported by data, like AGW is, rather than speculation.

          • Richard M says:

            Nate,

            It appears you are also in denial of basic physics. The literature is full of studies showing the effects of salt ocean waters. All you need to do is read them instead of spewing silly denial. ALso, I provided you with a reference to one study showing the changes of salinity over time. There are more.

            Like EM you are clearly in the mode of “tell me what to think” rather than thinking for yourself.

          • Nate says:

            “one study showing the changes of salinity over time.”

            “It appears you are also in denial of basic physics. ”

            Weird non sequitur.

            This paper is not offering a theory for GW, nor are you.

            WTF are you talking about?

          • Richard M says:

            Nate, I never said the paper had anything at all to do with theories. It has data. Once again, try to think for yourself instead of expecting others to do it.

            The paper shows historic proxies with salinity and SSTs matching many other known historic temperature proxies. The MWP and LIA are pretty obvious. And, we know CO2 had nothing to do with those climate changes. Now factor in that known physics of ocean water tells us that changes in salinity could lead to the changes in SSTs.

            What we have a perfectly reasonable reason for the climate changes that have occurred over the past 1000+ plus years. It doesn’t need CO2 for those changes to have occurred. In essence, it resets the null hypothesis for anyone interested in real science. Remember, one of the claims from climate scientists is they know of nothing else that could have led to the recent warming. Well, now you have something.

          • Nate says:

            Richard, this seems to be your claim, hypothesis, or theory.

            “The warming started 400 years ago. No CO2 increase to drive any warming. By far the most logical analysis would be that the salinity increase reduced evaporation letting the ocean mixed layer temperature rise.”

            ENt is correct that you have correlation without causation (no theory). His explantion of the causation being reversed is AT LEAST as plausible as yours.

            The paper is helping us understand climate variability in the North Atlantic, and its impact on Europe, such as the LIA rainfall reductions. It is showing data that correlate salinity and mineral content to temperature, and it claims that this is a measure of Loop Current variation (AMOC). Fine, we know that the ocean currents have variations.

            But this is regional climate, confined to the North Atlantic, NOT GLOBAL.

            Globally the temperature rise of the last 100 years still rises up sharply out of the natural variation, which is smaller than the regional variation shown in the paper.

  25. Eben says:

    The huge spread of 108 climate models proves that the climate modeling is a complete farce , only the brain dead don’t see the obvious , taking the average of them as some kind of meaningful value is just an icing on the cake , or in this case, more like a fly on a cow pie.

    • Gordon Robertson says:

      eben…”The huge spread of 108 climate models proves that the climate modeling is a complete farce ”

      ***

      Now they are using the same kind of unvalidated models to predict the behavior of a virus no one knows anything about.

  26. Gordon Robertson says:

    As someone who has lived in Canada for decades, I see no evidence of global warming or climate change. We have three key mountains in the Vancouver, Canada area and each year they get about the same amount of snow. The local river, the Fraser River, which has its delta just south of Vancouver, has not risen to any degree, even in the tidal waters near the mouth of the river where it meets the ocean.

    The average winter temperature in the Vancouver area is about +5C. Been that way for decades. The only time temps drop to 0C or below is when cold air descends from the Arctic.

    Nope, our temperatures here in Vancouver are governed solely by the Earth’s orbit. As you walk around the sea wall in Stanley Park, you can see the tidal marks on the walls and they have not changed significantly if at all.

    Sorry, no global warming or climate change to report in Vancouver, Canada. Nothing to see here folks, kindly move along. you’re disturbing the penguins.

    • Tim Folkerts says:

      “our temperatures here in Vancouver are governed solely by the Earth’s orbit.”
      This is so obviously wrong. If this were the sole cause, then every year on Jan 23, the temperatures would be the same! Even if you meant temperatures averaged over the winter months, other factors like El Nino PDO make a difference.

      “The average winter temperature in the Vancouver area is about +5C. Been that way for decades. … Sorry, no global warming or climate change to report in Vancouver ”
      This is bad science on so many levels!
      * You are extrapolating from one city to the entire globe.
      * You are extrapolating from one season to an entire year.
      * You are simply ‘remembering’, not providing data.
      * You are not providing estimates of precision or variation (standard deviations).
      You simply don’t have the data to support your claim.

      I couldn’t quickly find data for winters in Vancouver, but annual temperatures have risen about about 1 C over the past 120 years, so yes, there IS evidence of local climate change. Which is consistent with global changes.
      https://www.reddit.com/r/vancouver/comments/eio7ga/over_the_past_119_years_vancouvers_annual_average/

      • Folkerts
        I prefer Gordon Robertson’s anecdote about the climate he actually lives in, to your mean spirited attack on him.

        I’ve lived in southeastern Michigan since 1977. Living in the same home since 1987, and four miles south for seven years before that. I’m happy it is somewhat warmer here than in the 1970s. I wish we would get MORE warming — I’d like to retire my snow shovels. I know more about the climate change I have personally experienced over the decades, without any measurements required, than any scientist with a PhD and a computer model.

        What I could not care less about are claims about the global AVERAGE temperature, a temperature that not one person lives in, that has not changed very much in the past 150 years. The climate on our planet is always changing, and I’m glad we live in a warming period during an interglacial, not a cooling period.

        Claims that global average temperature numbers are accurate before 1940, with sparse global coverage, are false. The pre-1900 numbers are just wild guesses, with almost no coverage of the Southern Hemisphere, and insufficient coverage of the Northern Hemisphere.

        The real debate, that is almost always ignored, is whether the warming in the past 325 years, since the late 1600s, was good news or bad news.

        It has been good news.

        Based on observations, including anecdotes and some measurements, of over 300 years of beneficial, intermittent global warming, there is no justification for claiming continued warming will be a “crisis”.

        The coming “crisis” is scaremongering by leftists — their always wrong wild guesses about the climate in 100 years are not real science. They act as climate astrologers, supported by nearly worthless computer games, used as props to make them seem like real scientists. Computers “predict” whatever their programmers want predicted. They do not produce data. That’s your type of “science”. I suppose?

  27. Entropic man says:

    “Sorry, no global warming or climate change to report in Vancouver,”

    Perhaps you are not paying attention.

    https://dailyhive.com/vancouver/temperature-records-hot-bc-september-10-2020

    http://www.env.gov.bc.ca/soe/indicators/climate-change/sea-level.html

    • Carbon500 says:

      Entropic man: Gordon is describing aspects of the climate where he lives.
      You’re referring to sea level changes – which have many causes – and some temperature variations.
      Neither of these is describes the climate of Vancouver.
      I’m inclined to believe Gordon,

      • Entropic man says:

        Vancouver is climatically rather like Northern Ireland. A wet maritime climate moderated by an ocean to the West and with very variable weather.

        In Ireland the weather life includes this

        If You can see the hills, it’s going to rain.
        If you can’t see the hills it’s raining.
        You know it’s Summer because the rain gets warmer.

        So variable that long term temperature trends get lost in the short term noise.

        In such conditions personal impressions don’t count for much, especially when your disbelief in climate change colours your perception. You need statistical analysis of the record to see the trend.

        Sometimes you find data in the oddest places. The gardener who cuts my lawn has 20 years of invoices. In December 2019 he was asked to cut a lawn in December for the first time since he started. It prompted him to look back. He reckoned that his grass cutting season starts a week earlier and ends a fortnight later than 20 years ago.

  28. Entropic man says:

    “As you walk around the sea wall in Stanley Park, you can see the tidal marks on the walls and they have not changed significantly if at all. ”

    They wouldn’t. The tide gauge for Vancouver Island records a sea level rise of 3.7cm per century. Isostatic uplift has raised the guage by 25cm over the same period, so your true sea level rise was 28cm. That’s about 8cm above the global average.

  29. CO2isLife says:

    Tim Folkerts says: “Please learn some physics so you will stop with the consistent with -80C malarkey. 15 um LWIR is consistent with any temperature.”

    • CO2isLife says:

      Thanks Tim, but you should take your own advice. In case you didn’t know, CO2 isn’t a black body. Its unique contribution to the GHG effect in only a very very very narrow band of LWIR between 13 and 18µ peak of 15µ.

      • Entropic man says:

        ” CO2 isnt a black body. Its unique contribution to the GHG effect in only a very very very narrow band of LWIR between 13 and 18 peak of 15. ”

        I think not. Like any other material CO2 will emit thermal radiation appropriate to its temperature in accordance with the Stefan-Boltzmann equation.

        The specific 15 micrometres emission is on top of the thermal radiation, not instead of it.

        • Tim Folkerts says:

          “The specific 15 micrometres emission is on top of the thermal radiation, not instead of it.”
          No, that is basically backwards. The emission from CO2 is black body thermal radiation INSIDE the 15 um band, and zero outside it. (To a first approximation.)

      • Tim Folkerts says:

        CO2, yes, that is a good start for wavelengths emitted — CO2 emits in a band around 15 um. Now (as I said before) you still need to understand the intensities. (And you are actually much closer then Entropic Man here.)

        Here is one way to gain insights.
        * Go to http://climatemodels.uchicago.edu/modtran/
        * Set the altitude to 0 and look up.
        * Set all the GHGs except CO2 to zero.
        The graph is now the radiation from just CO2.

        You will see a graph with several “guides” that show theoretical blackbody curves at various temperatures. You will see a huge spike near 667 cm-1 (or 15 um if you change the scale on the graph). This spike will follow the appropriate blackbody curve for the local air temperature. So if you work your way toward subarctic winter, you will see the spike getting shorter and shorter. (Or you can simply type a “Temperature Offset” to change the temperature however you like).

        The only thing “special” about -80C is that the CO2 spike will be basically flat at the top instead of slanted.

        The blackboy curve for a given temperature gives an upper limit; provides an envelope. The quantum mechanics of CO2 tells how close to the blackbody limit the radiation will be at each frequency.

        Cold CO2 emits weak 15 um radiation.
        Hot CO2 emits strong 15 um radiation.

        All of the temperatures are “consistent with” 15 um radiation
        Each of the temperatures is “consistent with” a specific intensity.

        • Entropic man says:

          Now this is interesting.

          Can I take it that diatomic molecules like oxygen and nitrogen with no strong emission lines at terrestrial temperatures follow the SB equation with respect to both intensity and frequency distribution.

          Molecules like CO2 with strong emission lines at terrestrial temperatures follow SB with respect to intensity, but only emit at their emission line frequencies.

          • Tim Folkerts says:

            “Can I take it that diatomic molecules like oxygen and nitrogen with no strong emission lines at terrestrial temperatures follow the SB equation with respect to both intensity and frequency distribution.”
            No.

            First, we should probably be referring to Plank’s Law, which gives intensities at any frequency (or wavelength) for blackbody radiation. Stefan-Boltzmann is basically just an integration of Planck’s Law, giving the familiar T^4 relationship between temperature and total energy emitted at all wavelengths.

            Planck’s Law gives an upper bound on the emission of thermal radiation from any surface at any wavelength or frequency. That includes not just solid and liquid surfaces, but hypothetical surfaces for a gas or for cavity radiation.

            CO2 emits quite well at 15 um, so even a relatively small container of CO2 will emit like a BB near 15 um. But will hardly emit anything at 10 um.
            N2 — which emits poorly at all wavelengths — will not look like a BB at any frequency. (Well, N2 does have a weak band near 4.5 um, and a few more near 2 um, so with a LARGE container of N2, it could emit like a BB in those bands. And there are a )

            And this is not a strange or unusual situation. Shiny metals also emit poorly at almost all frequencies. That means they also will not emit like a BB, and it mean they cool very slowly by radiation.

  30. CO2isLife says:

    Just as a refresher, here is the chart you seem to have forgotten.
    https://meteor.geol.iastate.edu/gccourse/forcing/images/image7.gif

  31. CO2isLife says:

    Challenge for all real Climate “Scientists.”

    Link to the “Hockeystick.”
    https://news.psu.edu/sites/default/files/styles/photo_gallery_large/public/hockeystick.gif

    In real science you take a mean, a standard deviation, and reject the Null at a certain confidence level such as 95%. You never prove anything, you just claim that you are 95% confident that the Status Quo Explanation is wrong.

    If you are right, and you reject the Null, your explanation then becomes the next Null to be disproven. Note, disproven, not proven. You reject the Null, you don’t prove the Null.

    Simply look at the wide variation of temperatures in the Hockeystick. The Standard Deviation is enormous routinely ranging from +0.5 to -0.5 or more. Current Temperatures appear to be +0.6, just outside the upper range boundary.

    Ignoring the completely laughable apples to automobiles construction of highly inaccurate and inconsistent proxies, Mike’s Nature Tricks to Hide the Declines, proxies and instrumental, and then just instrumental while inexplicably ignoreing all instrumental data prior to 1902, even if you accept that the Hockeystick is an accurate representation of temperatures, you still don’t reject the Null at a 95%. My bet is the Standard Deviation has to be around 0.4, so to reject the Null would would need temperatures to be upward of a full 1C°.

    Look at the entire Holocene and the whole claim of AGW becomes an even bigger joke.

  32. CO2isLife says:

    Another Challenge for all Real Climate Scientists:

    Simply apply the Scientific Method to Existing Climate Data for the Holocene. That would have been step #1 for any real science.

    Step #1: Null Hypothesis: Climate Change is caused by natural forces

    Step #2: Collect Ice Core Data for the Entire Holocene

    Step #3: Create a composite Holocene Temperature Chart

    Step #4: Create a Moving Temperage Average of 270 Years (The length of the Industrial Age)

    Step #5: Calculate the Mean Temperature of the Pre-Industrial Age Holocent, and its Standard Deviation.

    Step #6: Are current Temperatures outside 2.5 or 3 Standard Deviations from the Pre-Industrial Mean?

    Do that simple and basic experiment and you will put all the argument to bed. If Climate Science claims to be a science, start doing science, and start with the above simple experiment.

    • Tim Folkerts says:

      That is a pretty good start, but you missed a couple important ideas.
      1) 270 years is too long of a time period. The vast majority of CO2 was emitted in the most recent few decades. Averaging 200 years of no change with 70 years of change would hide the signal.

      2) It is not just the value that is of interest, but also the *rate* of change. Even if the value for the past few decades falls within the range of the past 10,000 years, that does not guarantee that current temperatures are in accord with natural variation. If natural variations are no more than 0.2C per century and the past century is 1.0 C, that is not in agreement with past changes.

  33. ren says:

    Sorry.
    Extremely low sunspot activity in the 25th cycle.
    https://www.iup.uni-bremen.de/gome/solar/mgii_composite_2.png

  34. Entropic man says:

    Already done.

    http://www.realclimate.org/images//Marcott.png

    Peak of the Holocene Optimum was anomaly 0.3C on the GISS baseline. Standard deviation about 0.1C.

    2020 was 1.02C on the same baseline.

    That puts 2020 0.72C or 7.2 standard deviations above the Holocene Optimum.

    Preindustrial was -0.2C on this baseline. 2020 is 1.22C or 11 SD above preindustrial.

    • Entropic man says:

      “Preindustrial was -0.2C on this baseline. 2020 is 1.22C or 11 SD above preindustrial. ”

      Oops. Make that 14.2 SD.

      • CO2isLife says:

        Historical Events:
        1) Battle of Troy circa 1200 BC, a coastal city, in now miles inland
        2) Thermopylae, a coastal chokepoint circa 480 BC, is now miles inland
        3) Carthage Harbor Circa 140 BC, has not been flooded, and remains today at sea level.
        4) 4,000-year-old forests are being discovered as the Alpine Glaciers recede.
        8) 3,000 year old forests are being discover in Iceland

        Bottom line, historical facts and data pretty much prove your “reconstruction” is pure nonsense.

        So I repeat, Make a composite of Ice-core data for the Holocene, and merge it with a composite of desert location temperatures for the past 150 years. When you do that, you will find that we are at the cold end of the Holocene.

        • Entropic man says:

          1), 2) and 3)

          Your examples are all from the Mediterranean, where the African plate and Arabian plate collide with the Eurasian plate.

          The surface rises and falls with every earthquake. What evidence do you have that the changes in apparent sea level you describe are actually due to true sea level change?

          I would also like to hear why sea level has apparently dropped at Troy and Thermopylae while remaining constant at Carthage.

          4) and 5)

          If 3000 and 4000 year old forests are being uncovered by retreating glaciers it indicates that temperatures are higher than when they were covered, which is what I’ve been saying.

          • Robert M. Wagner says:

            ET Says: Your examples are all from the Mediterranean, where the African plate and Arabian plate collide with the Eurasian plate.

            I’m sorry, are the physics of a CO2 molecule different in that region than the rest of the world? Also, would there be a reason why the Mediterranean would fall in sea level and the rest of the world increase? I’m sure I could find historical sites in China and S America that show the same.

            Your argument for the Earthquakes would apply everywhere, so I could say the same about every sea-level change, but I don’t. Do you have evidence that earthquakes caused the sea level to fall? Of course not.

            Sea level did drop in Carthage, the harbor is now slightly more inland, and land is now where the sea wall was. Carthage was a deep water port, so you wouldn’t expect it to be far inland as sea levels fall. Just look at the ancient drawings, there is no longer a large sea wall, but now there is land.

            Trees being discovered proves that temperatures have warmed, not that they are warmer than 3,000 and 4,000 years ago. A forest requires much higher temperatures than 0C° to grow. Try planting a seed in the winter and you will see it won’t grow.

          • Entropic man says:

            Robert M Wagner

            The forest we are discussing is taiga. -50C temperatures in a six month Winter and a brief Summer which reaches 21C. Annual average temperatures can vary from 5C down to -10C in some areas of Siberia and Alaska.

            https://en.m.wikipedia.org/wiki/Taiga

        • Nate says:

          CO2, pls convert your Historical events list to a temperature curve.

          Thanks.

        • Nate says:

          “1.Battle of Troy..now miles inland”

          “Scientists now believe that, over the centuries, this inlet became silted up with the deposits from rivers, pushing the coastline back to its present-day position.”

          http://news.bbc.co.uk/2/hi/science/nature/2736059.stm

          Oh well, nothing to do with global temperature….

    • CO2isLife says:

      BTW, even if I buy this nonsense.
      http://www.realclimate.org/images//Marcott.png

      It still doesn’t make the case for CO2 unless for some reason the physics of the CO2 molecule suddenly changes in I assume 1902 like the Hockeystick.

      That graphic is pure fraud, and simply would be shredded in any open-source and transparent analysis of its construction.

      • Entropic man says:

        Marcott et al 2013 has been cited and used by other researchers 1143 times in seven years. If there was anything much wrong with it, that would have become obvious and the citations would have stopped.

        Bad research is easy to spot. When someone else tries to replicate or extend it, the faults in a paper that does not match reality show up very quickly.

        • CO2isLife says:

          ET Says: Marcott et al 2013 has been cited and used by other researchers 1143 times in seven years. If there was anything much wrong with it, that would have become obvious and the citations would have stopped.

          Hello!!! The joke Hockeystick is the most referenced. Do you want to defend how “Mike’s Nature Trick to Hide the Decline” got passed the Peer Review? How many people critical of AGW do you think are on this rubber stamp Peer Review Board?

          • Entropic man says:

            If you’ve retreated into paranoia and conspiracy theories, then further conversation is probably not worthwhile. Goodnight.

        • CO2isLife says:

          ET Man says: Bad research is easy to spot. When someone else tries to replicate or extend it, the faults in a paper that does not match reality show up very quickly.

          There is 0.00% probability that an independent group of researchers would ever reproduce “Mike’s Nature Trick to Hide the Decline.” The only way the Hockeystick gets replicated is if someone takes the same flawed data and uses the same flawed calculations. Every reconstruction before the Hockeystick identified a Little Ice Age and Medieval Warminng Period. Artwork and other evidence prove that those events happened.

          • Entropic man says:

            A painting of Northern Ireland today would show show cover and frozen ponds. Doesn’t mean that those are typical conditions.

          • bdgwx says:

            MBH98/99 has been replicated many times. It is a whole hockey league of hockey sticks now.

            MBH98/99 is consistent with Hubert Lamb’s pioneering research regarding the the MWP and LIA. MBH confirmed what Lamb had already hypothesized. That is the MWP and LIA were most acute in the North Atlantic region. This is probably caused largely by oscillations in the Atlantic Meridional Overturning Circulation.

    • The pre-industrial climate, which is not a precise year, or a specific decade, is just a guess based on not very accurate climate proxies. There were very few weather stations in the 1700s. And no real time CO2 measurements.

      So you can take your tenths of a degree claims, and throw them in the garbage can.

      In addition, there is anecdotal information that people living in the late 1600s, and early 1700s, thought their climate was too cold — they would have LOVED today’s more moderate climate.

      Our current climate is the best climate for humans, animals and plants, for at least 300 years.

      No one with sense would claim 1675, or 1700, or 1725, or 1750 was the ‘perfect’ climate– in the past 4.5 billion years — and any change from then is a “crisis” — that is climate scaremongering for fools.

      The warming since th late 1600s s great news, and the extra CO2 in the atmosphere is ‘greening’ our planet — more good news.

      Doubling the current CO2 level would optimize C3 plant growth and support more life on our planer. Anyone who is anti-CO2 is anti-life.

      • Tim Folkerts says:

        Richard, I haven’t heard people claim any one era was the “best climate” or the “perfect climate”. And more CO2 would help many plants, so that would certainly be a beneficial effect of more CO2.

        The issue is the RATE of change. Plants and animals evolve and adapt to survive their habitat. Natural selection takes many generations. When change happens slowly, natural selection works quite well. But when the change happens rapidly, there is not time to adapt.

        That is the danger of climate change — the rate of change, not the value at any given time.

        • Your rate of change argument, Folkerts, is baloney, malarkey and balnana earl (Brooklyn, USA).

          Plants don’t need time to get used to higher levels of CO2 — they love more CO2 immediately, and with more CO2 in the air they grow faster, larger, and use LESS water too.

          The change in the global average temperature in the past 100 years, since the increased use of fossil fuels, has not been unusual, assuming the temperature estimates are reasonable (not accurate before World War II).

          Another +1 degree C. of warming, which could take 100 years, would be more good news. Perhaps someday the name “Greenland” will once again make sense?

          Satellite data have near global coverage, and they tell us the warming since 1979 was far from even.

          In fact, the warming was mainly where and when we would prefer it, if we had a choice:

          The most warming has been in the cold northern half of the Northern hemisphere = good news

          The most warming has been in the coldest six months of the year = good news

          The most warming has been at night = good news

          Think of warmer winter nights in Siberia, as one of the biggest changes from “global warming”

          And finally, the least warming has been in Antarctica, and the warming there was mainly local areas near underseas volcanoes, which CAN NOT BE BLAMED ON CO2 = more good news.

          And our planet is greening from more CO2 in the air, according to NASA satellites and the Leaf Area Index.

          So the past warming, which can not be blamed 100% on CO2 without making an assumption (there is no proof), looking ONLY at the warming since 1979, has been 100 percent good news all the way.

          It’s the climate scaremongers like you, who claim to see a coming crisis (claimed for the past 50 years) and want to disrupt western civilization to “prevent” that imaginary crisis, who are anti-CO2, anti-life, climate astrologers.

        • Tim Folkerts says:

          Richard,

          If you think I am “scaremongering”, please provide a quote where I engage in such pursuits.

          You, on the other hand seem to be the opposite — a “pollyanna” perhaps or a “cheerleader”. You claim climate change has been “100%” good. Not 90% or even 99%, but 100%.

          I fully acknowledge that there are benefits. But there are plenty of negative impacts, too. Sure, these are often overhyped, but they are negative nonetheless. For example … https://www.noaa.gov/education/resource-collections/climate/climate-change-impacts

          Back to the original point, plants and animals DO need to adapt. CO2 is not the only change! Temperature and rainfall patterns impact plants and animals. Even in something as mundane as gardening, recommendations based on hardiness have changed in just a few decades.
          https://blogs.massaudubon.org/yourgreatoutdoors/wp-content/uploads/sites/20/2017/03/Plant-Hardiness-Zones-static.jpg

          • Nate says:

            I notice that Richard always focuses on cold places to assert that warming can only be a good thing.

            Is he aware that there are many temperate, warm, and hot places in the world. People have migrated to these places because they are habitable with their current climates.

            Maybe he should query them to see if warming is good for them.

  35. CO2isLife says:

    I’m not sure if you understand how to read your chart:
    1) Even using your chart, we are just back to the top range of the Holocene, with much higher CO2
    2) If that temperature chart was accurate for the last 150 years, Sea Level would be much higher. Sea Levels haven’t been changing at an abnormal rate. New York is Safe
    3) Control for the Urban Heat Island Effect and Water Vapor, temperatures have been flat for over 120 years. https://data.giss.nasa.gov/cgi-bin/gistemp/stdata_show_v3.cgi?id=501943260000&dt=1&ds=5

    • bdgwx says:

      1. Had.C.R.U.T is a partial sphere measurement and so has a known cool bias. And the graph is only current through the late 90’s. When you switch to a full sphere measurement dataset through 2020 you’ll see that we are well above the Holocene Climate Optimum per Marcott.

      2. Present day sea levels are pretty close to expectations. Perhaps you have a different expectation? If so then the fact that sea levels are lower than your expectation is probably a pretty good clue that your expectation is wrong.

      3. That chart is for a single site. Note that Alice Springs is not the same thing as the entire Earth. For the global mean surface temperature use this graph instead. https://data.giss.nasa.gov/gistemp/graphs_v4/graph_data/Global_Mean_Estimates_based_on_Land_and_Ocean_Data/graph.png

      • CO2isLife says:

        bdgwx, did you intend to post a chart that literally shows no warming between 1880 and 1980? The chart bounces around between 1880 and 1980, and then heads higher. I’m sorry, did the physics of the CO2 molecule suddenly change in 1980? Nope. Do you know if there were fewer clouds over the oceans post 1980? Nope.

        If temperatures increased rapidly, so would Sea Level. Unfortunately I can’t post the Battery Park NOAA Link, but the trend is unchanged for well over 100 Years.

        Single site? You don’t understand science. Alice Spring was selected to isolate the impact of CO2 on temperature. There are plenty of other similar examples. Your temperature graph is nothing more than a measurement of the urban heat island effect, more humidity and fewer clouds over the oceans. It has nothing to do with the impact of CO2 on temperatures. Simply look at West Point vs Central Park. NY City is warming, West Point is not. CO2 is 410 at both locations and both locations are very close to each other.

        • bdgwx says:

          Yes. I definitely intended to post the global mean surface temperature anomaly history. It is not a measurement of the urban heat island effect. It is a measurement of…ya know…the global mean surface temperature anomalies. Berkeley Earth has a really good summary and quantification of the UHI effect here. https://tinyurl.com/szwhz8l

          There is nothing magic about Alice Springs (or any site) where all of the other climate forcing factors like albedo, solar, aerosols, unforced cycles, etc. remain constant. Nevermind that a single site is not representative of the entire planet. So trying to use a single site to test global scale hypothesis is a non-starter and it certainly isn’t going to isolate the CO2 effect you wish to quantify.

    • Richard Greene says:

      When the rich folks start selling their ocean side mansions, such as Mr. and Mrs. Obama, at bargain prices, I’ll start worrying about sea level rise.

      • Entropic man says:

        The rich can afford to move.

        What about the poor man whose house in Miami Beach became unsellable when seawater started flooding it on every spring tide?

  36. Clint R says:

    It has been pointed out before, numerous times, that fluxes cannot be treated as simple numbers (scalars). Fluxes cannot be simply added, subtracted, or averaged. Yet, the anti-science crowd clings to the “energy imbalance” nonsense.

    Here again is an example of why the “energy imbalance” is demonstrably anti-science.

    Two identical surfaces, each with emissivity = 1.0, have different temperatures, 290 K and 310 K. The emitted fluxes are 401 W/m^2 and 523.6 W/m^2, respectively. The average of the fluxes is 462.2 W/m^2. But the average temperature (300 K) corresponds to 459.3 W/m^2!

    There is an error of 2.9 W/m^2!

    Idiots ignore reality and refuse to learn.

    • studentb says:

      I am perfectly happy to add the two fluxes, subtract the two fluxes or calculate the average (462.2W/m^2) as you did.
      What is your problem?

      • bdgwx says:

        The issue in this case is that the average temperature (300K) and average flux (462.2 W/m^2) do not agree in regards to the application of the SB law. But that it is expected because 2 different areas and/or time periods are being referenced. You cannot add/subtract/average fluxes from different areas and/or different time periods and expected sensible results from the SB law. But nobody on here has suggested doing that so it is a strawman argument. What has been suggested is adding fluxes received upon the SAME area over the SAME period of time to get the total energy input for the body. That is obviously a valid method.

        • Clint R says:

          As usual bdgwx, that’s incredibly lame.

          Earth is not the same everywhere, either in composition or time. One side is in the dark as the other side is in sun. And, have you ever heard of “oceans”?

          No, your belief in the bogus “energy imbalance” is not supportable. But, you’re welcome to continue to reject reality.

        • Swenson says:

          b,

          Put a rock in sunlight. You claim it will just keep absorbing energy as long as the sun is shining. Getting hotter all the time, presumably.

          No use mentioning night time, is there? Alarmists claim that over 200 W/m2 of back radiation reaches the surface, even at night. Doesnt seem to make the rock any hotter, does it?

          The rock just keeps on warming up, and cooling down.

          Anybody who claims you are dumb as a rock, is being disrespectful to rocks!

          Use your brain for a change.

      • bdgwx says:

        BTW…here is the mathematical proof showing that fluxes are conserved when the reference the same time and same area.

        Let t equal a specific time period in seconds.

        Let A equal a specific area in square meters.

        Because energy is conserved…

        Etot = E1 + E2 + … + En

        and because E = F * t * A we know that…

        Ftot * t * A = (F1 * t * A) + (F2 * t * A) + … + (Fn * t * A)

        and factoring out (t*A) we have…

        Ftot * (t*A) = (t*A) * (F1 + F2 + … + Fn)

        and dividing both side by (t*A) we have…

        Ftot = F1 + F2 + … + Fn

        So if energy is conserved then we known fluxes must be conserved as long as they are in reference to the same time (t) and same area (A).

        • Clint R says:

          If you convert flux to energy, that works. But, your “energy balance” does not convert to energy. The reason is it won’t work, if you do. Your bogus AGW nonsense goes away.

        • Swenson says:

          b,

          Complete nonsense. You and your stupid misunderstanding of fluxes!

          Add 300 W/m2 from ice, to 300 W/m2 from the sun – say 5500 K. That is about as stupid as saying temperatures add! You claim you now have 600 W/m2, which is complete nonsense. As stupid as adding 273 K to 5500 K, and claiming the result is valid!

          Absolute rubbish!

          By the way, you completely redefine the conservation laws in a way that makes no sense at all. As alarmists do. About as stupid as Tim Folkerts claiming that CO2 can only absorb and emit photons of particular energy content!

          Carry on with the delusions.

          • bobdroege says:

            Crack that Quantum Electrodynamics textbook, but first take the plastic off.

            It will tell you that you are wrong.

            Poor deluded person.

          • Swenson says:

            bob,

            At least you got the name right, this time, and you won’t have to give your usual grovelling apology. Well done.

            Maybe you might try to correct any of my statements you believe are wrong.

            Feel free to use QED theory to back yourself up.

            If that fails, you could always try appealing to the authority of those at your level, but why would anybody believe you?

          • Tim Folkerts says:

            “About as stupid as Tim Folkerts claiming that CO2 can only absorb and emit photons of particular energy content!”

            Take that up with Niels Bohr, not me. Based on well-known observations, Bohr came up with a theory over 100 years ago to explain why hydrogen can only absorb and emit photons with particular energy contents. Since then, numerous others have expanded and refined the theory for other atoms and for molecules.

            This is literally “textbook physics” that has been around longer than any of us have been alive.

          • bobdroege says:

            Swenson,

            This is wrong and it’s what you posted.

            “About as stupid as Tim Folkerts claiming that CO2 can only absorb and emit photons of particular energy content!”

            If there is no transition available the molecule won’t absorb or emit a photon of that particular energy.

            Again you are just a poor deluded fool who hasn’t studied any of the relevant science and just name drop to look like sophisticated man about the town.

          • Tim Folkerts says:

            Bob, Yep. This is basic physics. And some basic critical thinking skills immediately show it is wrong.
            * If CO2 *could* absorb all frequencies, the sky would be black, because visible light would also get absorbed.
            * Other gases are well-known for absorbing particular bands of light — like O3 absorbing UV. (And of course, the whole Bohr model again).

          • bobdroege says:

            Tim,

            It may be basic physics, but it’s also the hardest subject I ever studied.

            You really want to be a chemist, well in this course we will try to change your mind.

        • Gordon Robertson says:

          bobd…”So if energy is conserved then we known fluxes must be conserved as long as they are in reference to the same time (t) and same area (A)”.

          One problem, Bob, you cannot lump energy in energy conservation into a neat and tidy formula as you have done with E = E1 + E2 +….. Also, not all energies involve flux. Only a few energies, like electromagnetic, including pure electric and magnetic energy, have a flux.

          The first law does sum energies but not in the method you have employed. It sums external heat and work, because they are equivalent, and balances that sum against internal energy, which is a summation of internal heat and work. You cannot add heat and work since they are measured in different quantities but you can work out the total energy by measuring external heat and work and knowing initial and final temperatures.

          I have gone into this before, the use of a generic energy in such arguments is futile. When you talk about thermal energy and electromagnetic energy, you cannot add them. They are entirely different forms of energy and have nothing in common that can be added.

          That’s the mistake made by people trying to overturn the 2nd law. The 2nd law is about heat transfer and has nothing to do with EM. Yet, people have argued that a ‘net balance of energy’, if positive, satisfies a transfer of heat from cold to hot. Not possible. There is no such thing as a net balance of energy that involves EM and heat.

          Heat can be converted to work and vice versa. There has to be a conservation of energy in that transfer but heat and work are measured in different values, joules for work and calories for heat. The derivation of the joule and the calorie evolved via different paths. The joule came from mechanical work via the horsepower while the calories was derived by the change in temperature of water when heat was added.

          They have nothing in common except for a mathematical relationship, developed circa 1840, by the scientist Joule. He found that a paddle turned mechanically in water, doing work, could produce an equivalent amount of heat in the water.

          There is no direct physical relationship between heat and work, both being entirely different forms of energy. Same with EM and heat, entirely different forms of energy that cannot be added through conversion. You either sum the EM, which seems impossible to me without first converting it to heat, or you sum the heat, not both.

          As you implied, the amount of energy converted must be equal in either form of energy but there is nothing to add between the forms of energy.

          I find it difficult to think in terms of an EM flux because it has no meaning till converted to heat. Newton used the word fluxion in reference to a change in field strength at an instantaneous point. As defined by Newton, a flux is the instantaneous change in a field, represented by an equation, where the flux is the first derivative of the equation.

          You can sum the individual fluxes over an area using a surface integral but it makes no sense to sum fluxes from different sources in space.

          • Gordon Robertson says:

            sorry bobd, it was bdg I should have been addressing in the previous post.

          • bobdroege says:

            Gordon,

            A joule equals 0.239006 calories.

            Stop making shit up, and learn some physics from some textbooks.

          • bdgwx says:

            GR,

            Let me make sure I have this right. Your actually trying to argue that the total energy of a system is not equal to sum of the energy of individual components?

  37. ren says:

    This winter, ozone in the stratosphere over Canada is accumulating from the top of the stratosphere. The temperature in Canada will now low.
    https://i.ibb.co/fv1PNPs/gfs-o3mr-01-nh-f00.png

  38. Geoff Sherrington says:

    I have been trying to work out the starting point for these “doublings” of CO2.
    Years ago I was a spectroscopist, so here is one view.
    ……………..
    There are about 10^40 molecules of carbon dioxide in the Earth’s atmosphere.
    In laboratory studies, if we start with 1 molecule, then double it to get 2 molecules, we have done 1 doubling. If we double that again, 2 doublings give 4 molecules. 3 doublings give 8, 4 doublings give 16.
    138 doublings give 3.484*10^41 molecules, mathematically. This is simply 2^N, where N is number of doublings.
    Physically, if all molecules are available for doubling at a given time in history, then to double the atmospheric concentration the number of doublings has to go from approximately 138 to 139, adding another 3.484*10^41 molecules to that number already there.

    • Entropic man says:

      For the last 40 million years or so, there have been three main climate states.

      The Eocene had temperatures about 5C warmer than 1880 and CO2 around 600ppm.

      We are presently in an interglacial period, typically averaging around 14C and 280ppm CO2.

      Glacial periods average 9C and 200ppm.

      So, where do we start doubling? The focus of much research at present is the warming since 1880, possibly caused by our CO2 emissions. It has become the custom to start with the Preindustrial 280ppm and double from there.

      • Geoff Sherrington says:

        A consequence of doublings comes from the 1 molecule start point scenario.
        Obviouly 1 molecule cannot alter the global atmosphere to a significant extent, it would need to handle too much power. Ditto with 2 or 4 or 8 …
        What is the minimum number of moelcules of CO2 that have to be present in the atmosphere to exert a measurable effect?
        Geoff S

        • bdgwx says:

          That is a really good question. The often cited 5.35*ln(C/Co) formula comes from Myhre 1998 and is only defined for a range of 280-1000 ppm. I suspect there is still quite a bit of accuracy below 280 ppm but I don’t know how far down you can go before the curve fit formula breaks down. In Schmidt et al. 2010 they say CO2 is responsible for 28.6 W/m^2 of back radiation. This would imply 7.7 reductions by 3.7 W/m^2. In other words 280 could get cut in half 7x . I suspect there is a nebulous zone in the 0-10 ppm range where the logarithmic relationship between concentration and RF breaks down. I don’t know enough about the various radiative transfer models to adequately address this. It is definitely an interesting question though.

    • Rob says:

      if all molecules are available for doubling

      You make it sound like mitosis, as though CO2 molecules beget CO2 molecules.

  39. ren says:

    The graphic below shows what circulation will now be in the polar vortex in the lower stratosphere. Winter in Europe will be more and more interesting.
    https://i.ibb.co/0GvSsq7/Screenshot-2.png
    How can a man influence changes in the pattern of the stratospheric polar vortex? Maybe someone knows?

    • ren says:

      More recently, the converse relationship that the zonal mean zonal wind anomalies slowly propagate from the subtropical upper stratosphere to the polar region of the lower stratosphere and the troposphere during the boreal winter, is also noted (Kodera et al. 1990). It has been shown that SSWs occur in association with slowly propagating zonal mean zonal wind anomalies, and the related changes in the troposphere exhibits the Annular Mode (AO) (Thompson and Wallace 1998) like structure (Kodera et al. 2000). Baldwin and Dunkerton (1999) also showed that the downward propagation of the AO from the stratosphere to the troposphere occurs in association with SSWs.
      https://www.cpc.ncep.noaa.gov/products/stratosphere/strat-trop/gif_files/time_pres_UGRD_ANOM_JFM_NH_2021.png

      • ren says:

        The daily AO index and its forecasts using MRF and Ensemble mean forecast data are shown for the previous 120 days as indicated and they are normalized by standard deviation of the monthly AO index from 1979 to 2000. A 3-day running mean is applied for the forecast indices.
        https://www.cpc.ncep.noaa.gov/products/precip/CWlink/daily_ao_index/ao.obs.gif

        • Rob says:

          And this graph is telling us … what exactly?

          • ren says:

            This is how the stratosphere works during long periods of low magnetic activity of the Sun.
            https://www.cpc.ncep.noaa.gov/products/intraseasonal/temp50anim.shtml

          • Rob says:

            Please satisfy my ignorance by explaining SSW.

          • Rob says:

            There is no mention of SSW there. I just want to know what the letters stand for.

          • ren says:

            3D animation – 2009 SSW (Sudden Stratospheric Warming)
            3D animation of the 2009 MMW (Major Midwinter Warming) event. Data is from ECMWF ERA-Interim Dataset.
            https://youtu.be/bminxfVGa5w

          • Rob says:

            Here is the graph of AO running means since 1950 from the same site:

            https://www.cpc.ncep.noaa.gov/products/precip/CWlink/daily_ao_index/month.ao.gif

            Are the current AO values in some way unusual in comparison to the past 50 years?

            If so, how?
            If not, what point are you trying to make?

            In answering, please don’t link me to another visual. I want the answer in your words.

          • Rob says:

            I meant 70 years.

          • ren says:

            “The height-time development of AO signature time series,
            for 40 years of data, is illustrated in Plate 1. The data have been
            10-day low-pass filtered to eliminate synoptic-scale events. Red
            shading corresponds to a weak polar vortex, as during a
            stratospheric warming, while blue shading indicates astrong,
            cold vortex. A value of 1.0 corresponds tothe definition of the
            AO signature at each level (Figure 1). The contour interval is
            0.5 with values between -0.5 and 0.5 not shaded, and values
            exceeding-1.5 and 1.5 in solid red or blue shading, respectively. Vertical gray lines define the November-March winter
            season. The large magnitudes of the AO are, in the stratosphere, confined almost entirely to the period October-April,
            while occasional large-amplitude events may be found in the
            troposphere at any time of the year, consistent with the climatology illustrated in figure 4. Many of the stratospheric events
            are connected to tropospheric events, but the connection is
            typically intermittent, involving fairly rapid vertical bursts
            which tend to descend farther into the troposphere over a period of several weeks (e.g. 1960-1961, 1968-1969, 1973-1974).
            In some cases, downward penetration of positive (red) AO
            anomalies occurred continuously over a period of N2 weeks
            (e.g., 1958-1959, 1984-1985).
            https://cat5.envsci.rutgers.edu/~jlc449/150Tg/Coupe19/Research/Papers/Baldwin_et_al-1999-Journal_of_Geophysical_Research__Atmospheres_(1984-2012).pdf

          • Rob says:

            Do you know what it means to answer a question?
            I don’t want a quote from some website.
            What is *YOUR* point in bringing this up in relation to climate?

          • ren says:

            “Abstract. Geopotential anomalies ranging from the Earth’s surface to the middle stratosphere
            in the northern hemisphere are dominated by a mode of variability known as the Arctic
            Oscillation (AO). The AO is represented herein by the leading mode (the first empirical
            orthogonal function) of low-frequency variability of wintertime geopotential between 1000
            and 10 hPa. In the middle stratosphere the signature of the AO is a nearly zonally symmetric
            pattern representing a strong or weak polar vortex. At 1000 hPa the AO is similar to the North
            Atlantic Oscillation, but with more zonal symmetry, especially at high latitudes. In zonalmean zonal wind the AO is seen as a north-south dipole centered on 40-45N; in zonalmean temperature it is seen as a deep warm or cold polar anomaly from the upper
            troposphere to –10 hPa. The association ofthe AO pattern in the troposphere with
            modulation of the strength of the stratospheric polar vortex provides perhaps the best
            measure of coupling between the stratosphere and the troposphere. By examining separately
            time series of AO signatures at tropospheric and stratospheric levels, it is shown that AO
            anomalies typically appear first in the stratosphere and propagate downward. The midwinter
            correlation between the 90-day low-pass-filtered 10-hPa anomaly and the 1000-hPa anomaly
            exceeds 0.65 when the surface anomaly time series is lagged by about three weeks. The
            tropospheric signature of the AO anomaly is characterized by substantial changes to the
            storm tracks and strength of the midtropospheric flow, especially over the North Atlantic and
            Europe. The implications of large stratospheric anomalies as precursors to changes in
            tropospheric weather patterns are discussed.”
            Propagation of the Arctic Oscillation from the stratosphere
            to the troposphere
            Mark P. Baldwin and Timothy J. Dunkerton
            Northwest Research Associates, Bellevue, Washington
            https://www.cpc.ncep.noaa.gov/products/stratosphere/strat-trop/gif_files/time_pres_HGT_ANOM_JFM_NH_2021.png
            https://i.ibb.co/19H482q/ao-obs.gif

          • Rob says:

            So you give me yet another quote without answering my question.
            Why do you have so much of a problem describing YOUR point in one or two concise sentences?

          • ren says:

            The daily geopotential height anomalies at 17 pressure levels are shown for the previous 120 days as indicated, and they are normalized by standard deviation using 1979-2000 base period. The anomalies are calculated by subtracting 1979-2000 daily climatology, and then averaged over the polar cap poleward of 65N.

            The blue (red) colors represent a strong (weak) polar vortex. The black solid lines show the zero anomalies.
            https://i.ibb.co/jVySJXc/hgt-ao-cdas.gif

          • Rob says:

            OK. So you are not making any predictions then about what is to come that would be unusual compared to the past 70 years. Just a weather report.

          • gbaikie says:

            “Just a weather report.”

            Yup, that what ren does, I don’t think he has ever given predictions.

            But most what what passes for “global climate” is largely about the weather.

            Or global climate is the cold ocean, which would be rather boring to report about.
            And predicting weather, more than 2 days in future gets increasingly, inaccurate.

          • Rob says:

            Pretty sure I saw him last month making one of those ridiculous GSM predictions.
            That was my point in interrogating him.

  40. Rob says:

    So when the globe doesn’t do it for you, pick a single country. Just make sure you don’t pick a country which disproves your claim.

  41. ren says:

    You can see a large calm in the Canadian weather.
    https://i.ibb.co/xqP4hpc/Screenshot-3.png

  42. CO2isLife says:

    Pure Vindication for CO2isLife. Somewhere above or in other posts, one of the Climate Alarmists accused me of buying into conspiracy theories. Actually, here I just found it:

    Entropic man says:
    January 23, 2021 at 6:14 PM
    If you’ve retreated into paranoia and conspiracy theories, then further conversation is probably not worthwhile. Goodnight.

    My comment that triggered this response was:

    “Hello!!! The joke Hockeystick is the most referenced. Do you want to defend how “Mike’s Nature Trick to Hide the Decline” got passed the Peer Review? How many people critical of AGW do you think are on this rubber stamp Peer Review Board?”

    Here is an actual clipping from the Michael Mann Lawsuit against Mark Steyn.

    6/ some astounding revelations in Steyn memorandum from discovery on Penn State conduct during investigation. Initial view of Inquiry Committee was that they “could not prove that [Mann was] not guilty” of first 3 counts and therefore would have to proceed to an investigation.

    7/ in discovery, Foley said that Inquiry Committee “could not find anything to prove Mann’s innocence” and that, according to pleading, did not “exonerate” Mann.

    8/ Steyn says that Foley “secretly” sent a draft of Inquiry Committee report to Penn State President Spanier (who is now a convicted felon in connection with Sandusky scandal) and that Spanier secretly replied to Foley with changes to report.

    https://i1.wp.com/pbs.twimg.com/media/EseJV0yXUAA-tL8.png?w=1110&ssl=1

    • Entropic man says:

      “Initial view of Inquiry Committee was that they could not prove that [Mann was] not guilty

      “Inquiry Committee could not find anything to prove Manns innocence

      “Guilty until proven innocent”

      I don’t remember anyone using that system since McCarthyism.

      I strongly suspect that you are paid by fossil fuel lobbyists to run a climate change denial website.

      https://in.pinterest.com/pin/656821926883806557/

      Please prove your innocence.

  43. CO2isLife says:

    Anyone can read about the Lawsuit here. How the left elevated a man of such moral bankruptcy to be their spokesperson for Global Warming is way beyond me, but unfortunately, that is to be expected from a political party that embraces the cancel culture over the debate.

    https://wattsupwiththat.com/2021/01/24/mark-steyn-files-an-eviscerating-motion-for-summary-judgement-in-the-michael-mann-libel-suit/

    The truth doesn’t shun debate and scrutiny, it requires it.

  44. CO2isLife says:

    Canada has been warming at only 50% the rate of the average of the CMIP5 models;

    News Flash!!! Canada is an enormous and largely untouched forest. In other words, temperature measurements in Canada are unlikely to be corrupted by the Urban Heat Island Effect and dramatic changes in weather vapor relative to the historical norm.

    I would imagine that you will find that South America, Southern SubSaharan Africa, and large Parts of Russia will show the exact same finding. What will that prove? That CO2 isn’t the cause of the warming. CO2 can’t cause differentials, it is a constant over the short run or applied to a time series. The physics of a CO2 molecule is the same in Canada as it is over the Pacific Ocean.

    Oh, BTW, find a part of the Oceans that aren’t impacted by huge energy swings like PDO, ADO, El Nino, La Nina, etc etc, and I’m sure you will find that temperatures aren’t increasing there either. Have the temperatures over the oceans around Antarctica been warming like the rest of the earth? My bet is 100% no. How do I know that without even looking? Because CO2 isn’t the cause of warming.

    • CO2isLife says:

      Looking into this I find the “experts” give some pretty nonsensical explainations.

      In Warming, Northern Hemisphere is Outpacing the South

      According to one of the studies, by a group of researchers based at U.C. Berkeley and the University of Washington, the Northern Hemisphere has led the Southern Hemisphere in its rate of warming since about 1980, largely because the Northern Hemisphere has more land and less ocean than the Southern Hemisphere, and oceans warm relatively slowly. (Visibal radiation warms the oceans and land) Prior to 1980, the long-term trend that would have been there from increased greenhouse gases during the 20th century was essentially cancelled out by man-made aerosol emissions, which mostly cooled the Northern Hemisphere, the study found. (Read The Clean Air Act Caused the Warming?)

      The second study, by researchers at the Potsdam Institute for Climate Impact Research in Germany, implicates global ocean currents as another factor contributing to the Northern Hemispheres warming lead. These currents transport heat away from southern waters and into the North Atlantic and North Pacific, helping to warm nearby land areas in the north even more. (How does CO2 cause that?)
      https://www.climatecentral.org/news/in-global-warming-northern-hemisphere-is-outpacing-the-south-15850

    • CO2isLife says:

      BTW, I challenge all the “experts” to find any stations in Canada that are showing real warming. I’m having trouble finding any, even the ones that I would expect to show warming. My other post is undergoing moderation and it will show many stations showing no warming, but I was able to find a few that did actually show warming…kind of.

      Totonto:
      https://data.giss.nasa.gov/cgi-bin/gistemp/stdata_show_v4.cgi?id=CA006158520&ds=14&dt=1
      https://data.giss.nasa.gov/cgi-bin/gistemp/stdata_show_v4.cgi?id=CA006158350&ds=14&dt=1

      • Entropic man says:

        I’m not going to wade through individual stations. The regional data shows warming.

        https://www.currentresults.com/Weather-Extremes/Canada/trends-temperature-annual.php

        • CO2isLife says:

          “I’m not going to wade through individual stations. The regional data shows warming.”

          You really don’t understand basic scientific concepts do you? How can a regional area show warming when the individual stations show no warming when the proper ones are selected. In real science you “groom” the data to make sure that you have removed any corrupted sites. In Climate Science they literally rely on corrupted sites to make their case for warming.

          Simply ask yourself how I can know how to find sites that will show no warming? Am I a magician? Do I have some superpower? Do I have ESP? No, I simply start with the hypothesis that CO2 doesn’t cause warming, and identify sites that won’t be corrupted by the Urban Heat Island Effect and Water Vapor. That is all I do, and 90% of the sites I find show no warming.

          How can you explain so many sites showing no warming over the past 140 years? Does the CO2 molecule have different physical properties at different locations? No, that is absurd. What isn’t absurd is the hypothesis that 0.94 W/M^2 isn’t enough to make a measurable change in temperatures given that the Sun delivers 1400W/M^2. In other words, CO2 is immaterial other than preventing temperatures from falling below -80C°

      • Bindidon says:

        CO2isLife

        Your eternal problem is that you only select those stations which perfectly fit to your narrative, e.g. Toronto.

        There are over 5,000 stations for Canada in GHCN daily. About 110 of them have more than 100 years of activity.

        Why don’t you calculate their data’s trend?

        For example (trend in C / decade)

        CA006148120 1881 1996 116 ON STRATHROY________ 53 39 0.360
        CA002100880 1898 2017 120 YT PELLY_RANCH______ 61 17 0.359
        CA007021954 1880 2020 141 QC DANVILLE_________ 54 43 0.304
        CA001123390 1904 2015 112 BC HEDLEY_NP_MINE___ 55 23 0.272
        CA006139520 1866 2020 155 ON WINDSOR_RIVERSIDE 52 38 0.234
        CA007023240 1873 2008 136 QC HUNTINGDON_______ 54 42 0.224
        CA007026465 1878 2020 143 QC RICHMOND_________ 54 43 0.207
        CA006164297 1876 1990 115 ON LAKEFIELD________ 53 40 0.203
        CA006124127 1872 2020 149 ON KINCARDINE_______ 53 39 0.180
        CA006160465 1882 1985 104 ON BANCROFT_________ 54 40 0.172

        Btw, Toronto doesn’t have a zero trend:

        CA006158350 1840 2003 164 ON TORONTO__________ 53 40 0.102

        It’s now 2:30 am here, I’ll reply in detail in the next afternoon.

        J.-P. D.

        • CO2isLife says:

          Bindy, why do you make posts that are so easy to refult?

          “CO2isLife

          Your eternal problem is that you only select those stations which perfectly fit to your narrative, e.g. Toronto.”

          You think I made a “problem?” Really?

          I clearly specified that you have to select stations that are not impacted by the Urban Heat Island Effect and Water Vapor. I’ve stated that a million times.

          I then go to the list that you posted to refute my claims and right off the bat, #1 STRATHROY has a BI of 27. The stations you pick that show warming are showing warming due to the Urban Heat Island Effect. Yes, there will be warming in those sites, but it isn’t due to CO2 and the GHG Effect. Go find sites with a 0.00 BI, and you will find no warming. ANyway, if you can find just 1 site with no warming, please explain why CO2 isn’t warming that site. Are the physics different for the CO2 molecule based upon location?

          • Bindidon says:

            CO2isLife

            Here is a corner which is certainly not affected by UHI…

            https://tinyurl.com/yxqpygez

            This is the location of the Lafefield station in Ontario. I could show you dozens of them, but why should I do such work for you?

            *
            Your fixation on CO2 is horrifying.

            What does let you think that CO2 has the same effect everywhere?

            Only people like you think so.

            And I repeat: go into the French article I posted you a link to weeks ago

            https://www.centrale-energie.fr/spip/spip.php?article151

            and try to understand it, Google Translator is the perfect help.

            The effect of CO2, if it exists, will be above the tropopause, and not at the surface.

            Langsam gehen Sie mir auf den Wecker mit Ihrem krankhaften CO2-Syndrom. Meine Guete!

            J.-P. D.

          • CO2isLife says:

            Payette (44.0764N, 116.9311W) ID:USC00106891
            https://data.giss.nasa.gov/cgi-bin/gistemp/stdata_show_v4.cgi?id=USC00106891&ds=14&dt=1

            I couldn’t find a Lafefield Station near Ontario, but I did find the above. Once again, no warming in over 140 years.

            BTW, why didn’t you post a link to your station data that you claim proves me wrong? Reason, most likely it has a high BI.

        • CO2isLife says:

          Bindy says: “Btw, Toronto doesn’t have a zero trend:

          CA006158350 1840 2003 164 ON TORONTO__________ 53 40 0.102”

          How can you possibly say there is a positive trend to this data? That is 100% Pure nonsense. The R^2 of that regression has to be near 0.00.

          You obviously don’t understand the basics. CO2 blankets the Globe. The W/M^2 is evenly distributed across the globe. Its contribution is small, but grows at a log decay rate. No one disagrees with those comments that I know of.

          From your Graphic:
          https://data.giss.nasa.gov/cgi-bin/gistemp/stdata_show_v4.cgi?id=CA006158350&ds=14&dt=1

          1) The Peak is in 1920 and only surpasses that level in 2002
          2) The current level is the same as 1918 and 1955
          3) Temperatures in 1898 are above the temperatures in 2000
          4) Temperatures are literally flat between 1915 and 2000
          5) There is tremendous volatility that can’t be caused by CO2
          6) The Climate “Scientists” don’t even try to explain the unexplained volatility, which is where the true answer to climate change lies
          7) A trend is defined as a series of higher highs and higher lows, and you certainly don’t have that with that chart, it is far closer to a random walk
          8) The physics of the CO2 molecule won’t produce a random walk, it will produce an uptrend
          9) Without an R^2 your analysis is nonsensical and will change dramatically depending upon the time period selected

          Bottom like, if you think there is an uptrend in your Toronto Chart, you will believe anything.
          https://data.giss.nasa.gov/cgi-bin/gistemp/stdata_show_v4.cgi?id=CA006158350&ds=14&dt=1

          • Bindidon says:

            CO2isLife

            Firstly, it is not MY graphic: it is that of NASA.

            But… ooops?! I thought you would accept only unadjusted data…

            Move on the topmost line, and you see it. Looks fine, hu?

            *
            The 0.1 C / decade I have seen come from the raw, unadjusted data in GHCN daily.

            I have shown how Canada’s Tmin and Tmax look like, on the base of stations carefully selected, with negative trends for the absolute values, and positive trends for the anomalies:

            http://www.drroyspencer.com/2021/01/canada-is-warming-at-only-1-2-the-rate-of-climate-model-simulations/#comment-599164

            If you think that is incorrect, do it yourself!

            And I repeat: it is completely useless to search for any relation between CO2 and surface temperatures.

            J.-P. D.

  45. Clint R says:

    Debunking the “energy imbalance” nonsense comes in at least two parts. The first part was described here:

    http://www.drroyspencer.com/2021/01/canada-is-warming-at-only-1-2-the-rate-of-climate-model-simulations/#comment-598450

    In a response to that first part, bdgwx unwittingly brought out that fluxes from different surfaces, at different times, cannot be simply added. That is, of course, is the case with Earth.

    But the second part of debunking the “energy imbalance” nonsense is that fluxes are not “conserved”. One easy-to-understand example is a solid cone in space. The base is positioned so that it absorbs 900 W/m^2 from Sun. The rest of the cone has an area 4 times the base area. So at equilibrium, the cone is absorbing 900 W/m^2 and emitting 180 W/m^2. There is a “flux imbalance” of 720 W/m^2, but there is no energy imbalance.

    With a base area of “A”:
    Ein = Eout
    (900)A = 180(5A)
    900A = 900A

    So when someone tries to claim Earth is heating up because of “0.8 W/m^2 energy imbalance”, remind them that the cone is NOT heating up, even with a 720 W/m^2 “energy imbalance”.

    The “0.8 W/m^2 energy imbalance” is merely one of the false tenets of the cult religion.

    • CO2isLife says:

      Clint an easy experiment that anyone can do would be to simply take a series of mirrors outside during the next full moon.

      Direct the reflection of the full moon on to a single spot. Do that with multiple FLAT mirrors. You will see that the spot collecting all the light will never be brighter than the moon itself. (Note: Solar Farms Concentrate the energy using concave mirror configurations) You can have as many mirrors as you want, and it will never add to the brightness of the sun, which is being reflected off the Moon.

      How does this apply to CO2? Simply buy a Long Pass IR Filter that cuts off below 13µ. Buy a Daylight LED Bulb. Place the IR Filter in front of the Daylight Bulb and try to melt ice with it.

      Currently I’m working on an experiment that does that exact thing as well as another. We are taking an IR transparent bag of CO2 at room temperature. We will then shine the 15µ LWIR on the bag of CO2. If energy is additive, then the additional 15µ LWIR should warm the bag of CO2 above room temperature, and the bad what isn’t having the additional energy add should remain at room temperature.

      • bobdroege says:

        OOOOHHHHH!

        Flat in both bold and caps!

        You know you can focus light with a bunch of flat mirrors approximating a parabolic curve.

        Look what I found from your Ivanpah cite

        “Flat Glass”

        Ha!

        • Swenson says:

          bob,

          Yes, and the Ivanpah boilers can never exceed the heat of the sun, regardless of how many mirrors are used.

          What is your point?

          • bobdroege says:

            Yeah but you could use the energy generated by the Ivanpah facility to power lasers that could exceed the temperature of the surface of the Sun, so what is your point?

      • Nate says:

        “Currently Im working on an experiment that does that exact thing”

        Lots of ‘experiments’ like this on Youtube to get free energy from water, etc.

        I look forward to the paper!

    • Tim Folkerts says:

      “In a response to that first part, bdgwx unwittingly brought out that fluxes from different surfaces, at different times, cannot be simply added. That is, of course, is the case with Earth.”

      The strawmen never cease. No one claims the earth is warming because the net incoming solar flux of ~ 960 W/m^2 is greater than the outgoing flux of ~ 240 W/m^2. That is how silly your cone analogy.

      But when averaged over the whole surface, the average net incoming flux of ~ 240 W/m^2 does about match the average outgoing flux of ~ 240 W/m^2. The small imbalances here are what determine warming or cooling.

      • Clint R says:

        Yes TF, I’ve noticed your straw men never cease. The “cone” example was to explain that flux is not conserved — 900 W/m^2 does NOT equal 180 W/m^2.

        But your constant attempts to pervert reality are always amusing.

        That’s why this is so much fun.

        • bobdroege says:

          Who needed explanation that flux is not conserved. You are a man looking for a problem that doesn’t exist in order to appear smarter than you are.

          I am glad you are having fun, court jester are known to have fun.

          But you know what….?

    • Nate says:

      “the cone is absorbing 900 W/m^2 and emitting 180 W/m^2. There is a flux imbalance of 720 W/m^2, but there is no energy”

      This is gobbldegook.

      You are onsidering DIFFERENT surfaces, so there is no balancing of fluxes expected.

      For Earth’s energy imbalance the fluxes are measured on the SAME TOA surfaces.

      Strawman alert!

      • bdgwx says:

        ^ This. No reputable scientist is trying to add fluxes from DIFFERENT surfaces and expecting a sensible result. We have always stipulated on this blog that fluxes can be added only when they are in reference to the SAME surface.

        But there is yet another misuse of fluxes I see by the contrarians. They will take one of the inputs absorbed by the surface (say the 161 W/m^2 solar) and run that through the SB law and come up with a ridiculous temperature (231K) and then claim that energy budget models are wrong because the actual temperature is 289K. The problem…the SB law relates radiate EMISSION to TEMPERATURE and nothing more. Plugging a single input flux in the SB law is a misuse. If you want to use energy budget models to estimate the temperature then you need to at least use the surface emission flux which is 396 W/m^2 which yields 289K. Of course, that temperature value assume the surface emission is homogenous. It reality it is not so you have to be careful with interpretation. But it at least provides a reasonable first approximation. Trenberth even cautions readers about the non-homogeneity of surface temperatures and emission flux. I believe he even estimates the bias in the SB law result as a result of this non-homogeneity. So these arguments that scientists are stupid and misuse the laws of physics are strawmen.

        I feel like we spend an inordinate amount of time on this blog addressing contrarian strawman arguments.

  46. Clint R says:

    The idiots don’t like reality. So if the experiment is too complex, it just gives them more avenues to avoid reality. They even try to pervert the “simple analogies”. Above, where I pointed out that different fluxes cannot be added, subtracted, averaged:

    http://www.drroyspencer.com/2021/01/canada-is-warming-at-only-1-2-the-rate-of-climate-model-simulations/#comment-598450

    bdgwx tried to argue that same fluxes can be added, not realizing he was agreeing with me that surface fluxes from Earth could not be simply treated as ordinary numbers.

    Often they get tangled up in their own nonsense. That’s why this is so much fun.

    • CO2isLife says:

      BTW, concentrating all the incoming radiation out at the Ivanpah Facility only heats water to 55C°.
      https://web.archive.org/web/20170215102957/http://www.energy.ca.gov/siting/meetings/2010-01-22_meeting/presentations/BrightSource_Energy-Ivanpah_Project_Overview_2010-01-22.pdf

      The sun is 1380 W/M^2 at the surface of the earth, and 5,778K°

      • CO2isLife says:

        Ooops typo, 550C°

      • CO2isLife says:

        Daytime Solar Radiation 1380 W/M^2, marginal ΔW/M^2 due to additional CO2 over the past 150 years = 0.94W/M^2 at the surface.

        Clearly frequency of cloudy and sunny days mean nothing and CO2 means everything….yack.

        The increased frequency of cloudy days by 1 day/yr can easily wipe out months if not years of IR contribution by CO2. That is why climate science will never model the climate. They don’t keep the right data sets.

        • Clint R says:

          Concentrating solar is the same as a magnifying glass. What is happening is putting back what was lost from the Inverse-Square Law. The energy was there, just spread out. That doesn’t violate any laws of physics.

          But what they attempt, in the AGW nonsense, is putting together fluxes from dissimilar sources. Like adding 300 W/m^2 (from the atmosphere) to 900 W/m^2 direct solar. Those fluxes do NOT simply add. IOW, you don’t get 900 + 300 = 1200 W/m^2. That is just another flaw in the AGW nonsense.

          • CO2isLife says:

            Clint R, in a sense you can say that they aren’t addictive, they simply complete a distribution. For example, if you take a BlackBody Distribution of radiation and place various filters in front of it, you will carve up the Blackbody into spectra. Adding all those spectra back together will only ever sum back to the Blackbody, and nothing more. CO2 occupies the -80C° Portion of the blackbody. Adding more LWIR of 15µ won’t warm it anymore, it just maintains -80C°. As you say, adding more ice won’t warm the drink, even though it is emitting 9.5µ LWIR.

            In other words, the whole is never greater than the sum of its parts when dealing with energy.

          • Nate says:

            “IOW, you dont get 900 + 300 = 1200 W/m^2.”

            Ok, I’ll bite. What do you get? Show your work.

          • Clint R says:

            Troll Nate, two identical cars have the same maximum speed, 200 kph. If the cars are welded together, side by side, would they then have a maximum speed of 400 kph?

            (Trolls hate simple analogies.)

          • bobdroege says:

            Deja vu, we have been here before.

            Jester, what if we welded them together bonnet to boot?

          • Clint R says:

            Doesn’t matter how you weld them together, bob. The combination will not be able to go 400 kph.

            You have no clue about the physics involved.

          • Nate says:

            Ahhh the old analogy evasion.

            No point in a bad analogy when youve got a real question to answer.

            You seemed absolutely sure we are doing the math wrong.

            Now show us the correct math.

          • Nate says:

            “CO2 occupies the -80C Portion of the blackbody. Adding more LWIR of 15 wont warm it anymore, it just maintains -80C. As you say, adding more ice wont warm the drink, even though it is emitting 9.5 LWIR.”

            This makes absolutely no sense!

            We can have a bag of CO2 at 1000 C or at -50C. They BOTH emit @ 15 micron. But with much higher intensity from the 1000 C bag.

            There is no -80 C involved.

          • Nate says:

            For the 47th time, Clint tells us we’re doing physics wrong, but is unable to explain how, nor provide us with the correct way of doing it.

            What is the point his posting, when it just reveals his supreme ignorance?

      • bdgwx says:

        That figure is for the zenith flux. When you integrate it over the entire planet for one orbital cycle the mean flux is about 340 W/m^2 at TOA. When you account for the planet’s albedo the mean flux received at the surface is about 240 W/m^2. If, hypothetically speaking, Earth shed this energy by radiating homogenously as a blackbody that would be a mean temperature of 255K. Earth’s surface actually radiates at around 396 W/m^2 though.

      • bobdroege says:

        Did you perhaps drop a significant digit there?

    • bobdroege says:

      ClintR,

      Fluxes can be added but it’s as you say, not simple, you have to know what you are doing, and you don’t.

      • Swenson says:

        bob,

        So addition is not simple? As in 300 W/m2 plus 300 W/m2 equals 600 W/m2?

        Or have climatologists redefined addition to mean something else?

        As in reducing the rate of cooling really means heating?

        Questions, questions! The only simple things are apparently you and the rest of the alarmist ignoramuses!

        Come on bob, tell me about adding 300 W/m2 from ice, to 300 W/m2 from sunlight. Oh, you say, you cant just add fluxes from sources of different temperatures? Its meaningless?

        Just like the people that believe all this energy imbalance nonsense, based on simply adding and subtracting!

        Thanks for confirming you are a dill, bob.

        • bobdroege says:

          Don’t ask me how to add fluxes, do your own research, I am not here to teach you basic physics.

          I am not going down your stupid ice rabbit hole, you know that argument is stupid, but why you keep making it, oh, it’s because you don’t understand the physics, it’s not because you are stupid.

        • Tim Folkerts says:

          “So addition is not simple? As in 300 W/m2 plus 300 W/m2 equals 600 W/m2?”

          What precisely are you adding? Fluxes leaving two different surfaces or fluxes arriving at one surface? Maybe something else? These “gotcha” questions are ill-posed and not answerable. If you could state your conditions, then it would be “simple” (where “simple” might involve cosines or calculus).

          Since you didn’t specify a setting, I will. If a surface with area “A” square meters is receiving a flux of 300 W/m^2 from one source (ie receiving 300A joules each second), and also receiving a flux of 300 W/m^2 from another source (ie receiving 300A joules each second), then yes, simple addition is all that is needed and the surface will be receiving 600 W/m^2 (ie receiving 600A joules each second). We simply add joules and add fluxes. (For example, these could be two lamps shining on the same floor tile.)

          If you want to propose a different setting, we could “simply” answer that one, too!

          • Clint R says:

            TF, are you still trying to heat that thermometer more with a second ice cube? This has been explained to you several times before. The first ice cube has the same temperature as the thermometer and the surroundings — 32F. A second 32F ice cube can NOT raise the temperature any higher, even though its emitting 300 W/m*2.

            Fluxes don’t simply add.

          • Swenson says:

            Tim,

            OK.

            Take 300 W/m2 from the sun, add it to 300 W/m2 from ice. Easy enough to concentrate – parabolic mirror, transparent lens etc. Project onto the same area.

            Pick your object area, which doesnt matter because your energy is being expressed as a rate. Just for fun, have your object at an initial temperature of say 20 C.

            All of a sudden, you are going to start claiming that you cant simply add fluxes from different temperature sources in any meaningful way.

            This is exactly my point. People like Trenberth, Schmidt, Mann and various assorted eejits at NASA and NOAA think that energy impinging on an object must increase the temperature of the object – by magic apparently. Certainly, no amount of energy from a colder object will be absorbed by a warmer. Try totally surrounding water with ice radiating 300 W/m2, and tell me how much hotter the water gets!

            Ah, you say, normal physical laws dont apply to climatology. Trenberth, Schmidt and Mann say so!

            Learn some physics, Tim.

          • Norman says:

            Tim Folkerts

            Thank you for taking the time to post on this blog. I do learn a lot from your posts and they are all well grounded in actual textbook physics (which is also based upon many years of experimental evidence that can be found in science journals).

          • Tim Folkerts says:

            “Take 300 W/m2 from the sun, add it to 300 W/m2 from ice. Easy enough to concentrate – parabolic mirror, transparent lens etc. Project onto the same area.”

            Again, you are unclear about “to” and “from”.
            (Also, since direct sunlight is ~1000 W/m^2, there is no need to concentrate it. )

            So let’s clarify. Select a 1mx1m flat area — like a large black tile. We want to find the combined flux TO this surface, coming FROM some ice and FROM the sun. We could create a flux of 300 W/m^2 (ie a power of 300 W) TO this surface from ice @ 0 C by building a shell of ice over the tile (like an igloo). It doesn’t matter how big the shell is, nor what shape it is, as long as it completely surrounds the top side of the tile. If all the walls are emitting 300 W/m^2, the tile will be receiving 300 W/m^2.
            Let’s imagine a large hemisphere. (For simplicity, we will evacuate the space to eliminate conduction and convection between the shell and the tile. And insulate the back of the tile.)

            This will of course cause the tile to equilibrate at 0 C = the temperature of the ice. If it had been warmer like 20C, it would cool off.

            So now we cut a small hole in the shell to let sunlight in. Or just hang a spotlight in the dome. Or maybe the ice walls are clear and sunlight can simply shine through. We adjust this light to provide 300 W/m^2 of flux (ie 300 W of power) TO the tile.

            So what happens? All of the original 300 W are still getting absorbed. And the new 300 W is ALSO getting absorbed. The tile is receiving 600 W/m^2 (ie 600 W) and will warm up by a factor of 2^0.25, to 325 K, or about 50 C.

            These fluxes add in completely meaningful ways.

          • Swenson says:

            Tim,

            What part of an object area receiving energy simultaneously from the sun and from ice do you not understand? Do you not realise light can be concentrated by say a lens, parabolic mirror etc, and caused to fall on the same target, using mirrors etc?

            Ah, I see. You create a complicated scenario to mislead the audience, as any good illusionist does.

            You are not really claiming that ice can heat anything hotter than itself, are you?

            Now, a rate of energy transfer per m2 does not mean that a square meter is necessary. As I said.

            You inadvertently forgot to point out that having cooled your object to 0 C, by surrounding it with ice, you provide a heat source (I specified the sun, so 5500 K should suit you). At a rate of 300 W/m2, it may or may not result in measurable heating. 1 Joule of energy is quite different from 1000 joules, and both may be obtained from a source emitting 300 W/m2.

            So any fool should be able to see that W/m2 is a pointless measurement by itself. You need to know the totally energy absorbed by an object, which of course depends on the initial temperature of the object, its thermal characteristics, the temperature of the object emitting the energy and so on.

            For example, using a hand held magnifier, you can boil a small amount of water. Try boiling 10 litres of water using the same magnifier – not enough energy, even though the temperature of the source remains the same, and the W/m2 also.

            W/m2 is a distraction used by alarmist illusionists to seemingly flout the laws of physics.

            This is why you insist on your complicated illusions.

            Accept reality – you cant depend on misdirecting your audience forever.

          • Tim Folkerts says:

            “What part of an object area receiving energy simultaneously from the sun and from ice do you not understand? “
            What part of my reply do you not understand? By surrounding a floor tile with ice, it is receiving energy from the ice. By cutting a small hole to let in sunlight, it is receiving energy from the sun. Simultaneously. From both. At the same time.

            “You create a complicated scenario …”
            I created exactly the scenario you asked for — energy from ice and energy from the sun. For the ice, there is nothing simpler to work with than ice in all directions.

            “W/m2 is a distraction used by alarmist illusionists to seemingly flout the laws of physics.”
            No, flux is an important idea within physics. And quite useful when used appropriately. It only “seemingly flouts the laws of physics” to those who don’t understand physics or don’t delve deep enough into the situation.

            “Certainly, no amount of energy from a colder object will be absorbed by a warmer.”
            Certainly this is wrong. A blackbody object absorbs all radiant energy that hits its surface. Period. If doesn’t matter if the source is big or small, near or far, hot or cold.
            What *is* important is that the warmer object will always be radiating AWAY more energy to the cool object than the cool object is radiating INTO the warm object.
            So, certainly no NET amount of energy from a colder object will be absorbed by a warmer. But energy will be emitted and absorbed by both objects.
            Or more concretely, if a cool blackbody tile emitting 300 W/m^2 is placed close together facing a warmer blackbody tile emitting 400 W/m^2, the cool tile will absorb 400 W/m^2 and the warm tile will absorb 300 W/m^2. The net of these two energy flows is 100 W/m^2 FROM the warmer TO the cooler.

            “1 Joule of energy is quite different from 1000 joules, and both may be obtained from a source emitting 300 W/m2.”
            Again you seem to miss the important distinction between flux emitted and flux absorbed. The source (sun) EMITS a flux of about 64,000,000 W/m^2. We were discussing the 300 W/m^2 that are actually received and absorbed.

            When a tile RECEIVES a flux of 300 W/m^2, it really does absorb 300 J each second each square meter. Not 1 J, not 1000 J.

            “You are not really claiming that ice can heat anything hotter than itself, are you?”
            The old “bait and switch” AKA “moving the goal posts. I answered exactly what you asked. If you wanted to discuss something else, you should have asked about something else.

            But in the spirit of discussion, let me ask you first if you agree that when the tile RECEIVES 300 W/m^2 from ice AND RECEIVES 300 W/m^2 from sunlight, that is will indeed be receiving (and absorbing) 600 W/m^2 and will warm to ~ +50 C.

          • Swenson says:

            bob,

            Does it really? Maybe you could indicate where I have sworn and taken the Lords name in vain.

            I will apologise if I have.

            In any case your * what about you . . * defence is typical of alarmist attempts to defend the indefensible.

            Maybe others support your way of expressing yourself. Up to them, I suppose.

          • Swenson says:

            Tim,

            I love the wa6 you say * Lets clarify . . . * and then proceed to ignore what I said and substitute your own complicated illusion.

            Now to your most recent comment.

            I didnt ask you to create your imaginary scenario. You did that all by yourself.

            You managed to translate the specific, W/m2, into the general subject of fluxes. Tut, tut. Just wont do, Tim. Stick to what I said, not what you want to substitute.

            You go off into more imaginary scenarios of the blue plate green plate type, involving black bodies and imaginary settings, none of which I mentioned.

            You absolutely refuse to accept that 1 Joule is different from 1000 Joules, etc.,and launch into irrelevancies about how much energy the Sun emits.

            If you refuse to accept that 300 W/m2 from ice cannot make anything warmer than the ice, but 300 W/m2 from the sun definitely can, then you are in denial of reality, and I cannot but feel sympathy for your disability.

            Finally, you pose a nonsense question, attempting to imply that matter exposed to radiation must absorb all radiation which impinges on it, and warm as a consequence, I will just point out one reality. No matter how much ice you use, or how long you expose an object to it, the object will never get hotter than the ice.

            If you have ice phobia, substitute the sun, if you like. I freely open the can of worms for you, but I advise you to read carefully, before you say *Lets agree . . . * and create another of your irrelevant fantasies.

        • bobdroege says:

          Swenny dear boy,

          It seems a little hypocritical for you to call me names yet protest when I swear or take the Lord’s name in vain.

        • bobdroege says:

          Swenny dear boy,

          It’s 333 watts/square meter from the atmosphere that is being added to the flux from sunlight.

          Not from ice.

          What is the matter, you can’t even get that part right.

          And I am a dill?

          What the fuck is a dill?

          Mistaking me for a plant, that’s nice.

          • bdgwx says:

            And to use numbers from Trenberth 2009.

            Solar = +161 W/m^2
            Sensible = -17 W/m^2
            Latent = -80 W/m^2
            GHG = +333 W/m^2

            And because these fluxes are all in reference to the same 510e12 m^2 area they are conserved so we can add them.

            That gives us a net value of 161 + 333 – 17 – 80 = 397 W/m^2.

            That is the excess energy the surface must shed through radiant emission. And if you plug that into the SB law you get 289K.

            Now we all know that this application of the SB assume the surface radiates as a blackbody homogenously. Trenberth even warns his readers that if you do this you’ll get a biased result. But at least as a first order approximation you get a sensible result. BTW…Trenberth actually quantifies the effects of emissivity and spatial and temporal sampling section in his 2009 publication. https://tinyurl.com/yya8yc5v

            The takeaway…the contrarian claim that scientists are somehow too stupid to recognize the nuances of applying the SB law to non-blackbody and non-homogenously radiating surfaces is absurbed.

          • Swenson says:

            bob,

            As I said, 300 W/m2 from ice is qualitatively different from 300 W/m2 from the sun – or anything else.

            Obviously, a gaseous atmosphere has a temperature, which indicates it is radiating energy. If you say the total energy it radiates is 333 W/m2, then bully for you.

            Lie naked out in the middle of an arid desert before dawn, and tell me how warm the 333 W/m2 keeps you. Just imagine the atmosphere is a nice warm insulating blanket if you like. Pleasant dreams as you freeze to death if the surface temperature is below 0 C.

            Or lie outside at night when surface temperatures dont drop below 25 C or so. Even your silly 333 W/m2 seems to have different effects depending on where you are!

            You are not only a dill, you are foul mouthed to boot. If you think that the word * dill * in this context means a plant, then you cant take offense, can you? Plants are nice, in general.

          • bobdroege says:

            Swen

            I pick the desert and the month and in that desert and that month the temperature only drops below a balmy 70 degrees F once a decade or so.

            That 333 watts/meter is keeping me pretty comfy.

          • Tim Folkerts says:

            Swenson says: “As I said, 300 W/m2 from ice is qualitatively different from 300 W/m2 from the sun or anything else.”
            This is a good start. 300 W/m^2 from the sun consists of a small number of short wavelength (0.1 – 4 um), high-energy photons, while 300 W/m^2 from ice consists of a large number of long wavelength (4-100 um) photons. This does indeed have important implications.

            But the energy total is still the same — 300 J each second into each square meter.

            “If you say the total energy it radiates is 333 W/m2, then bully for you.”
            Well, that is a global, annual average. Specific locations at specific times can have much higher or much lower numbers. You seem to treat this number as constant always everywhere.

            “Lie naked out in the middle of an arid desert before dawn, and tell me how warm the 333 W/m2 keeps you”
            Arid desserts would be a place with below-average radiation. Much of that 333 comes from humidity and from clouds — which of course are absent in deserts. So in this case, the true number is probably closer to 100 or 200 Wm^2 (depending on the exact temperature an humidity).

            Both you and Bob are way off the mark in this regard. A person with bare skin at 30C would radiate over 400 W/m^2. This difference means you could lose a few 100 W/m2 of net radiation, which would indeed make you feel rather chilly — even if the air temp was 70C/20C. So wear clothes or find a space blanket.

          • bobdroege says:

            Tim,

            I disagree, the month and desert I picked has average night-time lows about 28 C, so I would still be getting more heat than I was shedding.

            Might make sure to have enough water, but I wouldn’t be cold.

          • Swenson says:

            Tim,

            The 333 figure was bobs, and unqualified. If you believe NASA, it is 340 W/m2, and is the same all over the Earth. Maybe you can be specific, and provide the back radiation figures for various locations at various times.

            Are you saying that CO2 concentrations are not the control knob governing the Earths temperature?

            Why would arid deserts have less radiation? The fourth power law indicates that hotter surfaces emit proportionally more radiation than cooler ones – in proportion to the fourth power of their absolute temperatures.

            Try the Lut Desert. Do you really believe that a 70 C surface is radiating less energy than one at -5 C?

            Or do you only like averages when they suit your agenda? A little like saying heat waves are a sign of climate change, but cold snaps are only weather.

            Ah, the wonders of climatology and Tim Folkerts physics!

        • Tim Folkerts says:

          Swenson, you wanted: “Come on bob, tell me about adding 300 W/m2 from ice, to 300 W/m2 from sunlight.”

          I’m not Bob, but I did exactly what you wanted. I told you about adding adding 300 W/m2 from ice, to 300 W/m2 from sunlight. I told you that yes, you can do it. I told you that yes, it will warm an object warmer than either the ice or the sunlight alone.

          Don’t blame me if you you meant something else.

          • Swenson says:

            Tim,

            Your imaginary scenarios are not reality. Add as much radiation as you want from ice, to an object basking in sunlight. Tell me how much hotter it gets.

            Maybe you believe you can make your coffee or soup hotter by adding ice, but as I said, your imaginary scenarios are not reality.

            Lets agree you have no clue about reality. On that basis, why should anybody not feel sorry for your inability to accept the world around you?

  47. Clint R says:

    Let’s have some more fun with the “energy imbalance” nonsense.

    As demonstrated above, fluxes are not conserved and fluxes cannot be treated as simple scalar quantities. Now, consider the process called “photosynthesis”. Photosynthesis takes solar energy and converts it to chemical energy. So the energy leaving Earth will always be less than the solar energy arriving, due to the conversion by photosynthesis.

    Trying to “balance” flux is pure nonsense. But even a REAL energy accounting would indicate less energy leaving the planet than arriving.

    • Entropic man says:

      “But even a REAL energy accounting would indicate less energy leaving the planet than arriving. ”

      Yes, we know. That is why we have global warming.

      • Clint R says:

        See how desperate they are?

        Ent has to twist my comment trying to “prove” AGW nonsense.

        That’s why this is so much fun.

    • Tim Folkerts says:

      “Photosynthesis takes solar energy and converts it to chemical energy.”
      This is simply one of many errors you make. Almost all of the energy absorbed by photosynthesis is later released as the biomass decays and/or gets digested. This is the carbon cycle. Any energy used to create carbon compounds from H2O and CO2 is released when the compounds break apart again into H2O & CO2.

      At a more subtle level, there is typically tiny fractions of the biomass that gets sequestered (eg peat bogs or sinking to the bottom of the ocean). But this is currently outweighed by the biomass we burn as fossil fuels.

      “So the energy leaving Earth will always be less than the solar energy arriving, due to the conversion by photosynthesis.”

      So actually the energy leaving Earth is currently more than the solar energy arriving, due to biomass conversion.

      Plus there is geothermal energy leaving. That make energy leaving earth larger yet than energy arriving from the sun.

    • Swenson says:

      Clint,

      Even more complicated, From NASA –

      * The luminosity of radiant energy is 4 x 10^33 ergs/sec. Since 1 gram is worth 9 x 10^20 ergs, sunlight equals 4 x 10^12 grams/second or 4.4 million metric tons of equivalent mass per second .This is radiated over a sphere equal to the radius of the earths orbit 147 million kilometers in radius or 2.7 x 10^27 square centimeters. The Earth’s cross section is 1.3 x 10^18 square centimeters, so the ratio of the total mass per second, to that intercepted by the earth is 1.9 kilograms/sec. During the entire life of the sun…4.5 billion years, the earth has gained 2.7 x 10^17 kilograms, which is only 1/21 millionth of its mass. The problem is that the earth is in thermal equilibrium with the sun at this distance, which means that whatever energy or mass-equivalent it gains, it also looses by re-radiating this energy in the infrared spectrum. So, the net gain is only a small fraction of what it receives given that it is not a perfect black body. *

      I wouldnt even try to calculate the mass increase of the total fossil fuel deposits resulting from photosynthesis, as nobody know the mass of said deposits.

      However, about 20 tonnes per annum of mass within the Earth is converted to energy, orders of magnitude less than in the past. The atomic bomb used on Hiroshima converted less than a gram of matter to energy.

      Finally, the Earth has managed to cool over the last four and a half billion years or so. More energy out than energy in, it would seem.

  48. Entropic man says:

    “Photosynthesis takes solar energy and converts it to chemical energy. So the energy leaving Earth will always be less than the solar energy arriving, ”

    Nearly all the energy absorbed in photosynthesis is released again in respiration by the plant or by herbivores, carnivores and decomposers.

    A very small % accumulates, but not necessarily permanently. When we burn coal we release energy trapped by photosynthesis 400 million years who’s which increases the leaving energy.

  49. Bindidon says:

    A few days ago, bdgwx asked Roy Spencer hwo Siberia would behave when compared to Canada.

    As commenter Mark had asked before:

    ” Can you share any historical temperature graphs of Canada pre 1991? ”

    and I replied with some info

    http://www.drroyspencer.com/2021/01/canada-is-warming-at-only-1-2-the-rate-of-climate-model-simulations/#comment-599164

    I thought: why not to do the same work for Siberia (but showing only the absolute resp. anomaly temperatures).

    In fact, the situation looks in Siberia quite similar to that in Canada: decline of absolute temperatures, but increase in the anomalies.

    One day, some will believe anomalies are only a tool to make temperatures warmer, he he.

    – (1) absolute

    https://drive.google.com/file/d/1gTVkHYA_EJI9ronLm4astLb2oGuqZ3_l/view

    – (2) anomalies wrt mean of 1981-2010

    https://tinyurl.com/y49499mb — (thanks for un-d-c-ing, tinyURL)

    As expected, the trend of GHCN daily station data in Siberia for 1979-2020 is about twice that for Canada: 0.6 C / decade compared with 0.25 C (2 sigma +- 0.05).

    Yeah.

    It’s warming in Siberia during the winters (because it’s less cold, he he). That is known since decades.

    J.-P. D.

    • bdgwx says:

      Perfect. Thank you for doing the leg work.

    • Swenson says:

      Binny,

      At 0.6 C per decade, that is 6 C per century, 60 C per millennium, 60,000 C per million years!

      Really?

      Do you realise how stupid it looks, trying to extrapolate the past into the future?

      Maybe you need to explain that the past may not have any relationship to the future. Or maybe, in you, the faith is strong?

    • Gordon Robertson says:

      binny…A few days ago, bdgwx asked Roy Spencer hwo Siberia would behave when compared to Canada”.

      It’s a dumb question. Canada, by definition consists of 10 provinces between the latitudes of 49 N and 60 N. Above 60 N, where the really cold stuff happens in winter, are the territories, which are 99.9% uncivilized and hostile. Most of civilized Canada exists around the 50th parallel (latitude) and that’s where temperature records predominate, right in the middle of major heat islands.

      Where the temperatures are recorded, like in Vancouver, BC, there is a massive heat island effect. Same with other regions where temperatures are likely to be recorded by Environment Canada, like Calgary, Edmonton, Regina, Winnipeg, Toronto, Ottawa, Montreal, Quebec City, St. John, Fredricton or Halifax.

      NOAA and GISS don’t bother with those recorded temperatures, they only use 1 thermometer in the territories to g.et temperature data for the Arctic. The rest of them they fudg.e till they g.et the desired warming effect they want.

      To illustrate the urban heating, I was once caught between Saskatoon and Regina in mid-winter in a car. Temperatures were down around -30C and with the wind.chill it likely dropped below -50C. The wind was whipping up powdered snow to the point it was like driving through a blinding fog. The gas pedal in my car was the type where the pedal pulls a wire through a sheath on its way to the carburettor.

      The wire froze solid inside the sheath and all I could do was disconnect it and crank up the idle. I idled the last 20 miles into Regina. I could only do the work under the hood in shifts because staying out in the wind could not extend more than 30 seconds.

      When I finally idled into Regina, and got on a road sheltered by high rises, it warmed up instantly to a temperature where the frozen wire/sheath let go.

      There are no equivalents in Siberia as far as closely recorded temperature data is produced.

  50. Gordon Robertson says:

    bobd…”Gordon,

    A joule equals 0.239006 calories.

    Stop making shit up, and learn some physics from some textbooks”.

    ****

    Bob…there’s no point reading textbooks and quoting them as a reference if you don’t understand what the equations are telling you.

    A joule is not equal to 0.239 calories, as in ‘the same thing’, it is EQUIVALENT to 0.236 calories. There is a big difference. They represent two different forms of energy and you cannot add energies of different types without converting all the energies to their equivalents.

    Read Clausius on the equivalence of heat and work. Then read Joule’s work on the same issue. Joule, who came up with your equality, did an experiment in which he powered a small paddle to turn in water. He noted the water warmed by so many degrees, where 1 calorie = a change in heat content of 1 degree C per cubic centimetre.

    In order to claim equality you must add heat to the water directly by some means like a flame. In that case, molecules of gas in the flame are vibrating at a very high rate and when they contact the container holding the water, those rapidly vibrating molecules transfer thermal energy to the molecules in the water via conduction through the container.

    There is no work being done in such a transfer, it’s a straight transfer of thermal energy from a hotter source to a cooler target. With a mechanical paddle turning in water, there is no such transfer of mechanical work to thermal energy. The thermal energy change in the water is generated internally by the water molecules themselves.

    There is no heat transferred from the paddle to the water in Joule’s experiment, the heat is created by disturbing the water molecules and they supply the heat. Therefore there is no direct physical relationship between the mechanical energy driving the paddle and the thermal energy in the water, measured by temperature.

    All Joule’s equivalence is telling you is that a certain amount of work supplied to the paddle results in a certain rise in thermal energy in the water. The equality should read, 1 joule is equivalent to 0.238 calories.

    In the 1st law, Q (heat) is related to Work (W) and Internal energy (U). According to Clausius, who created the U term for internal energy, U is further broken down into U = Qint + Wint, where work is the mechanical energy of vibration of internal atoms/molecules and Qint is the heat content of the mass.

    In order to get the equality between Q and W, either has to be converted to the EQUIVALENT of the other. You cannot add Q in calories and W in joules. Normally, they convert calories to their equivalent in work, then they can add/subtract the terms.

    • bobdroege says:

      I said stop making shit up and go read a textbook, I don’t know where you are getting this stuff but please stop.

      Joules and calories measure the same thing, energy, which can be of different forms, potential, kinetic, flow, electric and so on and so forth.

      For christ’s sake this is just garbage

      “With a mechanical paddle turning in water, there is no such transfer of mechanical work to thermal energy.”

      Yes there is, work is defined as force times displacement.
      The paddle is doing work on the water and the result is that the water gets warmer.

      Energy is energy and you can transfer one form of energy to another.

      Here are some examples

      Throw a baseball straight up in the air, you muscles convert chemical energy into the kinetic energy of the ball, when it reaches the top of its flight, it’s transferred to potential energy, then it comes back down and you catch it and the energy is now converted to heat in your body.

      Another one, the chemical energy in fossil fuels is converted to heat, which is transferred to water causing it to change to steam, then the flow energy or pressure is used to turn a turbine converting it to rotational kinetic energy which is then turned into electrical energy, but some of that flow energy is wasted and has to heat the heat sink of the steam cycle, etc. Then the electrical energy is turned back into heat to make your tea.

      • Swenson says:

        bob,

        Just as a matter of interest, GR wrote –

        * All Joule’s equivalence is telling you is that a certain amount of work supplied to the paddle results in a certain rise in thermal energy in the water.*

        You lambasted him, and wrote –

        * The paddle is doing work on the water and the result is that the water gets warmer. *, which seems to be saying the same thing in different words.

        I assume you are not just trying to make GR look stupid (that would be trolling), but I really cant see the point you are trying to make.

        Saying energy is energy does not increase anyones knowledge, does it? You might sound more convincing if you abandoned the mild obscenity and blasphemy. If you think it makes you appear more authoritative, you may well be wrong. Some might think it just makes you look foolish and stupid.

        • Bindidon says:

          … and again the little Flynn dog has to pee on the nearest tree, he just can’t let it go.

          ” Some might think it just makes you look foolish and stupid. ”

          You could not give us a more precise description of how you affect readers.

          J.-P. D.

          • Swenson says:

            Binny is again in the grip of of his delusional fixation. Who is Flynn? Or Warnie?

            Binny also appears fixated with dogs and urine.

            Others can make their own judgement about Binnys implication that Siberia will warm by 60,000 C over the next billion years!

            Poor Binny.

      • Nate says:

        “I assume you are not just trying to make GR look stupid (that would be trolling)”

        WHAAT? You mean you understand that trying to make people look stupid is TROLLING?!

        Swenson, now that you recognize trolling, does that mean you will make an effort to stop doing it?

        • Swenson says:

          N,

          If you make yourself look stupid, why blame me?

          I dont try to make you look stupid – you are doing a good job yourself.

          No trolling involved.

  51. gbaikie says:

    “Pretty sure I saw him last month making one of those ridiculous GSM predictions.”

    Are you denier that Sun could have Grand Solar Minimum?

    I don’t have much of opinion about it, but seems solar activity is slowing, but it pick up again, soon.
    A Grand Solar minimum would bad news for Mars exploration, though it could be solved if there is focus sending crews faster to Mars.

    I Think Mars exploration would far more important then trying to control CO2 emission in developing nations. But since China isn’t developing nation, China lowering it’s CO2 emission would be good idea. And imagine soon, India might not considered a developing nation:
    “Reasons why India is a developing country

    Firstly, India has a very low per capita income as compared to the developed countries. Our per capita income was as low as $5610 as estimated in 2014. The difference of per capita income between the developed countries and India is also very large. However, we notice post 1990 to 2014, the Indian economy has grown at a faster rate than many of the developed countries. Even though the per capita income difference got narrowed down, there still exists a difference between the standard of living conditions of the residents of a developed country and India which is quite significant and large.”

    I don’t think capita income difference should be the metric, instead I think metric should cheap access to affordable, and clean drinking water. And access to indoor plumbing- particularly in towns and cities, and any international concern or effort should focused to these aspects.

    • Bindidon says:

      gbaikie

      ” Are you denier that Sun could have Grand Solar Minimum? ”

      This is not a matter of denial, but of observation.

      *
      ” … but seems solar activity is slowing… ”

      Look at how the transition looks from SC24 to SC25, compared to that from SC23 to SC24:

      https://drive.google.com/file/d/1ls0t2D00ifmPGGsNJVYSDGjgwF-Xz_2B/view

      It is not slowing at all.

      J.-P. D.

    • Rob says:

      It was always a low-probability event, yet these people were trying to claim it as a certainty. Early indications are that this cycle will be stronger than last, with the 13-month running sunspot average centered June 2020 being 90% higher than at the same time in the last cycle, which will hopefully put this BS to bed. And even if it had happened it would not have had the effects people are claiming. The Maunder minimum simply put the icing on the cake of an already cold period. People are even claiming that there will be a fully-fledged glacial period – that is the nonsense.

    • bdgwx says:

      Nobody is denying that the Sun goes through grand cycles. What scientists have been saying for the last several years is that the odds of another grand minimum being eminent are low. And Zharkova’s prediction that the next grand minimum would start in 2020 is obviously looking iffy at best now.

      • ren says:

        On the contrary. It is a pity that solar scientists do not see a clear downward trend in the strength of the solar magnetic field. After all, it is they who provide the observational data.
        Space weather facts
        Last X-flare 2017/09/10 X8.2
        Last M-flare 2020/11/29 M4.4
        Last geomagnetic storm 2020/11/22 Kp5 (G1)
        Spotless days
        Last 365 days 209 days
        2021 12 days (50%)
        Last spotless day 2021/01/14

      • ren says:

        Zharkovas forecast is as probable as other forecasts based on previous observations.

        • ren says:

          Sorry.
          Zharkova’s forecast is as probable as other forecasts based on previous observations.

          • Entropic man says:

            Zharkova’s paper was withdrawn. The authors got the changes in Earth’s orbit wrong, which made their forecast meaningless.

          • bdgwx says:

            The prediction the GSM has already started from Zharkova I’m referring to comes from this publication.

            https://www.tandfonline.com/doi/full/10.1080/23328940.2020.1796243

            This was not withdrawn. But it’s also one of those low reputation “predatory publishing” journals. It’s also a journal with a focus on medical physiology of all things. Anyway, this was published after that paper where she claimed the Earth-Sun distance changes like a bobbing spring got retracted.

          • Entropic man says:

            Thank you. My mistake.

        • ren says:

          “We can conclude with a sufficient degree of confidence that the solar activity in cycles 24–26 will be systematically decreasing because of the increasing phase shift between the two magnetic waves of the poloidal field leading to their full separation into opposite hemispheres in cycles 25 and 26. This separation is expected to result in the lack of their subsequent interaction in any of the hemispheres, possibly leading to a lack of noticeable sunspot activity on the solar surface lasting for a decade or two, similar to those recorded in the medieval period.”

  52. ren says:

    As I wrote, the temperature in central Canada will now be fairly constant.
    https://i.ibb.co/4RrBMnD/Screenshot-3.png

  53. ren says:

    The extremely powerful SSW took place in 2009, the year of the Sun’s extremely low magnetic activity. The current SSW also takes place during the period of very low magnetic activity of the Sun. The current SSW will cause severe weather anomalies in the Northern Hemisphere because, like in 2009, it occurred in the middle of winter.
    “The accelerated ascent in the tropics and descent at high latitudes first occurs in the upper stratosphere and then propagates downward to the lower stratosphere. This downward propagation takes over 1 month from the potential temperature level of 1000 to 400 K.”
    https://i.ibb.co/b31gB3w/onlinequery.gif

  54. Bindidon says:

    How stupid is one allowed to be in life?

    ” NOAA and GISS dont bother with those recorded temperatures, they only use 1 thermometer in the territories to get temperature data for the Arctic.

    The rest of them they fudge till they get the desired warming effect they want. ”

    This Robertson is really the dumbest liar we ever could imagine.

    J.-P. D.

  55. Swenson says:

    The somewhat dimwitted flux adders may find they are truly fluxed by reality.

    For example, for a measured solar input of 300 W/m2, at different times of the year, surface and air temperatures can vary greatly.

    If you prefer averages, measured average insolation in at least one locality of 324 W/m2, was accompanied by daily temperature averages between -15 C, and 31 C.

    W/m2 as a measure of temperature? Ho ho ho.

    As a measure of anything useful related to climate? Ho ho ho.

    Carry on. May the flux be with you all. It is no substitute for science, though.

    • bobdroege says:

      IANAD but you appear to have the flux, better go see a doctor.

      Put de lime in de coconut shake um both up.

    • Tim Folkerts says:

      None of that is the least bit challenging for people who understand physics. Once again, you confuse incoming flux and emitted flux, so I am not surprised you find this difficult.

      Temperature is *measured* using current EMITTED flux from a material. This is how Roy measures temperatures. This is how nurses measure your temperature when you visit a clinic. You can buy an IR thermometer for $50 that quickly, easily, accurately determines temperatures based on emitted fluxes from surfaces.

      Your discussion of incoming solar flux shows that you just don’t understand the issues at play. Instantaneous incoming fluxes and annually averaged incoming fluxes are each only loosely related to the current temperature anywhere.

      • Swenson says:

        Tim,

        I confuse nothing. You try your best to avoid reality, creating imaginary scenarios using magical Tim Folkerts physics.

        You are mired in the 18th century. You obviously do not understand the operating principles behind remote IR thermometers. Otherwise, you would not make the ridiculous generalised claim about $50 IR thermometers. Roy and others do not know what the temperature indicated by their instrument, when pointed at the sky, means. Seriously.

        As to deliberately attempting your usual audience distraction, I used averaged incoming fluxes, and average temperatures. I agree with you that incoming fluxes are completely irrelevant, when object temperatures are measured.

        As I said, an object receiving 300 W/m2 from ice, cannot achieve a temperature of more than 0 C. An object receiving 300 W/m2 from the sun cannot achieve a temperature of more than, say, 5800 K.

        Same flux intensity, wildly different maximum obtainable temperature.

        Face reality Tim. You have no clue.

        • Tim Folkerts says:

          Swenson comments: “As I said, an object receiving 300 W/m2 from ice, cannot achieve a temperature of more than 0 C. An object receiving 300 W/m2 from the sun cannot achieve a temperature of more than, say, 5800 K.”

          Close, but not quite. An object (blackbody) that is receiving 300 W/m^2 — whatever the source — will only be able to warm to 0 C. 300 W/m^2 of sunlight can still only warm a surface to 0 C. (Assuming in both cases there are no other warm objects around adding their own fluxes).

          The difference here is that 300 W/m^2 from ice must be coming from all directions, since ice only emits 300 W/m^2. Since the flux is already coming from all directions, it cannot be further focused. Mirrors of lenses cannot increase the flux above the flux of the surface emitting the flux. Basically, if you added a mirror to reflect some of the ice’s flux to a surface, you are simultaneously blocking an equal amount of flux from other ice.

          Sunlight, on the other hand, comes from about 0.001% of the sky. Now mirrors and lenses CAN increase the flux. Adding a mirror can create a “second sun” doubling the flux received from 300 W/m^2 to 600 W/m^2. More mirrors could add more flux yet: 900 W/m^2, 1200 W/m^2 …

          In principle, a set of perfect mirrors could increase the flux received up to 64,000,000 W/m^2 — the flux emitted by the surface of the sun. And this 64,000,000 W/m^2 (NOT 300 W/m^2) of received flux could warm a surface to the 5800 K you mentioned.

          RECAP

  56. Clint R says:

    The idiot response to the debunking of the “energy imbalance” nonsense has exceeded my wildest expectations.

    Trolls Nate and bdgwx continue to display both their ignorance of physics and their inability to learn.

    Nate has no idea what “surface” refers to, relative to the S/B equation. He believes that a solid cone does not have a surface, I guess?

    And bdgwx wows us with this statement: “No reputable scientist is trying to add fluxes from DIFFERENT surfaces and expecting a sensible result.”

    As bdgwx tries to add fluxes from Sun and atmosphere!

    bdgwx later entertains with more of his nonsense: “And because these fluxes are all in reference to the same 510e12 m^2 area they are conserved so we can add them.”

    bobdroege would disagree with bdgwx, and some others: “Who needed explanation that flux is not conserved.”

    The fun continues.

    • bobdroege says:

      ClintR Jester,

      Still looking for the debunking of the energy imbalance. That would be the debunking of the first law of thermodynamics, won’t happen any time any place in this universe.

      Hey Jester, bdgwx and the rest of us know that the flux addition occurs at the surface.

      Hey but you could have figured that out if you knew what 510e12 m^2 meant.

      • Clint R says:

        You’ll be looking for a long time, bob. I didn’t debunk any REAL energy imbalance. I debunked the bogus “energy imbalance” nonsense. (Notice the quote marks.)

        The bogus “energy imbalance” does not deal with “energy”, it deals with “flux”. Flux does not have to balance, as indicated by the solid cone that absorbs 900 W/m^2, yet only emits 180 W/m^2.

        I enjoy explaining these simple concepts because I know you idiots can’t understand them.

        So keep looking. That’s why this is so much fun.

        • bobdroege says:

          So if I follow you, all I have to do is call it bogus and put it in quotes to debunk it.

          Ah that makes is so easy.

          And the added insult just for funsies.

          Jester.

          Like I said below, if the area is the same, the time is the same all that’s left is energy and that is conserved.

          You have not debunked anything.

    • Rob says:

      Are you and Swenson twins? This is very little to distinguish between your choice of vocabulary, grammar, phraseology and proof by insult.

      • Clint R says:

        Rob, you appear to be new here. I didn’t insult anyone. The “idiot” word is used for people that deny/distort/reject reality.

        The word “troll” is used for people that bring no science, as you did in that comment.

        • Rob says:

          Your only concession to science appears to be assertions that you are the font of all science knowledge, and whether someone is to be regarded as an “idiot” is determined by your “authority” in science. There is no sign at all from you and your buddy of any humility, no sign that you recognize that there might be things that you don’t know.

          • Clint R says:

            Wrong Rob, I never made any such assertions. Your need to make false accusations is typical of trolls.

            You have nothing to offer.

          • Rob says:

            Change assertions to implications and it is correct.

            Your final sentences, like the one you just made, are always “troll” comments. If you are making a claim about science, your conclusion should be about that science, not a trite put down that sounds like what you would expect to get from kids. It is the main reason the two of you appear similar.

          • Swenson says:

            Rob,

            I see. You admit you are wrong, so you retrospectively change your words to make it appear you are right.

            Typical alarmist tactics. Say anything at all, then say you really meant something else when it becomes obvious your initial statements were in error.

            Why cant you just mean what you say in the first place? Are you trying to intentionally mislead, or stupid, or ignorant, or just sloppy?

            Maybe you think before you start randomly pounding your keyboard?

            Maybe you could define the unique characteristics of so-called climate science, for a start. Climate is defined as the average of weather. Is climate science the study of this average? How would this study benefit anyone at all?

            Come on, at least trot out the main theory supported by the worlds leading climate scientist.

            Ho ho ho!

          • Rob says:

            I was hoping Clint would give me an example of what he meant by a troll comment, but you beat him to it.

          • Clint R says:

            Rob, as Swenson indicated, you didn’t really learn anything from your mistake. You just kept going. You are attempting to claim the “moral high ground”, as well as trying to act mature.

            Perverting reality is neither moral nor mature.

          • Rob says:

            I’m not attempting to claim the moral high ground. It is simply being defaulted to me. The fact that you believe that acting mature is a negative says it all.

          • Clint R says:

            Perverting reality is neither moral nor mature.

          • Rob says:

            Your admission is refreshing.

    • bdgwx says:

      The 161 and 333 W/m^2 figures from Trenberth 2009 are both in reference to Earth’s surface. In other words they are both in reference to the exact SAME surface. And as we’ve been trying to explain that means they are conserved quantities and not only can be added but the 1LOT says they have to be added to account for the incoming energy. And if you subtract off the energy lost via sensible and latent fluxes of 17 and 80 W/m^2 respectively we are left with 396 W/m^2 that must get shed via radiant emission. And because that 396 W/m^2 is a radiant emission you can plug it into the SB law to make a first approximation of the surface temperature of 289K…close to the true value. See the breakout box in Trenberth 2009 for details regarding the bias in the SB law output when dealing with emissivities less than 1 and for non-homogenous radiant emission. I believe bobdroege, barry, Nate, TF, and others agree with me on this.

      • Clint R says:

        bdgwx, Earth’s surface is NOT homogeneous. Earth’s surface consists of mountains, plains, deserts, and oceans. Fluxes are NOT conserved, as power is NOT conserved. You have not clue about the physics involved.

      • Dr Roys Emergency Moderation Team says:

        On a second by second basis, the area over which the Earth receives energy from the sun is only half of the area over which energy leaves the surface.

        Each second, the Earth is only receiving energy over the lit hemisphere. Each second, the Earth emits energy from the entire sphere. Let’s say the Earth receives 480 W/m^2 in one second, over the lit hemisphere. The Earth would emit 240 W/m^2 in that same second, from the entire sphere. Because the area the energy is leaving from is double that over which the energy is received, the 240 W/m^2 would be in balance with the 480 W/m^2.

        Numbers used are just for simplicity.

        • Clint R says:

          If a blackbody sphere absorbed 960 W/m^2, then at equilibrium it would be emitting 240 W/m^2.

          To “emit” 960 W/m^2, the surface would have to be at 361 K (88C, 190F)!

          Flux does not simply add.

          • bobdroege says:

            Right but you now are flunking the math

            960 watts/meter squared from the sun is received in a cross-sectional area that is 1/4 of the area that is emitting.

            So you multiply the flux by 4 to get the total energy which is conserved.

            But you knew that, didn’t you.

            That’s why they call it an energy balance, not a flux balance.

            Though like we have tried to get through your thick skull, when the areas are the same and the time is the same, fluxes can be added simply.

          • Dr Roys Emergency Moderation Team says:

            “when the areas are the same…”

            That’s just it, though, bob. The areas are not the same, if you treat the input and output in real time, on a second by second basis. Then the area receiving the flux is only half that of the area emitting, as I explained. So 480 W/m^2 incoming can balance with 240 W/m^2 outgoing.

          • Nate says:

            “if you treat the input and output in real time, on a second by second basis”

            Why do we need to do that?

            In my house, the furnace might turn on 25% of the time to keep my house near the set point temp on an average winter day.

            Meanwhile heat is flowing out thru the walls and windows continuously.

            If I want to calculate the av heat flow input to my house, it is simply the furnace output*0.25. And it will equal the average heat flow out thru the walls.

            Same for the Earth.

            So what is the problem?

          • Clint R says:

            Troll Nate, you can do that with “energy”, but not with flux.

            Energy is a scalar quantity. It can be averaged. Flux is a non-scalar. It is not conserved.

            A blackbody sphere absorbing 960 W/m^2, emits 240 W/m^2, at equilibrium. “960” does NOT equal “240”.

            An ice cube emits about 300 W/m^2. A cube has 6 sides. But the ice cube is NOT emitting 6 * 300 = 1800 W/m^2. It is only emitting 300 W/m^2. If you have 1000 ice cubes, you still only have 300 W/m^2. Flux does not simply add.

            You have no clue about the physics involved, and can’t learn.

          • Tim Folkerts says:

            Clint you are half-right.

            What you say about flux EMITTED by ice is completely true. No matter what the size or shape; no matter how many ice cubes or how many sides — ice at 0C always emits about 300 W/m^2 from its surface.
            Everyone agrees — you can’t add emitted fluxes. So stop beating this dead horse.

            But there are further concepts that you seem to miss, related to flux ABSORBED by a surface. In particular, just because an ice cube EMITS a flux of 300 W/m^2, that doesn’t mean that some other surface RECEIVES a flux of 300 W/m^2. Depending on geometry (sizes, orientations, distances), the flux RECEIVED by a surface could be anywhere from 0 W/m^2 to 300 W/m^2.

            These fluxes do simply add. If a surface RECEIVES 1 W/m^2 from one distant ice cube, RECEIVES 2 W/m^2 from a distant second ice cube, the total received flux is indeed a simple sum = 3 W/m^2.

            If you turn on 2 light bulbs, the flux RECEIVED at a surface is indeed found by adding the fluxes of each bulb. If you have 1000 W/m^2 of solar hitting the earth’s surface AND 200 W/m^2 of LWIR, the total flux is indeed simply 1200 W/m^2.

            (There are limits here — geometry limits the possible flux received to 300 W/m^2 from ice emitting 300 W/m^2, but that is a different discussion.)

          • bobdroege says:

            DREMPTY,

            It’s just that they are doing averages, not second by second.

            “Thats just it, though, bob. The areas are not the same, if you treat the input and output in real time, on a second by second basis. ”

            They are averaging the input to one hemisphere over the whole surface.

            If you get the inputs wrong, how can you expect your conclusions to be accepted.

          • Clint R says:

            TS, you are half-right.

            You are right when you agree with me, as indicated by your bolded quote: “Everyone agrees — you can’t add emitted fluxes.”

            But you are wrong when you go on trying to add emitted fluxes. Your example of adding spotlights was especially revealing because human eyes are absorbing the REFLECTED light, not the emitted light. A second weaker spotlight can not raise the temperature of an absorbing surface beyond the temperature of a more intense spotlight.

            Your example of adding 1000 W/m^2 to 200 W/m^2 from the atmosphere was stupidly egregious. Earth would only “see” 1000 W/m^2. Beyond that point, Earths atmosphere REDUCES solar, it does NOT add to solar. Moon gets the same solar as Earth, but temperatures reach much higher levels because Moon has insufficient atmosphere.

          • Tim Folkerts says:

            “A second weaker spotlight can not raise the temperature of an absorbing surface beyond the temperature of a more intense spotlight.”

            Hold out your arm. Feel that warm sunlight on the “absorbing surface” of your skin.

            Now I will take some mirrors and reflect some light on to your arm. Since the mirrors don’t reflect 100% of the sun light, each will be a “less intense light” than the original beam. If you are right the area where I reflect the extra sunlight will not get warmer. If you are right, I could take a dozen mirrors with “weaker light” and they would also not warm you arm.

            Are you willing to try this?

          • Dr Roys Emergency Moderation Team says:

            “DREMPTY”

            I thought we agreed that since I was calling you bob, you would call me DREMT? I can soon go back to adding the L to your name, if you want.

            “It’s just that they are doing averages, not second by second.”

            I know, that’s where they go wrong.

            “They are averaging the input to one hemisphere over the whole surface.

            If you get the inputs wrong, how can you expect your conclusions to be accepted.”

            Exactly, good point. How do they expect their conclusions to be accepted when they get the inputs wrong?

          • bdgwx says:

            +1 Tim Folkerts. None of us have ever tried to add EMITTED fluxes from DIFFERENT surfaces. We have only ever added RECEIVED fluxes on the SAME surface.

          • Clint R says:

            TF, you still don’t get it. You can make up for the reduction of flux caused by the Inverse-Square Law. That can be done with mirrors, magnifying glasses, etc. But that is NOT “adding” flux. You are merely restoring the original level that was lost.

            Take some ice cubes, and all the magnifying glasses and mirror you want. You can’t raise the thermometer above the temperature of the ice.

            Are you willing to try this?

          • Clint R says:

            bdgwx now admits the atmosphere does not add to solar.

          • bobdroege says:

            DREMPT,

            What’s the difference, DREMT is no more your real name than DREMTY.

            Post by your real name and I will respect that.

            Otherwise you are still just an uninformed troll.

          • bdgwx says:

            I did no such thing. In fact, I’m saying that Trenberth’s 161 W/m^2 figure sourced from the Sun must added with the 333 W/m^2 figure sourced from the atmosphere. They add because these figures are referencing the exact same surface…the surface of Earth. In other words, they are the RECEIVED fluxes on the SAME surface. Earth’s surface is RECEIVING 161 W-years of energy from the Sun and 333 W-years from the atmosphere each year for a total of 494 W-years which is an average flux of 494 W/m^2. The surface must shed 494 W-years of energy each year for it maintain a steady-state. That is an average of 494 W/m^2. We can certainly debate the exact values if you like, but we what is not up for debate is the concept of adding these values together to get the combined effect.

          • Dr Roys Emergency Moderation Team says:

            OK then. blob it is.

          • Clint R says:

            Of course that is wrong, bdgwx. The “161” comes from averaging solar flux, which violates the laws of physics. And even if that were possible, it would not add to the IR from atmosphere.

            But, I enjoy watching you deny your denial.

            That’s why this is so much fun.

          • bdgwx says:

            There is no law of physics that says you cannot divide energy by time and area to get an average for that time and that area. Just about every flux figure you see is in some way an average. Even the TSI value of 1360 W/m^2 is itself an average over one orbital cycle.

            And it sounds like you’ve come full circle to challenging the 1LOT and the conservation of energy again. We had GR above challenge the idea of adding energies (and by extension fluxes of the same time and same area) as well. If we cannot convince you that the 1LOT is real then we’re probably at an impasse here.

          • Clint R says:

            Wrong again, bdgwx.

            You seem confused by the units. Just because “flux” has units involving energy units, that does not mean it is energy. You’re trying to say something like “acceleration is longer than a meter”, or some such silly nonsense. “Acceleration” has units involving distance, but we do not compare acceleration to distance.

            “Averaging flux” was debunked here:

            http://www.drroyspencer.com/2021/01/canada-is-warming-at-only-1-2-the-rate-of-climate-model-simulations/#comment-598450

            You just don’t have enough background in physics to understand, and you don’t really want to understand. Understanding might be too close to reality for you. That’s why you make nonsense statements like “And it sounds like you’ve come full circle to challenging the 1LOT and the conservation of energy again.”

            You can’t show one place where I have “challenged” 1LoT.

            You’re an idiot, bdgwx, just making more messes on this blog than you can clean up.

          • bdgwx says:

            I believe you are challenging it right here. The 1LOT says I have to account for both the energy from the Sun and the energy from the atmosphere by adding them together to get the total energy received upon the surface. It also says I have to subtract off the energy shed via sensible and latent removal to get the change in total energy at the surface. If you are challenging this then you are challenging the 1LOT. And since we already proved that if energy is conserved then fluxes must be conserved as long as they are in reference to the same time and same area which they are in this case.

          • bobdroege says:

            You will need some really good evidence to argue that fluxes don’t add.

            They are measured using the same units and are composed of the same elementary particles.

          • bobdroege says:

            At the risk of opening a whole nother can of worms…

            Clint R you made a mistake here

            https://www.drroyspencer.com/2021/01/canada-is-warming-at-only-1-2-the-rate-of-climate-model-simulations/#comment-598450

            You can’t simply average temperatures either.

            Try again without making the same mistake.

          • Clint R says:

            As I stated bdgwx, you can’t show one place where I have “challenged” 1LoT.

            You “believe” I have done that. You make up things to support that “belief”. But your beliefs and made-up nonsense ain’t science.

            You can’t face reality. All you can do is make up nonsense: “And since we already proved that if energy is conserved then fluxes must be conserved as long as they are in reference to the same time and same area which they are in this case.”

            Pure nonsense, idiot. What was done was DISPROVING flux is conserved:

            http://www.drroyspencer.com/2021/01/canada-is-warming-at-only-1-2-the-rate-of-climate-model-simulations/#comment-598954

          • Clint R says:

            The “mistake” is your’s, troll bob.

            “Two identical surfaces…

            You don’t have a clue about the physics involved, so don’t expect to understand.

          • bobdroege says:

            The two identical surfaces wasn’t the mistake you made.

            I told you what the mistake was, what’s the matter, can’t you read?

            You can’t average temperatures simply either.

            Keep making physics mistakes, I’ll keep pointing them out to you.

          • Clint R says:

            Correct bob, you can’t understand it. You don’t have a clue about the physics involved

          • Nate says:

            “But that is NOT ‘adding’ flux. You are merely restoring the original level that was lost.”

            Well as a matter of fact, the math he used was addition. And it works just fine with fluxes striking the same surface. There is no other math that can be used to find the total flux hitting your arm.

            Your talk of ‘restoring’ does’t change the fact that the fluxes ADDED.

            You are simply wrong.

          • Nate says:

            “Its just that they are doing averages, not second by second.”

            “I know, thats where they go wrong.”

            In your opinion there is SOMETHING wrong with that. But you just can’t explain what that something is.

            Oh, well. We’ll just have to file that where it belongs..

          • Clint R says:

            Thanks Nate for your uneducated, unsupportable opinions. The more you claim reality is “wrong”, the more fun it is.

          • bdgwx says:

            ClintR said: As I stated bdgwx, you can’t show one place where I have “challenged” 1LoT.

            If you stand by your argument that we cannot add the energy from individual sources to determine the amount taken up by the surface then you are challenging the 1LOT. And if your criticism of energy budget analysis like that from Trenberth is that the 1LOT is bogus then obviously we cannot take it seriously.

          • Clint R says:

            bdgwx, as you are unable to produce any comment where I “challenged” 1LoT, you have to make things up. So you start by substituting “energy” for “flux”. Then you alter the issue to a surface “taking up” from individual sources.

            You are such an idiot you will never understand. So this is just for the record:

            * Fluxes from differing sources can NOT be simply added.
            * A “flux” can NOT be treated as “energy”.
            * Flux is NOT conserved, as the absorbed flux to a body at equilibrium may not equal the emitted flux.
            * Consequently, the bogus “Energy Imbalance” is nonsense.

            And bdgwx, we never take idiots like you seriously. You’re only good for your entertainment value.

          • bdgwx says:

            ClintR said: Consequently, the bogus “Energy Imbalance” is nonsense.

            Energy imbalance is EXACTLY what the 1LOT is addressing.

            In its more traditional heat form…

            dU = Q – W

            Or its more generic energy form…

            dE = Ein – Eout

            If Ein != Eout then dE is literally non-zero and the system being analyzed has an energy imbalance.

            By saying the concept of energy imbalance is “bogus” and “nonsense” you are literally calling the 1LOT “bogus” and “nonsense” as well.

          • Clint R says:

            Thanks for proving again what an idiot you are, bdgwx.

            1LoT is about ENERGY. Specifically, it deals with CONSERVATION of ENERGY. But the bogus “energy imbalance” nonsense deals with FLUX. “Flux” is NOT “energy”, you idiot. Flux is NOT conserved. Energy is conserved.

            You have no clue about the physics involved, and you can’t learn.

          • bdgwx says:

            dE is the energy balance term in the 1LOT.

            And if you accept that…

            dE = Ein – Eout

            …then you have to accept…

            dE / (t*A) = (Ein – Eout) / (t*A)

            …and you have to accept that…

            d(E/(tA)) = (Ein/(tA)) – (Eout/(tA))

            …and you have to accept that…

            dF = Fin – Fout

            …and you have to accept that…

            dF = dE / (tA) or dE = dF * tA

            As you can see if energy is conserved then flux must be conserved as well as long as Fin and Fout are in reference to the same time (t) and area (A). The math doesn’t lie.

            If you want to convince us that the energy imbalance is “bogus” and “nonsense” or that fluxes are not conserved then you need to provide documentation of experiment where energy was not conserved. Otherwise your criticism of Trenberth’s energy budget (and others like) is rejected.

            I’ll give you the last word here.

          • Clint R says:

            Notice that bdgwx is completely oblivious to facts. No matter how many different ways I explain to him, or no matter how many easy-to-understand examples I provide, he ignores reality. He just keeps throwing out the same nonsense.

            In his latest comment, he AGAIN tries to claim the bogus Trenberth cartoon is using energy. bdgwx makes his comment about energy, but his bogus Trenberth cartoon uses flux. bdgwx continues to ignore reality.

            He acts as if I have never addressed any of his concerns. He continues to believe that flux is conserved, because he has no understanding of physics. The easy-to-understand spherical black body is a perfect example of flux NOT being conserved. The sphere absorbs 960 W/m^2, but only emits 240 W/m^2. “960” does not equal “240”. bdgwx refuses to consider that reality. His mind is closed.

            Just one more example of why the idiots are idiots. They reject reality so they can cling to their false beliefs. Cultism only works on a closed mind.

          • Nate says:

            “Thanks Nate for your uneducated, unsupportable opinions. ”

            Truth translater says:

            Thanks Nate for your educated, supportable opinions.

            You obviously AGREE with Tim that the fluxes hitting your arm are SUMMED, and can burn the hell out of your arm as result!

            Your attempts to weasil out of it make absolutely no sense.

          • Nate says:

            “A blackbody sphere absorbing 960 W/m^2, emits 240 W/m^2, at equilibrium. ‘960’ does NOT equal ‘240’.

            Why do you keep repeating this nonsense strawman?

            You are comparing the PEAK flux input with the AVERAGE flux output.

            Of course peak and average are NOT THE SAME!

            No one is saying they should be the same!

            The average input and output ENERGIES for 24 h for the whole Earth are THE SAME, or nearly so, Because of 1LOT.

            Because the Area is always the area of the whole Earth…

            Then the average INPUT and OUTPUT fluxes are the same, 240 W/m^2.

            Why do you insist on making this complicated?

          • bdgwx says:

            That’s right Nate. I know that you already know this, but for the lurkers…where the input and output do have their small differences that is the energy imbalance or the dE term in the 1LOT. dE is currently estimated at (0.87 W/m^2 * 31556952 s * 510e12 m^2) = 14 ZJ each year which is very close to Trenberth’s estimate of 14.5 from 2009.

          • Clint R says:

            Wow, I almost didn’t notice your comment, troll Nate. I just happened to scroll back this far and lucked out! I would have hated to miss it. It’s a classic!

            Again, showing your lack of understanding of physics, you actually stated:

            “You are comparing the PEAK flux input with the AVERAGE flux output. Of course peak and average are NOT THE SAME!”

            OMG, what an idiot you are!

            I wasn’t comparing “average” flux output, I was comparing “peak” flux output. All of the emitted flux is the same, you idiot. The emitted flux is 240 W/m^2. That’s is the “peak”. You don’t talk about “average” if you only have one value, you idiot.

            A classic!

          • Clint R says:

            bdgwx, your bogus “energy balance” is nonsense.

            But you can’t learn.

            That’s why this is so much fun.

          • Nate says:

            “All of the emitted flux is the same, you idiot. The emitted flux is 240 W/m^2.”

            What???!

            No it isnt! Not the same from place to place. Not the same day and night.

            240 W/m^2 is an space-time average.

          • Nate says:

            Non sequitur.

            That’s ok.

            Tim burns you with SUMMED fluxes and you get all hot and bothered and flame out.

          • Clint R says:

            Yes, I do enjoy seeing you idiots get tangled up in your own cult nonsense.

          • Nate says:

            You invite and enjoy ridicule? Ok, whatever gets you off..

          • Nate says:

            Lets be absolutely clear, 960 W/m^2 is the Peak solar input flux.

            240 W/m^2 is the global AVERAGE solar input flux.

            240 W/m^2 is the global AVERAGE output flux.

            They are equal.

            NO one except you, Clint, is trying to compare peak to average and coming up short.

            That is you being just plain dumb.

        • gbaikie says:

          –On a second by second basis, the area over which the Earth receives energy from the sun is only half of the area over which energy leaves the surface.

          Numbers used are just for simplicity.–

          Disk vs hemisphere area.
          But amount sunlight reaching surface is smaller fraction than 1/2- as one gets more intense sunlight when sunlight is nearer zenith.
          So, one gets more yearly sunlight in tropical zone [23.5 degree latitude, north and south- and about about 40% of earth surface area]. Or the 40% area is said to get more than 1/2 of the sunlight reaching Earth. But it’s even smaller than 40%, because it’s a smaller disk at any one time.
          Or hemisphere is 180 degree north/south and east/west and intense
          sunlight part is 45 degree north/south and east/west. From a point hemisphere is 90 degree, sunlight is 45 degrees but 45 degrees donut surrounding it, is a lot more 1/2 surface area of hemisphere, and a lot less surface area of entire sphere.
          In terms of yearly basis, the axis tilt 23.5 degree “helps to balance it.
          Or with our world, one gets a lot less solar energy if above 45 degree latitude and one tilting solar panels {unlike the level ground] same amount of sunlight hours per year {12 hours average].
          So, if Earth had no atmosphere and one tilted solar panels, you get same amount of sunlight as anywhere. But earth surface doesn’t point at sun, it’s level. So in airless world with solar panels which are level surface, one gets less sunlight reaching panel.
          With northern hemisphere, 45 degrees down from north pole is less than 1/2 of northern hemisphere area.
          Or if Sun was at zenith at north pole, down to 45 degree north latitude gets the most amount of sunlight, and 45 degrees to equator is more area and a lot less sunlight reaching the larger surface area [and the entire southern hemisphere is in darkness].
          And that is what happening in any instant of time.
          But with our spinning planet in terms of year, we get more intense sunlight over more area of the planet {the larger region nearer to the equator, and tilt defines warmest region, the tropics.
          And less tilt gives less “global warming” and more tilt give more global warming- but it is not changing area heated in an instant in time.

  57. Ken says:

    I keep hoping I’ll learn something from these blog comments. I don’t know why.

    • Entropic man says:

      You have to winnow a lot of chaff.

      If you want pseudoscience, listen to Swenson, ClintR,or Gordon Robertson.

      If you want the generally accepted science, listen to Nate, Tim Folkerts, bindidon or bdgwx.

      • Richard Greene says:

        Don’t listen to any of them.

        Go outside and enjoy the wonderful climate.

        Earth’s climate hasn’t been this good in hundreds of years.

        The coming “climate emergency” is a false boogeyman not backed by any science.

    • Clint R says:

      Hang in there, Ken. If you pay attention, you will find there are two groups of commenters here. One group slavishly follows the cult teachings, and one group thinks for themselves. The cult group largely attempts to pervert, distort, and deny reality.

      If you can think for yourself, you will quickly learn with group is which.

      • Entropic man says:

        “One group slavishly follows the cult teachings, and one group thinks for themselves. The cult group largely attempts to pervert, distort, and deny reality. ”

        If you haven’t already realised, that group includes Clint R, Swenson and Gordon Robertson.

        • Clint R says:

          Ent, you should ask “Sou” is he/she believes two ice cubes can make something hotter than one ice cube.

          That’s a good indicator if someone accepts reality, or not.

          • bobdroege says:

            Why don’t you post a comment at her site and ask her?

            You might have to up your game, compared to her I am a dull knife.

          • Clint R says:

            No one could argue with that, bob.

          • bobdroege says:

            Clint R,

            So why don’t you go to her site and ask about your stupid ice question?

            Chicken?

            Buck, buck cah cah?

            Here is an experiment you can do to verify that you can make something hotter with two cubes of ice than you can with one.

            Take a dewar flask with just enough liquid nitrogen, that is has needs more heat of evaporation to vaporize than is available from the heat of fusion in one ice cube has heat of fusion but less than the heat of fusion in two ice cubes.

            Drop the first ice cube into the liquid nitrogen, some but not all the liquid nitrogen will evaporate, and the temperature of the nitrogen left will still be about 90 K, add the second cube and the temperature will rise to the temperature of the ice cube.

            So yes you can heat something more with two ice cube than you can with one.

            Oh, you meant something different when you said that bullshit?

          • Clint R says:

            bob, there is no liquid nitrogen in the troposphere.

            But, “dull knives” likely don’t know that.

            (That’s why this is so much fun.)

          • Swenson says:

            bob,

            You are mentally defective or ignorant.

            Do you really not know that ice above the temperature of liquid nitrogen is warmer than liquid nitrogen?

            Dont you understand physics?

            Now try heating nitrogen gas with liquid nitrogen! Hmmmm?

          • bobdroege says:

            Clint R

            I didn’t see you specify troposphere in this statement, did you use invisible ink?

            “Ent, you should ask “Sou” is he/she believes two ice cubes can make something hotter than one ice cube.”

            And do I need to show you a picture of liquid nitrogen in the troposhere?

            I can provide that for you.

          • Clint R says:

            bob, you quoted me correctly, from that comment. Now go back and find where I laid out the scenario in detail. Let’s see if you have any interest in reality, other than perverting it.

          • Swenson says:

            Yes, ask Slandering Sou!

            With a degree in Agricultural Science, no doubt her knowledge of quantum physics is vast.

            Pity she decided it was all too hard, and moved into management and consultancy.

            Much easier – just take all the credit if things work out, or move on if your advice proves disastrous!

            No having to worry about things like the scientific method for our Sou!

          • bobdroege says:

            Clint R

            I’ll quote you exactly again.

            “bob, you quoted me correctly, from that comment. Now go back and find where I laid out the scenario in detail. Lets see if you have any interest in reality, other than perverting it.”

            I don’t need to find where you perverted physics with your you can’t heat something with ice.

            It all goes to where you misinterpret physics claiming the wavelength of a photon tells you something about the temperature of the object that emitted the photon.

            I am not to be bothered tracking down the initial place where you went wrong.

            The current discussion is whether you can add fluxes, you can, but you are right, it’s not simple addition.

            I’ll give you that, but that doesn’t mean they can’t be added.

            Fluxes add, they are made of the same elementary particles and measured using the same units.

          • Clint R says:

            Thanks for verifying that you have any interest in reality bob, other than perverting it.

          • bobdroege says:

            Clint R,

            Try showing me where I have the science wrong, if you can.

          • Clint R says:

            You get the science wrong every time you argue against reality, bob.

            But, the issue here is you not understanding the scenario I set up with the two ice cubes and a thermometer. And your unwillingness to correct your mistake.

          • bobdroege says:

            Clint R,

            I don’t believe I made any comment on your stupid two ice cube and thermometer puzzle, because it was hopeless to get you to see where you are getting the physics wrong.

            Because you can’t tell the temperature of the source of a photon by it’s wavelength.

          • Clint R says:

            Yes, you messed up again, bob.

          • bobdroege says:

            Clint R,

            You can’t specify where I messed up, can you?

            Nope, didn’t think so.

          • bobdroege says:

            Clint R,

            See, exactly what I said you claim I was wrong, but you don’t specify how I got it wrong.

            Epic Fail Again.

            Here try this experiment.

            Take a block of ice and put a thermometer close to it.

            Then put a block of dry ice, such that the thermometer is between the block of ice and the block of dry ice.

            Record the temperature.

            Now put another block of ice between the thermometer and the block of dry ice.

            Record the temperature.

            Profit!

          • Clint R says:

            Your “Oh look, a squirrel” tricks don’t work, bob.

            You just messed up again.

          • bobdroege says:

            Clint R,

            Dude, I warmed a thermometer by adding another block of ice.

            I see you can’t deal with the physics, again.

          • Clint R says:

            Wrong again, bob.

            You’re changing the scenario to cover up your mistake.

            Your “Oh look, a squirrel” tricks are’t working for you.

      • theRealPlastic says:

        I am increasingly convinced Clint R is actually the second account of Gordon Robertson, the fake engineer.

    • Nate says:

      “One one group thinks for themselves.”

      Indeed. They dream up their own version of physics and facts, which often don’t agree with ordinary physics and facts. We call that Fizuks.

    • Eben says:

      You will learn more about climate science from Frankie MacDonald than from this place

  58. ren says:

    Manitoba. Please look at the pressure. A harsh winter in the Midwest.
    https://i.ibb.co/cxhw3Fp/Screenshot-3.png

  59. Gordon Robertson says:

    tim…”So what happens? All of the original 300 W are still getting absorbed. And the new 300 W is ALSO getting absorbed. The tile is receiving 600 W/m^2 (ie 600 W) and will warm up by a factor of 2^0.25, to 325 K, or about 50 C.

    These fluxes add in completely meaningful ways”.

    ***

    Tim…you’re way off. If an ice house at 0C is radiating a plate at 0C, there is no transfer of heat. The radiation is doing nothing.

    If you add sunlight, the plate will immediately warm, and the 2nd law tells us the ice at 0C cannot transfer heat to a warmer plate. Therefore, the only radiaton affecting the plate is the solar energy.

    Fluxes from ice and solar energy will not add. They are at very different frequencies and intensities. The only way you could get EM to add is to have two or more waves in phase at the same frequency and at a similar intensity.

    You do recall the double-slit experiment?

    • Tim Folkerts says:

      “Tim…you’re way off. If an ice house at 0C is radiating a plate at 0C, there is no transfer of heat. The radiation is doing nothing.”
      Half correct.
      Yes, there is no transfer of heat (ie there is no net flow of thermal energy).
      But radiation is “doing something”. Photons are flying back and forth in opposite directions at equal rates.

      “The only way you could get EM to add is to have two or more waves in phase at the same frequency and at a similar intensity.
      If this were true, then turning on two lightbulbs (not in phase, but similar intensity) would not add and your room would not get any brighter.

      “You do recall the double-slit experiment?”
      Yes. That does relate to adding light in phase. But it is not important for out of phase EM waves. Both in-phase and random-phase waves add — they just have different results because they are different situations.

      • Gordon Robertson says:

        tim…”You do recall the double-slit experiment?
        Yes. That does relate to adding light in phase. But it is not important for out of phase EM waves. Both in-phase and random-phase waves add they just have different results because they are different situations”.

        The double-slit experiment does not operate with coherent light, the input is EM of all frequencies. The output, however, on the other end of the slits, arranges itself on a target surface so that certain frequencies add and others subtract, hence the dark and light patterns on the target.

        However, the addition/subtraction is not taking place in free air, it happens on a surface. Without the target surface, no one would see the diffraction patterns.

    • bobdroege says:

      If you have ever seen shadow bands during an eclipse of the Sun, you would have seen evidence that fluxes do indeed add.

      • Gordon Robertson says:

        bobd…the shadow bands are apparently due to refraction by the Earth’s atmosphere. Also, they occur on a surface, not in free air.

        • bobdroege says:

          Yes, diffraction causes the light from the Sun to take slightly longer or shorter paths to the surface, and it’s the fact that photons interfere with each other constructively and destructively causing the bands appear on the surface.

          Evidence that fluxes do indeed add and subtract.

          Or if you prefer, waves add and subtract.

          • Clint R says:

            The fact that photons can interfere with each other is one of the reasons fluxes can NOT be simply added.

          • Swenson says:

            bob,

            Complete nonsense. The exclusion principle does not apply to photons.

            Get a grip.

          • bobdroege says:

            Right Clint R,

            Because there is no reason fluxes can’t be added, and in fact the constructive and destructive interference that photons exhibit is evidence that fluxes can be added.

            Keep going, you are doing so well.

          • Swenson says:

            bob,

            You are dimwitted. Stringing together random words wont help.

          • bobdroege says:

            Swenny dear boy,

            Where was I talking about the exclusion principle?

            I am discussing photons which are not affected by the exclusion principle.

            But hay, you brought it up, and the exclusion principle has nothing to do with electrons when they constructively and destructively interfere with each other just like photons, you know how the two slit experiment has also been done with electrons and other particles with the same result.

            Swenny, just keep typing shit you don’t understand, it keeps me amused.

          • Swenson says:

            bob,

            I repeat – you are dimwitted.

            Th exclusion principle does not apply to photons.

            It does apply to electrons.

            Your claim related to photons. You now emphasise this.

            You are simply confused. You obviously do not understand the profound implications of the double slit experiment.

            Nor much else, apparently.

          • bobdroege says:

            Swenny,

            The double slit experiment works for both photons and electrons.

            The exclusion principle states that two or more fermions can not occupy the same quantum state within the same quantum system at the same time.

            If you understood anything about quantum mechanics or quantum electrodynamics you would understand that the exclusion principle does not apply to the double slit experiment.

            Your ignorance is profound.

          • Swenson says:

            bob,

            Nice try at distraction.

            You said photons interfere with each other.

            They dont.

            Cutting and pasting irrelevancies does not support your flux addition from sources of different temperatures.

            ?

          • bobdroege says:

            Swenny,

            Again you are wrong and reveal no understanding of the double slit experiment.

            The result is interference bands because the photons interfere with each other.

            “The wave nature of light causes the light waves passing through the two slits to interfere, producing bright and dark bands on the screen a result that would not be expected if light consisted of classical particles.”

            From Quantum Physics for Poets.

            About your speed.

            And it shows that Clint R is smarter than you, doesn’t that make you proud?

            “The fact that photons can interfere with each other is one of the reasons fluxes can NOT be simply added.”

            And that’s a complete post from Clint R.

  60. CO2isLife says:

    Dr Spencer, I have a request to make. Would you start a Blog Post where people could posts links to Weather Stations that show no warming over the Past 100 or so years? I’ve been amazed at how many stations, when selected to control for the Urban Heat Island Effect and Water Vapor show no warming. I’m curious at to what the % of Weather Stations with BIs less than 10 actually show warming. It would be nice to have a Crowdsourced List of Weather Stations that show no warming. Many hands make light work. Readers of your blog could post their list of stations that show no warming.

    It would be the basis for a nice research project.

    • bdgwx says:

      I don’t see why Dr. Spencer needs to make a post. The GHCN-M inventory file has the BI values in it. Just select the stations with BIs less than 10 and load up either the QCF or QCU file depending upon whether you want to analyze the adjusted values or the unadjusted values and pull out only the stations matching your criteria.

      You get the latest GHCN-M files here.

      https://www.ncei.noaa.gov/data/global-historical-climatology-network-monthly/v4/access/

      • CO2isLife says:

        Thanks bdgwx. I wasn’t able to find the BI in those files however. Are you sure they are there? I used STEVESTON as the example and it has a BI of BI, but was unable to find that value in either report.

        When you say “Just select the stations with BIs less than 10 and load up either the QCF or QCU file depending upon whether you want to analyze.”

        Where would you do that? I guess where and how would you do that?

        Any insight would be appreciagted.

        • bdgwx says:

          Ugg…you’re right. I forgot that the BI values are added to the inventory file with the GISTEMP code using the world-rad.data.txt file. You can download the source code and world radiance file here. https://data.giss.nasa.gov/gistemp/sources_v4/

          GISTEMP runs in python and is actually pretty easy to get going. Once you have it running you can start doing fun things like filtering out stations based on BI and have the code compute the global mean temperature using only the stations you select.

          The QCU file is the unadjusted data. The QCF file is the adjusted data. In almost every case you’ll want to use the adjusted data because it corrects for station moves, time-of-day bias, etc. If you use the unadjusted data there will be a warming bias.

          • CO2isLife says:

            Thanks bdgwx. Looking through the documentation this stood out “written in fortran and Python.” My father helped develop a derivative of FORTRAN program for high level statistics a long long long time ago. I’m surprised to see it still is in use.

            Thanks for all your help.

          • Bindidon says:

            bdgwx

            ” GISTEMP runs in python and is actually pretty easy to get going. Once you have it running you can start doing fun things like filtering out stations based on BI and have the code compute the global mean temperature using only the stations you select. ”

            Why don’t you publish the resulting data, if you are able to generate it?

            It is as if I would write “You can generate trends out of station data” without posting the trends!

            J.-P. D.

          • bdgwx says:

            Will do. It may take me a little bit though. I had been running GISTEMP on a daily basis…reasons…but those reasons no longer apply and in an effort to reclaim space on my computer I ditched my Linux virtual machine. I’ll have to get things going again.

    • Richard Greene says:

      What about the 71% of the planet’s surface that is water?

      • bdgwx says:

        You’ll need to use ERSST or OISST to analyze that. There isn’t concern with UHI over the ocean like there is with land for obvious reasons.

        • “There isnt concern with UHI over the ocean like there is with land for obvious reasons.”

          That was my point.

          The last time I investigated the UHI “adjustments”, used by one of the global temperature compilations, I found their methodology to be ridiculous. Almost like going through the motions just to say you did a UHI “adjustment”.

          The ridiculous methodology led to removing warming from some weather stations, that was attributed to UHI, and adding warming to other stations, which was somehow attributed to UHI too. The net charge was near zero. So there was virtually no adjustment for the effects of economic growth in the vicinity of weather stations.

          In addition, UHI is not likely to cause much, if any, warming, FROM YEAR to YEAR, for a weather station that started in a city and remained in a city.

          But moving weather stations from towns and cities to airports could cause warming from the usual rapid economic growth around airports over the decades.

          A rural weather station away from any population could have the most warming from UHI as a village grows up near it, which eventually becomes a town, and then a city over the decades.

          • bdgwx says:

            The last time I investigated the UHI adjustments, used by one of the global temperature compilations, I found their methodology to be ridiculous. Almost like going through the motions just to say you did a UHI adjustment.

            GISTEMP uses a brightness index.

            The ridiculous methodology led to removing warming from some weather stations, that was attributed to UHI, and adding warming to other stations, which was somehow attributed to UHI too. The net charge was near zero. So there was virtually no adjustment for the effects of economic growth in the vicinity of weather stations.

            When you move a station from a city center to the suburbs the UHI effect is negative.

            In addition, UHI is not likely to cause much, if any, warming, FROM YEAR to YEAR, for a weather station that started in a city and remained in a city.

            Agreed. Though I think we’ll both also agree that the UHI effect was likely very positive prior to WWII as urbanization occurred rapidly. Then after WWII the UHI effect is close to zero or even slightly negative as urbanization stalled and suburbanization began.

            But moving weather stations from towns and cities to airports could cause warming from the usual rapid economic growth around airports over the decades.

            Definitely. Just like moving stations away from center centers creates a cooling bias. For example, the Denver airport and its station actually moved further away from the city.

            A rural weather station away from any population could have the most warming from UHI as a village grows up near it, which eventually becomes a town, and then a city over the decades.

            Agreed. Though I suspect out of the 27500 stations in the GHCN-M files I’d imagine only a handful exhibited this kind of growth after WWII.

            Anyway, here is the paper by Berkeley Earth explaining how they deal with the UHI and the effect it has on the temperature trend. Their conclusion…the UHI effect is actually more likely to bias the warming trend too low than too high.

            https://static.berkeleyearth.org/papers/UHI-GIGS-1-104.pdf

          • bdgwx says:

            I forgot to mention.

            HadSST trend from 1979 is +0.14C/decade

            NOAASST trend from 1979 is +0.13C/decade

            ERSST trend from 1979 is +0.12C/decade

            So as you can see using SSTs which are generally immune from UHI effects see about +0.13C/decade of warming which is about what we expect.

            BTW…this is probably another good clue that something isn’t right with UAH’s estimates since land warms faster than ocean.

  61. Swenson says:

    Tim Folkerts, illusionist and flimflam man, wrote –

    * “A second weaker spotlight can not raise the temperature of an absorbing surface beyond the temperature of a more intense spotlight.”

    Hold out your arm. Feel that warm sunlight on the “absorbing surface” of your skin.

    Now I will take some mirrors and reflect some light on to your arm. Since the mirrors don’t reflect 100% of the sun light, each will be a “less intense light” than the original beam. If you are right the area where I reflect the extra sunlight will not get warmer. If you are right, I could take a dozen mirrors with “weaker light” and they would also not warm you arm.

    Are you willing to try this? *

    Tim plays with words, in his usual fashion, hoping nobody will realise that concentrating sunlight can reach temperatures close to that of the sun.

    Tim is averse to using temperatures as a measure of hotness, because it would expose his illusion.

    As to his final irrelevant question, should Tim ensure that his heat source is less than a comfortable 28 C or so, go for it Tim. Maybe he will realise that unqualified W/m2 is the basis of the great climate illusion!

    Or maybe not?

  62. ren says:

    Polar vortex at the top of the stratosphere again strengthens. The anomalies have shifted to the lower atmosphere.
    https://i.ibb.co/HYWGLFZ/gfs-z01-nh-f00.png
    https://i.ibb.co/vZrsn6s/gfs-z100-nh-f00.png
    It could be a long and hard winter in the Northern Hemisphere.
    https://www.cpc.ncep.noaa.gov/products/stratosphere/strat-trop/gif_files/time_pres_HGT_ANOM_JFM_NH_2021.png

  63. Bindidon says:

    In the most recent documentation about NOAA weather station info

    https://www.ncei.noaa.gov/data/global-summary-of-the-month/doc/GSOM_documentation.pdf

    I didn’t find anything related to nightlight or brightness measured by satellites.

    The only specification of the brightness associated to weather stations known to me is that used in GHCN V3 (deprecated in between): satellite measured nightlight level around stations.

    https://tinyurl.com/y7fjyha6

    The information is stored in the station description files (names ending with ‘.inv’)associated to the data files (names ending with ‘.dat’) containing measured temperatures (qcu and qca files for Tmin, Tmax and Tavg):

    https://tinyurl.com/y98yy8fp

    You have to unpack the compressed files to access the description and data files.

    Having done that, you can select, in the description files, stations marked as ‘R’ (rural) and with the least nightlight level ‘A’, and you can compute the trend of the data collected by the stations over their whole lifetime.

    Here are the trends for such Canadian stations (with at least 50 years activity, and a linear trend within -0.5 C — + 0.5 C / decade):

    https://drive.google.com/file/d/1YiyVVQeP15trduKsJyhdV8mLj4k6eAXo/view

    If somebody pretends here that all stations showing a positive trend are subject to UHI, then it’s time for her/him to visit a doctor…

    I had some years ago enough discussions at WUWT with people thinking that UHI is everywhere on Earth whenever a positive trend is detected.

    J.-P. D.

    • Gordon Robertson says:

      binny…don’t know if this is what you’re getting at…

      https://www.giss.nasa.gov/research/news/20011105/

      “If somebody pretends here that all stations showing a positive trend are subject to UHI, then its time for her/him to visit a doctor”

      What somebody actually said was this. Most of the temperature data centres in Canada are found around major cities and those cities are mainly located along the 49th parallel. Even though Canadian provinces extend to the 60th parallel, similar to Siberia, there is not much else in common between the two regions.

      Ergo, you won’t find surface stations out in the bush, taiga and tundra which makes up 99% of Canada. Same goes for Siberia.

      It should be noted from the link above:

      “Dr. James Hansen of NASA’s Goddard Institute for Space Studies, New York, and Marc Imhoff of NASA’s Goddard Space Flight Center, Greenbelt, Md., along with several other researchers analyzed records for 7200 global weather stations and used satellite observations of nighttime lights around the planet to identify stations with minimal local human influence. Their findings appeared in a recent issue of the Journal of Geophysical Research (Atmospheres).

      “Warming around the world has been widespread, but it is not present everywhere,” Hansen said. Warming in the past 50 years has been rapid in Alaska and Siberia, but Greenland has become cooler. The lower 48 United States have become warmer recently, but only enough to make the temperature comparable to what it was in the 1930s”.

      If you look at the UAH global contour maps, you can see that Arctic warming varies its location constantly (at least monthly). Hansen et al did not look into it deeply enough. If they had, they might have noted, at other times, that Greenland was warmer while Alaska and Siberia were cooler.

      We have to keep ‘warmer’ in perspective. In winter, we are talking about it warming from -60C to -55C, and only spasmodically.

      • Bindidon says:

        Manifestly, Robertson is one more time unable to read a comment, and therefore replies with his usual redundant trash.

        J.-P. D.

      • Dr. James Hansen of NASAs Goddard …

        The Hansen study methodology, which others have used was faulty

        The lights seen from satellites tell you nothing about economic growth over the decades.

        They only attempt to locate “rural” weathger stations at one point in time.

        The important effect of UHI is not just the fact that cities are warmer than rural areas

        The important effect is how economic growth in the vicinity of a weather station causes warming over many decades.

        The right way to estimate the effect of UHI over time is to compare long term weather station records, of stations in cities, versus rural station located outside of those cities.

        The usual observation is that the urban temperature rises faster than surrounding rural stations over the decades, as the cities and suburbs around them gain population, while the rural area remains rural.

        This sensible methodology does not work well because there are too few rural weather stations in the world that have continuous long term temperature records.

        And even if you could make a decent estimate of the warming effect of economic growth on land surface weather stations, it would not affect the 71 percent of our planet’s surface covered with oceans.

        With all the infilling for missing temperature data, sparse global coverage before World War II, and repeated arbitrary “adjustments” that suspiciously almost always cause more global warming, it’s hard to get excited about a small UHI adjustment to remove the warming effect of economic growth near weather stations.

        • bdgwx says:

          With all the infilling for missing temperature data, sparse global coverage before World War II,

          All surface based datasets must homogenize data. It is unfortunate that we didn’t (and still don’t) have every sq km of the surface covered with a station. But that is the way it is and we have to deal with it regardless. Some, like NOAA and Had.C.R.U.T, choose to do their infilling by assuming empty cells inherit the global average. Some, NASA and Berkeley Earth, choose to do their infilling using various forms of regression from surrounding observations. NASA provides a complete analysis of all sources of uncertainty including spatial sampling here. https://data.giss.nasa.gov/gistemp/uncertainty/

          and repeated arbitrary “adjustments”

          The adjustments in GHCN are not arbitrary. They are necessary to correct biases caused by station moves, time of observation changes, instrumentation changes, etc.

          that suspiciously almost always cause more global warming

          As has been discussed repeated here the adjustments actually work to reduce the overall warming trend. In other words, these adjustments “cause” less global warming.

          it’s hard to get excited about a small UHI adjustment to remove the warming effect of economic growth near weather stations.

          It still needs to be done though to ensure that we have not contaminated the temperature trend with either a warming or cooling bias. It turns out that the positive and negative effects of the UHI tend to cancel (mostly), but we would not have known that had it not been analyzed.

          • Richard Greene says:

            The usual bdwax nonsense.

            There were barely any Southern Hemisphere land and sea measurements before 1900. That means there is no global average temperature before 1900, just a wild guess based on an insufficient number of Northern Hemisphere measurements
            https://elonionbloggle.blogspot.com/2021/01/poor-global-coverage-of-land-weather.html

            Before 1920 is a rough guess with sparse Southern Hemisphere coverage.

            The bucket and thermometer sea surface measurements must be at least +/-0.5 degrees C.margin of error — done in different locations, mainly in Northern Hemisphere shipping channels, which is certainly far from sufficient global coverage.

            Interesting how many “adjustments” cool the past, creating a steeper global warming trend.

            The past is most frequently “adjusted” to be less warm than the prior number.
            https://elonionbloggle.blogspot.com/search?updated-max=2021-01-20T18:37:00-05:00&max-results=20&start=20&by-date=false

            The cooling from 1940 to 1975 was “adjusted” warmer to show less cooling than the original official claim of -0.3 to -0.5 C. cooling.
            https://elonionbloggle.blogspot.com/2021/01/there-used-to-be-lot-of-global-cooling.html

            Random error corrections would not have that pattern of USUALLY creating a steeper global warming trend.

            In 1999, NASA said the hottest year in their US records was in the 1930s, not 1998 … but by 2019, they had “cooled” the 1930s with “adjustments” so 1998 had become the hottest year for the US.
            https://elonionbloggle.blogspot.com/2021/01/some-us-climate-data-for-300-million-of.html

            That’s junk science, and YOU love it.

          • bdgwx says:

            There were barely any Southern Hemisphere land and sea measurements before 1900. That means there is no global average temperature before 1900, just a wild guess based on an insufficient number of Northern Hemisphere measurements

            Yeah…it sucks that we didn’t have every sq km instrumented with thermometers the last 100 or even 1000 years. It is the reality we live in. We make the most of what we have. And that’s what scientists are trying to do. The 95% CI for annual and 5yr anomalies around 1900 is 0.08C and 0.06C respectively. If you have a better method of computing the global mean surface temperature then present it to the world so we can all review it. If your uncertainty margins are smaller than what we already have then we’ll start using it. In the meantime we are stuck with the errors above which are still low enough to draw conclusions with high confidence.

            The bucket and thermometer sea surface measurements must be at least +/-0.5 degrees C.margin of error

            I think you’re low balling the error. I bet it’s higher than that…much higher.

            Interesting how many “adjustments” cool the past, creating a steeper global warming trend.

            No. I’m sorry that is a blogosphere myth. I’ll refer you to Karl 2015 figure 2B. Notice that NOAA’s adjusts REDUCE the overall warming trend over the instrumental record. https://tinyurl.com/y4rqdqs8 Dr. Hausfather has a good writeup on all of this. https://tinyurl.com/ya57324g

            The cooling from 1940 to 1975 was “adjusted” warmer to show less cooling than the original official claim of -0.3 to -0.5 C. cooling.

            No. I’m sorry that is not correct either. See above.

            In 1999, NASA said the hottest year in their US records was in the 1930s, not 1998 … but by 2019, they had “cooled” the 1930s with “adjustments” so 1998 had become the hottest year for the US.

            In 1999 NASA was using the unadjusted data provided by GHCN and USHCN. Around 2001 they switched to using the adjusted data. We talked about the adjustments above. They include bias adjustments for station moves, time of observation, instrument changes, etc. They are necessary. So it’s not that NASA “cooled” the past or “warmed” the present. It is that NASA switched to using a more accurate set of observations. You can find more information at the following links.

            https://tinyurl.com/y39kgs8g
            https://tinyurl.com/y57wara9

  64. Swenson says:

    Tim Folkerts reinvents physics.

    He wrote (in relation to the double slit experiment) –

    * Yes. That does relate to adding light in phase. But it is not important for out of phase EM waves. Both in-phase and random-phase waves add — they just have different results because they are different situations. *

    Tim makes unsupported assertions, believing they will be accepted as truth.

    Too long to discuss here. Quantum electrodynamic theory is the most rigorously tested theory of all time. Feynman was of the view that nobody really understands the theory of QED, and it seems that in Tims case, he doesnt have the faintest idea of what QED is all about – even in general.

    Any curious onlooker is invited to investigate the conundrum of the double slit experiment.

    Just dont blame me if your head explodes!

    • Gordon Robertson says:

      swenson…”Any curious onlooker is invited to investigate the conundrum of the double slit experiment.

      Just dont blame me if your head explodes!”

      ***

      If that makes one’s head explode, think of what the single-slit experiment would do. A stream of electrons are fired through the slit onto a target and the same diffraction patterns appear. Something like the sound of one hand clapping.

      No one can explain it. Physicist David Bohm offered the insight that the electrons may have a quantum means of detecting the slit and acting accordingly based on the relationship of each electron to the slit.

      I don’t have the understanding of physics that makes me capable of shining Bohm’s shoes but it has occurred to me that the electric/magnetic fields surrounding the moving electrons somehow interact with electrons/atoms in the walls of the slit, causing the electrons to divert into a geometric pattern on the target surface.

      That would mean the electrons are diverted in regular intervals that produce light and no light onto a surface prepared to react to electron stimulation. Some have argued this as proof of the wave nature of electrons but I think that is bunkum. The electrons have mass and when freed from the atomic orbitals they have no frequency or wavelength hence no ability to form wave-based diffraction patterns.

  65. Gordon Robertson says:

    dremt…”On a second by second basis, the area over which the Earth receives energy from the sun is only half of the area over which energy leaves the surface”.

    Excellent point, I had missed that one. I made a point earlier that solar input is serving to ‘maintain’ the current global temperature and that energy in = energy out is not the whole story.

    We forget that the planet is rotating at a rate conducive to maintaining a temperature conducive to life and that the energy balance is far more complicated than a simple energy in = energy out. It is also located at a convenient distance from the Sun.

    Our atmosphere has its own ability to dissipate heat through significant expansion/contraction between the times the surface is heated by solar radiation and when it is not. Your point adds to the mystery.

    • gbaikie says:

      The idea that Earth will become hotter rather warming/more uniform global temperature is the general idea that warmer night will lead to hotter day.
      I going to call that a land centric view and of course Earth global temperature is solely about ocean surface temperature.

      But it seems coldest the night time air temperature, rather averaging day high and night cold, is more related to global air temperature- that indicating a global temperature. Or if have warmer night air temperature the following day could reach higher temperature, and such higher day time temperature is not related to greenhouse gases- only related in sense greenhouse gases would result in warmer night.
      Or in tropics, lots of greenhouse gases, lots of sunlight, it’s warmer in terms of less difference from night and day temperatures- it lowers less in temperature during the night {that is greenhouse effect}.

      So, we in Ice Age, and reason we in Ice Age is due to warmth of entire Ocean- which is cold, about 3.5 C.
      Or we living in an Ice Age world, and this world changed due to plate tectonic activity which altered the world.
      And in this Ice Age world the changes in ocean temperature have large effect upon global average air temperature, or on the night time and winter time air temperature.
      And night time temperature of air, will effect global water vapor. Or if had higher night time air, globally we would have high water vapor global. And an Ice Age has low water vapor, it’s a drier world.
      If we somehow had ocean which 10 C rather than 3.5 C, changes of 10 C to say 8 C or 12 C, would not have the large effect of changing our current ocean temperature by 1 C.
      Or the ocean about 3.5, if were 2.5 C that have large effect, or if 4.5 C that would large effect upon global air temperatures.
      In our Ice Age world the ocean for millions of years has been lower 2 C and as warm as 5 C.

      My question is does any one doubt that ocean of 2.5 C or 4.5 would NOT have large effect upon global temperatures?

      Or more specifically, upon global night [and winter] air temperature?

    • Bindidon says:

      ” Our atmosphere has its own ability to dissipate heat through significant expansion/contraction between the times the surface is heated by solar radiation and when it is not. ”

      How is it possible to be so dumb and ignorant?

      J.-P. D.

      • Entropic man says:

        Boyle’s Law is only 360 years old. A bit modern for Gordon.

      • gbaikie says:

        Water doesn’t doesn’t become gas, and doesn’t condense into water droplets.
        In weather, high and low pressure regions, means, what?

        How do clouds move?

  66. ren says:

    Ontario, -37 C, with high humidity.
    https://i.ibb.co/zZ6hm9t/Screenshot-2.png

  67. Rob says:

    The sea surface temperature anomaly map shows the cold water in the tropical Pacific beginning to peel away from the coast of the Americas. I suspect we are seeing the beginning of the end of La Nina, although it will probably take a few more months yet.

    • Eben says:

      A number of models are running out off the bottom of the chart by October, so let’s see if your prediction is better than theirs
      https://www.cpc.ncep.noaa.gov/products/CFSv2/imagesInd3/nino34Mon.gif

      • Rob says:

        That is not “a number of models”. It is ONE model run multiple times. Have you never seen an ensemble diagram before?

      • bdgwx says:

        +1 Rob. In addition the CFS has a known cold bias on La Ninas. Remember when it showed -2.5 and lower for December? I give the current -2.0 mean estimate a 10% chance of happening.

        • Rob says:

          bdgwx

          Actually I have not been paying that much attention to all the models.

          However I just looked up the CFS site.
          It makes it clear that these “are not the official NCEP seasonal forecast outlooks. The NCEP seasonal forecast outlooks can be found at CPC website.”
          I looked it up, and their official forecast has the probability of neutral conditions first exceeding the probability of La Nina conditions in Apr-May-Jun 2021, so roughly what my gut is telling me.

          I find it interesting that Eben referred to my comment as a “prediction” when I clearly indicated that it was a merely a suspicion.

          In the end though, I am not particularly invested in whether or not La Nina continues because ENSO is not climate.

  68. Jack Dale says:

    Observed data shows something else.

    The average (mean) annual temperature in Canada increased by 1.7 C from 1948 to 2016, about double the global rate. Warming has been even stronger in the north. The average annual temperature in northern Canada (north of 60 degrees latitude) has risen by 2.3 C over this same period, about triple the global rate.

    https://www.canada.ca/en/environment-climate-change/services/climate-change/canadian-centre-climate-services/basics/trends-projections/changes-temperature.html

    • Bindidon says:

      Jack Dale

      Roy Spencer was speaking about

      Canada is Warming at Only 1/2 the Rate of Climate Model Simulations

      And anyway, who generates temperature charts out of station data all the time knows that Canada is strongly heterogeneous wrt temperatures, much more than CONUS.

      The temperature trends for the Canadian Prairies around the so-called ‘Palliser Triangle’ in Alberta, Saskatchewan and Manitoba are completely different from those in the Northern Territories and Nunavut.

      We have the same situation in Europe, where you hardly could compare for example Norway, Sweden and Finland with UK, France and Germany.

      J.-P. D.

      • Jack Dale says:

        I live in Palliser Triangle.

        Canada is warming faster that the global mean and the Arctic is warming even faster. Just as predicted by Arrhenius.

  69. Bindidon says:

    Greene

    In a comment above, you wrote

    ” The lights seen from satellites tell you nothing about economic growth over the decades. ”

    That is what YOU pretend, of course without presenting here any valuable source; but anyway, I was not per se interested in taking nightlight into account. It was merely a reaction to CO2isLife, who asked for Brightness Index data.

    *
    ” The usual observation is that the urban temperature rises faster than surrounding rural stations over the decades, as the cities and suburbs around them gain population, while the rural area remains rural. ”

    Firstly, while urban and suburban contexts keep going more and more (sub)urban, the rural ones do NOT NECESSARILY remain rural.

    Secondly, I use to name prose like that above with the acronym ‘WISIWYG’, from ‘what I see is what You guess’.

    Because I would bet a bunch of US$ that like many so-called and self-named specialists, you never processed any complex temperature series, and thus can’t do more than to nicely propagate what you have picked up here and there, especially at Gosselin’s SuperTricksZone.

    I never saw any serious temperature series chart from your side on any blog.

    *
    Here is an example of such a temperature series processing:

    https://drive.google.com/file/d/1Ya7uzs8SmIwN_Z_u7udshZoIXaKs7qiX/view

    This chart compares the subset of all 7280 GHCN V3 stations specified as R{ural} with lowest nightlight level (A) – 2269 stations – with those specified as S{uburban} or U{rban}, and having nightlevel B or C – 2227 stations.

    As you can see, the two running means tell us exactly the contrary of what you pretend: the trend difference for 1880-2019 in C / decade is simply laughable:

    – Rural: 0.07 +- 0.002
    – Non rural: 0. 06 +- 0.002

    *
    Furthermore, you write, as if you had observed that by your own:

    ” And even if you could make a decent estimate of the warming effect of economic growth on land surface weather stations, it would not affect the 71 percent of our planet’s surface covered with oceans. ”

    Aha.

    So let’s have a look at a comparison between
    – GHCN V3 (rural vs. {sub}urban)
    – HadSST3

    https://drive.google.com/file/d/1lBBvXjdOpGLxpPGEbEAwJVwI0_nKJNgo/view

    For the entire period, the trends are nearly equal, with
    – HadSST3: 0.06 +- 0.001

    That the difference between SST and land temperatures recently has increased we can see in the same data, with a chart starting in 1979:

    https://drive.google.com/file/d/11-jVpxT5KmNm1euoVb0teYNsMj-S65Dj/view

    Trends for 1979-2019, in C / decade
    – HadSST3: 0.14 +- 0.004
    – GHCN V3 rural: 0.18 +- 0.006
    – GHCN V3 non rural: 0.21 +- 0.007

    That the trend for SSTs is lower than for land, is obvious, and holds even in the lower troposphere (0.12 over oceans, 0.18 over land).

    Here is, to finish the comparison, a chart showing GHCN V3 together wuth UAH6.0 land:

    https://drive.google.com/file/d/1UVky8kHeiLokkAwGjnk9S7S_UW5n5jJG/view

    Thus: even if the oceans are the climate’s driver, their temperature series can be very good compared to those coming out of land temperature measurements.

    *
    One more time, you write

    ” With all the infilling for missing temperature data …

    without having ever produced a proof there would be anything wrong with that infilling.

    What you persistently ignore is that when you don’t perform infilling, the empty cells automatically get the same value as the average over all non empty cells, what of course is absolute nonsense.

    *
    And this claim about the hotter 1930s in the CONUS, endlessly repeated at WUWT by people like you, Tom Abbott and a few others, is completely stupid.

    You all confound absolute TMAX data with TAVG anomalies, whose effect is to make many winter temperature differences appearing higher than differences in summer months.

    Regardless which temperature series you consider (GHCN V3, daily, V4): the topmost absolute temperatures still are all in the 1930s, see e.g. the numer of maxima per station per year in CONUS shown with all USHCN stations present in the GHCN daily data set:

    https://drive.google.com/file/d/1fwl04g1XNZb_axSTOjk2vEmtXGAqj-2p/view

    I’ll come back with more detail concerning this nonsensical claim.

    *
    One is for sure: you named me a while ago an armchair ‘scientist’; this ‘compliment’ you merit 1000 times more than I.

    And if there is one person specialized in JUNK science, than that’s you with your ‘elonion’ blog, which does much more in pro-fuel politics than in real science.

    J.-P. D.

  70. Gordon Robertson says:

    binny…”” Our atmosphere has its own ability to dissipate heat through significant expansion/contraction between the times the surface is heated by solar radiation and when it is not. ”

    How is it possible to be so dumb and ignorant?”

    ***

    As usual, the dumbness and ignorance is yours.

    Anyone having studied physics and/or chemistry is familiar with the Ideal Gas Law, PV = nRT. If air heated via conduction at the surface, rises, it loses pressure hence temperature as it rises.

    That’s the simplest of physics/chemistry yet you fail to understand it. There’s no need to radiate it to space at a high rate, the heat simply disappears as the pressure decreases.

    That’s because heat IS the kinetic energy of air molecules. As pressure reduces, the distance between air molecules increases, and the kinetic energy of the gas, hence the heat, decreases.

    I am not implying that nothing is radiated to space, I am claiming the theory of energy in = energy out is far to simplistic. If all of the energy input by the Sun was radiated immediately back to space, Earth could not maintain its +15C average.

    It maintains that average because over the millennia, solar energy has warmed the Earth’s surface and oceans proportionately to its input. However, the Sun only inputs energy part of the day to one part of the surface, its peak input being at noon at any part of the planet. For the rest of the day, the planet cools, and much of that cooling is via internal heat dissipation.

    We have reached a stasis where solar energy is only enough to maintain the 15C. If the energy was lost as fast as it comes in, the planet could not maintain that 15C. It is because the atmosphere and oceans can retain heat that we have the 15C average.

    I am wasting my breath on you, this is for people reading this who can think. You still think lunar libration and rotation are one and the same.

    • Bindidon says:

      Robertson the cheating SOB

      ” I am claiming the theory of energy in = energy out is far to simplistic. ”

      Here you show the incredible level of your ignorance.

      You would never be able to setup any theory contradicting Ein = Eout.

      For people like you, to contradict without proof is sufficient.

      That is the reason why you think it’s enough to claim lunar spin can’t exist – based on an trivial, dumb coin example.

      Even Newton has clearly stated that the Moon rotates about its internal axis, but you simply deny that.

      Let alone would you be able to reproduce Tobias Mayer’s genial work: you prefer to deny it, and to stay on discrediting and denigrating people doing science.

      The level of your pretentious stupidity and ignorance you show yourself with

      ” You still think lunar libration and rotation are one and the same. ”

      No, you dumb cheater! I don’t ‘think’ they are one and the same.

      Unlike you, I am not a Contrarian denying everything like Moon’s spin, viruses, energy balance, time dilation, relativity, and many other things.

      I read (sometimes long) documents instead (instead of picking a couple of lines out of them, like you always do), and understand these documents.

      And this is the reason why I wrote that the three different kinds of optical libration are a consequence of
      – Moon’s axis inclination wrt the Ecliptic
      – Moon’s synchronous rotation
      and
      – Moon’s orbiting.

      You are this blog’s very shame.

      J.-P. D.

      • Clint R says:

        JD, you’re still confused about Moon. Newton proved what pure orbital motion looked like. The simple model is a ball on a string. The same side of the ball always faces the inside of the orbit. That’s the motion we see with Moon.

        If the ball were also rotating about its axis, the string would wrap around it. If Moon were also rotating about its axis, we should see all sides of it from Earth.

        It’s possible all of the different translations are confusing you.

      • Nate says:

        “Newton proved what pure orbital motion looked like.”

        Of course!

        ” The simple model is a ball on a string.”

        No, just stop lying about Newton, POS troll.

        • Bindidon says:

          Nate

          Don’t care about ClintR’s permanent ankle biting.

          He intentionally ignores what Newton wrote in the 1726 edition of his Principia Scientifica (Book III, Prop. XVII, Theor. XV) about Moon’s spin.

          And when he writes:

          ” Its possible all of the different translations are confusing you. ”

          I really get a big laugh about such arrogance.

          J.-P. D.

          • Clint R says:

            JD, again you are having trouble with the translation. In the quotes you provided, Newton was clearly talking about libration. When he mentioned lunar rotation, it was in relation to the stars.

          • Bindidon says:

            ClintR

            1. ” In the quotes you provided, Newton was clearly talking about libration. ”

            Wrong, as usual. This is a simple lie, and you know that.

            A look at the source shows the evidence:

            https://tinyurl.com/ycokq9ys

            Planetarum motus diurnos uniformes esse, et Librationem Lunae ex ipsius motu diurno oriri.

            Translation:

            The planets’ daily movements are uniform, and Moon’s libration arises from its daily movement.

            And what he means with ‘daily movement’ clearly has to be understood as ‘rotation about an own axis’:

            Jupiter utique respectu fixarum revolvitur horis 9. 56', Mars horis 24. 39'. Venus horis 23. circiter, Terra horis 23. 56', Sol diebus 251, et Luna diebus 27. 7. hor. 43'.

            *
            Simply because when Newton mentions Earth, he writes : Terra horis 23. 56', what certainly does not mean the time period of its orbit around the Sun.

            Thus, with ” et Luna diebus 27. 7. hor. 43' “, he can’t suddenly mean Moon’s orbit around Earth.

            Right?

            In the footnote, he writes:

            Quoniam enim Luna circà axem suum uniformiter revolvit eodem tempore quo circà Tellurem periodum suam absolvit…

            Translation:

            For the Moon uniformly revolves around its axis in the same time as it orbits around Earth…

            *
            I know, ClintR: you will never accept you are wrong.

            ***

            2. ” When he mentioned lunar rotation, it was in relation to the stars. ”

            And that is the same nonsense as that endlessly written in 2019 by… JD*Huffman.

            *
            No astronomer describes movements ‘in relation to the stars’.

            Astronomers measure the exact duration of movements ‘in relation to the stars’.

            Simply because when you measure the duration of a movement in relation to an object being itself in movement, you inevitably will obtain an erroneous result.

            As opposed to the ignorants ClintR and JD*Huffman, Newton has perfectly understood the problem.

            He wrote that with respect to Earth, the spots on the Sun rotate in 27 1/2 days, but they do that in 25 1/2 days with respect to the fixed stars.

            *
            And here too, ClintR, you will never accept you are wrong.

            You will repeat your nonsense all the time, exactly as does your denial friend Robertson.

            No one – excepted some people like you and Robertson – knows why you both do that…

            Maybe it is due to the fact that you like to discredit and denigrate the work of others.

            Feel free to do!

            J.-P. D.

          • Clint R says:

            JD, besides the translations, you’re also being confused by the different objects. Jupiter, Earth, and Moon are all different and have different motions. Just stick with Moon. That is the issue under discussion.

            Newton did all of the “heavy lifting”. It’s because of him we know pure orbital motion always keeps one side facing the center of the orbit. It’s really not that hard to understand.

            “Libration” also can confuse you. Remember that libration is not a real motion. It’s is caused by our changing observation from Earth.

          • Bindidon says:

            ClintR

            1. ” Jupiter, Earth, and Moon are all different and have different motions. ”

            Last reply: your stubborn denialism gets again a bit too boring.

            *
            Planetarum motus diurnos uniformes esse, et Librationem Lunae ex ipsius motu diurno oriri.

            Translation:

            The planets’ daily movements are uniform, and Moon’s libration arises from its daily movement.

            ***

            2. ” ‘Libration’ also can confuse you. Remember that libration is not a real motion. ”

            This, ClintR, is valid only for the three optical form of Moon’s libration (latitude, longitude, diurnal).

            What you manifestly don’t know anything about, is the existence of physical librations of the Moon… which were discovered by Lagrange in the 18th century, and confirmed by the Russian astronomer Habibullin in the 1960s.

            Yeah.

            Now I quit this discussion, you are too stubborn. I hope that at least a few commenters on this blog understand that.

            J.-P. D.

          • Clint R says:

            JD, the more you fight reality, the more you get wrapped up.

            If someone can see actual “physical libration” then we could see full rotation of Moon. You just can’t beat reality.

            We know what pure orbital motion is, and that is the motion of Moon. You’re all wrapped up in your web of nonsense.

            That’s why this is so much fun.

          • Bindidon says:

            ” If someone can see actual ‘physical libration’ then we could see full rotation of Moon. ”

            Physical librations are so tiny that you need, to detect them,
            either
            – data from Lunar Laser Ranging (what you would discredit anyway as ‘pseudoscience’)
            or
            – a powerful telescope together with much, much patience.

            I know you will discredit this as well, but I nonetheless recommend you to read for example:

            History of development of selenodesy and dynamics of the Moon in Kazan

            Rizvanov N.G. and Rakhimov L.I.
            Engelhardt Astronomical Observatory, Kazan, Russia

            http://selena.sai.msu.ru/Symposium/kazan.pdf

            Look for all occurrences of the keyword ‘LPhL’ in the document.

            *
            ” We know what pure orbital motion is, and that is the motion of Moon. ”

            Then… all is well in your nice world, everything is perfect, ClintR.

            J.-P. D.

          • Clint R says:

            That link is another good example of your problem with translations.

            You need to learn to benefit from the “KISS” principle — Keep it simple, stupid”.

            That’s why the ball-on-a-string analogy is so useful. Anyone can understand it. Newton made it simple for us. In pure orbital motion, the orbiting body always keeps one side facing the center of its orbit.

      • Gordon Robertson says:

        binny…”You would never be able to setup any theory contradicting Ein = Eout”.

        Your thinking is too myopic. You are thinking only of radiative energy in = radiative energy out.

        In electronics, there are devices called oscilators. They work by connecting a capacitor and an inductor in parallel, a circuit called a tank. If you give the capacitor a shot of current, it will charge up till the input energy is stopped or it becomes full. Then it will discharge into the inductor.

        When the capacitor energy is depleted, the inductor will have a magnetic field around it which will collapse when the driver current is depleted, then the field will collapse and recharge the capacitor. The back and forth exchange of energy between these devices is called oscillation.

        With no circuit resistance, the oscillation will carry on indefinitely. The reality is that circuit resistance does exist and dissipates the oscillation energy through heat loss. So the tank is connected to the input of an amplifier which feeds back a shot of energy every cycle to the tank circuit, keeping the oscillation going.

        That’s how I think of the relationship between solar energy and the Earth works. The Earth is a self-contained type of oscillation between the surface, oceans, and the atmosphere. Every 24 hours, the Sun gives it a shot of energy at whatever locale faces it.

        Sure, the Earth loses energy to space via radiation, but most of the heat is contained within the surface/ocean/atmosphere interaction which heats and cools over time receiving a shot of energy from the Sun to keep it at +15C average global temperature.

        You are under the mistaken impression that the Sun/Earth system is a pure energy in = energy out situation and that’s not the case. The Earth’s atmosphere, surface, and oceans retain heat with the atmosphere serving as an insulator to keep the heat in.

        Mind you, that varies over the year as solar input varies and either Pole goes through considerable cooling. If all of the energy at the surface was immediately radiated back to space, the Earth would be a frozen mass.

        • Bindidon says:

          Robertson

          Your comment contains as usual lots of redundant garbage, with one little exception at its very end:

          ” If all of the energy at the surface was immediately radiated back to space, the Earth would be a frozen mass. ”

          This is the first time you write something really intelligent.

          You seem to begin to understand what happens when Earth’s atmosphere loses all of its water vapor because the planet becomes so cold that the water vapor completely precipitates.

          And then… there is only this poor little CO2 guy – whose concentration, during glacial periods, diminishes as well.

          As neither N2 nor O2 let alone Ar intercept IR, our Earth indeed becomes a frozen mass, for long a while.

          But I know, Robertson: such things you are, as a professional denialist, not even allowed to think about!

          J.-P. D.

  71. E. Swanson says:

    Getting back to the subject of Dr. Spencer’s post, I looked at CRUTEM5 data for Canada from the KNMI Climate Explorer, which Spencer used.

    Not having used the KNMI data before, I input the ranges of Lat 51N to 70N and Lon -130 to -60 with an averaging period of 1980 thru 2010 using the default lower limit of 30% valid, then limited the output to 1991 thru 2020 and calculated the yearly average time series. The result was a trend of 0.22 C/decade, which is close to Spencer’s.

    Next, I extended the date range, adding 1990 to the beginning. The resulting trend was 0.28 C/decade. In both cases, I did not select a lower limit of valid points when I calculated the yearly average from the monthly data set, instead using the KNMI default option, which was null.

    Third, I repeated the second case, except that I specified a 80% minimum cutoff initially and no limit when calculating the KNMI average. The result was a trend of 0.36 C/decade!!

    Fourth, I repeated the calculations with an 80% minimum intial cutoff and used an 80% cutoff for the averag calculation. The result was that 1994, 2019 and 2020 were excluded, so I didn’t attempt to calculate a trend!!

    Fifth, repeating the last calculations using an initial cutoff of 75% and a second cutoff of 75% for averaging, 2019 and 2020 were still excluded and the resulting trend was 0.36 C/decade.

    Lastly, I noted that the CRUTEM5 data is based on a 5×5 degree grid. Thus, specifying an initial latitude limits of 51-70 degrees would actually result in a 50-70 range. Out of curiosity, I repeated the previous calculation using a lat range of 55-70 degrees, which would eliminate most of the “heat island” locations. The years 2019 and 2020 excluded and the resulting trend was 0.42 C/ decade, which is close to the model average in Dr. Spencer’s presentation.

    It would appear from this exercise that the data for Canada includes many missing data points, thus one would not rely on these data for an accurate calculation of the trend.

  72. Frank says:

    Thanks Mr Spencer.
    Move the USA border 100 miles north and you would encompass 90% of the population of Canada. The true US weather data includes us as well.
    Kind regards

  73. MEGASLOTGAME says:

    ทดสอบความเร็วอินเตอร์ ของการเล่นเกม mega game ยินดีต้อนรับสมชิกเก่าแล้วก็สมาชิกใหม่ ทุกๆท่าน ไปสู่โลกที่การพนัน แม้เอ่ยถึงคาสิโนออนไลน์ คงจะไม่มีผู้ใดไม่เคยทราบ megaslotgameเมก้าเกม เกมสล็อต

Leave a Reply