The Version 6.0 global average lower tropospheric temperature (LT) anomaly for June, 2021 was -0.01 deg. C, down from the May, 2021 value of +0.08 deg. C.
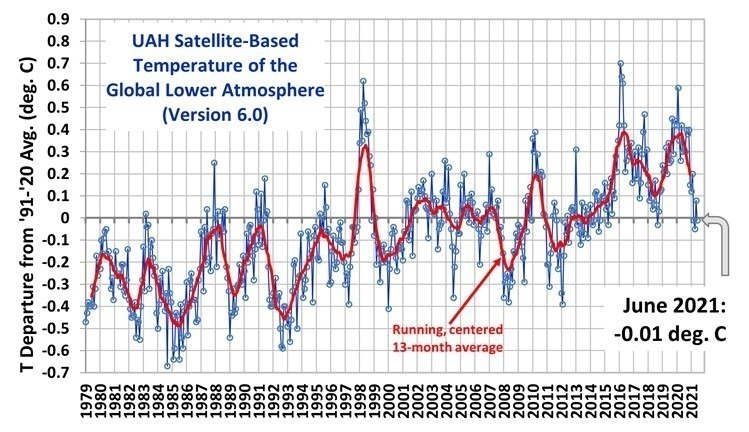
REMINDER: We have changed the 30-year averaging period from which we compute anomalies to 1991-2020, from the old period 1981-2010. This change does not affect the temperature trends.
The linear warming trend since January, 1979 remains at +0.14 C/decade (+0.12 C/decade over the global-averaged oceans, and +0.18 C/decade over global-averaged land).
Various regional LT departures from the 30-year (1991-2020) average for the last 18 months are:
YEAR MO GLOBE NHEM. SHEM. TROPIC USA48 ARCTIC AUST
2020 01 0.42 0.44 0.40 0.52 0.57 -0.22 0.41
2020 02 0.59 0.74 0.45 0.63 0.17 -0.27 0.20
2020 03 0.35 0.42 0.27 0.53 0.81 -0.96 -0.04
2020 04 0.26 0.26 0.25 0.35 -0.70 0.63 0.78
2020 05 0.42 0.43 0.41 0.53 0.07 0.83 -0.20
2020 06 0.30 0.29 0.30 0.31 0.26 0.54 0.97
2020 07 0.31 0.31 0.31 0.28 0.44 0.27 0.26
2020 08 0.30 0.34 0.26 0.45 0.35 0.30 0.24
2020 09 0.40 0.41 0.39 0.29 0.69 0.24 0.64
2020 10 0.38 0.53 0.22 0.24 0.86 0.95 -0.01
2020 11 0.40 0.52 0.27 0.17 1.45 1.09 1.28
2020 12 0.15 0.08 0.22 -0.07 0.29 0.44 0.13
2021 01 0.12 0.34 -0.09 -0.08 0.36 0.49 -0.52
2021 02 0.20 0.32 0.08 -0.14 -0.65 0.07 -0.27
2021 03 -0.01 0.13 -0.14 -0.29 0.59 -0.78 -0.79
2021 04 -0.05 0.05 -0.15 -0.28 -0.02 0.02 0.29
2021 05 0.08 0.14 0.03 0.06 -0.41 -0.04 0.02
2021 06 -0.01 0.30 -0.32 -0.14 1.44 +0.63 -0.76
Despite the near-normal global average temperatures, the USA Lower 48 temperature anomaly of +1.44 deg. C was the warmest in the 43 year satellite record, ahead of +1.15 deg. C in 1988. In contrast, the Antarctic region (poleward of 60 S latitude) experienced its 2nd coldest June (-1.25 deg. C below the 30-year baseline), behind -1.34 deg. C in June, 2017.
The full UAH Global Temperature Report, along with the LT global gridpoint anomaly image for June, 2021 should be available within the next few days here.
The global and regional monthly anomalies for the various atmospheric layers we monitor should be available in the next few days at the following locations:
Lower Troposphere: http://vortex.nsstc.uah.edu/data/msu/v6.0/tlt/uahncdc_lt_6.0.txt
Mid-Troposphere: http://vortex.nsstc.uah.edu/data/msu/v6.0/tmt/uahncdc_mt_6.0.txt
Tropopause: http://vortex.nsstc.uah.edu/data/msu/v6.0/ttp/uahncdc_tp_6.0.txt
Lower Stratosphere: http://vortex.nsstc.uah.edu/data/msu/v6.0/tls/uahncdc_ls_6.0.txt
Possibility for deep La Nina this fall.
https://www.cpc.ncep.noaa.gov/products/CFSv2/imagesInd3/nino34Mon.gif
How low will temp go next summer?
You are reading it wrong , according to Alarmistas we are accelerating into ElNino, they have “trends” to prove it.
https://i.postimg.cc/ZRxJ4SsR/w2nino34-Mon.gif
I forgot the reference link
http://www.drroyspencer.com/2021/06/uah-global-temperature-update-for-may-2021-0-08-deg-c/#comment-718935
From the standpoint of the pseudo-debate on AGW, it hardly matters whether the remainder of the year is la nina, el nino , or neutral. In a decadal scale, the temp keeps going up. If next year is a solid el nino, it will probably be a new record. If the remainder of this year goes super la nina, it will still be warmer that every year prior to 2000. (Talking surface temps here, but probably RSS TLT too. UAH is an outlier.)
robert…”If next year is a solid el nino, it will probably be a new record. If the remainder of this year goes super la nina, it will still be warmer that every year prior to 2000″.
I guess you have not been informed that the years between 1979 – 1997 were forced low due to volcanic aerosols. Therefore the warming during the error was far less than the UAH graph reveals. I think UAH calculated it at 0.09C/decade.
Let’s not forget the 18 year flat trend following the 1998 El Nino.
Natural variability.
This what you all should be watching…
https://psl.noaa.gov/enso/mei/
From iowa… la nina cycles
The 1998 cycle, I carried a long pipe in the back of my truck to bang on the wheel hubs of my truck when my break liners froze, -20
The 2017 cycle, two continuous nights at -30. I no longer consider iowa a zone 5 growing season…
The 2021 cycle, 2 weeks at -20 continuous, along with the texas fiasco.
The La nia cycle is warming the deep ocean(pulling up cold water), El nino the oppisite
“I guess you have not been informed that the years between 1979 1997 were forced low due to volcanic aerosols.”
Gordon, that is pretty fascinating. Is there any evidence that El Ninos and Hurricanes can and do actually remove aerosols from the atmosphere, cleaning the sky, and allowing more incoming radiation to reach the oceans?
My bet is that this is just another exogenous factor that climate models fail to address that unsettle this settled science.
Robert Ingersol,
You might not realise how insulting your outlier comment is. You should consider making an apology to the UAH team.
Outlier has specific meaning in statistics. It is a measure that a value or values depart from the best value by more than a specified amount.
In this case, the science is relatively young and there is not yet an established best value.
Rather, we have many teams working in global temperature research, still at the stage of making public corrections to earlier estimates of best value.
In an ideal scientific world, these might have come together by now. In the non-ideal world some have lost scientific rigour and are adjusting for ideology rather than for hard science. It is not now possible to claim an outlier because there is no best value to compare, only many adjustments claiming to be best. Time wounds all heels. Geoff S
“In this case, the science is relatively young and there is not yet an established best value.”
Geoff, didn’t you get the memo? This is settled science. This is the only science in the history of science that is actually settled, but it is settled.
“In the non-ideal world some have lost scientific rigour and are adjusting for ideology rather than for hard science.”
Perhaps you should apologize, Geoff, to the team(s) you are accusing of scientific misconduct without a shred of evidence.
Mr. Ingersol
All global average temperature calculations were made with data collected DURING a warming trend. That makes the ‘hottest year on record’ claims almost meaningless.
It is EXPECTED to have frequent “hottest years on record” as that warming trend continues.
Hottest year on record is not news — it is merely stating the obvious — a rising trend.
A rising trend that has been in progress for about 325 years, starting long before man made CO2 emissions could have had an effect.
Someday the rising global average temperature trend will end, as all prior rising trends have, and we will stop hearing “hottest year on record” announcements.
You must also remember that the global average temperature data are a very short record.
I would say with decent accuracy only since 1979.
Others would pick 1950 as the stating point for decent accuracy.
Prior to 1950, global coverage was unacceptable for a decent global temperature average.
Prior to 1920, there was far too little Southern Hemisphere coverage.
Prior to 1900, almost no Southern hemisphere coverage.
This adds up to 42 years of decent global average temperature compilations, since 1979, out of 4.5 billion years of earth’s history.
That’s a tiny portion of climate history.
Also there is no way to determine what global average temperature is average, or normal.
I can imagine that almost evermore moderate climate we have today.
In fact, today’s climate is the best climate for humans, animals and plants in 325 years.
We should be celebrating our wonderful climate, happy that we are living in a mild, harmless warming trend, during an inter-glacial period.
Your comment appears to be a focus on the leaves of a tree (one year) while I have described the whole forest (climate history).
They don’t need actual facts. Just scream warmest on record and then hold their hand out for the carbon tax trillions.
Well said… always hard to disagree with objective logic.
It is mostly fact and logic based up until this:
“In fact, today’s climate is the best climate for humans, animals and plants in 325 years.”
This is no longer fact-based. It is pure opinion.
It can’t be neither proven nor falsified.
Arrrgh.
It can neither be proven nor falsified.
You had it correct the first time Nate. The evidence is everywhere and overwhelming.
“In a decadal scale, the temp keeps going up”
and good thing too, had it been going down at the same rate we’d see far more (justifiable) panic
“If the remainder of this year goes super la nina, it will still be warmer that every year prior to 2000”
no, a little cooling would make 2021 colder than 1988
over thirty years of exponentially increasing CO2 emissions ago
just not compatible with scenarios of ECS>2
physics doesn’t care about your politics
For current and past temps in the oceans see
https://coralreefwatch.noaa.gov/data/5km/v3.1/current/daily/gif/cur_coraltemp5km_ssta_large.gif
and
https://coralreefwatch.noaa.gov/data/5km/v3.1/current/animation/gif/ssta_animation_30day_large.gif
rlh…”For current and past temps in the oceans see”
NOAA is the last place you should look for the SST. They retroactively fudged it to get rid of the flat trend from 1998 – 2012 admitted by the IPCC.
Just look at the maps
https://www.climate.gov/sites/default/files/NMME_plume_graph_202105_large.png
Hahaha. Eben just called Clint an alarmist.
“Possibility for deep La Nina this fall.”
-Well, despite what troubles this may cause in parts of the world i.e. U.S. west coast drought – The ensuing cooling in the global temperature is certainly needed to prove a point.
May the La Ninas continue!
As least until next year – or so it seems.
I didn’t know if Dr. Spencer would post any new posts on july 4th or 5th, so I decided to go ahead and write and advanced congratulation:
Happy Aphelion Day, everyone!
If we compare the 2021 to the start of the 21st century we see little warming. Both years are coming out of La Nina. Here’s the last 4 months.
2001 -0.01 C
2021 0.00 C
The same period values for SST shows a little warming.
2001 0.34 C
2021 0.47 C
How will we ever survive?
Now we will get to see all the alarmists using trends so they can take advantage of the recent El Nino events to claim more warming. The fact is, the changes when looking at similar circumstances are minor.
Youve got it backwards.
Now we will get to see all the deniers using trends so they can take advantage of the recent La Nina events to claim more cooling.
There are many examples in the record after 2000 with spikes down to -0.4 C or up to 0.6.
Its quite silly to look at spikes that persist for at most a couple of months, as meaningful to climate change.
Nate, due to the high level of noise in global temperature data, the goal is to find times with consistent natural conditions. Then we can compare apples to apples.
What I showed is very little warming has occurred in the past two decades. Did it warm? Yes, it appears it has warmed slightly. However, all of that could be due to the AMO. There is no convincing evidence for any dangerous warming driven by human emissions.
Trying to find an earlier year with sufficiently similar conditions is fraught with difficulty. Compare decadal means (or 11-year if you want to negate the solar cycle.) Temp keeps going up.
Just like one would expect temperatures to do coming out of the Little Ice Age, one of the Holocenes coldest periods. Exactly on cue.
So, a spike that persists for several months is very meaningful?
A spike that persists for several months is very meaningful?
“What I showed is very little warming has occurred in the past two decades.”
You didn’t show that.
Proper way is to
1. do a fit to all data over >20 y.
or
2. Remove the portion attributable to ENSO, and fit. I can show you that.
Nate, you appear to think only ENSO affects the global temperature. Nope, there is also an ongoing effect from the AMO (as well as PDO effects). It jumps out at you in this graphic.
https://woodfortrees.org/plot/hadsst3nh/from:1997/to/plot/hadsst3sh/from:1997/to/plot/hadsst3sh/from:1997.5/to:2015/trend/plot/none
This is why I mentioned the AMO in my comment.
Then you admit your “goal is to find times with consistent natural conditions” is unlikely to be achieved.
This is why we look at all of the data over a long-enough period.
“It jumps out at you in this graphic.”
Step back and look at bigger picture:
https://tinyurl.com/2e3raakk
Nate: So how long, if at all, do you consider the UAH temps will be below the now 0c line?
I think the red line (13 mo av) unlikely to go below 0.
Unless we get another Pinatubo.
nate retreats to ”regional” anomalies.
RLH, how much do you expect the Gaussian 15 y LP filtered UAH to be impacted by this months drop?
Or this years La Nina?
“I think the red line (13 mo av) unlikely to go below 0”
I rather suspect you may be wrong. Especially if the forecasts are correct and it turns into a full blown La Nina by the end of the year.
“how much do you expect the Gaussian 15 y LP filtered UAH to be impacted”
It is more the trajectory that matters, rather than anything else. Big things like the Earth’s climate tend to take a while to turn direction.
https://www.climate.gov/sites/default/files/NMME_plume_graph_202105_large.png
“Big things like the Earths climate tend to take a while to turn direction.”
Indeed. One month or one La Nina won’t do it.
https://www.climate.gov/sites/default/files/NMME_plume_graph_202105_large.png0
https://www.cpc.ncep.noaa.gov/products/CFSv2/imagesInd3/nino34Mon.gif
I think you will find that it is going to be more than just a few months.
I’ll try that again
https://www.climate.gov/sites/default/files/NMME_plume_graph_202105_large.png
So we had a weak La Nina in 2018. Then what? A weak El Nino in 2019, and we were back to the same temp or higher temps.
ENSO’s effect will always be small and oscillatory, so unless you are expecting an unprecedented 15 y of exclusively La Ninas…a reversal of the warming trend in LP-15y running mean seems rather unlikely.
“A weak El Nino in 2019, and we were back to the same temp or higher temps.”
A weak (or strong) La Nina in the later half of 2021 does not make it likely that global temperatures will climb during the rest of this year.
OMG..
So you agree then? Little chance of higher temps this year.
Ur a professional point misser..
So little chance of higher temps this year then.
“The CFS.v2 ensemble mean (black dashed line) predicts ENSO-neutral followed by weak La Nia conditions during late fall and winter 2021-22”
After a record breaking heatwave here in New England last week, we are now having a cool patch with temps well below normal. All ACs turned off.
Of course nobody is canceling their beach going plans for July and August. No one is lamenting summer is over. We all get that this is simply the vagaries of weather (and personally I like it).
Skeptics of AGW can get all excited if they want about the possibility of another middling La Nina in the works, and the resulting slight cooling of the Globe.
But of course, the temps over the last 5 y have remained almost exclusively ABOVE the linear warming trendline of the last several decades. If that trend continues it upward march, as models predict, then that still means temps MIST spend ~ 50% of the time BELOW the trendline…
The fact that temps this year are now finally below the trendline, and the prospect of more next year, doesnt bother me or climate science one bit, since it is par for the course for ENSO.
So you are saying that there is little chance of higher temps this year then.
Non sequitur..
But anomalies should rise this year…in response to rise from La Nina to neutral.
That rather depends on how many La Nina or Neutrals there are in the reference period.
Not really.
We can see what happened as a result of the similar rise nino3.4 in early to mid 2018. A global temp rise a few months later of ~ 0.2C
Care to answer if the reference period for the anomalies has more La Nina or El Nino in it?
Without that knowledge predicting anomalies is suspect.
“Care to answer if the reference period for the anomalies has more La Nina or El Nino in it?”
Tell me how much difference you think it makes.
Did you not prefer tree rings over rainfall records for the PDO? Shall I update you?
Of course biasing your reference period for anomalies by including more of La Nina or El Nino will make a difference. Not much true, but it will matter.
Still not got over the fact that ALL prediction sources say lower than the centerline of 0 for the rest of the year and going into a La Nina for the end of the year have you?
“Did you not prefer tree rings over rainfall records for the PDO? Shall I update you?”
Pls do.
“Of course biasing your reference period for anomalies by including more of La Nina or El Nino will make a difference.”
Did you figure out how much?
“Not much true, but it will matter.”
Unless you calculate it, you cannot know if it matters significantly or negligibly.
As it turns out, negligibly.
Macdonald
https://climatedatablog.files.wordpress.com/2021/07/macdonald2005.jpeg
Darrigo 2006
https://climatedatablog.files.wordpress.com/2021/07/darrigo2006.jpeg
Darrigo 2001
https://climatedatablog.files.wordpress.com/2021/07/darrigo2001.jpeg
Biondi
https://climatedatablog.files.wordpress.com/2021/07/biondi.jpeg
Take you choice as to which best represents the PDO.
Thanks.
Any of those or Shen..who knows?
How do you decide?
Well as none of the tree rings even agree with each other it is difficult to chose any of those above the rainfall records from China.
“Shifts in the preinstrumental period show varying correspondence with those of a North American-based tree-ring reconstruction of the North Pacific index (NPI), another indicator of Pacific decadal climate variability. Differences between these two time series hint at modulation of local climate from Asian monsoon, El Nio-Southern Oscillation (ENSO) and volcanic forcing”
From Darrigo 2006.
Darrigo 2014 from Japan different.
All suggesting local effects dominate.
“to chose any of those above the rainfall records from China.”
Bias much??
Tree rings ARE rainfall records…
“All suggesting local effects dominate.”
Agreed.
“Tree rings ARE rainfall records”
Local rainfall records.
Shen is regional, not local.
“In this present study, 28 regions with complete or relatively complete (very few gaps, which were filled using the index from their nearest regions) time series and strong PDO signals are selected from 58 available regions in eastern China (2240N, 110122E)”
“These regions located at the two ends of the PDO-related summer rainfall dipole (Figure 1) are expected to produce a robust reconstruction of the PDO. The 1925 to 1998 annual PDO index (http://jisao.washington.edu/pdo/PDO. latest) was used for calibration and verification.”
MacDonald uses similar approach, two regions along dipole.
Do you honestly think that you can pick winners and losers among PDO data?
“Hydrologically sensitive tree-ring chronologies from Pinus flexilis in California and Alberta were used to produce an AD 9931996 reconstruction of the Pacific Decadal Oscillation (PDO) and to assess long-term variability in the PDOs strength and periodicity. The reconstruction indicates that a ~50 to 70 year periodicity in the PDO is typical for the past 200 years but, was only intermittently a strong mode of variability prior to that. Between AD 1600 and 1800 there is a general absence of significant variability within the 50 to 100 year frequency range. Significant variability within in the frequency range of 50 to 100 years reemerges between AD 1500 and 1300 and AD 1200 to 1000. A prolonged period of strongly negative PDO values between AD 993 and 1300 is contemporaneous with a severe medieval megadrought that is apparent in many proxy hydrologic records for the western United States and Canada.”
I would have thought that changing modes around 1800 (the low point in temps worldwide, aka The Little Ice Age) was a reasonable occurrence.
So we have mode 1, 1400 to 1800. Mode 2 1800 onwards. Sounds OK to me.
Visible in Shen et al too.
“In the context of climate variability and resources
planning the reconstruction of the PDO possesses two
particularly important features. First, the reconstruction
provides evidence for the persistence of a strongly negative
PDO state, suggesting a cool northeastern Pacific, during
the medieval period ( AD 900 to 1300). This prolonged
episode of negative PDO values corresponds to a period of
severe and prolonged dry conditions evident throughout
western and central North America [Cook et al., 2004].
There is also additional evidence for cooler northeastern
Pacific SSTs, higher rates of upwelling and increased
marine productivity along coast during this general time
period.”
PDO does not correlate with MWP. PDO does not correspond to global temperature in this analysis.
The time period between 1400 (ish) and 1800 (ish) show one periodicity. The time period after 1800 (ish) shows a different periodicity.
I think you even observed that yourself.
Keep in mind that people seek and like to find patterns, sheep in clouds, faces on the Moon, cycles in random noise.
Meanwhile Barry’s very good point seems to have been dodged.
PDO seems not to be a coherent Pacific-wide mode. It seem not to be a big influence on low-frequency global temperature variation.
“Keep in mind that people seek and like to find patterns, sheep in clouds, faces on the Moon, cycles in random noise.”
The data produces what you see. Not me. If you see patterns then the data says they are there.
“Meanwhile Barrys very good point seems to have been dodged.”
Barry does not address the suggestion that there are 2 different periodicity seen in the data. Prior to 1800 and after. Which you also noted.
“PDO seems not to be a coherent Pacific-wide mode. It seem not to be a big influence on low-frequency global temperature variation.”
It seems to be Pacific wide currently. Why would the past be different?
“If you see patterns then the data says they are there.”
If you see a man on the Moon, then he is there???
I don’t see any of the patterns you claim to see.
“Barry does not address the suggestion that there are 2 different periodicity seen in the data.”
It seems you think only points that you have made deserve attention?All others can be safely ignored?
He makes a point about the PDO being inconsequential to Global Temps. That would seem to make the rest of the discussion moot.
“It seems to be Pacific wide currently. Why would the past be
different?”
You tell me.
“He makes a point about the PDO being inconsequential to Global Temps. That would seem to make the rest of the discussion moot.”
So the ENSO changes global temperatures but the PDO doesn’t. Got it.
“on low-frequency global temperature variation.”
PDO and ENSO both influence high frequency variation, probably because ENSO is part of PDO.
I quoted the same paper that RLH quoted (but didn’t link to). The MWP and prolonged negative PDO are anti-correlated.
RLH: “Barry does not address the suggestion that there are 2 different periodicity seen in the data.”
Is that consequential when…
RLH: “Why would the past be different?”
“PDO and ENSO both influence high frequency variation, probably because ENSO is part of PDO.”
I wouldn’t call >30 year behavior high frequency.
“Barry does not address the suggestion that there are 2 different periodicity seen in the data.”
Barry still fails to address this point.
The negative PDO is anticorrelated with the MWP according to the paper you cited. Therefore, PDO doesn’t influence global temps.
If you are responding to this point with “2 different periodicities,” you’ll have to be clearer. Otherwise I think you are trying to change the subject.
“>30 year behavior high frequency.:
Hasn’t been demonstrated.
Do you not understand that to demonstrate correlation requires multiple coincident features?
The MWP lasted some 200+ years. There will have been at least 1 if not 2 PDO cycles in that period.
Do you understand that it is very unlikely that simple period matching is unlikely to occur, especially if we are talking before the 1800s.
Do you understand that it is very unlikely that simple period matching is going to occur, especially if we are talking before the 1800s.
So no correlation means correlation to you?
Noting a different periodicity does not respond to the finding that MWP and PDO are anti-correlated. It’s a different topic.
On a geospatial feature of the PDO you said, “Why would the past be different?”
Now you seem to be implying that the past could be quite different regarding PDO ifluence on global temps.
Your argumentation is opportunistic.
“So no correlation means correlation to you?”
I would not expect a simple correlation to hold prior and post the 1800s. As I said before, there are likely to be 2 separate regime.
“Now you seem to be implying that the past could be quite different regarding PDO ifluence on global temps.”
What part of 2 sperate regimes pre and post the early 1800s did you not get?
OK, lets’s summarize.
PDO has had at most a on-off effect on the derivative of Global Temperature in the mid 20th century, 1930-1980. As we discussed, earlier from 1850-1930, and after 1990, that relationship seems absent.
Then the reconstructions going back 1000 (which disagree) show little correlation to reconstructed temperature, or the well-known features such as the MWP.
So where does that leave the hypothesis that PDO plays a significant role in Global temperature?
Urgggh
‘on-off’
should be ‘one-off’
Regimes and periodicities, baby. That answers everything. PDO didn’t influence global temps then, but they do now. Because why would the past be any different….
Brtzzzzt… fzzt.
That’s the sound of automated reasoning shorting out.
nate…”Its quite silly to look at spikes that persist for at most a couple of months, as meaningful to climate change”.
Mainly because there’s no such thing as climate change in the context in which you present it. All we’ve had the past 40 years is minor global warming and thus far no climates have changed significantly. In fact, no climates have changed significantly in the past 170 years since the Little Ice Age ended.
The reason you alarmists use the phrase ‘climate change’ is that it is sounds more scary than minor global warming.
Yes Gordon, we know, and there is also no such thing as HIV, AIDS, COVID, or heat transfer….
Yes, there is heat transfer, an engineering subject which you clearly do not understand. Nor do you understand the engineering subject of thermodynamics. Try to look up the 2nd law of thermodynamics, maybe it will point you in the right direction.
@cementafriend
greenhouse effect does not violate the 2nd law off thermodynamics
Man made Climate change is the biggest thread to mankind. We need to move to zero carbon very soon
@markus
THE biggest threat to mankind by far is moving off carbon fuels without replacing them with something better. Guess waht – once a better alternative comes up, the move will be spontaneous and voluntary. So, all one has to to is to invent a better or at least comparable alternative to fossil fuels. So far, it hasn’t been done. Therefore, our only reasonable choice is to adapt to whatever allegedly deleterious consequences that co2 emissions allegedly prduce, whilst researching for better alternatives.
> once a better alternative comes up, the move will be spontaneous and voluntary.
See COVID response, for instance:
https://www.npr.org/sections/health-shots/2021/04/07/984697573/vaccine-refusal-may-put-herd-immunity-at-risk-researchers-warn
“So, all one has to to is to invent a better or at least comparable alternative to fossil fuels.”
Solar and wind are better than coal, even the market agrees. And that with out the societal costs of coal factored in.
>>Solar and wind are better than coal, even the market agrees. And that with out the societal costs of coal factored in.<<
Words, lies and propaganda. Perhaps they CAN be better ta some point,also there is no market.
I shall elaborate on what is said.
>>Solar and wind are better than coal
what does ‘better’ means? I mean, it really depends on who;s judging and the criteria are. It is pretty obvious, that nuclear is better than them all, in theory… but it faces certain obstacles in practice. There is no way wind can be better than anything in the long run, it really is a 17th century tech, as opposed to coal which is 19th century tech. Still, solar has the potential to be useful, but it is not very much yet.
>> even the market agrees.
No, there is no such thing as ‘market’ when it comes to the general energy generation. There is market in fossil fuels and hence in transportation energy, but electricity generation is effectively nationalized pretty much everywhere. Hence, when it comes to electricity – and all the alternative energy sources suggested so far are nearly all geared exclusively towards electricity generation – the market cannot know what is better because there is no market.
And that is both sad and stupid. It is sad because without the market evaluation of the alternatives, ‘we’ are pretty much blind with regards to knowing where to move towards. let me repeat it, such knowledge sinmply doesn'[t exist. Is coal better? Nuclular? Wind? Solr? hydro? We simply DON”T KNOW, we can’t know that.
And It is stupid because the electricity generation doesn’t need to be this way. Electricity generation and distribution is not a natural monopoly, nor it needs not be nationalized. Unlike some other ‘utilities’ such as water, sewage, or other the municipal infrastructure maintenance, electricity can be completely market based, with only private entities and the complete freedom of entrance to the market, just like the internets is. But for some reason it is not, wonder why?
>> And that with out the societal costs of coal factored in.
like what?
“electricity generation is effectively nationalized pretty much everywhere.”
Evidence?
Societal costs of coal (and some other FF):
Aside from GHG emissions, Air pollution from coal has been extremely costly to human health. You visibly see it in Chinese cities, but it is still present in the US.
https://www.nature.com/articles/s41586-020-1983-8
It has also been costly due to environmental damage from its extraction. Mountain top removal, toxic runoff, etc. Then there is acid rain and mercury that ends up in fish.
‘Clean coal’ is more expensive than renewables.
Nuclear is more expensive than all others.
Wind and water are cheaper too.
>>“electricity generation is effectively nationalized pretty much everywhere.”
Evidence?
<<
that's like providing evidence that the sky is blue. Ptretty much would include going through all the countries and reviewing eaah case separately. And proving in each case it is so, while explaining away any special cases and exceptions (like here in alberta for example). I mean, the sky is not totally always blue, do that mean that 'the sky is blue' is a lie?
>>Wind and water are cheaper too.<<
yeah, and not having any electricity is even more cheaper.
Ill make it easy for you. Just show that Elec generation in the US is ‘nationalized’.
So many people here declare ‘truths’ that they cannot back up. Is this one of those?
@nate ye, it is one of those. Like that the sky is blue. Otoh, thereis this https://www.youtube.com/watch?v=9AEEBoUBGZQ
Nonsense.
@nate yeah, sure, whatever. In my opinion, the very fact that there exist non-overlapping ‘grids’ in my opinion is a sure fact that the electricenergy market in the usa is not free. At best it is a cartelized guld-like structure, at worst it doesn’t exist. And tah’s USa, the most market-oriented contry in the world. everyone else is worse. And that is why innovation in the energy sector is gargantuously stifled and is nearly doomed to fail. And that is why all this ‘green energy’ bullsheet is a mostly wasted effort. I’ll keep to my opinion on this.
‘In my opinion’
Ok so no evidence can be provided.
It is fact that in many regions in the US, the electricity is produced by many different companies.
In many places, retail electricity is supplied by many different companies (including where I live in New England).
You could see the free-market in action in the Enron scandal.
https://en.wikipedia.org/wiki/Enron_scandal
You could see the free market in action in Texas during the Winter power crisis, when retail prices ballooned.
https://en.wikipedia.org/wiki/2021_Texas_power_crisis
i don’t care what you say, I know that the free market in electricity doesn’t exist, even in texas, and your arguments are no match to mu knowledge. I don’t know if it is possible to have free market in electricity at all, but since i can’t possibly change it in any way i don’t care. But even if free market in e/e existed in the usa it would not matter because the successful solution to the renewable problem would require the worldwide free market if possible at all.
” your arguments are no match to mu knowledge. ”
Great that you are so knowledgeable.
Not great that you can’t share it with us.
There’s no such thing as ‘climate’ scientifically speaking. There’s only weather. Climate was an arbitrary definition but now its a political one.
If you rephrase the question to include the things we can actually measure and control: “What level of CO2 in the atmosphere will produce the weather you want?” You see the futility.
If we are arguing about what is natural variability, there is no argument to be had. For climate catastrophe to be plausible there cannot be any way for UAH temps NOW to be anything like close to an average line through a multi-decadal dataset. There is no climate catastrophe all you raving greenies. Stop destroying energy grids and making electricity expensive and go and live your off-grid lifestyles where you aren’t draining my taxes!
“cannot be any way for UAH temps NOW to be anything like close to an average line through a multi-decadal dataset”
Huh?
You may not be aware that other data shows more warming than UAH, at the surface where most people live, using ordinary thermometers.
The land in populated continents has warmed ~ 3 degrees F in 50y. This is not ignorable.
https://tinyurl.com/y4zasnrw
So, despite all other temperature sources also showing a fall over the last few months, don’t believe it just because it is UAH?
Why are you on here then?
“also showing a fall over the last few months, dont believe it just because it is UAH?”
How do you get that from anything Ive said, RLH? Weird trolling.
I have not anywhere denied Temps have fallen in the last few months, due to La Nina. We discussed it at length!
In any case, it is a red herring for this thread.
And I have asked and you have dodged just how long do you think the current state is likely to continue. Do you agree with Hansen that tempos are likely to continue falling until the end of the year?
When do you expect that to show up in GISS, Had, etc.? How deep will it go?
No dodge. I answered it. Go back and look.
“Do you agree with Hansen that tempos are likely to continue falling until the end of the year?”
I said based on 2018 response to ENSO, temps should rise by the end of the year. I think by 0.1 or 0.2.
Hansen was talking about the 12 mo smoothed curve, which will have a delayed rise.
Can you explain, RLH, why previously you were obsessed with applying 15 year Gaussian LP filters to every time series, with the goal of removing all short-term noise to see the long term behavior,
but now you you are obsessed with the short-term wiggles that previously you thought it so important to remove?!!
“Can you explain, RLH, why previously you were obsessed with applying 15 year Gaussian LP filters to every time series, with the goal of removing all short-term noise to see the long term behavior”
I have been doing just that with as many of the temperature series as I can. See my blog. Soon to get this months updates.
The trends that they show over longer time periods are important too. I may well add an S-G filter to the mix (better known to you as LOWESS).
Simple running means are acceptable to you (as used by almost everyone) but mathematically correct version of them are not. Hypocrite.
Why is it that people in climate, who readily acknowledge that >30 years is required to determine climate, are unwilling to apply things that are able to see things operate in those timescales to their data? Most restrict themselves to 5 or at best 10 year running means without any justification as to why that method or those particular lengths are chosen.
Selective reading again?
“but now you you are obsessed with the short-term wiggles that previously you thought it so important to remove?!!”
@Nate
Of course I know that. Which temp record do you want to use? CET? GISSTEMP? Same deal. The problem with long term ground based records is finding one that hasn’t been moved, or had urban encroachment or land use change around it is really difficult.
Pick your best long term remote, unpopulated site, tell us where it is and post a link to the data. I’ve done it for islands in Scotland where the UK has long periods of data and there’s no ‘AGW fingerprint’. Just boring steady warming with massive natural variability like you’d expect. The reason I like UAH is as far as we can tell, the only artefacts are with the instrumentation and analysis, not the site.
The moment there is so much as a cobweb on a temperature sensor, it’s not going to read correctly. Perth where I live in Oz has had enormous changes in the last 30 years. Correcting for them all would be impossible. There is undoubtedly a warming fingerprint due to human activity in the temp data. But between the swamp draining, bush clearing, house and road building and site moves, I don’t think much of it is due to CO2 from fossil fuels.
Sure, sensors drift with age, no instrumental method is perfect, but when CET, UAH and GISSTEMP are all telling you the same thing you can be pretty confident that the warming trend has well and truly changed – for now. Roy has always been reasonable, never used the hysteria for advantage or funding and for me, that counts for a lot. He has my respect. People who’ve spent their whole lives doing experiments with computer code? Not so much.
My point is that NOTHING measures climate, it’s a made up concept and not really fit for purpose. If a trend is to be real, it needs to be well outside the ‘noise’. But you stupid alarmists have forgotten that the noise is actually the only signal you have and instead invented a fake signal through inappropriate statistical manipulation.
“There’s no such thing as ‘climate’ scientifically speaking.”
Where is the science backing that highly biased opinion? Not seeing it.
“My point is that NOTHING measures climate, it’s a made up concept and not really fit for purpose.”
Gibberish. The globe is warming. That is clear. Whether you call that ‘climate change’ or not makes no difference.
“If a trend is to be real, it needs to be well outside the ‘noise’.”
Fair point. In 1981 Hansen made the same one.
He modeled the previous century of climate noise, which wiggled within a range of 0.4 C, using the known forcings.
Using the now tuned model, he further predicted that over the next decades Global temperature would clearly rise out of the climate noise range of the previous century. He also predicted the spatial pattern of the rise. He predicted faster warming of Arctic, NH, and W. Antarctica.
https://pubs.giss.nasa.gov/abs/ha04600x.html
He was accurate on the major predictions within error. Over the next 40 y, the Global Temperature has risen well out of the noise. Here is pre- and post- prediction.
https://www.woodfortrees.org/plot/gistemp/from:1880/to:1981/mean:36/plot/gistemp/from:1978/mean:36
“The globe is warming. That is clear.”
Except that it has been cooling again for the last (insert required period here). Even AIRs agrees on that.
I know that you expect that warming will resume again shortly, but that is belief not fact.
https://www.woodfortrees.org/plot/gistemp/from:2000
Declining since 2020 I see.
Nope, not in Gaussian 15y LP filtered GISS.
According to last month’s RLH, that’s what matters.
You still havent explained:
“now you you are obsessed with the short-term wiggles that previously you thought it so important to remove?!!
“I know that you expect that warming will resume again shortly, but that is belief not fact.”
So you think the response to ENSO this time will be different from previous instances?
Other than hoping against hope, what is the logic behind that belief?
This ENSO?
https://climatedatablog.files.wordpress.com/2021/06/enso.jpeg
Yep. The one that is rising since late 2020.
“so they can take advantage of the recent La Nina events to claim more cooling. ”
Just like rabid alarmists use El Ninos to claim warming.
Even though they cannot possibly be caused by atmospheric CO2.
“Just like rabid alarmists use El Ninos to claim warming.”
I think I saw one of those types on this board recently, the only time I ever have here. Even semi-intelligent understand that the monthly ups and downs are meaningless, and that it is the long-term trend that matters.
“12-month mean (temperatures) should continue to fall during the next six months, reaching a minimum in November.” May 2021 Hansen.
Quoting Hansen’s larger context for your (and others) benefit.
This 12-month mean should continue to fall during the next six months, reaching a minimum in November, as discussed in the April 2021 Temperature update.
On the longer run, global temperature will increase in response to the present large planetary energy imbalance (absorbed solar energy exceeds thermal emission to space by about +1 W/m2)1 and the continuing growth of human-made greenhouse gases. In addition, solar irradiance reached the minimum of the present solar cycle during 2019, so for about the next six years solar irradiance will add a small positive (warming) forcing (global temperature response to solar cycle forcing lags the solar cycle by 1-2 years due to the climate system’s thermal inertia).
Global temperature should reach about +1.5°C in conjunction with the next El Nino. — May 2021 Global Temperature Update, 14 June 2021, James Hansen and Makiko Sato
I would expect that someone who believes in CO2 being the main driver of climate to say that.
We will see won’t we.
P.S. I did read the whole quote which you seem to think I didn’t.
RLH is like a naive young retirement investor:
‘The stock market is going down the last couple of months. Should I sell everything?’
Hansen is his wise financial advisor:
‘Here are the fundamentals and the long term history of the stock market, which is what you need to worry about. Over the long term, it rises. Ignore what is does over a few months’
Nate is like all con artists, follow the trend and make money. Until you don’t.
Im just a sensible long-term investor. You?
And for climate, I get that the fundamental physics at work should not be ignored. You?
“I get that the fundamental physics at work should not be ignored.”
I get that large physical system tend to resonate at very low frequencies. In most natural systems these are not expected to be sinusoidal in nature except in the broadest of sense.
Sure, cycles are one type of dynamics that can occur in driven dynamical systems. Other less-predictable chaotic dynamics can occur as well.
But whether specific effects of that former type are important contributors to global temperature rise needs to be demonstrated.
A problem is that cyclic dynamics are not compatible with a long term exponential rise in temperature.
Meanwhile the specific physics behind the GHE and AGW has been demonstrated to be correct, and should not be set aside in favor of speculative causes of warming.
And of course you must be aware that the 12 mo smoothed data will warm with a delay in response to any warming beginning this month.
So you think we have reached the bottom of the dip. Interesting seeing as others disagree.
What others?
So you think the response to ENSO this time will be different from previous instances?
How long do you expect it to be before the next EL Nino occurs and what ratio El Nino/La Nina do you expect over the next decade (or longer)?
What others?
Again ENSO is a short term noise. It disappears with your LP15 filter.
Hansen’s June update speculates we’re currently near minimum for the projected double-dip La Nina:
By Northern Hemisphere summer, ENSO forecasts for the following winter become reasonably reliable, so the NOAA NCEP forecast of a double-dip La Nina (Fig. 4) is probably reliable. Nevertheless, the 12-month running-mean global temperature (Fig. 5) is probably near a minimum, because it is not difficult for global temperature in upcoming months to match the temperatures 12-month-earlier temperatures that were cooled by a strong La Nina.
. . . referring to 12-month running average on GISS LOTI of course. The monthly be noiser:
here
https://www.climate.gov/sites/default/files/NMME_plume_graph_202105_large.png
While some climate realists do cherry pick short term trends and make long term claims, at least they use real data.
That is bad science, and I point out that fact.
in
But at least they live in reality, with real data, not in the fantasy world of you climate alarmists (aka science deniers).
You science deniers, Nasty Nate, specialize in fantasies of a future climate crisis.
This alleged coming climate crisis has been predicted every year since the late 1950’s, starting with oceanographer Roger Revelle and a few associates.
But predicted with uncertainty, of course, because scientists stated uncertainty in those good old days of science.
The always wrong coming climate crisis predictions are accompanied by grossly inaccurate computer game projections, hysterical hand waving, fake high confidence, and other imaginary nonsense.
,
The 664 years of predicting rapid dangerous global warming … included the past 45 years of ignoring ACTUAL, mild harmless global warming, that was GOOD NEWS.
GOOD NEWS based on about seven billion witnesses, who have lived in some, or all, of that 45 years of global warming
GOOD NEWS because the mild warming since the 1970s most affected cold areas in the Northern Hemisphere, mainly during the six colder months of the year and mainly at night.
The “Poster Child” for global warming since the 1970s is warmer winter nights in Siberia !
It’s quite silly to live through 64 years of wrong climate predictions, and live though up to 45 years of actual mild, harmless global warming, yet wind up as a hysterical science denying believer in a climate emergency.
Beyond silly, actually it’s dumb.
But that is what life is like for science deniers — in their dreams they see the future climate ONLY getting worse — it can never get better.
The so called climate emergency exists ONLY in the overactive imaginations of leftist science deniers … yet the actual climate keeps getting better and better with each passing decade.
Pick a trend, any trend!
So will this month (July) be the same or lower/higher than last month (June)?
Why not settle last month’s bets before that, Richard:
https://www.drroyspencer.com/2021/06/new-nasa-study-earth-has-been-trapping-heat-at-an-alarming-new-rate/#comment-744245
Hindsight is always right!
I didn’t have a bet with you, only with EM (and he paid up).
The June UAH value is probably on the high side of the + or – .1 C error range. Antarctica was very cold in June but is not well covered by the UAH data. The -0.07 C number is probably more accurate.
To continue for how long?
I suppose this counts as a response:
https://www.drroyspencer.com/2021/06/new-nasa-study-earth-has-been-trapping-heat-at-an-alarming-new-rate/#comment-744534
“The -0.07 C number is probably more accurate.”
To continue for how long? Up or down from there I mean.
Doing it month by month and also year by year makes much more sense.
y tho
Idiot
RLH says:
Doing it month by month and also year by year makes much more sense.
The time period of interest depends what information one is looking find (or not) in the signal.
Mark B: Single figures prove very little. Month on month and year on year prove a little more.
Still no answer to: y tho.
z
545
It’s the number of “idio” on the page, dummy.
We’re at 555. Let’s see you reach a thousand while accumulating moar blunders.
RLH says:
So will this month (July) be the same or lower/higher than last month (June)?
My guess is that UAH TLT for July will be higher than June, perhaps somewhere in the range of 0 – 0.1, but with low confidence.
The rational is that UAH on this timescale correlates fairly well with ONI lagged 5-6 months and ONI started trending up over that period.
“My guess is that UAH TLT for July will be higher than June, perhaps somewhere in the range of 0 – 0.1, but with low confidence.”
What is low confidence? What next higher confidence level do you have?
Low confidence: I’d bet a beer on it and my intuition is that I’d win more often than not. I recognize there is significant residual randomness in these measurements and haven’t attempted to quantify this. I could be more rigorous if it mattered.
Did you want to make a projection?
Well you said ‘low confidence’. I just wanted to know what that meant
I’m still waiting for explanation from warmistas how CO2 causes heatwave without raising the earth temperature first
Trying to find an earlier year with sufficiently similar conditions is fraught with difficulty. Compare decadal means (or 11-year if you want to negate the solar cycle.) Temp keeps going up.
There was a heat wave of similar intensity which struck Northern California counties back in the summer of 1957.Temps were triple digit for over two weeks straight. That heat wave lasted almost one full month.
Because scintists said so, that’s how! Think this way, if .7 degrees of global warming caused heat waves to be 10K warmer, we should expect that 4.5K warming would cause heat waves that are 65K warmer than normal, bringing summer temperatures in california to over 100*C.
“Im still waiting for explanation from warmistas how CO2 causes heatwave”
CO2 doesn’t cause heatwaves.
In the current La Nina, temperatures barely dipped below zero. During the 1999-2001 La Nina, temperatures went way lower.
Krakatoa
Yeah. And in addition, you have to add the monthly differences between 1991-2020 and 1981-2010:
Jan: 0.14
Feb: 0.16
Mar: 0.13
Apr: 0.12
May: 0.12
Jun: 0.13
Jul: 0.13
Aug: 0.12
Sep: 0.17
Oct: 0.16
Nov: 0.13
Dec: 0.12
June 1999 was at -0.15 C; with 0.13 C added to this year’s June, we have a difference of 0.27 C worldwide, that’s a lot indeed.
J.-P. D.
Do you expect future UAH temps to be above where they are now, and, if so, in what time frame?
RLH
I assume you’re asking your question of Krakatoa or Bindidon, but if you don’t mind, let me take a crack at it.
In the short run, global temps, whether in the UAH dataset or any other reputable dataset, will start to rise four or five months after the current La Nina ends. La Ninas depress global atmospheric temperature so when they end, temps rise. There is a time lag involved, so it takes four or five months before it becomes evident in the temperature data.
In the longer run, global temps will rise as long as we have elevated levels of greenhouse gas concentrations in the atmosphere, and especially as those levels keeps rising. That’s why global temperatures have risen significantly in every reputable dataset over the past 42 years, as calculated by least-squares regression analysis. There is no reason to think this trend will not continue.
“start to rise four or five months after the current La Nina ends”
Well the current long term forecasts are for La Nina to continue into next year.
https://www.climate.gov/sites/default/files/NMME_plume_graph_202105_large.png
“Well the current long term forecasts are for La Nina to continue into next year.”
You’re saying this again?
La Nina is over, according to all the major monitoring groups, as well as the graph you linked, and they are also predicting neutral conditions ahead.
Are you like some others around here, who wish for a la Nina, and cherry-pick whatever they can find to hold that view?
http://www.bom.gov.au/climate/enso/outlook/
https://www.cpc.ncep.noaa.gov/products/analysis_monitoring/lanina/enso_evolution-status-fcsts-web.pdf
http://ds.data.jma.go.jp/tcc/tcc/products/elnino/outlook.html
The NMME project team doesn’t make forecasts, but they contribute to other groups who do. Human judgement does better than sheer model output, especially for long-term forecasts.
https://www.climate.gov/news-features/blogs/enso/enso-forecast-mash-ups-what%E2%80%99s-best-way-combine-human-expertise-models
So you are saying that the predictions for a return to La Nina later on this year are false?
https://www.cpc.ncep.noaa.gov/products/CFSv2/imagesInd3/nino34Mon.gif
“So you are saying that the predictions for a return to La Nina later on this year are false?”
I just provided links to 3 major ENSO monitoring groups forecasting neutral conditions continuing is the most likely scenario.
I also provided a link to a study showing models+human judgement does better than just model output at forecasting longer term ENSO.
Dunno what game you are playing. Not interested.
“The CFS.v2 ensemble mean (black dashed line) predicts ENSO-neutral followed by weak La Nia conditions during late fall and winter 2021-22”
You said:
“the current long term forecasts are for La Nina to continue into next year.”
Even your selected quote belies you. There is no continuing la Nina.
Tellme, which forecast predicts the warmer side of the 0, central line, is going to occur and when?
Which forecasts predict anything other than a La Nina for the start of next year?
“Goal post shifts, argumentative, boring”
Idiot.
No U.
s t . v w
Krak, we had persistent La Nina conditions in 1999-2001 for almost 3 years. Time has an effect. I have mentioned many times that it will take another La Nina to counteract the effects of recent Al Nino events.
We may very well see that happen starting this fall. Watch the SSTs as they will be the prelude to where UAH goes 5-6 months later.
The other big factors are the ocean cycles. The PDO may have switched recently. Always hard to tell as ENSO also has similar effects. The AMO is still running positive.
‘In the current La Nina, temperatures barely dipped below zero. During the 1999-2001 La Nina, temperatures went way lower.”
You have declared the conclusion to an event that is barely only half way in and still has one to two years to go. And of course the halfwit Bendydong jumps right in support,
That’s what makes it fun saving these posts
“the USA Lower 48 temperature anomaly of +1.44 deg. C was the warmest in the 43 year satellite record”
Well, that is except the +1.45 in 11/2020 😉
E. Schaffer
” Well, that is except the +1.45 in 11/2020 ”
Njet.
Nov 2020 anomalies were wrt the mean of 1981-2010; since Jan 2021, UAH uses 1991-2020.
For June months, the difference is 0.13 C, what would have given 1.57 C when using the old reference period.
J.-P. D.
Bellman is right, I didn’t look at the 1991-2020 data before writing the comment.
My bad.
J.-P. D.
The temperature anomaly figures Dr. Spencer published in today’s article, including +1.44 degrees C for June 2021 and +1.45 for November 2020, are all with respect for the same baseline, the one based on 1991-2020. Before the baseline change, Dr. Spencer was saying the anomaly for USA-48 for November 2020 was +1.56.
He mean the warmest june
There are others as well. I saw a 1.97 C in April of 1981.
RLH
Your bet. I’m sending 10 pounds to the RNLI.
As I used to live in Poole all I can say is good news : )
\o/
Willard, please stop trolling.
Ah. You’re back I see.
…and you would have a problem with me asking Willard to stop trolling because?
Richard is working for your place, Kiddo.
He is more senior, but you have seniority.
Willard, please stop trolling.
Nice extrapolation there!
I expected a faster recovery from the La Nina. (Rueful smile)
https://www.climate.gov/sites/default/files/NMME_plume_graph_202105_large.png
http://www.drroyspencer.com/2021/07/uah-global-temperature-update-for-june-2021-0-01-deg-c/#comment-744920
https://www.cpc.ncep.noaa.gov/products/CFSv2/imagesInd3/nino34Mon.gif
http://www.bom.gov.au/climate/enso/outlook/
https://www.cpc.ncep.noaa.gov/products/analysis_monitoring/lanina/enso_evolution-status-fcsts-web.pdf
http://ds.data.jma.go.jp/tcc/tcc/products/elnino/outlook.html
Are you saying that, despite the forecasts on reputable sites, there will be no La Nina at the end of this year?
“The CFS.v2 ensemble mean (black dashed line) predicts ENSO-neutral followed by weak La Nia conditions during late fall and winter 2021-2201”
Are you trolling?
From the 3 links:
“The ENSO Outlook is INACTIVE. This means the El NioSouthern Oscillation (ENSO) is neutral with little indication that El Nino or La Nina will develop in the coming months. During this time, other drivers, such as the Indian Ocean Dipole (IOD), the Southern Annular Mode (SAM) or localised sea surface temperatures, are likely to play a bigger role in influencing Australian rainfall and temperature patterns. All seven climate models surveyed by the Bureau suggest a neutral ENSO state is the most likely scenario for the coming season.”
“ENSO-neutral is favored through the Northern Hemisphere summer (78% chance for the June-August season) and fall (50% chance for the SeptemberNovember season).”
“The La Nia event that started in summer 2020 has terminated.
ENSO-neutral conditions are likely to continue through to next autumn (60%).”
Let’s see what you said:
“the current long term forecasts are for La Nina to continue into next year.”
Even your selected quote belies you. There is no continuing la Nina in any of the forecasts.
“Are you saying that, despite the forecasts on reputable sites, there will be no La Nina at the end of this year?”
There could be. These forecasts are not deterministic, they are probabilistic. They are also less certain further out.
“Some models favour a return to la Nina by NH Winter.”
There. It’s not hard to be accurate.
“There is no continuing la Nina in any of the forecasts.”
Well as the forecast don’t even cross the center line towards warmer times, I think it is quite fair to say that La Nina (or closeness to it) will dominate for the rest of the year.
Colder side of neutral is what ALL the forecasts say. Do you deny even that?
Goal post shifts, argumentative, boring. Enough.
Failure to acknowledge expert sources. Typical.
> Goal post shifts, argumentative, boring
That’s Richard in a nutshell.
Nut more applies to you than me.
No, dearest Richard.
U.
s t . v w
No, the 1.45 for Nov 2020 is using the new base period.
Though I’m not sure it makes sense to compare anomalies for different months. 1.44 above the June average is going to be warmer than 1.45 above the November average.
That comment was meant to be in response to Bindidon’s comment to R. Schaffer.
I think Spencer meant it was the warmest June anomaly for the USA 48.
Eyeballing the graph, the 13month average is now close to the 2010 peak.
Its too bad we dont have this data going back to 1600 or so. But the statistical significance of both the increase since 1979 and the decrease since 2016 demand assignable caused. Doesnt look like CO2. Doesnt look like single La Nia or El Nio events. Maybe ocean currents? Maybe clouds and cosmic rays and earth and solar magnetic variations and movement about the Barypoint and extrasolar events and and the ocean acting as a capacitor? I no longer consider anyone saying unprecedented and CO2 at this point a scientist.
Well satellite data back to 1600 would be nice, but we do have instrumental data back to at least 1880 and global proxy data showing how the climate changed in the past at least back to the start of the Holocene. These data show extreme warming coinciding with rapidly increasing CO2 levels in the 20/21st centuries. I suppose that could be a coincidence, except for the fact it was predicted quantitatively over 100 years ago.
But science denial is popular these days. Some deny global warming. Some deny the globe itself.
“…except for the fact it was predicted quantitatively over 100 years ago.”
Now is that really accurate? Wasn’t the “prediction” somewhat nebulous? Isn’t that what “ECS” and “TCR” are all about? Trying to find the correct values to make the models work?
Or is the “fact” more a “belief”?
And some deny the existence of the Holocene Thermal Maximum, Roman and Medieval Warm periods as well as the Little Ice Age. Everyone has their hustle. True science would try to show that this warm period is unprecedented. So far no one has. The question is not either or, but rather the proportionality of AGW and natural variability. Sea level rise began 200 years ago. Glaciers began melting during the same period. Signs of warming preceded the apparent effect of CO2, according to the IPCC. Temperatures rose and sea levels rose 100 years ago before leveling off. If the AMO flips as expected, then we might be involved in decades of flat temperatures. Its hard to believe that all the low frequency oscillations will be disappearing just because of AGW.
So, should it be flattal warming or diskal warming now?
Dirk McCoy
One guy more who doesn’t understand that the trend since 2016 cannot be positive: 2016 was the year with the highest anomalies since Dec 1978.
Start with 2017, and it goes the other way ’round…
https://www.woodfortrees.org/graph/uah6/mean:12/plot/uah6/from:2016/trend/plot/uah6/from:2017/trend
J.-P. D.
Accurate data back to 1600 would make no difference.
The science deniers would still be predicting a coming climate crisis, with one one way to avoid it: Put them in charge of all governments, ask no questions, and let them print money for their green projects and dreams.
You live in climate reality.
Current and past climate data matter.
Science deniers live in a future climate fantasyland.
Past climate data data are irrelevant.
Note how they ignore the mild, harmless global warming since the 1970s — during every year of that mild warming trend, they were predicting rapid, dangerous global warming that never happens. Those predictions actually started in the late 1950s.
When one lives in a climate fantasyland, climate history does not matter.
Science deniers have their beloved green dreams of climate doom — and that’s good enough for them.
A climate crisis that is always coming, but never arrives.
A climate crisis that exists only in one place — in the over active imaginations of deluded science denying leftists.
Told people this was coming in 2007 when I walked out of a Carbon management company, we have wasted trillions on a lie and have no plan for cooling. Covid1984 is part of the same lie.
Oh, my I wasn’t expecting -0.01C for June, however, by looking at global sea surface temp anomalies, there are huge areas of the Indian, Southern, Pacific and Atlantic oceans that are below normal so it makes sense.
ENSO forecasts show a high probability of another La Niña cycle developing at the end of this year, and if this happens, we could see UAH 6.0 hit a temp anomaly of around -0.4C sometime next year.
It also seems like both the Pacific and Atlantic are approaching their respective 30-year cool cycles within the next few years, which will cause 30 years of global cooling as occurred from 1880~1913, and 1945~1978.
CAGW is so busted.
Time alone will tell if that claim is justified.
RLH-san:
Yep, Truth is the daughter of time.~Sir Francis Bacon.
Bacon had his head on the clouds. If history is written by the victors, truth is an orphan.
You cannot just ignore facts if they don’t suit you.
Barry can ignore facts, data and logic, any time he wants to, and he does. Because he is a leftist.
Truth is not a leftist value.
Political power is a leftist value.
Rule by leftist “experts” is the goal.
Saving the world*** from an imaginary climate crisis is more important than truth.
*** With leftists in charge, of course — which is the actual goal. Fighting an imaginary coming climate crisis is just a strategy to reach that political goal.
Joe is center-right, Richard.
If you think he’s a leftist, you need to have your political compass checked.
I was burning Bacon. You guys are talking politics.
More care needed in the kitchen then.
Knowledge is Power.
France is Bacon.
https://www.tridge.com/intelligences/bacon/export
I doubt we will even see -0.3 C with the next La Nina. All the stronger La Nina events this century were during -PDO/+AMO conditions. We’ve had +PDO/+AMO conditions for the last 7 years which would limit the cooling effect of La Nina. It is possible the PDO is changing again so there is some uncertainty.
The AMO provides yet another level of uncertainty as does the millennial cycle.
Richard-san:
During La Nina events, the global temp anomaly usually drops between 0.5C~1.0C, depending on the strength of the La Nina event.
Since this is likely going to be a double-dip La Nina event without an El Nino preceding it, the global temp anomaly will likely start at around +0.2C, and the fall 0.6C down to -0.4C.
Obviously, if it’s a very weak La Nina event, it may just fall to -0.3C, but no one knows.
We’ll see soon enough..
Projections are for it to be a La Nina by later this year. But as you say, we will see how true that is by the year end.
So with the coming ice age in the 50s 60s and 70s , while CO2 was increasing. How do we reconcile that?
Mick-san:
From 1945~1978, there was 30-year PDO cool cycle, in effect and global temps always fall when during PDO cool cycles.
This is just more evidence how weak CO2 forcing actually is.
The same thing happed from 1880~1913, and will happen again from around 2024~2054…
CAGW is already a disconfirmed hypothesis.
The only reason this CAGW Hoax is still a thing is that we’ve been in an extended PDO warm cycle since 1979 to the present. Once the PDO switches to its 30-year cool cycle, CAGW is dead.
samurai-san…”Once the PDO switches to its 30-year cool cycle, CAGW is dead”.
It appears the PDO is a misnomer since it is referenced as a decadal oscillation. It was named in the 1990s after being discovered in 1977, known then as The Great Pacific Climate Shift.
If what you say is true, and it is a multidecadal oscillation like the AMO, then we should see an uptick in La Ninas when the PDO switches to its cool phase.
Gordon, More recent research shows the PDO may very well be of variable length and a multiple of 7-8 years. The PDO was positive from 1977-2006 and then went negative until 2014. The 2006-2014 negative PDO was one of the major reasons for the 18 year pause. When it flipped positive again the pause came to an end.
The PDO index has been running negative this year but that is normal for La Nina events.
Does the PDO drive the frequencies of La Nina or does La Nina drive the PDO?
IN “IN CONTRAST, THE ANTARCTIC REGION” NEWS
https://phys.org/news/2021-07-183c-antarctica.html
Why ignore the very low current temps down at the South Pole? Temps have dropped into the minus 90s F over the last several months. These are the coldest temps seen down there in many years…. https://earth.nullschool.net/#current/wind/surface/level/overlay=temp/orthographic=168.56,-92.34,672/loc=50.927,-79.800
Did you forget about Turner, 2016 which showed a lack of warming since the 1990s in the Peninsula, or were you just ignorant of the paper?
roberto (Duran???)…”…or were you just ignorant of the paper?”
Willard is just plain ignorant.
It’s Turner & alii, Roberto.
Gordon might appreciate that Eric said something similar around that time, i.e.:
https://www.nature.com/articles/535358a
You were saying?
Willard, please stop trolling.
Cold spot is -69.4C. The ice is not melting.
18.3 must have last all of 3 seconds.
Let me get this straight, temperatures are basically flat going back to 1980, CO2 has increased by 30%, and many people believe CO2 is causing warming and climate change? That is a complete joke. Clearly, the oceans are controlling the atmospheric temperatures and the oceans are warmed by warming visible radiation.
If you control for H2O and the UHI it is very very easy to find no warming. NASA is simply attributing warming to exogenous variables that they appear to have no interest in accounting for.
https://imgur.com/a/CDasqHH
https://imgur.com/I2Lua3l
The joke is everyone was taught in elementary school that we are living in an Ice Age.
If it warmed it would be good news.
And did warm from the cold period we call the Little Ice Age- and cold period was covered in elementary school history class.
Obviously the educational system is not working.
> we are living in an Ice Age
Wut?
I wasn’t taught that.
Then your education is sorely lacking, Willard. Ice Age: Roughly, when there is year-round ice at the poles.
I think Willard’s tongue is firmly planted in his cheek.
When will be the next glaciation period, Dave?
Also known as Icehouse global climate which in addition polar ice caps, is also defined as having a cold ocean.
Our Ocean is cold- some fiction writers sometimes mention it’s cold.
But our ocean has average temperature of 3.5 C. It’s also commonly described as 90% of the ocean is 3 C or colder.
Anyhow 3.5 C or 38.3 F is cold.
And 15 C is also cold.
But if ocean average temperature was 15 C, then we wouldn’t be in Icehouse global climate or an Ice Age. It would then be within range of Earth’s “normal temperature”. Though opinions differ, some might say that this counts as a Greenhouse global climate [the warmest climate state of Earth}.
Since the last time the Antarctica was ice free was 34 million years ago, gb, nothing much might follow from your speculations.
“Antarctica hasn’t always been covered with ice – the continent lay over the south pole without freezing over for almost 100 million years. Then, about 34 million years ago, a dramatic shift in climate happened at the boundary between the Eocene and Oligocene epochs. The warm greenhouse climate, stable since the extinction of the dinosaurs, became dramatically colder, creating an ‘ice-house’ at the poles that has continued to the present day.”
“Let me get this straight, temperatures are basically flat going back to 1980, ”
I think not.
https://www.woodfortrees.org/plot/uah6/from:1980/to:2022/every/plot/uah6/from:1980/to:2022/every/trend
Thanks for the Graphic ET, I guess I should have said basically the same level of 1980, and well below the level on 1987 and 1990.
https://www.woodfortrees.org/graph/uah6/from:1980/to:2022/every/plot/uah6/from:1980/to:2022/every/trend
Once again, CO2 is much higher, yet temperatures aren’t, and they are clearly tied to ocean oscillations.
https://imgur.com/a/CDasqHH
I changed that regression to 1995 to 2015 and the temperatures are flat as a board. 20 years of no warming at all and CO2 increased.
https://www.woodfortrees.org/graph/uah6/from:1980/to:2022/every/plot/uah6/from:1995/to:2015/every/trend
Let me save you some work, Life:
https://skepticalscience.com/escalator
Williard, that chart you highlighted is totally counter to the physics of the CO2 molecule. How could CO2 possibly cause steps? It also shows significant warming since 1979. The Chart at the top of this page shows no warming. How can two charts measuring the exact same event show such different results?
Alternative, Life, the Escalator is a recurring contrarian trick that, if transposed into puts and calls, would make them lose infinite money.
Willard: Alternatively everything is driven by a hockey stick.
That… does not even make sense, Richard.
If the escalator graph was a stock, would you buy or would you sell?
So you don’t dispute it?
Dispute what, that you’re conflating indicators with reality?
That would be hard.
So you do believe in the hockey stick.
Does the Auditor do, Richard:
https://moyhu.blogspot.com/2014/03/mcintyre-mann-and-gaspe-cedars.html
If you could find an occurrence of “hockey stick” in the IPCC deliverable, that’d be great.
You ight know it better as Anthropogenic and Natural Radiative Forcing
Oh, and volcanoes.
“[B]ecause the feedbacks in the climate system often respond similarly to warming with different causes (warmer air will tend to melt more snow and ice, and to pick up more greenhouse-gas water vapor from the vast ocean, whether the warmth came from rising CO2 or increasing solar output or alien ray guns or a giant hair dryer), data showing larger climate changes in the past in response to some estimated forcing actually increase the concerns about future warming. If, for example, scientists had somehow underestimated the climate change between Medieval times and the Little Ice Age, or other natural climate changes, without corresponding errors in the estimated size of the causes of the changes, that would suggest stronger amplifying feedbacks and larger future warming from rising greenhouse gases than originally estimated.”
You, like others, suggest a lot and deliver nothing.
No U.
s t . v w
“Let me get this straight, temperatures are basically flat going back to 1980,”
You got it crooked in your first sentence there.
https://www.woodfortrees.org/plot/uah6/from:1980/plot/uah6/from:1980/trend
You have to be some kind of horse’s ass not to see that temps have been generally rising since 1980.
BREAKING “WHO DID THIS” NEWS
Compare:
https://bc.ctvnews.ca/62-new-wildfires-29k-lightning-strikes-reported-in-24-hours-in-b-c-state-of-emergency-possible-this-summer-1.5493358
Contrast:
https://www.drroyspencer.com/2021/06/new-nasa-study-earth-has-been-trapping-heat-at-an-alarming-new-rate/#comment-743065
willard…”BREAKING WHO DID THIS NEWS”
Environment Canada has announced an alert for lightning storms in the BC interior. Of course, EC are alarmist schw.e.i.nh.u.nds as are most of the media in Canada, including the government run CBC (Canadian Broad-casting Corporation). Every summer there are lightning storms due to drought in the BC (British Columbia) Interior and that has been the case for the past 100 years, at least.
https://en.wikipedia.org/wiki/Drought_in_Canada
“Although most regions of Canada have experienced drought, many of the southern regions of the Canadian Prairies and interior British Columbia are most suscep-tible. During the past two centuries, at least 40 droughts have occurred in western Canada with multi-year episodes being observed in the 1890s, 1910s, 1930s, 1960s, 1980s, and the early 2000s”.
***
I had it out with a senior poobah at CBC over this. He could not offer scientific evidence nor was he interested. He told me the CBC follows the direction of the IPCC. When I pointed him to UAH for an alternative scientific view, he was not interested.
The CBC science department is now run by a disciple of David Suzuki, one of the Mothers of all Alarmists, who used to rule the roost at CBC in The Nature of Things. Suzuki is driven by misguided environmentalism and if anyone at CBC prints anything scientific that disagrees with his pseudo-science, he goes after them ranting and raving till they recant.
Years ago, a CBC program, The Denial Machine, passing itself off as having a scientific interest, went after the late Fred Singer. Their ruse was an interest in his skep-ticism but what they really tried to do was discredit him by tying him to the tobacco industry in the 1960s. They did not allow him to talk about his skep-ticism, they only badgered him about ties to the tobacco industry.
There is not a shred of evidence that wildfires and heat waves are connected to anthropogenic sources. Nor are other weather events like droughts, tornadoes, and tropical storms. If you had an ounce of sense you’d be open to that truth but you are a major climate alarm troll whose only interest is in spreading propaganda.
> The CBC science department
The newsie comes from CTV, Gordon.
At least make an effort.
“went after the late Fred Singer”. Well deserved. Infamous tobacco and fossil fueled denier of science that hurt their bottom line.
Willard, please stop trolling.
CO2isLife
Temperatures are not going back to 1980s levels. The coldest months now are as warm as the warmers months in the 80s.
Just like how a cold July day can be as warm as a very warm January day. But then you also wouldn’t say that we are back to January temperatures.
Yep, those Northern Hemisphere Dec/Jan/Feb days are now as warm as the Jun/Jul/Aug days.
Krakatoa, control for UHI and Water Vapor and you get no warming.
https://imgur.com/a/CDasqHH
Why would you think we need to ‘control for water vapor’ which is part of the Earth’s predicted response to AGW?
Keep arguing about the weather and blaming yourself for every weather event in the world. Succumb to the politicized scam…. allow yourself to be further manipulated by your government. Spread false alarms to enable the elimination of more freedoms liberty. I just watched the world news… and this chart wasn’t there… it was only segment after segment of folks complaining about hot weather. SHAME.
a. smith…”Succumb to the politicized scam. allow yourself to be further manipulated by your government. Spread false alarms to enable the elimination of more freedoms liberty”.
***
Same is true of the covid scam. It was finished by mid-2020 and politicians, listening to epidemiologists, using unvalidated computer models (crystal balls) have kept it alive for another year. The most recent scam is variants, all of them conjured on unvalidated models.
At no time, would any of them consider that the tests may be wrong, even though ample proof exists that the tests cannot possibly test for an infection. They test for products of infection…any infection, as well as pregnancy and papayas and the common flu.
> It was finished by mid-2020
C’mon, Gordon.
The South Pole is experiencing very low temps over the last 2 months right in the middle of the continent. Temps have been as low as minus 97F in some spots. … https://earth.nullschool.net/#current/wind/surface/level/overlay=temp/orthographic=168.56,-92.34,672/loc=50.927,-79.800
“Temperatures are not going back to 1980s levels. ”
Well, not till the ozone layer recovers substantially at least..
Robert,
I understand your point. There is global warming, but the case for a climate emergency or that there is a scientific reality for a climate crisis is all about the magnitude of the future warming. A return to major La Nina would likely take global surface temperatures out the range of model predictions over the 40 years of satellite data and the most elevated CO2. Ultimately, the case for the extreme action required to reduce global CO2 requires extreme risk to Earth ecosystems and recent warming like Eemian show we are not reaching high risk. Typically, models are adjusted to calibrate to the actual data. It seems an unbiased assessment would require major changes to climate models. If you took the average of had C.RUT plus RSS over 40 years the data should be withing a standard deviation of the model mean. An unbiased, non partisan equivalent to IPCC would demand model updates already. Do you think models and predictions need adjusted? So the world doesn’t make a poor decision.
goldminor
Yeah, it’s quite cold in the Antarctic these days.
But when you mention ‘-97 F’ aka ‘-72 C’, I think that the list below, showing the 20 least temperatures ever recorded during April/May/June by Antarctic stations, might calm you down a little bit:
VOSTOK_____ 2012 5 26 -81.2 (C, not F!)
VOSTOK_____ 1995 5 20 -80.6
PLATEAU_STN 1966 5 11 -80.6
VOSTOK_____ 1993 5 22 -80.5
VOSTOK_____ 1998 4 21 -80.4
PLATEAU_STN 1966 5 12 -80.0
PLATEAU_STN 1966 5 18 -80.0
PLATEAU_STN 1968 5 19 -80.0
PLATEAU_STN 1968 5 6 -80.0
VOSTOK_____ 2012 5 24 -79.7
VOSTOK_____ 1995 5 13 -79.4
VOSTOK_____ 1999 5 22 -79.4
PLATEAU_STN 1966 5 17 -79.4
PLATEAU_STN 1968 5 20 -79.4
PLATEAU_STN 1968 5 27 -79.4
VOSTOK_____ 2012 5 26 -79.3
VOSTOK_____ 1997 5 12 -79.2
DOME_A_____ 2019 5 25 -79.1
VOSTOK_____ 2010 4 23 -79.1
VOSTOK_____ 2012 5 25 -78.9
*
And don’t forget to look at the altitudes…
AYW00077401 -79.4667 040.5833 3505.2 PLATEAU STN
AYM00089606 -78.4500 106.8670 3488.0 VOSTOK
AYM00089577 -80.3700 077.3700 4084.0 DOME PLATEAU DOME A
J.-P. D.
binny…”Yeah, its quite cold in the Antarctic these days”.
These days??? When has it never been cold in Antarctica?
> When has it never been cold in Antarctica?
Good question:
https://www.theguardian.com/world/2011/jul/17/antarctica-tropical-climate-co2-research
goldminor…”Temps have been as low as minus 97F in some spots.
https://earth.nullschool.net/#current/wind/surface/level/overlay=temp/orthographic=168.56,-92.34,672/loc=50.927,-79.800 ”
Thanks for link. I had never seen the Antarctic Peninsula like this before. It is stuck right out into the ocean where the surrounding ocean temperatures are near 0C. No wonder it shows such warm temperatures compared to the core of Antarctica.
For other viewers, click on the map till the green circle moves to the Peninsula then check the adjacent ocean temps.
It is the highest deceit to claim Antarctica is warming based on this nonsense. Yet Mann and Steig produced a paper claiming Antarctica had warmed the past 50 years, basing much of their temperature data on the Peninsula.
The Climate Clown Mann even managed to include a surface station that was under 4 feet of snow.
> Yet Mann and Steig produced a paper claiming Antarctica had warmed the past 50 years
See for yourself:
https://pubs.giss.nasa.gov/abs/st00910q.html
willard…”> Yet Mann and Steig produced a paper claiming Antarctica had warmed the past 50 years
See for yourself:”
***
And the paper was proved to be more junk science like Mann’s hockey stick. Two critiques were that the authors used mostly temperature data from the warmer Peninsula and that one station they used in their report was buried under 4 feet of snow.
Here’s a fair warning, Gordon:
https://neverendingaudit.tumblr.com/tagged/Antarctica
“And the paper was proved to be more junk science”
Oh yes? Who ‘proved’ Steig et al was junk science? All they said was that Antarctica had warmed over a given period, and the only published effort I know of to dispute that agreed that it had warmed over the period, but not as much.
It’s a long story:
https://neverendingaudit.tumblr.com/post/189106851189
Willard, barry, please stop trolling.
I will take -0.1C gratefully.
Even with an adjustment to the 30 year baseline as a backup cause.
Very happy as UAH often goes the other way to what I would like to see..
Nick Stokes Moyhu also shows a temple mesh anomaly that is very low though not negative.
This and February are the only ones on a <0.10 C anomaly and there was only one negative month anomaly since 2014 that being Feb 2014.
A long,long way to getting temperatures down to where sensible debate can begin.
–
Even natural variability has to obey the rules of physics in terms of mass, insolation and change.
A steep drop over a few months or a year is more or less predestined to have a more or less even backswing.
–
However we need a sustained drop for,I would say, 3 years to give a false impetus to the figures to enable reliable discussion on the actual unbiased assessment of CO2 effect.-
–
current trend is downwards for a while but could reverse totally by next month.
Hopefully it will persist for months to 3 years.
Wishful thinking.
Angech, we will likely see some recovery from the current La Nina induced values over the next 6 months. I would expect to see July back into positive numbers and values of at least +0.2 C before the end of the year.
If another La Nina occurs, the strength of that La Nina will determine how low we go in 2022. I’m thinking around -0.2 C or possibly a little lower. The oceans will be cooler going in and that should lead to lower anomalies.
hope so.
I cannot do else than to refer to my graph which shows that the 13-month average is ruled by an exact period of 3.6 years. I don’t doubt that it will continue to rise and fall
https://udoli.files.wordpress.com/2021/07/uah_3.6_graph.gif?resize=320%2C320
Sorry, wrong link:
https://udoli.files.wordpress.com/2021/07/uah_3.6_graph.gif
Joe Biden is blaming climate change for the collapse of the Florida Condo. Here is the temperature chart for Plant City Fl.
https://data.giss.nasa.gov/cgi-bin/gistemp/stdata_show_v4.cgi?id=USC00087205&dt=1&ds=14
It is flat as a board between 1890 and 2015. It is shocking how little scrutiny the media gives to these kinds of nonsensical claims.
CO2…”It is flat as a board between 1890 and 2015″.
The real laugh is that the graph’s steep trend used to begin circa 1990. They have now moved it forward a decade. That was when Mann claimed the 1990s as the hottest decade on record based on his faulty statistical tree proxy analysis.
Another laugh is that the Climate Clown, Mann, has been inducted into the National Academy of Science. I am thinking of applying myself. All you need is to convince the alarmists who took over NAS that you elief their bs.
Tony Heller demonstrates that and more fudging by NOAA and NASA GISS.
> [Teh Goddard] demonstrates that
What is “that,” Gordon?
willard…”> [Teh Goddard] demonstrates that
What is “that,” Gordon?”
You’ll have to watch some of Tony’s videos but with your attention span I guess that would be a but much to ask of you.
Tony demonstrates where NOAA and GISS fudged the data. I realize you stuff your ears full of wool so you won’t hear any criticism of the fudgers. You know, your authority figures.
Your handwaving is duly noted, Gordon.
Here’s a classic:
https://moyhu.blogspot.com/2010/07/if-its-hot-in-washington-how-about.html
There are dozens of episodes where teh Goddard fumbles the Climateball like this.
Willard, please stop trolling.
This complex being named Earth is complex enough for us to expect some movement about long term means of measured properties. Natural variation, as best we can tell, is ever present.
Those who believe there was a little ice age a few decades ago can start their thinking from this LIA which might be the coldest few decades in 100,000 years. So, at that time, Mother Earth had 4 options; to cool more; to stay the same; to warm; or to flutter around meaninglessly up and down as usual.
In a social world going through yet another mania about the end of life as we know it, vast numbers of people have seized upon a barely measurable warming and elevated it to religious status.
All are welcomed to join the club but it will end in tears. Jonestown did.
Please do us all a favour when commenting here by sticking to hard science and leaving your kits of illusions elsewhere. Thank you Geoff S
geoff s…”vast numbers of people have seized upon a barely measurable warming and elevated it to religious status”.
I am questioning whether or not we are dealing with mental illness here, with the political correctness. Not the psychotic type of mental illness, but a neurotic mental illness. I mean, what would make all those people at Jonestown line up to kill themselves based on a belief?
Most people are neurotic to a degree, which is a propensity to misinterpret reality and substitute a mental image of it. It’s basically the way the human brain work and not many people are able to be aware of the conditioning. However, when people distort science to enable such neurotic conditioning, that is falling into mental illness.
Unfortunately, we are seeing it unravel before our eyes as world leaders fall in step to accept belief systems based on consensus rather than the scientific method. Politicians have always been liars of one variety or another and they justify it as ‘just politics’.
One climate modeler, the late Stephen Schneider, went so far as to wonder if it was appropriate to lie to the public for their own good. The first co-chair of the IPCC, John Houghton, stated,’unless we announce disaster, no one will listen’. Later he tried to recant the statement by offering a different interpretation, just like Trenberth trying to cover up his statement during the flat trend, that warming has stopped and it’s a travesty that no one knows why.
A Canadian politician once claimed that it does not matter if the science (AGW) is wrong, it’s the principle that matters.
I have really had enough of the politically-correct telling others how they should think, and when the others refuse, trying to shame them or ostracize them. That’s mental illness at work.
Well stated, Geoff (and Gordon).
Unfortunately, the “hard science” left when the “barely measurable warming” got elevated to “religious status”. It’s no longer a “club”, it’s a “cult”, filled with braindead worshipers of “anti-science”.
Your mention of “Jonestown” was exactly appropriate.
You can see here a psychological phenomenon known as “projection”. Another example is Donald Trump.
pp, can you identify the most salient science that makes you believe in AGW?
Try this, Pup:
https://www.ipcc.ch/
willard…IPCC = International Propagandists for Climate Change.
Is there any claim you’d like to dispute, Gordon?
Well pp has produced no science to support his beliefs.
Typical.
Willard: Everything is driven by a hockey stick. According to loads of people.
You sure like to say stuff, Richard.
True stuff apparently
AGW does not rest on trees, Richard.
Proxies based on trees do not correspond at all well with AWG. Unless you have a data url that shows different of course.
Whether I can spoon feed you or not is quite independent from tree rings and AGW, Richard.
Idiot
You might like:
https://neverendingaudit.tumblr.com/tagged/rememberyamal
“Mann seems to have a bit of trouble with this. He thinks his 2008 publication confirms his earlier 1998 paper.
It’s the only field I know where two completely dissimilar results can be seen as confirmation of each other.”
Yup
“In response to your point that I wasnt diligent enough in pursuing the matter with the Russians, in fact, I already had a version of the data from the Russians, one that Id had since 2004.”
Mann 2003 totally ‘proves’ AGW. Or not.
As does Mann 2008 (or not again)
You’re not Carrick, Richard.
https://climatedatablog.files.wordpress.com/2021/07/mann2008.jpeg
https://climatedatablog.wordpress.com/2021/07/04/mann-2003-1400-to-1980/
Ooops.
https://climatedatablog.files.wordpress.com/2021/07/mann2008-1.jpeg
Oups indeed, silly Richard.
Just a small labeling error. The data stays the same.
You’re conflating data with its representation, Richard.
But more importantly, you’re deflecting once again.
It’s a summary of the data to date. Idiot.
Since when filters summarize data, Richard?
You do know what addition is don’t you?
Addition does not summarize, Richard.
And the point you’re missing is that a graph does not stand alone: it’s meant to support something, something that you’d claim.
If you had any honor you’d know that.
prof p…”You can see here a psychological phenomenon known as projection.
Must be a bit of a bummer for you, dropping in to see Roy’s monthly summary, hoping the global average has risen due to the hysteria over heat waves, and see that it has dropped.
Remember, climate is not weather.
BTW…projection is what the IPCC practices. They use unvalidated models to project ridiculous climate catastrophe and it never happens. They once had the temerity to call it a prediction until expert reviewer, Vincent Gray, straightened them out. Pointed out that unvalidated models cannot predict.
If only the clowns using unvalidated models to predict covid catastrophe would clue in.
> expert reviewer, Vincent Gray
You’re a gift that keeps on giving, Gordon:
https://www.desmog.com/vincent-gray/
Willard, please stop trolling.
Compare and contrast:
https://www.drroyspencer.com/2021/07/uah-global-temperature-update-for-june-2021-0-01-deg-c/#comment-747368
So much greatness!
#2
Willard, please stop trolling.
Somewhere else:
https://www.centauri-dreams.org/
I was arguing that advanced spacefaring civilization would not using a lot energy than Earthling currently do. Instead I claim per person
they would use less and when Earthling become spacefaring they will use less energy per person than present earthlings are.
It was somewhat challenging argue this, because if you are spacefaring civilization one access to lot more energy as compared to energy poor planet Earth.
Easier argument perhaps would be spacefaring earthlings will use a lot less “fossil fuels”- because there isn’t any fossil fuels in space- though there a lot Methane- and a fair number of people call natural gas a fossil fuel.
To be exact, instead of fossil fuel, one could say a spacefaring civilization will use less chemical energy- which would include, Methane, Hydrogen, gasoline, and Oxygen {or other oxidizers].
But I would to stick with the harder argument, spacefaring civilization will use less energy than then the present energy starved Earthlings per human creature.
Which leads to different question- will there be AI and would their energy use count as human use?
And to make make harder, yes, as the AI are simply counted different human tools. But alien AI and other alien creatures don’t count as energy used by Humans.
Not counting AI is like not counting the energy used by a talking automobile.
So question really is, if humans have cheaper energy, will that make humans “waste more energy”?
If you have been brainwashed by crazy Lefties, then the answer can only be, yes.
So, yes or no?
Do you believe people have been abducted and probed by aliens?
Just asking.
Baikie’s definitely been abducted and probed by aliens…but he doesn’t seem to have realised it.
There is a lot things I have not realized or understood.
A significant energy costs of not living in or near the tropical region is the costs of heating and cooling building [homes and whatever].
And I was wondering what heating/cooling cost would be for an L-5 colony.
https://space.nss.org/settlement/MikeCombs/SCTHF.html
The High Frontier
Gerard K. O’Neill
THE FUTURIST, February 1976
And Gerard says:
“Electrical energy for a space community could be obtained at low cost, within the limits of present technology, by a system consisting of a concentrating mirror, a boiler, a conventional turbogenerator, and a radiator, discarding waste heat to the cold of outer space.
It appears that, in the environment of a space community, residents could enjoy a per capita usage of energy many times larger even than what is now common in the United States, but could do so with none of the guilt which is now connected with the depletion of an exhaustible resource.”
Gerard seems to feel guilt regarding depletion of resource AND
thinks one would “enjoy a per capita usage of energy many times larger even than what is now common in the United States”
Anyhow, what seems like would cost more energy to heat or cool
an L-5colony?
Now it seems one couldn’t frolic in L-5 fields with full intensity of 1360 watts per square meter sunlight, as such sunlight heats things to 120 C. And in addition lower the intensity of the sunlight reaching the fields of romping. one might control amount sunlight entering the structure.
But it seems one could control amount of sunlight entering structure- fairly easily.
Here:
“A Model IV colony consisting of two cylinders, each 19 miles long and four miles in diameter, could house several million people comfortably. Its atmosphere would be deep enough to include blue skies and clouds.”
I don’t I would want blue skies and clouds, I think black sky would be nice. And seems one could have black sky and have ground lighting.
But I would like others opinion, on whether one would a lot energy for, and would be air conditioning or energy used for heating?
Obviously it depends on how it’s designed, and so asking would it be designed so it’s on the warmer or cooler side of things and then requiring making difference by the need of using some amount energy use to make it so it can be at a comfortable temperature.
gbaikie…”Which leads to different question- will there be AI and would their energy use count as human use?”
AI is programmed by humans, most of whom exist on artificial intelligence. Most would not have a clue what intelligence is, so what exactly would they be programming an AI unit to do?
There is a lot of sci-fi out there about AI, mainly from people who fail to understand the limits of computers, their programmers, and the nonsense residing in most human minds.
We have an example of AI in driverless cars. Based on my lengthy experience with real computer systems, that is computers that actually control things in real time, I think a lot of people are going to be killed by these driverless cars before people clue in to the inherent dangers.
Same with drones.
–AI is programmed by humans, most of whom exist on artificial intelligence. Most would not have a clue what intelligence is, so what exactly would they be programming an AI unit to do?–
Most? Who are the exceptions?
It seems related to meaning of life?
Which seems to me, is on going issue.
I don’t know much about computer programing, but why can’t computers program. Why do we need human programmers?
It seems once that happens we could start imagine them as not just a tool.
They probably are still a tool, but maybe they aren’t.
robert ingersoll…”But science denial is popular these days. Some deny global warming. Some deny the globe itself”.
Don’t know why you alarmists have to exaggerate. I have seen no skeptic on this site deny global warming, it’s the cause of it we are arguing against.
You seem to think AGW theory is science, but it’s not really. Some of it is based on science, like Tyndall’s discovery that certain gases could absorb infrared energy. Tyndall provided a good example of the scientific method by setting up an elaborate experiment to prove his point. However, interpolating his finding to an atmosphere made up of only 0.04% CO2 cannot be done using the scientific method. It’s all based on consensus and pseudo-science.
Since then, no one has used the scientific method to prove anthropogenic warming. They have relied on climate models programmed with inaccurate science to reach errant conclusions. The only argument presented by alarmists is ‘what else could be causing the warming’? I have yet to encounter an alarmist who is willing to look for another cause, or even consider one.
A fascinating analysis of global warming denial indicates 5 stages:
Stage 1: Deny the Problem Exists
Stage 2: Deny We’re the Cause
Stage 3: Deny It’s a Problem
Stage 4: Deny We can Solve It
Stage 5: It’s too Late
Roy Spencer bounces between the second and fourth stages of global warming denial, claiming that solving the problem is too expensive and will hurt the poor.
Gordon appears to have only just crawled out of stage 1 into stage 2.
Beware of people using ‘we’ as applied to solving the alleged global issues. Usually that indicates a socialist hiding his lust for power behind a thin veil of a common good rhetoric.
I found one:
What do I win?
>>using ‘we’ as applied to SOLVING the alleged global issues.<<
"damn it, why won't it read" (c) steve jobs @south park
One way to solve a problem is to dissolve it, Cot.
In chemistry
In alcohol too.
That’s just an intoxicating form of chemistry.
So when you have a beer you’re drinking chemistry, Richard?
The outcome of simple chemistry, sure.
And yeast.
The outcome is a good time, Richard.
Unless you like to drink alone in sadness, but even then.
Idiots talk to themselves or so I am told. You seem to fit that description. Of perhaps its just babbling after all.
Perhaps it might have been wiser to acknowledge that “alcohol is a form of chemistry” was a silly category mistake, old man.
Idiot
Is that chemistry too?
No. That’s a fact.
Chemical facts are not facts, Richie?
You being an idiot is a fact.
No U.
s t . v w
prof p…on the other hand, those who believe humans cause global warming have no scientific proof and rely on butt kissing to the consensus of authority figures.
I have never heard Roy claim solving the problem is too expensive. If I recall correctly, he and John Christy maintain the problem is too complex to understand clearly.
The thing that separates Roy and John from the wannabees is their integrity and compassion. It would have been far easier for either to join the status quo and forget the poor, who will suffer if fossil fuels become limited.
“..those who believe humans cause global warming have no scientific proof and rely on butt kissing to the consensus of authority figures.”
I take it you include Roy and John in this group.
How disrespectful.
Don’t forget that Willard doesn’t like Roy either.
Roy is indifferent to me, Richard, whereas I don’t like you.
Do you like Rush? No, not the Canadian band. This guy:
https://www.drroyspencer.com/2021/02/a-tribute-to-rush-limbaugh/
So you agree you don’t like Roy then.
No, Richard.
I agree that I don’t like you, and this kind of response or yours shows why.
Well the fact that I think you are an idiot is uncontested.
No U, dear Richard.
s t . v w
Gordon,
You might like:
https://contrarianmatrix.wordpress.com/
Willard, please stop trolling…
I cannot find the answer to this question. How long does CO2 stay warm after it has been warmed by sunlight if not rewarded by sunlight? Is it hours, days, years?
The typical cooling rates for the whole atmospheric column are on an order of 1..3K/day
neil…I doubt if you’ll find an answer because there’s no way to measure it. If you read Gerlich and Tsceuschner on that they describe the difficulty of tracking IR radiation to GHGs in the atmosphere. It’s virtually impossible and requires Feynman diagrams.
At 400 ppmv, there is roughly 1 CO2 molecule in 2500 molecules of nitrogen and oxygen. If the CO2 molecule absorbs IR from the surface, and warms, it would seem to have a very short warming life among so many N2/O2 molecules.
You never see the issue talked about re incoming solar. You see a lot of theory about surface IR because its range at terrestrial temperatures contains the frequencies at which CO2 absorbs. However, that area of IR is off the end of the solar spectrum’s IR band and contains very little solar IR energy. I have never heard of that solar IR warming CO2.
On the other hand, the solar spectrum is broad and it should contain frequencies that warm N2/O2 when absorbed by either. I never see that discussed, how much incoming solar warms N2/O2, which make up 99% of the atmosphere.
The IPCC has no mandate to investigate that so most of the funding goes to what it does have a mandate to investigate, the anthropogenic cause of warming.
It’s really a political scam.
> The IPCC has no mandate to investigate that
Worse is that you seem to believe yourself, Gordon:
https://www.ipcc.ch/site/assets/uploads/2018/02/ar4-wg1-chapter2-1.pdf
Willard, please stop trolling.
If this article reports the conclusions correctly, a temperature chart over some 30 year periods can rise or fall based on the suns affect on El Nio cycles. So anyone fitting a trend line to 1979 may be looking at the effects of the sun, not CO2. Interesting use of the word groundbreaking in 2021. https://www.washingtonpost.com/weather/2021/05/08/sun-el-nino-study/
dirk…your link requires a subscription.
I read it for free. (Left hand box)
Ocean oscillations are a HUGE factor in climate/weather. ENSO is the most well-known and studied, but many others have been identified — AMO, PDO, NPO, IOO, AOO, etc.
When one ocean is releasing thermal energy and another ocean is absorbing thermal energy, the two somewhat cancel. But, if two oscillations work together, watch out! This is what caused the “heat dome” over northwest US and west Canada.
The phrase “It’s the Sun, stupid” has been used for years to negate Alarmists, but the phrase should be: “It’s the Sun and oceans, stupid”.
Translation:
AMO: Atlantic Multidecadal Oscillation
PDO: Pacific Decadal Oscillation
NPO: North Pacific Oscillation
IOO: Indian Ocean Oscillation
AOO: Arctic Ocean Oscillation
“If this article reports the conclusions correctly..”
The whole paper is linked right there in the article.
https://agupubs.onlinelibrary.wiley.com/doi/full/10.1029/2020EA001223
Christ, people are lazy. RTFR.
“Its the Sun and oceans, stupid.”
No, it is the sun stupid, the sun warms the oceans. Think of the climate as a pressure cooker, and the pressure valve is El Nino and Hurricanes. The Hurricanes and El Nino rapidly release huge amounts of energy to cool the system. Once that energy has been released, and the oceans cool, the sun goes about warming them again. That is why there are cycles. Energy gets built up and then released, and that cycle has absolutely nothing to do with CO2, nada, zip. It is also why catastrophic warming can never happen unless CO2 can somehow stop Hurricanes and El Ninos.
Anyway, if you remove Water Vapor and the UHI effect, you literally get no warming. Here are many charts, some going back as far as 1880, that show no warming trend even though CO2 has increased by 30% or more.
https://imgur.com/a/CDasqHH
CiL, just wanting to argue with everyone makes you appear as a hyper, unmannered adolescent.
Barry, that is odd, I searched that entire article and CO2 didn’t appear once. Shocking.
https://imgur.com/qJKT0eR
Shocking indeed:
So the PDO does drive global temperatures.
Everything confirms what the cycle nut knew all along, Richard.
Everything just confirms you’re an idiot.
No U.
s t . v w
The paper attests no mechanism for the hypothesis. There is even less work done establishing PDO/climate links. Curve-fitting and conjecture, not much else, and that’s only for the former matter.
The paper references the “hockey stick” graph in figure 4. But there is no such graph in figure 4. What on Earth are they talking about? The work is ill-disciplined once they stray from the topic of expertise (check the authors’ publications).
“at this point we again acknowledge that correlation is not causality”
Blood out of a stone is like getting sense from a statistician.
“Such circulation changes are only likely to intensify in a future with higher tropical heat and moisture at the sea surface, affecting not only tropospheric climate but also stratospheric dynamics.”
Babble away.
You’re my Reply Guy here, Richard, so No U.
Another quote from the paper you have not read:
“We reserve the search for potential pathways for future works, particularly if (as) the 2020 La Nia exists.”
You mean this paper?
https://agupubs.onlinelibrary.wiley.com/doi/full/10.1029/2020EA001223
I offer this in response
https://climatedatablog.files.wordpress.com/2021/07/sunspot.jpeg
That’s not a response, Richard.
That’s just a graph.
That you do not understand.
With which you like to play smug without commiting to anything.
So no honor, once again.
Why would anyone assume that an idiot could have understanding?
Not only you’re JAQing off, old man, you’re begging lots of silly questions.
Idiot
That’s one of them.
OTOH, No U.
s t . v w
Canadas heatwave is a forerunner of what we have to expect in the future if we dont move to zero-carbon as soon as possible.
And the extreme cold events suffered at the beginning of the year were caused by what? AGW also?
“Nearly 500 people may have been killed by record-breaking temperatures in Canadas westernmost province, as officials warn the grim toll from heat dome could rise again as more deaths are reported.”
“Nah”, say the deniers, “nothing unusual here”.
Nah, nothing unusual here. Sure, GW has made the heat wave hotter by a degree or two, which probably made the death toll slightly greater, but that’s about it. Think of all the billions of people that the use of the fossil fuels have saved from the short brutal existence and early death.
“GW has made the heat wave hotter by a degree or two”
At least you acknowledge its contribution. Well done!
“Think of all the billions of people that the use of the fossil fuels have saved from the short brutal existence and early death.”
Should those dead Canadians be grateful!
Stupid argument.
>>Should those dead Canadians be grateful!<<
It is possible they wouldn't have been alive to begin with either, so yes.
Also, I’d think those people had been using fossil fuels and all the tremendous benefits of the civilization that power abundance brings, for all their life. Assuming they are not Amishes, they don’t really have a moral right to complain about the alleged GW-related nature of the fires. Hell, if they were amishes they’d probably be better off as they’d not be so wound up about ‘saving the nature’, since amishes worship the crucified carpenter god and not the mother nature goddess as many people do today, so they’d have no problem putting proper firebreaks around their settlement – that is if they could do it without the tractor powered plows and gasoline chainsaws.
Fossil fuel use allows billions of people to live, saving most lives in most situation where they’d be otherwise lost, but perhaps causing deaths in other situations where supposably they’d not be lost without all the extra GHGs – just like any other great human-thriving-promoting technology, like cars and other industry. So yeah, it’s like a lottery in reverse – overwhelming majority of people get so much better off from fossil fuels, but some ‘win’ a bad ticket. So what? We’re all in this together.
To summarize, it is your arguments that is stupid. People that ideologically live at the pre-industrial level, such as 17th-century-style anabaptist communities or uncontacted tribes, perhaps they have the moral right to complain, bit everyone else doesn’t.
“Nah, say the deniers, nothing unusual here.”
Can you identify a period of time when the weather wasn’t volitile? Hint, the earliest known writings tell the story of a giant flood in Mesopotamia.
https://en.wikipedia.org/wiki/Gilgamesh_flood_myth
What is truly shocking is how Marxists can convince such a huge number of people that a trace gas can cause such harm to the system with so much evidence to the contrary. It is truly a religion of fanatical true believers.
https://imgur.com/a/CDasqHH
“Marxists” ?
Showing your right wing bias are we?
Note that he also conflates Marxists with a religion. I don’t think that idea holds water.
Marxism is a “belief system”. To some, their beliefs become a religion. A false religion quickly slides into a cult.
It’s what we’re seeing with the CAGW crowd.
CAGW is a contrarian meme, Pup:
https://climateball.net/but-cagw/
Labeling someone a “contrarian”, just because they’re not in your cult, is the meme used by idiot trolls, Will.
(Your response time longer than 2 minutes will be ignored. I don’t tolerate incompetent stalkers.)
You ignore all my comments, Pup.
As for “contrarian”:
https://climateball.net/but-semantics/
“You ignore all my comments”
There’s sensible for you.
Why don’t you try it, Richard.
Ignoring idiots. I could try.
Meanwhile, No U.
z
“may have been” is the new scientific standard
Whereas certainty has always been the political standard.
Markus and sb, same question to you that pp has so far dodged: Can you identify the most salient science that makes you believe in AGW?
Answer: the same science that owner of this site (Roy Spencer) believes. If you have a problem with that, take it up with him.
Dr. Spencer has indicated he doesn’t want to contest the physics of the GHE, so he let’s others do that. His expertise in now in developing the new technology of satellite measurements. Being a scientist, he uses the skills he has to debunk the extremist nonsense. He calls himself a “Lukewarmer”.
Are you a Lukewarmer?
“Dr. Spencer has indicated he doesn’t want to contest the physics of the GHE,”
Huh? Show us all proof of that claim.
DMT, are you so DeMenTed that you believe you can just demand things?
I would say you first need some credibility. And, of course, that means that you recognize and accept reality.
So, show us where you have accepted reality?
[PUP THE SKY DRAGON ASKS] Are you a Lukewarmer?
[PUP THE SKY DRAGON SAYS] Are you so DeMenTed that you believe you can just demand things?
4 minutes is much improved, Will.
But you need to do better. No one wants an incompetent stalker.
From your pathetic responses, we can all see you have incorrectly stated Roy’s position on the science. Admit it, you are a lying denialist.
DMT, if I agree to verify my statement, will you agree to share with us why you joined the AGW cult?
Did you join because:
1) You believed you were saving the planet?
2) You have no clue about physics, but you worship NASA?
3) You’re a loser, and joining a cult might make you a winner?
4) Some other reason you will explain in full?
Do you agree?
There is no verification. Admit you are a lying denialist.
All you have to do DMT, is tell why you joined your cult.
Are you ashamed of your cult?
Agree to share why you believe in AGW, and I’ll verify my statement.
Clint R says:
Dr. Spencer has indicated he doesn’t want to contest the physics of the GHE, so he let’s others do that.
Dr. Spencer has indicated that he broadly agrees with the mainstream understanding of the GHE.
It’s also the case that he generally tolerates posters who don’t. One has to wonder how exhausting it must be to balance plausibly mainstream legitimacy without completely alienating the obvious cranks in his base.
In fairness, Roy may not tolerate Pup.
Pup created many socks. Same for Mike Flynn.
I expect every board moderator has to deal with bad apples, but my point was whether one would want to be associated with even the all-star team or is it cranks all the way down.
DMT, Willard, Mark B, please stop trolling.
Infrared Spectroscopy
bob just throws anything out there, hoping it will make sense. He doesn’t understand any of the science. Let’s help him out:
“Inverse Frequency Modulation”
Just wait until Richard grill you about that expression, Pup.
I didn’t know we were talking about recording color moving pictures on optical disks.
Clint R,
I am sure that “Inverse Frequency Modulation” has something to do with the enhanced greenhouse effect.
Not sure what though.
CLint R is baffling with bullshit again.
Decreasing modulation index?
I’m trying to help poor bob with his perversions of reality. He seems to be stuck. He doesn’t know what nonsense to try next.
Try this: “Heterodyned doppler depreciation”.
Always enjoy this game of random technobabble generation.
https://www.makebullshit.com
No results found for “Heterodyne doppler depreciation”.
Ent finally got it!
RLH, try “Hamiltonian cheeseburger with quantum onion rings”.
No results found for “Hamiltonian cheeseburger with quantum onion rings”.
A positron emission tomography scan of Clint R’s brain after ingestion of 2-fluor-2-deoxyglucose indicated no cerebral activity
bob, please stop trolling.
The only reasonable expectation of what might happen in the future is that of anthropogenic climate change adherents conflating every extreme weather event with climate change.
The notion climate change is driven by carbon dioxide is an extraordinary popular delusion. There is very little scientific evidence to support anthropogenic climate change.
As the fable of Chicken Little is meant to demonstrate, for every extraordinary popular delusion there is a fox. The problem occurs when I get dragged down because of your stupidity. Otherwise I couldn’t care what you believe.
For every Chicken Little (I wonder why cranky uncles never saw the movie) there’s a Cassandra.
Willard, please stop trolling.
A tropical storm is forecast to bring heavy downpours to the Gulf of Mexico coast on July 7 (possibly overnight).
https://earth.nullschool.net/#2021/07/07/1000Z/wind/isobaric/700hPa/overlay=precip_3hr/orthographic=-85.84,29.75,5960
The same mechanism (blocked jetstream) that brings summer heat to Canada will bring extreme cold to North America in winter. The cause is a very weak solar wind, which affects the pressure spikes over the Arctic Circle.
https://www.cpc.ncep.noaa.gov/products/stratosphere/strat_int/gif_files/gfs_o3mr_150_NA_f000.png
https://www.cpc.ncep.noaa.gov/products/stratosphere/strat-trop/gif_files/time_pres_HGT_ANOM_ALL_NH_2021.png
“The cause is a very weak solar wind, which affects the pressure spikes over the Arctic Circle.”
That can’t be correct. It somehow has to be tied to CO2 or else the researchers would lose their funding. Somehow they must not have gotten the memo, and are most likely now re-writing their conclusion. I’m sure Winston Smith is working on it already.
“The AMO is correlated to air temperatures and rainfall over much of the Northern Hemisphere, in particular in the summer climate in North America and Europe. Through changes in atmospheric circulation, the AMO can also modulate spring snowfall over the Alps and glaciers’ mass variability. Rainfall patterns are affected in North Eastern Brazilian and African Sahel. It is also associated with changes in the frequency of North American droughts and is reflected in the frequency of severe Atlantic hurricane activity.”
ren…”The same mechanism (blocked jetstream)…”
ren…how does a blocked jetstream prevent hot air from rising, so it forms a dome?
What do you think of the suggestion posted here that heat from the Iceland volcano is related?
At one point, Portland, Oregon (inland) was 42 C while Astoria, Oregon, near the Pacific Ocean was only 18 C. This was a pocket of hot air sitting over a large area. How does that happen? Where did the hot air come from?
The suggestion of a dome, used by meteorologists, suggests a greenhouse effect. But how can atmospheric gases trap heat? Glass can, but not gases.
For you alarmists, why did the GHGs not radiate the heat to space?
It is difficult to prove that the solar wind pushes ozone away from the Arctic Circle. This affects the circulation in the lower stratosphere and upper troposphere. Just as water vapor affects circulation in the troposphere, ozone, which is a heavy gas (O3 – molecular weight 3×16=48), affects circulation in the stratosphere. The difference is that water vapor rises upward to the stratosphere, while ozone sinks toward the poles. Ozone is produced in the upper stratosphere and falls in the lower stratosphere toward the poles.
https://www.cpc.ncep.noaa.gov/products/stratosphere/strat_a_f/gif_files/gfs_t01_nh_f00.png
https://www.cpc.ncep.noaa.gov/products/stratosphere/strat_a_f/gif_files/gfs_t100_nh_f00.png
Spencer Quote:
“Despite the near-normal global average temperatures, the USA Lower 48 temperature anomaly of +1.44 deg. C was the warmest in the 43 year satellite record, ahead of +1.15 deg. C in 1988.”
My comment:
About one inch above that claim, the November 2020 anomaly showed +1.45 deg. C.
Since +1.45 deg. C. for the USA Lower 48 is higher than +1.44 deg. C,. how is +1.44 deg. C. “the warmest in the 43 year satellite record” ?
Maybe this requires math that I don’t understand?
An oversight, obviously.
less waffle is good.
Watch the nature around you extensively. My observation which I assume is related to climate cooling is the reproductive cones on cedars in Lebanon this year which are appearing more this year and even on cedars that are on low altitude of 250 meters above sea level. Cedars are known to be a climate sensitive
Jihad Choufani
” Watch the nature around you extensively. ”
That is exactly what we do here in Germany.
No climate cooling here, except a slight one in the spring during the last three decades.
But in opposition to you, viewing Lebanon’s cooling as a prototype for the global climate, I view Germany’s strong warming during winters as a phenomenon rather local to Eurasia.
It is always wrong to think, like do North Americans, that the Globe is similar to your local corner.
See e.g.
https://postimg.cc/hfWYfbSR
(no area weighting here, superfluous)
versus
https://postimg.cc/VdwWMK21
(with area weighting, imperative here)
J.-P. D.
MOAR PROOF THAT CLIMATE IS GETTING BETTER AND BETTER
https://grist.org/science/is-climate-change-amping-up-the-pacific-northwest-heat-wave-yes-and-its-time-to-stop-asking/
I prefer a more percussive analogy: putting a hammer in a washing machine.
Witless Wee Willy,
You wrote –
” . . .concluding that climate change made almost all of them more likely or more severe.”
You don’t seem to realise that “climate” is the average of weather, which includes things like “heat waves”, “cold snaps”, wind, precipitation, and all other weather parameters.
Of course the “climate” changes, nitwit! It’s an average of something that has already happened!
Oh well, you lose at “climateball”, “silly semantic games”, and “auditing”.
No doubt you should just play with yourself more often. That way, maybe less people will be inclined to think you are a complete idiot. Just a complete wanker.
You don’t need to thank me for the tips.
swenson…”No doubt you should just play with yourself more often”.
Appears he does play with himself, feeble mindedness has set in. Wonder if his eyesight is deteriorating as well?
Good morning, Mike Flynn.
You’re taking your Saturdays off?
willard…more fiction from Andrew Dessler, one of the more stupid alarmists. He claims the onus is now on skeptics to prove the heat waves are not related to global warming but he has yet to prove, using valid science, there is a relationship.
The proof they offer is based on models and statistical analysis involving probability. Not a shred of proof as to where the heat dome originated or why it stayed over the Pacific Northwest. And not a shred of proof as to how 1C warming over 170 years can amplify temperatures to 10C above the norm for an area.
Plain stupidity.
Dessler strikes me as being a stupid person, lacking the ability to think intelligently. Let’s not talk about the messenger, a known idiot.
> The proof they offer is based on models and statistical analysis involving probability.
That’s how it goes, Gordon.
Got a problem with that?
Well some people might not like the current situation but it seems everyone agrees was much worse in pre-industrial times.
Even Cubans are driving around in late-industrial times cars.
I am not seeing any fad for using horses, perhaps it’s not far enough back in time to count as these pre-industrial times.
And Germans as an minority, in particular, seem to always pine for quite ancient times.
The chicken little analogy is more apt.
Unfortunately the kings are in bed with the foxes..
Putting a chicken in a washing machine would be cruel, Phil.
So would putting a fox in instead.
Good luck with that.
First – catch a fox.
Good luck with that.
Repetition – you lose.
Were we playing questions, Richard?
Just a Minute
Pure banter breaks the spirit of that game, Richard.
Also think about how the Deviation rule would forfeit all your comments.
You’re not the chairman however.
And you can’t keep score properly, Richard.
The scorer keeps score.
They sure can pretend, in which case you’re a perfect fit.
You don’t have to pretend to be an idiot. You are one already.
No U.
s t . v w
Climate caused catastrophes – it’s just like this
https://youtu.be/f3HebsWpZ1Q?t=37
CO2…can’t watch soccer anymore, I played the game for years and was a typical soccer nut. Today’s game is not soccer, it’s a load of sissy runners, with no ball skills, chasing a ball.
The heat wave in Vancouver, Canada is gone and the climate is still the same as it has always been. There is no evidence of any climate change in Canada. Changes in weather patters…yes …but not in climate.
The analogy of fake drama probably flew right over your head ,
The claim global warming caused the heat wave when the global temperature is below the average base line is like claiming you were run over by a parked car.
On the related note – Canada after the historical heat wave declares the state of faggotry
https://i.postimg.cc/JnMbsWLv/1625360743585.png
..and you are still a nut case.
Gordon, you may like my “soccer story”.
I had always enjoyed “backyard” soccer. But my high school didn’t have organized soccer. In my senior year, we got transferred to a larger city where the school had soccer. I decided to try out for the team.
After about three practice sessions, I noticed that the other players seemed to enjoy kicking the crap out of my shins. I was dating one of the cheerleaders, and soon decided I would rather sit on the sidelines with my girlfriend and WATCH soccer.
It was a good decision….
“Football is governed internationally by the International Federation of Association Football”
willard…re your article from Moyhu on Tony Heller…
Nick Stokes states…
“In one of Steve Goddard’s posts at WUWT, there was some mocking of interpolation in GISS. “Is the temperature data in Montreal valid for applying to Washington D-C.? ” was asked.
Well, it turns out, yes it is, using anomalies. I looked in the raw GHCN data at McGill Montreal (71627/003), which has the only long GHCN record there, vs Washington NA (WMO 72405/000), which also has a very long record. I used a 4-year tapered smoothing filter (triangle) on the monthly data. Here’s how it turned out:…”
***
It is sheer insanity to interpolate the temperature data from Montreal to cover Washington, D-C, some 600+ miles apart. I don’t care how well they correlate over a few years, it is plain stupid to presume that will always be the case. Furthermore, the GHCN record has been fudged since 1990, therefore Stokes is likely using fudged data. In other words, he is using data that has already been interpolated and homogenized.
Stokes has ignorantly missed Heller’s point, which is not about the interpolation using Montreal and Washington alone, but the wholesale usage of interpolation and homogenization by NOAA and GISS to infer a global average using many stations. In one case, they interpolated a temperature for Bolivia, which has considerable altitude, from sites at lower, warmer altitudes.
part 2…
Nick Stokes aka Moyhu is a nut job who thinks a global average can be calculated using 60 stations (1 station per 8.5 million km^2). He can only claim that if the global average has already been calculated so claiming to do the same with 60 stations is an idiotic exercise in working toward numbers that are already known.
I could do that myself through judicious cherry-picking of certain stations.
Are you alarmists all this stupid?
Once again, Tony Heller is a highly qualified professional who worked at Intel as a quality control expert. Who the heck is Nick Stokes, someone who uses a name from fiction and reveals nothing about his background and abilities?
ping
http://rankexploits.com/musings/2014/how-not-to-calculate-temperature/
So yeah, that’s the kind of “expert” you’re rooting for right now, Gordon.
willard…”he [Heller] is simply averaging absolute temperatures rather than using anomalies. Absolute temperatures work fine if and only if the composition of the station network remains unchanged over time. []
His second error is to not use any form of spatial weighting (e.g. gridding) when combining station records. []”
***
Duh!!!! Anomalies are preferred to absolute temperatures. Double-Duh!!!
Heller, an expert in statistical analysis did not use a form of spatial-weighting (gridding).
Triple duh!!!
Why the heck does anyone need to weight anything when the exact absolute temperatures are available? Oh, yeah, they’re not available…the oceans cover 70% of the Earth’s surface and they cannot cover it adequately, so they use statistical analysis to guess the temperatures in grids. They can’t even cover the surface where thousands of real stations are available but not used in lieu of guessing the temperatures of the areas represented by real thermometers.
The purpose of this cheating is obvious. Alarmists get to replace temperatures of colder areas with warmer temperatures from warmer areas.
So, you are agreeing with this pseudo-science that it is good enough to guess temperatures using interpolation and homogenization, the basis of gridding.
You know the real problem? You and your alarmist authority figures are too stupid to understand the difference between real temperature data and synthesized data.
How do you imagine UAH data can be used to form averages for continents and heights in the atmosphere? Like all data, it represents samples of averages over certain horizontal and height scales. It is not an infinite collection of data points. To form the larger scale averages, some assumptions have to be made. That is the basis of synthesis. Now do you understand? Otherwise you are arguing that averages must be, by definition, meaningless. Is that what you really think?
When you talk about “real temperature data”, do you mean the collection of point observations? If so, nobody would be allowed to draw a map!
Use USCRN for the USA rather than UAH if you wish.
https://imgur.com/m39TvP8
That’s your wish, Richard.
Quit projecting.
Just offering an alternative land based data source.
Just putting your own wishes into your interlocutor’s mind, Richard.
Idiot.
You’re a dishonorable man, Richard.
You’re just an idiot.
No U.
z
> Why the heck does anyone need to weight anything when the exact absolute temperatures are available?
What did you just told me, Gordon?
Do you have access to EXACT ABSOLUTE temperatures?
Where?
While you search for them, have another cookie:
http://rankexploits.com/musings/2014/how-not-to-calculate-temperatures-part-2/
USCRN produces absolute temperatures that cover the whole of the USA.
https://imgur.com/m39TvP8
You’re missing the exact part, Richard.
Notwithstanding the rest of the Earth, of course.
I though you were able to interpolate to make up the rest. My bad obviously.
And I thought you understood why Gordon insisted on having exact absolute temperatures, Richard.
You mean that interpolation is NOT able to create such detail. You must tell those who think it is.
I mean you will NOT be able to coatrack your actual pet topic, Richard.
You can still try.
Which topic would that be? Low pass filters as an accurate summary of data to date?
The topic is “Why the heck does anyone need to weight anything when the exact absolute temperatures are available,” Richard.
You sure can try to peddle other topics.
Is that a cycle you are pedaling?
No U, Richard.
s t . v w
Gordon Robertson says:
Once again, Tony Heller is a highly qualified professional who worked at Intel as a quality control expert. Who the heck is Nick Stokes, someone who uses a name from fiction and reveals nothing about his background and abilities?
It saddens me that the layers of irony in this post are not intentional.
Nick Stokes is his real name. Specialises in fluid dynamics.
https://www.researchgate.net/profile/Nick-Stokes
Gordon’s arrogance is vying mightily to outdo his ignorance, but I don’t think it’s going to happen.
“It is sheer insanity to interpolate the temperature data from Montreal to cover Washington, D-C, some 600+ miles apart. I don’t care how well they correlate over a few years, it is plain stupid to presume that will always be the case.”
Furthermore it takes no account of weather systems/fronts and their timings that cover one but do not cover the other.
Time as well as distance counts here.
> Furthermore
That’s where you’re wrong, Richard.
How long does it take a weather system to cross between Montreal and Washington, D-C?
Go raise your concerns to Nick, silly data thug:
https://moyhu.blogspot.com/2010/07/if-its-hot-in-washington-how-about.html
No answers to simple questions I note. Just an expectation that others can do the work for you.
This ain’t your class, old man.
You have no class at all. Just stupidity.
No U:
https://s3-us-west-1.amazonaws.com/www.moyhu.org/blog/westnet/Montreal.jpg
s t . v w
“Putting a chicken in a washing machine would be cruel, Phil.”
Hello Willard,
No doubt. But not as cruel as letting Texans freeze in the dark rather than cranking up the coal power plants…
People died because companies were not “incentivized” to weatherize their plants, Phil, and it may not change soon enough:
https://www.texastribune.org/2021/06/03/texas-electricity-bills-winter-storm-legislature/
Rejoice: the power of capitalism at work!
studentb…”Nearly 500 people may have been killed by record-breaking temperatures in Canadas westernmost province, as officials warn the grim toll from heat dome could rise again as more deaths are reported.”
A month ago, around her in BC, they would have blamed those deaths on covid. Since July 1st, they have moved into a new phase, allowing casinos and the likes to re-open, not requirement to wear a mask, so they can no longer blame anything on covid.
I accept the fact that some poor souls, likely the elderly stuck in an apartment with no ventilation, have died. Extremely sad. The real sad part is that nothing was done to reach out to those people other than the warning of a heat wave. They offered cooling centres but no effort was made to check on the people who died.
I can understand part of the reason. We have never had such a heat wave here in the Vancouver since the 1930s and we likely won’t see another in June for another 100 years. But why do we wait till people die before we become aware?
People have died from the common flu by the thousands over the years and no one gave a damn. 25,000 people died from the common flu in Italy during the 2016 – 2017 season and nothing was done about it. When the same thing happened with covid in the Milan area in 2020, overwhelming medical facilities, all hell broke loose, not only in Italy but around the globe.
It was not till covid came along and the bean-counting epidemiologists were allowed to act like petty dictators that deaths related to a virus became an issue.
Are we now going to be subjected to alarmist climate clowns infringing on our democratic rights?
Frog in a beaker talk – (soon to become frog in a blender)
“The real sad part is that nothing was done to reach out to those people other than the warning of a heat wave”
Amazing! This is exactly what so-called alarmists want!
They warn of the predicted warming and its effects, and demand that something be done to ameliorate it. So, Gordon, my boy, you may be beginning to see the light!
Never noticed so-called alarmists wanting to subsidize unnecessary air conditioners?
DMT and pp, what is your best evidence that CO2 caused the heat dome?
Lying denialist.
You have no evidence then?
Which evidence would convince you, Pup, and do you realize that your question makes little sense?
You have no verification of your claim re. Roy Spencer.
I repeat, lying denialist.
DMT, here’s where this started. My offer still stands. Do your part, and I’ll do mine.
http://www.drroyspencer.com/2021/07/uah-global-temperature-update-for-june-2021-0-01-deg-c/#comment-745042
As you may have noticed, your attempted insults and slanders have no effect on me. That’s just an indication that you have NOTHING,
Whereas you have no science.
Where I think Clint R is wrong on almost all the topics he posts about (GHE, Moon rotation)
On this one I would agree with his conclusion. But not just him, you have an expert meteorologist agreeing.
https://tinyurl.com/ykrcsxkt
And also look at history. Severe heat waves are not unusual and occur somewhere on this globe on a regular basis.
https://en.wikipedia.org/wiki/List_of_heat_waves
It is a bad day when one agrees with Clint R on anything.
Agreed
Norman, you’re trying to think for yourself. That’s good.
Just try to avoid letting others think for you. That’s what gets you in trouble. Don’t be afraid of reality. Embrace it.
You’re too quick to throw out simple examples and analogies. The ball-on-a-string is NOT rotating about its axis, no matter how many idiots claim it is. Earth is NOT 33K hotter than it’s supposed to be, no matter how many idiots claim it is.
“ball-on-a-string” has nothing to do with the Moon.
RLH provides a great example of throwing out the simple analogy that proves him wrong.
ball-on-a-string is not an analogy of anything other than a ball-on-a-string.
Wow RLH, a 1-minute response time! Very impressive.
You get to be my new stalker. Willard doesn’t understand the difference between “stalking” and “slacking”. He’s fired.
Now, don’t let me down….
Chance does a lot of things. Including me posting soon after you do.
Clint R
And yet a horse must rotate on its axis as it moves forward to run in a circular path just as you must if you walk around a tree. The ball on the string analogy is not comparable to the Moon around the Earth. You can take a can of food. If you move it around another can in a circular path (orbit) you will have to rotate it as you move it in the circular path to keep the same side facing the central can. These are things you can do now.
The Earth surface is much warmer than solar input can cause it to be. The Earth surface radiates away more energy than it receives from the Sun. I have shown you this already. You do not wish to accept the facts.
I do agree that concluding extreme weather events are caused by global warming is unscientific conjecture. It does not mean global warming may not be responsible for some extreme weather, it is just not a scientific conclusion as the evidence is not sufficient to warrant these conclusions. Too little data.
On the GHE I will offer again data that clearly shows it as fact.
https://gml.noaa.gov/webdata/tmp/surfrad_60e1d0ca3ff15.png
The incoming solar is not enough energy to sustain the continuous upwelling IR without GHE (added downwelling IR) which reduces the energy lost to a much smaller value.
When you add DWIR the Solar input exceeds the NET IR loss. The remainder of the surface energy loss is by both evaporation and convection.
https://gml.noaa.gov/webdata/tmp/surfrad_60e1d18902eb5.png
> I do agree that concluding extreme weather events are caused by global warming is unscientific conjecture.
I’m sure you can find a more plausible caricature, Norman. Here’s what you need to ridicule:
https://nca2014.globalchange.gov/highlights/report-findings/extreme-weather
Okay Norman, there’s a lot of confusion there. Let’s take it one point at a time. If you go off in different directions, or deny reality, I’m gone. I know I can’t teach physics to idiots. Stay focused, if you truly want to learn.
Let’s start with your first sentence — “And yet a horse must rotate on its axis as it moves forward to run in a circular path…”
That’s WRONG.
You believe the horse is rotating because you are viewing from the wrong reference frame. You are viewing from the “fixed stars”. The fixed stars cannon differentiate between “revolving” and “rotating”. That’s why the ball-on-a-string is so useful. Like Moon, and the horse, it always keeps one side facing the inside of its orbit. BUT (and this is the point you refuse to consider) the string is NOT wrapping around the ball. If the ball were rotating, the string would wrap around it.
This an experiment that you can actually do for yourself.
Before I go on to the rest, see if you can understand this simple concept, without going off on tangents or perverting reality.
Clint R
On the horse. No it is not the perspective, it is the reality of what the horse does with its legs. Far better for you to do it yourself and forget the horse. Go outside and walk around a tree. Observe your feet as you walk. You lift your foot and MUST pivot (rotate it) for you to move around the tree. As you place your foot on the ground the rest of your body pivots (rotates) to match your foot.
A horse running will continue to move straight ahead with no rotation. It rotates its body to move in a circle just as you do. Observe that as you rotate your body as you walk around the tree the same side of your body faces the tree.
If you do not pivot (rotate) your feet as you move around the tree every side of your body will at some point face the tree.
You are obsessed with the wrong analogy (ball on string). You already know it does not explain at all the Earth’s orbit around the Sun. It is not a practical or good analogy to describe how gravity acts on planets and moons. Why you think it is so good is one to ponder.
Norman, you discard the simple analogy because it destroys your cult nonsense. You are so lost you even linked the simple analogy to Earth! (Earth rotates about its axis, Moon does not.) As I warned, once you start perverting reality, I’m gone. I can’t teach physics to idiots.
If you can’t understand the simple stuff, you can’t understand the surfrad stuff. Today is a celebration of freedom. You are free to be an idiot.
Let me know if anything changes.
You don’t do the Pole Dance Experiment because it would defeat your Moon Dragon crap, Pup.
Clint R
I reject the “ball on the string” simply because it is not a good analogy for gravity.
Did you walk around a tree yet and observe you feet (they rotate).
You see unscientific idiots and cults all around you. Do you know why this is? It is because you are projecting what is within you outside. I gave you very rational points (like walking around a tree and watching your foot rotate as you do this). Rational logical thought are not your strong points. Cult mentality and idiotic posts seem your specialty.
Norman, this is why I no longer try to teach physics to idiots. You can’t learn. You just keep repeating the same things over and over, or else you come up with another way to pervert reality.
I’m going to address a couple of your misconceptions, but then I won’t respond to any more of your nonsense.
The ball-on-a-string is a model of “orbital motion without axial rotation”. That’s all! It is NOT a model of Moon, Earth, gravity, or anything else. Quit trying to pervert that reality. The fact that none of you Spinners can provide a workable model of “orbital motion without axial rotation”, should tell you something. But you can’t face that reality.
Walking around a tree, your feet are supplying the centripetal force supplied by gravity in an orbit. Gravity changes the direction of the orbiting body. Gravity does NOT produce axial rotation.
Like I stated, I won’t respond to any more of your nonsense today. Insult me and pervert reality as much as you like. You’re free to be an idiot.
Clint R
No a ball on the string does not represent orbital motion without axial rotation.
Orbital motion with no axial rotation would have all sides of the Moon face the Earth as it orbited.
Why is it difficult for you to accept that the reality that when the Moon rotates once on its axis per orbit it will keep the same side facing Earth? You can do it with a can of soup and see.
You persist in a deluded thought and falsely think you can teach physics. Tim Folkerts can teach physics. You don’t know enough to teach anyone including yourself. You just make up ideas based upon your limited reasoning skills and what you think are common sense.
Norman believes: “Orbital motion with no axial rotation would have all sides of the Moon face the Earth as it orbited.”
Then if you apply that nonsense to Earth/Sun, Earth is then not rotating!
That’s why Norman is an idiot.
NO way no how does the moon rotate on it’s axis in relation to the earth…. it is tidal locked and will likely always be unless some event strikes it. It rotates about the earth but in relation to the earth it is does not… but the earth does.
You agree with a question, Norman?
Willard
I agree to his point to question DMT fanatic stance like blaming the hundreds of deaths on global warming. If you look at the historic record many people have died from heat waves in the Earth’s cooler years (2 F cooler). Fewer die today because we have invented climate control systems like air conditioning.
I do agree the globe is warming. I accept additional CO2 is the most likely cause. I disagree with the media and fanatics who peddle bad science like extreme weather events are caused by the global warming.
On the previous thread you posted this:
http://www.drroyspencer.com/2021/06/new-nasa-study-earth-has-been-trapping-heat-at-an-alarming-new-rate/#comment-745931
It seems you might lack some reading comprehension as you form your conclusions.
You incorrectly claimed I said the heat wave in the Northwest was a 1 in 3 year event. No I made NO such claim. I said Portland Oregon had temperatures 100 F or above that often.
Then you put a quote in this post that I never actually said.
YOU: First you tried the current wave is a 1 out of 3 years event. Then you switched to we do not have have enough evidence. Now youre into we do not have evidence at all.
And then I looked into some of the claims on Carbon Brief. As always the studies are limited in scope.
For South African droughts I found this one.
https://www.jstor.org/stable/204770
For the heat wave in Sweden I found it was hotter in the past this just had more hot days.
“Sweden’s hottest temperature ever 38C was recorded in 1933 and 1947. This year shows no sign yet but this month does have in total the highest number of days over 30C.k”
From:
https://www.thelocal.se/20180723/sweden-heatwave-hottest-july-in-at-least-260-years/
Norman,
Sky Dragons lie at the extreme side of the contrarian spectrum. But on the contrarian spectrum they lie, along luckwarmers, cycle nuts, and all the other contrarians. Today you’re helping me build my “but extreme events”:
https://climateball.net/but-extreme-events/
Whether you or Pup peddle contrarian crap is immaterial to me.
As for your recent denial, here’s what you said:
https://www.drroyspencer.com/2021/06/new-nasa-study-earth-has-been-trapping-heat-at-an-alarming-new-rate/#comment-742596
You can count this as the first time the rooster crows between us.
A contrarian is anyone who disagrees with full blown AGW.
Not really.
Willard
Yes your exact quote of what I said is correct. I DID not make the claim the current heat wave of 110 F+ temperatures took place every 3rd year and I am not sure how you could assume that from what I correctly stated.
It is not contrarian to ask for more data to prove a conclusion. Especially when dealing with very rare events (things that might take hundreds of years to reoccur, like a super heavy rain in some location).
You seem to suffer you own error of reasoning:
https://en.wikipedia.org/wiki/Jumping_to_conclusions
Maybe you need to include that to your list.
> I am not sure how you could assume that from what I correctly stated.
I assumed that what you said was relevant to the issue at hand, Norman. Here’s how the dialog progressed:
[D] More than 230 deaths have been reported in British Columbia since Friday as a historic heat wave brought record-high temperatures, officials said Tuesday.
[N] Maybe look at historical data. Here is a list of yearly all time highest temperatures in Portland. […] This record does not indicate a heat wave or duration of hot weather, it is just the hottest temperature recorded for a given year.
[W] How frequently?
[R] Idiot.
[N] In my count I got 51 temperatures in Portland Oregon 100 F or above out of 145 years. That would be more than once every 3rd year.
Informal dialogues are a cool tool:
https://andthentheresphysics.wordpress.com/2019/06/06/estragon-and-the-expert/
So it’s clear that you were (and still are) minimizing. If you could own what you do, that’d be great. We’d both save time.
Willard
https://en.wikipedia.org/wiki/List_of_heat_waves
Once again look at actual data, information before making a conclusion.
The facts are heat waves over the globe are common. Frequency is high in the record. Look at the deaths long before the globe warmed 2 F.
“1901 – 1901 eastern United States heat wave killed 9,500 in the Eastern United States.”
We have mitigated deaths from heat waves with air conditioning run with reliable power.
10 years later
“1911 – 1911 Eastern North America heat wave killed between 380 and 2,000 people.”
https://www.weather.gov/ilx/july1936heat
You can dig up more if you so desire.
You fail to understand that outright denial and fanatic belief are both dangerous. No action or no concern or ignoring evidence are bad but so is fanatic beliefs based upon emotional mental states.
The acatual rate of sea-level rise is 3.6 millimeters a year with some acceleration of rate which is still very small. It will take 278 years (at this rate) to rise 1 meter. New York City is 10 meters above sea level. But images coming from the alarmist world (not the science one) show New York City underwater. You have people like Greta (and others) who see these images and it terrifies them. They believe this will happen in their life time and become fanatic. You saw what fanatic beliefs can do on January 6th. Most people do not have the scientific rational mind and feeding people information like there will be constant horrible heat waves that kill thousands continually is dangerous in that it creates fanatic belief states that are no longer bound with rational or logical processing and are liable to cause destruction driven by their blind fears.
https://www.dailymail.co.uk/sciencetech/article-3504667/New-York-London-underwater-DECADES-Scientists-say-devastating-climate-change-place-sooner-thought.html
This type of manipulation and fear-mongering will create fanatics that are no longer rational.
> You fail to understand that outright denial and fanatic belief are both dangerous.
Bothsidesism won’t do, Norman, and your squirrels should take frequency into account. As Barry suggested earlier, RTFR:
https://www.ipcc.ch/site/assets/uploads/2018/03/SREX-Chap3_FINAL-1.pdf
Yeah, I noticed the last sentence.
That’s the third time the rooster crows.
Be seeing you,
Willard, please stop trolling.
Good climate news this week:
1 EU adopts net zero by 2050 climate law
2 Indonesia to introduce new carbon tax
3 Canada bans new petrol cars from 2035
4 Oregon goes 100% renewables by 2040
5 Chinas biggest bank ditches Zimbabwe coal plant
6 EBRD stops funding upstream oil & gas
studentb…”3 Canada bans new petrol cars from 2035″
Any political party trying to enforce that will be out of office real quick. The governing party, the Liberals, lead by Justin Trudeau, his mother’s son, not his father’s son, is facing an election soon. He leads a minority government propped up by idiots.
The Liberals are fear-mongering about climate change. The former environment minister, a blond female, was referred to as a Climate Barbie. She was that superficial.
The problem is, the only alternative, the Conservatives, are just as stupid. For some reason, they are mired in the past re social programs, and their leaders are so witless they cannot relate to the average Canadian.
The same Trudeau, who talks about banning gasoline-driven cars, also supports oil pipelines. It’s all about politics. AGW is a political hot potato with no scientific substance.
Hey? What’s the relevance of these snarks:
“Justin Trudeau, his mother’s son, not his father’s son,”
and
“The former environment minister, a blond female..”
Gordon, why are you so perpetually angry and mean? Get a life man.
“The problem is, the only alternative, the Conservatives, are just as stupid. For some reason, they are mired in the past re social programs, and their leaders are so witless they cannot relate to the average Canadian.”
Conservative are basically using a flower to stop a train.
As Trump would say, low energy.
The Conservative need a Trump. But they will also hate the Trump.
All pols are very lazy and witless creatures.
Or use a better word, evil.
Yeah only solution is using lamp posts to hang them every once in a while.
Though I think it would be a lot better to just become spacefaring civilization.
gbaikie…”The Conservative need a Trump. But they will also hate the Trump”.
***
They had a decent leader in Stephen Harper but he was not really a Tory. He came from the Alberta Reform Party, and since they have reverted back to real Tories they cannot produce a viable leader.
I could not believe an ad from a Tory leadership candidate recently. He came out with videos promoting his relationship with his mother…aka known as motherhood and apple pie. Tories are that naive, they think Canadians will fall for that schlock while substance is lacking.
Doh!!! Exactly what every Canadian wants, a momma’s boy as leader. We already have one and he’s willing to support social programs while the Tory leader wanted to support only corporations. That’s why the Liberals have thrived, they know to support the people as well as the corporations, a lesson that might be learned by Republicans in the US.
I know Trump was even worse in that way but at least he was willing to shed political-correctness and say it like it is.
“That’s why the Liberals have thrived, they know to support the people as well as the corporations, a lesson that might be learned by Republicans in the US.”
It seems, pol seek support rather any pol anytime in history supporting anything, other than things like, Joe Biden supporting crackhead son- if the deal includes Joe getting part of the money.
AOC was against her grandmother getting money from a GoFundMe to fix her roof. That is not strange. That is what all pols are.
So, going to whine more or less?
>AGW has made the heat wave at least two degrees hotter….LOL.
No heat wave here. It was a nice 75F yesterday and more of the same today.
Croak! croak! I hear.
Frogs?
Yes, an oblivious frog.
stephen…”No heat wave here. It was a nice 75F yesterday and more of the same today”.
Anthropogenic warming is not only elusive, it is quite variable. That is, here today, gone tomorrow.
NEXT ICE AGE UPDATE
https://usanewslab.com/science/west-gets-hotter-days-east-hot-nights/
USCRN will show it soon.
https://imgur.com/m39TvP8
Cycle nuts always agree, at least on a periodic basis.
Whereas idiots like you are always idiotic.
No U is the ultimate fixed point.
s t . v w
is the ultimate answer
As long as it suits yourself, Richard.
Hearts, Clubs, Spades or Diamonds?
Whatever is forever:
https://www.scientificamerican.com/article/modern-alchemists-turn-airborne-co2-into-diamonds/
What has manmade diamonds to do with AWG?
Sorry AGW.
Why do you keep asking silly questions, silly Richard?
Because ‘stupid’ keeps replying.
Here’s a hint, silly Statler:
https://www.bbc.com/future/article/20200616-how-iceland-is-undoing-carbon-emissions-for-good
Keep askin’ silly questions.
Iceland has rather cheap energy/electricity.
https://www.theglobeandmail.com/globe-drive/culture/technology/why-steaming-hot-iceland-has-very-cheap-power/article593551/
https://en.wikipedia.org/wiki/Energy_in_Iceland
“Iceland” starts with “Ice”:
https://en.vedur.is/climatology/iceland/climate-report
“About 85% of the total primary energy supply in Iceland is derived from domestically produced renewable energy sources. Geothermal energy provided about 65% of primary energy in 2016, the share of hydropower was 20%, and the share of fossil fuels (mainly oil products for the transport sector) was 15%.”
“Iceland pulled off one of the biggest shocks in international soccer history Monday by beating England 2-1 at the Euro 2016 tournament. Here are five reasons why the Nordic nation should be your new favorite team.”
https://www.nbcnews.com/news/world/iceland-beats-england-euro-2016-5-things-love-about-nordic-n600126
Deflection is, as usual, your standard fare.
You’re the one who’s been deflecting, dummy.
Football is a deflection from Energy supply. Idiot.
And energy supply is a deflection from carbon capture, dummy.
Well you brought it up.
“At present, three aluminium smelters, two manufacturing plants and the energy company Reykjavik Energy are investigating becoming carbon neutral by 2040.”
> You brought it up
No I didn’t, Richard.
Look. You asked me how producing diamonds out of CO2 was relevant to AGW. You got served: it’s a form of carbon capture. Instead of acknowledging that you had a brain fart, you played squirrels. I’m good at playing squirrels.
Besides, I was responding to “Hearts, Clubs, Spades or Diamonds” – how is that related to AGW?
God you suck.
Idiot.
You’re a dishonorable man, Richard.
You’re just an idiot.
No U.
z
Greenhouse gases are trace gases in thin Earth atmosphere.
1. Earth’s Without-Atmosphere Mean Surface Temperature calculation
Tmean.earth
So = 1.361 W/m² (So is the Solar constant)
S (W/m²) is the planet’s solar flux. For Earth S = So
Earth’s albedo: a.earth = 0,306
Earth is a smooth rocky planet, Earth’s surface solar irradiation factor Φ.earth = 0,47
(Received by a Smooth Hemisphere with radius r sunlight is S*Φ*π*r²(1-a), where Φ = 0,47)
β = 150 days*gr*oC/rotation*cal – is a Rotating Planet Surface Solar Irradiation Absorbing-Emitting Universal Law constant
N = 1 rotation /per day, is Earth’s axial spin
cp.earth = 1 cal/gr*oC, it is because Earth has a vast ocean. Generally speaking almost the whole Earth’s surface is wet. We can call Earth a Planet Ocean.
σ = 5,67*10⁻⁸ W/m²K⁴, the Stefan-Boltzmann constant
Earth’s Without-Atmosphere Mean Surface Temperature Equation Tmean.earth is:
Tmean.earth= [ Φ (1-a) So (β*N*cp)¹∕ ⁴ /4σ ]¹∕ ⁴
Τmean.earth = [ 0,47(1-0,306)1.361 W/m²(150 days*gr*oC/rotation*cal *1rotations/day*1 cal/gr*oC)¹∕ ⁴ /4*5,67*10⁻⁸ W/m²K⁴ ]¹∕ ⁴ =
Τmean.earth = [ 0,47(1-0,306)1.361 W/m²(150*1*1)¹∕ ⁴ /4*5,67*10⁻⁸ W/m²K⁴ ]¹∕ ⁴ =
Τmean.earth = ( 6.854.905.906,50 )¹∕ ⁴ = 287,74 K
Tmean.earth = 287,74 Κ
And we compare it with the
Tsat.mean.earth = 288 K, measured by satellites.
These two temperatures, the calculated one, and the measured by satellites are almost identical.
Conclusions:
The planet mean surface temperature equation
Tmean = [ Φ (1-a) S (β*N*cp)¹∕ ⁴ /4σ ]¹∕ ⁴
produces remarkable results.
The calculated planets temperatures are almost identical with the measured by satellites.
Planet……Te……..Tmean…..Tsat.mean
Mercury….439,6 K…325,83 K…..340 K
Earth…….255 K….287,74 K…..288 K
Moon…….270,4 Κ…223,35 Κ…..220 Κ
Mars……209,91 K…213,21 K…..210 K
The 288 K – 255 K = 33 oC difference does not exist in the real world.
There are only traces of greenhouse gasses.
The Earth’s atmosphere is very thin. There is not any measurable Greenhouse Gasses Warming effect on the Earth’s surface.
There is NO +33°C greenhouse enhancement on the Earth’s mean surface temperature.
Both the calculated by equation and the satellite measured Earth’s mean surface temperatures are almost identical:
Tmean.earth = 287,74K = 288 K
https://www.cristos-vournas.com
Cristos,
They’re going to accuse you of what they do. Build an equation (model) in hindsight that fits your narrative.
How would the Earth act like a black body? It’s blue!
Spot the schoolboy error.
Those who have seriously studied the science will see it straight away.
All the arm chair experts will struggle.
prof p …”Spot the schoolboy error”.
Breathlessly awaiting your analysis of the so-called error.
You mean – you can’t see it? Try again.
christos…”Greenhouse gases are trace gases in thin Earth atmosphere”.
***
The term greenhouse gas is derived from a bad theory. It was incorrectly presumed that greenhouses warmed by trapping infrared energy. For some reason, it was thought that trapped IR could somehow warm a greenhouse.
That idea persisted till around 1909 when R. W. Wood, an expert on gases like CO2, began to question the theory. He set up two identical containers in the Sun, one covered by ordinary glass, which tends to block IR, and another covered with a sheet of halite (rock salt), which passes it freely. After exposing both to solar energy, he found no difference in the temperatures inside the containers. Both warmed, but to the same temperature.
He reasoned from that experiment that greenhouses are warmed due to a lack of convection, which makes eminently more sense. Heat is the kinetic energy of atoms, and Wood proved it was not IR emitted by the atoms that was trapped and warmed the greenhouse, it was the actual excited atoms themselves producing the heat and blocked from escaping by the glass. When the doors of the greenhouse were opened, allowing the heated atoms to escape, the greenhouse cooled.
Physicist/meteorologist, Craig Bohren, stated that the idea of GHGs trapping heat in the atmosphere is not only a metaphor, it is ‘plain silly’. Could not agree more. In fact, the entire AGW theory is stupid.
Not only that Gordon, but have based this non-scientific theory on the notion that all of the atmospheric CO2 increase has been due to burning fossil fuels. Well, maybe not silly if it fits your political narrative.
stephen…”Not only that Gordon, but have based this non-scientific theory on the notion that all of the atmospheric CO2 increase has been due to burning fossil fuels”.
***
Good point, Stephen…we humans produce about 4% of atmospheric CO2, the rest coming from the oceans, vegetation, and volcanoes.
One day you’ll learn about the carbon cycle, Gordon:
https://earthobservatory.nasa.gov/features/CarbonCycle
Tell us about the carbon cycle. Or, maybe you want to join in the discussion here.
https://edberry.com/blog/climate/climate-physics/preprint3/
Dr. Richard Courtney?
And there you have it. Back to square one again with gR and spa.
“Insanity is doing the same thing over and over again and expecting different results.”
studentb…”And there you have it. Back to square one again with gR and spa”.
Do you have a scientific rebuttal or are you going to settle for slinging ad homs and insults?
Look who’s talking, Gordon.
Willard, please stop trolling.
So, the question again can spacefaring civilization use less energy, but can have a lot more energy, and therefore “will” they use less energy as compared earthlings living on Earth?
A premise is we can use the Moon {and Mars] to lower the electrical cost in space.
A simpler premise, assume we are mining lunar water and making lunar rocket fuel on the Moon.
Earth rocket fuel is about $1 or less per kg.
Lunar rocket might start off at $500 per kg [or more} but within
20 years lunar rocket fuel could $100 per kg or less.
Though it’s possible lunar rocket start at about $100 per kg and
within 20 year is less than $10 per kg. And then within several decades lunar rocket fuel could be cheaper than Earth rocket fuel.
But right now we don’t know if lunar water is mineable. Pretty certain there are billions of tons of water at lunar polar regions, but that does not tell you whether it’s mineable.
One make it simple, no one ever mines anything on Earth without first exploring the site which one thinks could be mineable of anything.
Another way to look at it, is can you sell books on the internet and make money. Amazon CEO is worth more 200 billion dollar, so that answer is yes.
You have mine the moon is the right way. Lots of people could mine lunar water the wrong way and go bankrupt. But at this point don’t know enough. And we will send crew to the Moon and we will be surprised with what we find- this is very predictable. It will certainly be said, but also it will be true. And same applies to Mars- we don’t know if it’s possible for humans to live on Mars, it need to be explored and more explored than we can do with robots. But to the point,
What temperature is 100 meter diameter sphere of water, in space.
The location in space will be L-1 [Earth/sun L-1] which stays in same spot between Earth and Sun and is about 1.5 million km from
Earth. It’s further but easier to get than closer lunar surface [if lunar surface doesn’t have rocket fuel you can use.]
So at time when lunar rocket is about $100 per kg- this could be within 3 years, it’s far more likely within 20 years.
So 100 meter diameter sphere of water is encased clear plastic, about 2 cm thick in average amount per square meter. Above the plastic going to have transparent solar panels- two layers. Top layer will glass- like this:
https://www.greenmatch.co.uk/blog/2015/02/transparent-solar-panels
They aren’t effective, but don’t want the plastic, one want glass meeting the vacuum of space. These framed and removable. 1/2 meter below it is more transparent solar panel, but this solar panel will have more conductive mass to serve as “electrical grid” so electrical energy from top layer with conducted down to less transparent layer. Or one could say layer has more structural strength and ability conduct a lot amps of electrical power, and 10 cm below that will be the clear plastic. And between these layers: 10 cm and 40 cm there will be water. And below plastic the 100 meter diameter sphere of water.
The sunlight on earth can shine thru 100 meter of water, and the sunlight in space should likewise shine that water, and it should glows a blue color. And generally be brightly reflective.
Looking at it with blackness space behind it should be blue and shiny. Though if sunlight at your back, and looking at it still shiny but not very blue. If someone swimming within sphere of water, one might see them.
But going to put 12 meter pipe thru north and south pole extend 50 meter and attach where people live, and spins so there is some artificial gravity at these ends.
But climatic question is, how warm is the water.
The 1% efficient solar panel should give about 213.6 kW.
Probably need a lot more power than this for 1000 people.
Oh, I don’t give my answer, so I would say around 5 C.
It’s going to spin and if need to can mix water so it’s uniform, or take warm water [in some hot spot] away to use as hot water.
So I mean average temperature of water [moving around water is lot cheaper per thermal mass, then is air].
clint r…”Heterodyned doppler depreciation”
Heterodyning is the application of a low frequency signal onto a high frequency carrier wave. The low frequency signal could be a voice signal from a microphone. At the frequency of audio, the signal could not be transmitted since an antenna needs to be excited by a radio frequency signal that changes at least hundreds of thousands of times per second in order to be transmitted as an EM wave.
With heterodyning, they take a constant amplitude radio frequency signal, eg. 60 megahertz, and apply the audio signal to it so the audio modulates the RF signal. That means, the audio alters the amplitude of the RF signal so you have a high frequency signal changing amplitude in step with the audio signal.
That process is called amplitude modulation. However, you can modulate the frequency while keeping the amplitude of the RF signal constant, a process called frequency modulation. Or, you can modulate the phase of the signal.
Or, you can take square waves at an RF frequency and vary the width of the pulses, a process called pulse width modulation. I’m sure you get the concept.
The word doppler in heterodyned doppler depreciation, (or is that deprecation?) refers to the way a transmitted signal is changed when transmitted from a moving body. When the moving body is a star, it means the frequency of the actual EM emitted by the star is shifted from its normal frequency. Hence we have red shifts, where the frequency is moved toward the red (IR)end of the EM spectrum and blue shift, where it is moved toward the blue end (UV).
So heterodyned doppler suggests two doppler shifted signals mix so that one modulates the other, probably as a frequency modulation where the doppler shifted frequencies are degraded, or deprecated.
That my story and I’m sticking to it.
willard…”Sky Dragons lie at the extreme side of the contrarian spectrum”.
***
You’re awfully confused. Sky Dragon is a term thought up by scholars like Claes Johnson as a metaphor for the greenhouse effect. His book was about slaying the Sky Dragon. It is you and other alarmists who represent the Sky Dragon. As you state above, Sky Dragons lie, and you are the Sky Dragon rep.
http://claesjohnson.blogspot.com/2010/12/how-to-kill-sky-dragon-by-mathematics.html
“Our new book Slaying the Sky Dragon: Death of the Greenhouse Gas Theory is topping Amazon eBook lists. The paperback version will appear after Christmas along with radio and TV presentations.
The message of the book is that the so-called atmospheric Greenhouse Gas Effect GGE, presented by IPCC as the scientific basis of CO2 alarmism, lacks sound mathematical and physical rationale.
My role in the team of authors is to shoot with the weapon of mathematics at the heart of climate science consisting of the two chambers
-blackbody radiation: transfer of heat energy by electromagnetic waves
-thermodynamics: interplay of heat energy and kinetic/potential energy under gravitation”.
some Swedish on this site but English too, and good links.
http://claesjohnson.blogspot.com/
I know what I said, Gordon.
The Dragon meme is JohnO’s meme.
I’m using it to refer to that kind of crap.
Sky Dragon. Moon Dragon. Everything Dragon.
Dragons don’t exist. Except on blogs and books.
Anyone can invent memes.
willard..”I know what I said, Gordon. The Dragon meme is JohnOs meme”.
And you are wrong. As I pointed out, the Sky Dragon bit came from the Dragon Slayer’s book by Claes Johson et al.
I’m not wrong, Gordon, I’m telling you it’s about time that silly table of yours get flipped.
You’re rooting for something that does not exist.
Dragons don’t exist.
Sky Dragon it is.
Oh, Woebegone Wee Willy,
The “Sky Dragons” are you and your ilk.
Mythical creatures, just like the GHE which created them.
The Earth has cooled. Standing next to a fire is not evidence that the Earth is heating, you idiot. The burning of fossil fuels creates heat and CO2. Some idiots have convinced themselves that the CO2 creates the heat!
Silly Sky Dragons!
Mike Flynn,
From now on you’re a Sky Dragon.
Embrace it!
Witless Wee Willy,
You fool. Slaying “Sky Dragons” is Claes Johnson’s term for pointing out the mythical nature of the GHE.
Sky Dragons are in denial of reality.
How about, you, Wee Willy? Do you still deny the Earth has cooled from the red hot state? Ask your mate Ken Rice. He will set you straight. Here’s what he said about increasing snow and ice in Antarctica a few years ago –
“All previous bases were close to the coast and over time would be covered by snow and ice, requiring that the entrance hatches be raised by about a metre or so every year.”
At least Ken Rice was smart enough to accept reality (you can actually die, if you don’t), and he’s an astrophysicist, just like James Hansen, the climate crackpot!
So carry on, puppy. Deny away. See how many people change their way of life because of your stupid opinions.
Mike Flynn,
When was the last time you exchanged with AT?
Wistful Wee Willy,
More avoidance, puppy? It won’t work you know!
Trying to avoid the inconvenient fact that the Earth has cooled in spite of all your mythical Sky Dragon assertions about GHGs, makes you look as stupid as the rest of the climate cranks.
Who is AT? Is he another obsession of yours, like “Mike Flynn”?
Oooooh! Cryptic!
What fresh idiocy are you going to come up with, to support your denial of reality?
Mike Flynn,
Tell me more.
Willard, please stop trolling.
ClintR: “Dr. Spencer has indicated he doesnt want to contest the physics of the GHE, so he lets others do that.”
Where is the evidence for this statement?
Lying scum.
DMT, here’s where this started:
http://www.drroyspencer.com/2021/07/uah-global-temperature-update-for-june-2021-0-01-deg-c/#comment-745042
My offer still stands. Do your part, and I’ll do mine.
As you may have noticed, your attempted insults and slanders have no effect on me. That’s just an indication that you have NOTHING.
clint…”As you may have noticed, your attempted insults and slanders have no effect on me”.
As Philip Latour put it, when alarmists start ad homing him and insulting him, he walks away knowing he has won his point.
That’s all alarmists have, insults, ad homs, and threats.
You omitted that we have the science on our side. Plus the observations. Plus 97% of the world’s scientists etc etc.
All you have is a bunch of RWNJs, Trump supporters and some lunatics who should be in asylums.
You don’t “have the science” on your side, DMT. You have “anti-science”. It’s a cult. In fact, it is such a cult that you cannot identify why you joined!
It’s like you’re ashamed of your own cult.
You don’t get to make the rules.
The rule is: if you make a statement, be prepared to back it up.
Otherwise, apologise or cease posting.
DMT,
You don’t get to make the rules.
The rule is: You don’t get to make the rules.
You are an impotent idiot.
captain droll…”Hey? Whats the relevance of these snarks:
Justin Trudeau, his mother’s son, not his father’s son,
and
The former environment minister, a blond female..
Gordon, why are you so perpetually angry and mean? Get a life man”
***
I support democracy and good science. Justin Trudeau and the Climate Barbie, Catherine McKenna, who has since been removed from the environment portfolio, have lead us down a path of pseudo-science.
Trudeau’s father, Pierre Trudeau, would never have stood by and watched our democratic rights diluted by the inane science behind AGW and covid. Pierre Trudeau instituted our Charter of Rights and Freedoms while his son Justin has done everything he can to be politically-correct, and to undermine the Charter.
That Charter guarantees certain rights to all Canadians, yet Justin Trudeau is willing to overlook it while Muslims snub their noses at it by forcing their women and children to obey religious edicts rather than the rights of the Charter. When the Muslims wanted to institute Sharia Law in lieu of our Charter, he said nothing.
Now he is supporting Indigenous people and their whine about Residential Schools. The schools were in effect foe 100 years and no has said anything till recently, in line with the Black Lives Matter movement in the states. I have never heard any White person claim that Black lives don’t matter.
The residential schools were wrong to abuse Indigenous children and should have been prosecuted. What the current Indigenous people are ignoring is that the children were put in the schools because they were abused and neglected at home.
Even today, in Canada, there are more Indigenous children under government care than at any time during the Residential School era. Many Indigenous people simply don’t care about their own children but are quick to criticize those who have taken them away, based on Canadian law, due to abuse and neglect.
Trudeau wants modern Canadians to apologize for the wrong of a few misguided Catholic residential schools in the past. He has glibly suggested that Canada could be sued big time by them rather than being angry about such nonsense and defending us. He is a silly, self-serving/self-centred person who is devoid of any awareness.
That comes from his mother, who was the quintessential flower child, a reference to superficial twits who ran around with flowers in their hair pretending to be enlightened. Trudeau is acting like an anachronism, a flower child who is 60 years out of date.
Man, you are seriously deranged. I even feel sorry for you. It must take a lot out of you being perpetually outraged by everyone and everything. It certainly is not healthy.
Get a life -or better still, get a dog.
captain droll…” It must take a lot out of you being perpetually outraged by everyone and everything. It certainly is not healthy”.
yes…I am annoyed, that so many fine, young Canadian and US men volunteered to go oversees to fight in WW II, losing their lives and being seriously injured, then having some politically-correct, wannabees disregard the way of life they fought to protect.
While those young Canadians were overseas fighting for a great cause against despots, Pierre Trudeau was in Quebec, urging Quebecois not to go and fight, even though their mother country, France, was under the heel of the Nazi jackboot. Then he disappeared to who knows where for the rest of the war.
Now his son is trying to sell our Canadian heritage down the river based on some politically-correct nonsense. Yes, I’m annoyed, and anyone who is not is a lost sheeple.
I am watching the US lose its birthright to losers, fearing that it will soon filter North. It’s not just about US problems heading North, there are a lot of good US people who are affected by this insurrection of cowards and terrorists. The US is our ally and I care what happens in the States. Not at all happy they have an idiot like Biden running the place.
Recently, Vancouver cops were called to a bar brawl where a Black guy was identified as a prime trouble maker. They tried to subdue him and while they were correctly doing doing their job, the crowd was taunting the police as racists. One White guy was screaming at the cops and at one point took a swing at a cop. Now they are looking for him and I hope they find him.
I regard people like you as utterly naive. You don’t have the sense to see where Canada is headed, nor do you care about our Charter of Rights and Freedoms.
I understand to some extent – the world is imperfect, it is changing, and some people cannot cope. Still, I do not understand how endlessly moaning, groaning and complaining benefits anybody – let alone yourself.
c,
Why do you keep doing it, then?
willard..”It is likely that anthropogenic influences have led to warming of extreme daily minimum and maximum temperatures at the global scale”.
***
The new science…’it is likely’. No scientific proof, but likely, the IPCC mantra.
Philip Latour, who has a degree in chemical engineering, arguably the toughest degree to acquire at any university, has pointed out that correlation and causation can be very different in science.
He claims, that just because two phenomenon exist side by side, and appear to be related, does not mean they are related. To prove correlation, he claims, one has to supply physical evidence which he claims does not exist for anthropogenic gases and warming.
https://www.youtube.com/watch?v=bJ55koi7vaA
ps. Norman and Swannie will love Latour’s explanation of the 2nd law, a law which he is eminently qualified to speak about. He too contradicts the textbook bs that heat can be transferred both ways between bodies of different temperatures.
He also points out that AGW contradicts the 1st law, since it implies the creation of heat via perpetual motion of the 2nd kind.
> arguably the toughest degree to acquire at any university
There are only two tough degrees to get at a U, Gordon. Physics. Philosophy.
Everything else is mostly as easy as cooking. And I abide by Ratatouille’s dictum:
Everyone can cook.
As for Pierre, it’s still hard to tell, e.g.:
https://principia-scientific.com/skeptical-arguments-that-don-t-hold-water-pierre-latour-s-rebuttal/
Yet, ClintR maintains that:
Dr. Spencer has indicated he doesnt want to contest the physics of the GHE, so he lets others do that.
How does this square with the fact that:
“On April 25, 2014 prominent skeptic climate scientist, Dr Roy Spencer published his defense of the so-called greenhouse gas effect” ??
C’mon ClintR, explain this for us all.
DMT, here’s where this started:
http://www.drroyspencer.com/2021/07/uah-global-temperature-update-for-june-2021-0-01-deg-c/#comment-745042
My offer still stands. Do your part, and I’ll do mine.
Please explain how Roy is letting dragons contest the Tyndall effect while writing posts about the silliness of their arguments, Pup.
You have been caught out fabricating.
And behaving like a spoilt child with “you show me yours and I will show you mine” diversionary nonsense.
I say you are lying, scum.
DMT, please continue trolling. You just prove me right about braindead cult members. And, I like being right….
http://www.drroyspencer.com/2021/07/uah-global-temperature-update-for-june-2021-0-01-deg-c/#comment-745470
Maybe some climate crackpot could try to provide some physical reason which would prevent the Earth cooling from over 1000 C to its present temperature.
Of course they can’t. Not without invoking magic.
The Earth has cooled to its present temperature. No GHE. As Einstein reputedly said “”If you cant explain it simply, you dont understand it well enough.”
Red hot things cool if they are 150,000,000 km from the Sun.
Simple enough?
Please. Just move on to something relevant. Honestly, this perpetual obsessing is something only the mentally deranged engage in.
DMT,
So you don’t deny the Earth has cooled to its present temperature?
You are a delusional idiot who can’t even describe your delusion!
Stick to sucking scum and writing imaginary lists.
Here, just to humour a lunatic, do some homework and tell us what you estimate to be the average rate of cooling since Earth was formed compared to a value of, say, 1 degree of per century.
DMT, please stop trolling.
willard…”There are only two tough degrees to get at a U, Gordon. Physics. Philosophy”.
You are so naive. Philosophy??? Easy credits. Law students take philosophy to train them for not falling asleep during lectures. We had songs for arts students in engineering …… M-i-c-k-e-y-M-o-u-s-e”. There is no such thing as a hard Arts course.
So is a physics degree compared to the requirements of the chemical engineering program.
Besides, how would you, a high school dropout, know anything about higher learning?
Do you have a scientific rebuttal or are you going to settle for slinging ad homs and insults, Gordon?
Woebegone Wee Willy,
Are you denying the Earth has cooled to its present temperature? Gee, what sort of magic did you invoke to stop a red hot ball 150,000,000 km from the sun dropping to 288 K?
Wow, just wow! In you, the power of self delusion strong is!
You are a denialist idiot!
Good morning, Mike Flynn.
Witless Wee Willy,
Others might notice your stupid attempt at avoidance.
Do you really deny that the Earth has cooled?
Are you associating yourself with those silly “Sky Dragons”, (GHE cultists), who believe that “We will be toasted, roasted and grilled” by the radiation from the atmosphere? By the breath of the “Sky Dragon”?
Oh, Wee Willy, what a delusional idiot you are! Ask any astrophysicist – they will refer you to as many scientific references as you can cope with. If you like formulas and models, you will find many.
Or you can just hide your head up your ass, and deny reality.
The choice is yours,
Mike Flynn,
Do you know the Doritos story?
It’s a good one:
[Vaughan]: Well, predicting is hard, especially futures anomalies.
[MattStat]: Yeah, this is a bummer. But how do you think that people
[Don Don]: Hey guys, you talking Doritos?
[MattStat]: Come on, Don Don. Dont do this again.
[Don Don]: I just thought maybe you were having the old Doritos discussion.
[Vaughan]: Dude, for the last time: well tell you if we ever have a conversation about Doritos.
[Don Don]: You promise?
[MattStat]: Of course, Don Don. We know how you love Doritos.
[Vaughan]: Yeah, man. Everyone knows.
https://neverendingaudit.tumblr.com/post/40263311176
Wandering Wee Willy,
Still trying to deny that the Earth has cooled? No longer a red hot blob in spite of four and a half billion years of continuous sunlight? And your reason is – Doritos?
Can’t face reality, kiddo? Pull your head out of your ass, and look around.
Try finding a physical reason that prevented the Earth cooling to its present temperature.
Can’t do it? Tha’s because there isn’t one, you idiot!
Mike Flynn,
We all know how you love Doritos.
We’ll tell you when we’ll talk about Doritos.
Whacky Wee Willy,
Stupid attempt at diversion.
Got any better? No?
Why am I not surprised?
Mike Flynn,
The Doritos epitomizes the diversion here.
Enjoy your afternoon,
Wee Willy Doritohead,
Here’s a tip: deny and divert, look like what you are – a diverting denier!
Get a grip, Doritohead. You are not only an idiot, but occasionally a target for derision.
[derisive laughter]
Mike Flynn,
You’re discovering peddling.
Your repertoire is already limited.
Don’t go for peddling:
https://andthentheresphysics.wordpress.com/2017/06/16/peddling/
Willard, please stop trolling.
The Earth has cooled to its present temperature!
etc etc
Honestly, give us a break you idiot.
DMT,
Nope, you aren’t finished yet.
Every time you write “The Earth has cooled to its present temperature”, you have to add “and neither CO2 nor anything else stopped it!”
Repeat 50 times.
If reality has still not penetrated your thick skull, repeat until it does.
Off you go now. Tell me when you have accepted reality.
> and neither CO2 nor anything else stopped it
Show me, Mike Flynn.
Willard, please stop trolling.
willard…”Do you have a scientific rebuttal or are you going to settle for slinging ad homs and insults, Gordon?”
Imitation is the sincerest form of flattery.
No really, Gordon.
What if I told you that architecture and fine arts were considered among the toughest diplomas to get at Oxford?
Willard, please stop trolling.
“The surface of the planet emits IR according to the Stefan-Boltzmann radiation law. The surface of Earth at 288 K emits 390 W/m2, some 150 W/m2 more than the earth emits to space.
That 150 W/m2 of heat retention is the cause of the 33 ºC temperature rise over the non-GHG Earth with the same albedo” Prof Hayden
–
No.
–
The temperature at the TOA is 255 K. which is roughly 240 W/M2
–
the flux emitted by Earth at TOA equals the flux absorbed at the earths surface from the sun.
Theoretically the surface of the earth should be 255K, with no atmosphere or a non absorbing atmosphere [and albedo].
–
The temperature at the surface of the earth is 288 K.you will get E = = 390 W/m2.
–
Lost on everyone is that there is no continuimg 150 W/m2 of heat retention.
The flux in equals the flux out.
It is not adding 150 W/m2 constantly to the atmosphere.
It did heat up 33 C due to GHG H2o and CO2.
In the distant past.
Now the energy in equals the energy out more or less. on daily scales subject mainly to clouds [albedo] and a little solar variation.
–
The earth surface emits 390W/M2 but not to space.
It has to get through repeated layers of opaqueness to do so.
Half of everything going up comes back then a half of that etc.
Resulting in a surface re-emission of part of the original 240W/M2 multiple times until it built up enough upward energy to reach the TOA.
–
“The surface of Earth at 288 K emits 390 W/m2, some 150 W/m2 more than the earth emits to space.”
The surface of the earth receives 240 W/M2 which all goes out to space. No heat is retained.
The TOA is identical to the surface of the earth in the amount of incoming and outgoing radiation.
That is why it is called the TOA.
The surface is not magically providing an extra 150/W/M2 to heat the atmosphere.
It is not an engine.
It is not the sun. It is not a heat generating source.
It does not magically make energy.
–
This must be wrong but I cannot see why.
Help.
a,
I see a problem. You wrote – “Theoretically the surface of the earth should be 255K, with no atmosphere or a non absorbing atmosphere [and albedo].”
So when the Earth’s surface was molten, which theory said the temperature should be 255 K?
This is presumably the same theory which has managed to give the wrong answer every year for the last four and a half billion years! Impressive!
Maybe a new theory is needed. One which agrees with facts.
What do you think?
For God’s sake shut up.
DMT,
Why should I? Because an idiot who denies reality makes demands he can’t enforce?
Do you know how stupid that makes you look?
And you wonder why people are sniggering at you!
I vote we bring back the guillotine.
DMT,
I second that. Can I cheer as the tumbrils of climate crackpots clatter by?
Apparently you have a list. I can supply you with a few names, if you wish.
That sound you hear is me sniggering.
And lobotomies.
I’d rather have a full bottle in front of me, than a full frontal lobotomy.
DMT doesn’t need a lobotomy. He’s a brainless climate crank. He just hasn’t realised he’s brain dead yet.
Oh well.
[laughter]
It must be a full moon.
DMT, please stop trolling.
Swenson,
You need to try harder
a,
I asked – “So when the Earth’s surface was molten, which theory said the temperature should be 255 K?”
Too hard for you, obviously. You have no answer at all.
I don’t need to try harder, do I?
Doc, Mike Flynn.
Mike Flynn, Doc.
Now you know each other.
Willard says:
Doc, Mike Flynn.
Mike Flynn, Doc.
Now you know each other.
–
Thank you Willard.
I see what you mean.
I asked So when the Earths surface was molten, which theory said the temperature should be 255 K?
‘-
I am in awe.
–
Swenson,
To be more precise, the original statement should have been:
“Theoretically the surface of the earth should
beapproach 255K after a sufficiently long period of time, with no atmosphere or a non absorbing atmosphere [and albedo].”This is simple energy balance. A surface COOLER than 255 K would warm toward 255 K (given current conditions). A surface WARMER than 255 K would cool toward 255 K. I can’t see why this concept continues to elude you.
You can forgive the author. 4 billion years is more than sufficient time for some initial transient surface conditions to have decayed away.
There is an article ‘Radiation Transfer’ by William Happer that might give some understanding of why you are wrong.
Ken,
Thank you for both the advice and non answer.
angtech: “This must be wrong but I cannot see why. Help.”
Indeed it is wrong. The entire 33K, “average” flux, flux “adds”, is all anti-science.
The 33K comes from comparing an imaginary object to Earth! They attempt to “balance” flux when flux doesn’t balance. Then, they treat flux as a scalar by adding and subtracting!
How unscientific can they get?
Clint R
Why do you feel compelled to preach false misleading physics?
If fluxes in and out do not balance you have either a decreasing or decreasing temperature, simple as that.
Yes fluxes can add. A flux is equivalent to a flow. It is a flow of energy. A quantity of energy per time and area.
As with a flow of water you can have different flows and yet balance.
If you have 1000 GPM flowing into a tank and ten 100 GPM flowing out of a tank, the level of the tank remains the same.
You can have all types of flows in and out, as long as the in balances the out the tank level will stay the same.
You are just totally wrong and will continue to be wrong until you learn to think about what you post. Just mindlessly repeating stupid mantras over and over does not make them correct.
Learn to think you have shown no ability to do so on this blog.
Norman claims: “If fluxes in and out do not balance you have either a decreasing or decreasing temperature, simple as that.”
That was right after he asked “Why do you feel compelled to preach false misleading physics?”
Idiots are so entertaining.
Clint R
Your point is too illogical to follow. You make no sense and peddle garbage. In your mind you believe repeating false claims over and over makes them correct.
Anyone for ball on the string trope? Repeat some more, do not think about anything and plow ahead.
Tim Folkerts is giving you excellent physics but you are not capable of thinking about what he posts. You reject it with stupid comments about cults. You do not even think about what he says, just mindless rejection. I am astounded that you cannot analyze your own cultish thought process. You do not think about ideas that challenge your own misconceptions but repeat your own ideas over and over. That is cult mentality. You are the cult your reject. You are the bad science you claim of others.
Norman can’t understand his mistake “If fluxes in and out do not balance you have either a decreasing or decreasing temperature, simple as that.”
He just keeps abusing his keyboard, unable to learn.
That’s why this is so much fun.
It appears Norman found his mistake. He now realizes what an idiot he is.
He’ll recover, forget about this, and come back as perverted as ever.
Idiots can’t learn.
Clint R
Yes I see the mistake. Should be increasing or decreasing. Most people can see the mistake and infer the correct word use. Not really a big deal, maybe to you.
The concept is still correct.
In the past you make claims fluxes don’t add because a 1000 W/m^2 flux hitting one m^2 surface is not the same flux as 5 200 W/m^2 fluxes. Yet they are equivalent. They both transfer the same amount of energy.
An object with an area of 5 m^2 will reach the same steady state temperature (assuming good heat transfer from one part of the surface to the others…a good conductor of heat) if it has 5 200 W/m^2 fluxes heating an individual square meter or a 1000 W/m^2 flux hitting one square meter and the energy is rapidly distributed to the other non-illuminated surfaces.
I can not grasp your illogical points but you will keep making them. I wonder if anyone on this blog grasps your points besides Gordon Robertson.
I was right, again.
Norman finally found his mistake, took a couple of hours off to recover, and is now back, as perverted as ever.
Idiots can’t learn.
I wonder if he’s noticed where he implied Earth is not rotating? His nonsense has Moon rotating, but Earth not rotating!
That’s why this is so much fun.
Norman, don’t waste time with lying scum. It just makes things up out of thin air.
DMT, please stop trolling.
–“The surface of Earth at 288 K emits 390 W/m2, some 150 W/m2 more than the earth emits to space.”
The surface of the earth receives 240 W/M2 which all goes out to space. No heat is retained.–
If Sunlight were blocked [or the sun disappear] the Earth surface would retain the past heating of the Sun for quite a while.
The Moon which has no ocean and has vacuum like atmosphere would also retain heat from the sun. The lunar surface where Sun is directly over head heats heats to about 120 C, without sunlight the surface would take many hours to cool to 0 C {273 K}- During the Earth days of lunar night the surface cools to around 100 K [-173 C].
With Earth it would take years before the surface of all the ocean would freeze [reach 0 C] if sun disappeared. And entire ocean would never freeze due to geothermal heat. Or if under a mile rock it also wouldn’t freeze due to geothermal heat.
“The surface is not magically providing an extra 150/W/M2 to heat the atmosphere.”
The tropical ocean surface maintains a fairly uniform temperature- it’s warmer in day but does not cool much at night- as it has thick layer of warm water at the surface- the top surface waters cool and replaced with warmer water- the warmest water is at surface.
The large atmosphere mass of Earth also retains it’s heat, but ocean retains far more heat than the atmosphere.
It’s the Sun stupid
https://bit.ly/3hiNdrv
Authorities in Cyprus have said a deadly forest fire that was the worst to hit the island in decades .
Arghh! – I was just about to book a flight there.
s,
Arghh! And I was just about to pay for your ticket!
Phew!
New Zealand has experienced its hottest June since records began more than 110 years ago, according to official climate data.
Another one crossed off the list.
s,
Going into the weather reporting business?
Don’t give up your day job.
Like 110 years is SO long ago.
Whereas UAH…
Unprecedented since…
It happened before therefore…
It was precedented then.
And since it was precedented…
Unprecedented since a 110 years ago.
And since it was unprecedented since 110 years ago…
We don’t know what happened before 110 years ago.
And since we dont know what happened before 110 years ago…
Guess work wont cut it.
Neither will appeals to ignorance.
Nor being an idiot like you.
No U.
Another climate warrior who flies around on jet planes for his own fun , isn’t he cute
Is the radiation to space at TOA 255C?
Is the radiation the earth receives directly from the sun 255C?
Therefore the earth emits to the atmosphere 255C of flux from the sun.
It is also involved in receiving and emitting back radiation but this is not extra energy that has to go off to space.
It is just the energy that a heated atmosphere with GHG emits to and fro regardless of the sun.
–
Proof?
When the sun goes down the temperature drops to that what a heated surface only radiates.
TOA on the night side much lower than on the lit side.
angech,
The earth theoretical blackbody surface uniform temperature equation when calculated (Albedo a=0,306 and Solar flux So=1361W/m^2) obtains Te.earth = 255K
The 255K is a theoretical the entire earth surface uniform temperature.
It is so much theoretical that it cannot be expected to be somewhere measured no matter what.
The 255K is a theoretical uniform surface temperature. Thus it cannot be measured, and it has not any physics analogue on the real planet surface – it is a mathematical abstraction.
https://www.cristos-vournas.com
Exactly CV. In fact, the “255K” is so “theoretical” that it is nonsense.
“The 255K is a theoretical uniform surface temperature. Thus it cannot be measured, and it has not any physics analogue on the real planet surface – it is a mathematical abstraction.
–
Not so.
In two ways.
An average surface temp [a theoretical uniform surface temperature] is derived from taking an average of either actual or estimated temperatures so the average can be estimated from measurements.
Further there is an equivalent of the real planet surface, that of the nearly airless moon.
It has the same solar irradiance.
Once the matter of albedo adjustment is sorted out the moons average [estimated, theoretical, whatever] temperature turns
–
Moon Earth
Bond albedo 0.11 0.306 0.360
Solar irradiance (W/m2) 1361.0 1361.0 1.000
Black-body temperature (K) 270.4 254.0 1.065
–
angech, you may have missed CV’s point. The “255K” is illusionary. Earth’s average temperature is nowhere near 255K. The 255K is for an imaginary object that has NO relation to Earth.
From theorical to abstraction to illusory.
Things escalate quickly in dragon-land.
Au contraire, Clint R.
“The 255K is for an imaginary object that has NO relation to Earth.”
The moon is not an imaginary object.
It is the same distance from the sun as the earth and receives the same solar irradiance.
The two differences are an extremely pauce atmosphere
and a lower albedo.
Hence is surface temperature is fairly close to that of what earth would be without an atmosphere.
temperature (K) 270.4 slightly higher due to less reflection.
–
” the “255K” is so “theoretical” that it is nonsense.”
–
It is right in the ball park.
It is nonsense to deny it
Earth’s surface develops temperatures as an airless celestial body, like Moon or Mars.
We cannot ignore the fact Earth is a planet and that Earth should behave accordingly to the same Universal laws which are valid for every planet in the solar system.
https://www.cristos-vournas.com
Cristos,
Your arguments about Tsat vs. Tmean for the Moon and Mercury can’t be ignored.
Of course it can.
Not by science.
Of course it can.
Thank you Stephen.
Au contraire, mon ami.
The average global temperatures reported by the NASA Planetary Fact sheet (Williams 2014) for the Moon (270.7 K)
–
Yet Christos Vournas
lists it as
T sat.mean.moon = 220 K
–
Have I missed something?
Should I believe Christos or NASA?
The NASA sheet is the only easy reference I can find one way or another.
–
Perhaps Christos could give a link to his satellite data assertion?
–
Anyone know?
angech, thank you.
What I actually do is “Planet temperatures comparison method”.
The planet temperatures I have found in Wikipedia.
In Wikipedia, for every planet or moon in the solar system, even for a smallest one, there is a separate article with all the known information including temperatures.
What I think is that for Wikipedia the only source is NASA satellite planet temperatures measurements.
Only because of NASA very precise planet temperatures measurements it became possible for me to discover the “Planet rotational warming phenomenon”.
The planet mean surface temperatures (everything else equals) relate as their (N*cp) products sixteenth root.
Below is the link to the Wikipedia article for Moon where the 220K is taken from.
https://simple.wikipedia.org/wiki/Moon
Thanks Christos.
–
https://simple.wikipedia.org/wiki/Moon
gives Surface temp. min mean max
equator 100 K 220 K
–
https://en.wikipedia.org/wiki/Moon
gives
Surface temp. min mean max
Equator 100 K[12] 250 K 390 K[1
–
Moon Fact sheet NASA
gives
– Moon Earth
Solar irradiance (W/m2) 1361.0 1361.0 1.000
Black-body temperature (K) 270.4 254.0 1.065
–
You have put a lot of work into your analysis which I thank you for.
Unfortunately it is very hard to get an average temperature analysis for the moon.
TRhe figure you are quoting may not be correct [220C]
The NASA vesion is the 270.4 C which equates well with albedo and TOA [which is basically the moon surface].
Sorry.
angech, thank you.
“You have put a lot of work into your analysis which I thank you for.
Unfortunately it is very hard to get an average temperature analysis for the moon.
TRhe figure you are quoting may not be correct [220C]
The NASA vesion is the 270.4 C which equates well with albedo and TOA [which is basically the moon surface].
Sorry.”
Thank you, angech, for your good faith, it is the most important!
Well, I am sorry too. When I first looked for lunar surface temperature (Dec. 2015) it was 220K.
Yes, I am fully aware of that…
When earlier this year I wanted to refer to Wikipedia, I realized the Moon surface temperature 220K was changed to 250K…
It was a very unpleasant surprise for me. How could that suddenly have changed?
So, I looked in other Wikipedia pages, I looked in other languages’ pages to demonstrate the prove I had the 220K for Moon surface temperature taken from Wikipedia…
And, therefore, it was from NASA, because Wikipedia has not any other source, except NASA, for the Planet surface temperatures data.
Then, I looked in the “simple Wikipedia” page and found it in English again.
But first let me present you some other pages:
Arabic, Russian, French, Japanese, Chinese, Portuguese, Romanian…
All of them, among many others, state about Lunar temperature 220K
Of course there are many which state for 250K.
……………
angech, sorry to bother you with all those links to Wikipedia, but, you see, I have to defend my discoveries.
I have to defend the rightness of my discoveries.
I have to make them known, and I have to explain them so they become well understood and well accepted.
Thank you angech.
Christos Vournas
Thermodynamically Earth is a closed system, exchanging energy with its environment but with no significant exchange of matter.
You can look at the behaviour of the system at all scales, from individual locations upwards.
The largest scale is the black box, in which you measure the energy flows in and out of the planet as a whole, rather than considering differences within the system.
Applying the laws of physics to this black box you can calculate that the planet takes up an average of 240W/m^2 and radiates 239W/m^2, equivalent to the radiation you would expect if the radiating surface was at a uniform 255K.
This is your null hypothesis, the simplest behaviour of the system. You can then examine the internal behaviour of the system, observe how it deviates from the null hypothesis and formulate hypotheses to explain the differences..
Sounds reasonable Ent, but it’s WRONG.
You can’t compare Earth to an imaginary object, and expect reality. You cannot corrupt physics and claim you are “applying the laws of physics”.
You’re welcome to try again.
Are you suggesting that laws of physics are real objects, Pup?
Sorry Will, but you’ve been replaced as my stalker.
RLH and Norman are competing to see who will get the job. RLH is amazingly prompt, but Norman is funnier.
Answer the question, Pup.
Are you suggesting that laws of physics are real objects?
Wow, a 1-minute response from Will! He’s back in the running to be my stalker.
Competition does that. That’s why Capitalism is such a great system.
Still no answer, Pup.
How about albedo: is that a real object?
Will is the Quip Master. He believes nebulous esoteric quotes pass for brilliance.
Will is an idiot.
No U, Richie Boy.
s t . v w
“You cant compare Earth to an imaginary object, and expect reality. ”
Not an imaginary object, but what I get when I apply measured solar insolation, measured OLR and the Stefan-Boltzman relationship to a real planet.
What would really interest me would be your rational explanation of the difference between the emission temperature derived from the black box (255K) and the surface temperatures derived from local observation (288K).
Ent claims: “Not an imaginary object, but what I get when I apply measured solar insolation, measured OLR and the Stefan-Boltzman [sic] relationship to a real planet.”
Ent, which “real planet” would that be?
Is OLR an object, Pup?
Earth, of course.
Sorry Ent, but Earth is NOT a black body.
All caps is NOT an argument, Pup.
Is the Stefan-Boltzman constant a real object?
You’re slowing down again, Will.
Step it up. The competition is tough.
And, it’s “Boltzmann”.
Youre in my thread, Pup. So youre the Reply Guy here.
Still no answer. How about emissivity: is that a real object?
> Youre in my thread
Correction. You’re in EM’s thread.
God I hate Roy’s parser.
Maybe it’s your incompetence you hate, Will? Self hate is common in cults.
Maybe you’re a troll who has no idea about science works for real, Pup?
Just a thought.
Will, you were given an chance to show your prowess in science, but you choose to run.
http://www.drroyspencer.com/2021/06/new-nasa-study-earth-has-been-trapping-heat-at-an-alarming-new-rate/#comment-742926
Just think, if you weren’t so immature and incompetent, you might not be so hateful, and have to resort to calling people names, huh?
I point at
[PUP] if you werent so immature and incompetent, you might not be so hateful
and I point at
[PUP] and have to resort to calling people names
That is all.
Willard, please stop trolling.
You’re in my thread, Pup. So you’re the Reply Guy here.
Still no answer. How about emissivity: is that a real object?
And there I was thinking that EM started this thread.
https://www.drroyspencer.com/2021/07/uah-global-temperature-update-for-june-2021-0-01-deg-c/#comment-747189
https://www.drroyspencer.com/2021/07/uah-global-temperature-update-for-june-2021-0-01-deg-c/#comment-746899
You show me a link when mine shows I already saw it, dummy.
Idiot.
No U.
Ent, you must be CORRECT since the lying scum suggests otherwise.
I am loathe to provide the answer to this problem since the oafs here will not appreciate it.
The radiating temperature of 255 K for the Earth is correct BUT, it is the radiating temperature of the EARTH SYSTEM comprising the solid surface AND the atmosphere. i.e. it represents a sort of average temperature of the underlying hot surface (288K) and the overlying colder atmosphere. 255 K is the temperature you would find 5 to 6 km above the surface.
i.e. the layer there can be thought of as representative of the whole system.
Please, no stupid comments. I am perfectly correct.
The temperature of the atmosphere changes from surface to TOA.
So yes, you can find 255K. You can also find temperatures above and below that. The 255K refers to a spherical black body. It has no relevance to Earth.
Is TOA a real object, Pup?
Willard, please stop trolling.
Entropic man, thank you.
I understand what you say.
I see things somehow differently.
Earth exchanges energy with its surroundings – it is radiative energy exchange and we both agree in that.
You say:
“Thermodynamically Earth is a closed system, exchanging energy with its environment but with no significant exchange of matter.
You can look at the behaviour of the system at all scales, from individual locations upwards.
The largest scale is the black box, in which you measure the energy flows in and out of the planet as a whole, rather than considering differences within the system.
Applying the laws of physics to this black box you can calculate that the planet takes up an average of 240W/m^2 and radiates 239W/m^2, equivalent to the radiation you would expect if the radiating surface was at a uniform 255K.
This is your null hypothesis, the simplest behaviour of the system. You can then examine the internal behaviour of the system, observe how it deviates from the null hypothesis and formulate hypotheses to explain the differences..”
Well, I agree with the basic statement:
“Applying the laws of physics to this black box you can calculate that the planet takes up an average of 240W/m^2 and radiates 239W/m^2, equivalent to the radiation you would expect if the radiating surface was at a uniform 255K.”
What I do is correcting the above:
“Applying the laws of physics to this black box you can calculate that the planet takes up an average of 111W/m^2 and radiates an average 111W/m^2, equivalent to the radiation you would expect if the radiating surface was at an average 288K.
And this is my null hypothesis…
https://www.cristos-vournas.com
NEXT GLACIATION UPDATE
https://www.theguardian.com/world/2021/jul/05/new-zealand-experiences-hottest-june-on-record-despite-polar-blast
Will,
So, explain to us showing evidence what has caused New Zealand’s warmest June since 1909?
AGW.
https://www.ipcc.ch/report/ar5/wg1/
Weather is not climate.
How do you explain the fact that, worldwide, warm records are being broken at a much faster rate than cold records?
Don’t tell me the data is fudged – that argument died last century.
So tell me why warm records are being broken but still the global temperatures go down?
Do they?
UAH says they do. As do most other records I can find. Over the last few months at least.
UAH does not represent global temperatures, Richard.
It measures global temperature. Hadn’t you heard?
Only for the specific layers of the atmosphere, Richard.
Natural Variation
UAH Global Temperature Update for June 2021: -0.01 deg. C
You can only legitimately claim natural variation if the June 2021 average is less than 2SD above the long term June average.
Can you show that?
No Ent, I can claim “natural variation” without having to fit into your nonsense.
It’s a big planet, and the ocean all have their own oscillations and time tables. We don’t know them all. But we do know when ocean oscillations work in sync, look out.
> UAH Global Temperature
Is that a real object, Pup?
E man,
No one can accuse you of being a propagandist. Can you show us where the increase in CO2 from 1981 until now (roughly 70ppm) has caused an increase in the flux that would support a 3C rise in temperature in New Zealand? Can you show us how it could could cause a 1C rise in temperature? A 0.5C rise? 0.4C rise? 0.3C rise?
Causality isn’t something one can observe, Stephen.
Do you have a more coherent sammich to request?
Willie,
So you’re saying you believe?
Math be dammed?
No Stephen, I’m saying that the Humean predicament is the human predicament.
Knowledge as justified true belief is an old idea.
Copernicus, Newton, Einstein, et.al. didn’t observe causality according to Willie. That damn causality can’t be observed.
Which part of “Humean” did you not get, Stephen?
Before you reiterate your silly incredulity, you might wish to consult:
https://plato.stanford.edu/entries/causation-metaphysics/
That was an answerable question, Willie. Maybe not the answer that fits your agenda.
Someone who believes that causality is observable can deny any response he receives, Stephen.
Nobody can force you to make correct inferences.
Stephen, RLH
When you plot temperature data from a station as a frequency distribution you get a normal distribution as seen in Figure 2 here.
https://www.giss.nasa.gov/research/briefs/2012_hansen_17/
Temperatures several degrees above or below the average are less probable, but not unheard of.
Global warming shifts the average and the whole distribution to the right, towards higher temperatures, as seen in Figure 3. This makes new warm records more likely and cold records less likely.
The idea of a Climate Dice can help illustrate the irrelevance of Stephen’s “have caused” quite well:
Two calibrated dice will converge toward seven. One could say that the calibration of the dice “have caused” the convergence, but one can only observe the convergence. No specific dice roll can be said to have been caused by the calibration.
Same for AGW. It loads the Climate Dice. We’ll get more 8s, then 9s, then 10s, up to 13s, like the Northwest got.
So as I see it the question if some event has been caused by something like calibration is a contrarian’s errand. That’s not how empirical sciences work.
Causation gets harder to demonstrate when the cause is a change in average temperature and the effect is a change in the frequency of climate events. You can see the change in frequency given enough data, but you can’t identify which events were specifically caused by the increase in temperature.
Let’s try an analogy.
I take an honest six-sided dice and throw it 1000 times. I expect to see about 167 sixes.
I drill a hole in the one face (opposite the six face) and glue in a lead shot. When I throw it another 1000 times I get 200 sixes.
The dice is now clearly fixed. You can say that 33 of those sixes would not have occurred if I hadn’t fixed the dice, but you can’t distinguish which individual throws were due to the fix and which would have been sixes anyway.
So, let’s assume your shifted and broadened curve is correct. Again, prove that has anything to do with CO2 and how CO2 caused this broadening from 6C to 8C?
“Global warming shifts the average and the whole distribution to the right, towards higher temperatures, as seen in Figure 3.”
Since the 1950s. The change actually went backwards between 1960-1970. i.e. the yellow peak is to the left of the red peak.
Or are you saying that CO2 has only had that effect since the 1960s?
> So, let’s assume your shifted and broadened curve is correct. Again, prove that has anything to do with CO2 and how CO2 caused this broadening from 6C to 8C?
Stephen’s incredulity is invincible.
Prove me wrong.
It looks like to me you’re just taking natural temperature variation and believing it is caused by AGW. Can you show how a 70ppm rise in CO2 caused this? There must be a physical explanation. Isn’t natural variation as good an explanation as any?
Willie,
Whose incredulity? Yours or mine?
Who cares about how it looks to you, Stephen?
>The dice is now clearly fixed. You can say that 33 of those sixes would not have occurred if I hadnt fixed the dice, but you cant distinguish which individual throws were due to the fix and which would have been sixes anyway.
What evidence do you have that this is occurring instead of natural variation?
>Who cares about how it looks to you, Stephen?
Propagandists wouldn’t. You say stupid stuff all the time.
Stephen
Science didn’t prove things, it tests hypotheses and estimates probabilities.
The evidence that CO2 is causing warming is complex and involves observing changes in the relative strength of different emission frequencies in the outward longwave radiation and downward longwave radiation, plus much reference to energy budgets. It also involves vocabulary which Roy’s site rejects.
Much easier to read Chapter 8 here.
https://www.ipcc.ch/report/ar5/wg1/
“Isnt natural variation as good an explanation as any? ”
No.
“Natural variation” is the sum of stochastic variation (which we measure via frequency distributions) and natural forcings. These include solar insolation, albedo, vulcanism, ozone, CFCs, orbital cycles and plate tectonics.
We have enough monitoring capability in place to measure all of them and know that their sum is a slow cooling effect.
Two artificial changes, in CO2 and land use, are also monitored. Together they are sufficient to explain the observed warming.
OK, then explain mathematically how a 70ppm rise in CO2 caused a 3C temperature rise in New Zealand?
You keep repeating a question that already has been answered, Stephen, i.e.:
The evidence is that the likeliness of the extreme events under consideration increased.
If that does not count as evidence to you, you’ll need to revise your conception of evidence. Alternatively, you can crank up your incredibilism:
http://planet3.org/2012/08/24/incredibilism/
In that case everyone will be justified to dismiss you as a contrarian crank.
E man,
Berry has already shown that IPCC’s core hypothesis is wrong. Salby, Harde and Berry among others have shown that CO2 lags temperature on both short and long time scales. Maybe natural variation is a better explanation?
Willie,
You keep showing evidence of random natural temperature variation and assuming a cause. You are a believer, no doubt.
Ed is simply proposing a silly bathtub model of the carbon cycle, Stephen.
How did it succeed in fooling such a fine auditor as you?
> You keep showing evidence of random natural temperature variation and assuming a cause.
You mean that *you* are assuming a cause, Stephen.
I already told you why I don’t.
You’re taking 0.0000025% of the planet’s temperature data and claiming the data isn’t random. How could you possibly know?
Dr. Berry’s bathtub model is in Daniel J. Jacob’s textbook and Murry Salby’s textbook among many others. You apparently haven’t ready many Physics textbooks have you?
Here, Stephen:
https://en.wikipedia.org/wiki/Carbon_cycle
If all you assume a black box, don’t complain if you can’t see inside your box.
> claiming the data isnt random
A quote would be nice.
Willie,
You do understand that AGW implies systematic non-random data? Hansen’s use of a Gaussian distribution would imply a random step change.
Dear Stephen,
You said:
“Youre taking 0.0000025% of the planets temperature data and claiming the data isnt random.”
Where did I make such a claim?
Climate variability isn’t exactly random, BTW:
https://en.wikipedia.org/wiki/Climate_variability_and_change
Willard, please stop trolling.
Real simple, scroll back through earthnullschool through the month of June, and watch the changes in surface winds.
Why was New Zealand’s winter so warm on 1909 in June.
Hasn’t there been global warming for 100 years.
Does it maybe mean global warming has stopped?
I think we probably are still having global warming, and so, it’s just weather.
Thank you.
“What would really interest me would be your rational explanation of the difference between the emission temperature derived from the black box (255K) and the surface temperatures derived from local observation (288K).”
Easy peasy…
The Earth hasnt yet cooled to the computed floor temp of 255 K … Give it another few billion years…
The Earth has an atmosphere because it is warm… It is not warm because it has an atmosphere… Confusion of cause and effect leads ro all kinds of erroneous ideas..
“The Earth has an atmosphere because it is warm It is not warm because it has an atmosphere Confusion of cause and effect leads ro all kinds of erroneous ideas.”
I would agree. By your logic Mercury, being warm, should have an atmosphere, so should the Moon.
Something wrong with your logic?
The Sun, being the hottest, is also the atmospheriest.
Entropic Man, Willard, please stop trolling.
The warm temps for the month of June down in New Zealand are simply caused by surface wind flows. You can go back to see for yourself at earthnullschool.
So, goldminor, are you saying due to natural variation?
Yes, I would call that natural variation. Warm wind flows swept into NZ for most of the month. That only changed in the last 4 or 5 days of the month when cold air flows from the south moved in.
I always enjoy the rambling blah-blah from the anti-science crowd. Here’s Entropic man, at his best:
“The evidence that CO2 is causing warming is complex and involves observing changes in the relative strength of different emission frequencies in the outward longwave radiation and downward longwave radiation, plus much reference to energy budgets. It also involves vocabulary which Roy’s site rejects.”
Translation: There is no evidence CO2 is causing warming.
Translation.
Roy Spencer’s site is, ironically, not a good place to discuss the technicalities of CO2 induced global warming.
Go read Chapter 8.
https://www.ipcc.ch/report/ar5/wg1/
Then try critiquing it here, using the proper technical vocabulary, and see how far you get.
E man,
Ed Berry has completely debunked AR5. Go find another Bible.
“Ed Berry has completely debunked AR5. ”
That turns out not to be the case. Of course, that won’t stop you believing that he debunked it.
Why don’t you go over to Berry’s site and explain to him where he’s wrong? It would be thrilling to see two intellectual giants debate AR5.
Pay me and I will.
I’ll pay what you are worth to shut you up.
No U, dearest Richard.
s t . v w
Ent, the IPCC makes the same mistake as you. They start with the belief that CO2 causes warming. Then they pretend to prove what they believe!
That ain’t science.
Have you ever considered to RTFR, Pup.
Start with the summary:
https://archive.ipcc.ch/pdf/assessment-report/ar5/wg1/WG1AR5_SPM_FINAL.pdf
I emphasized the word that should make you rethink your silly accusation of circularity.
Thanks Will. That’s a good example of what I was mentioning.
They start from their belief, then they look for things to support their belief. Of course, they have to actually “invent” some things along the way….
That ain’t science.
You seem to be really into those “ity” words today.
Is this a pattern? I think Goebbels used “ity” words often.
> They start from their belief
No they don’t Pup.
Here’s how it works:
– increasing greenhouse gas concentrations in the atmosphere
– positive radiative forcing
– observed warming
– understanding of the climate system
=====================================
Human influence on the climate system is clear.
It’s not even a nice try.
We know Earth has warmed from LIA. And we know warmer oceans release more CO2.
Your problem is to prove CO2 causes “positive radiative forcing”. That’s where your nonsense hits a brick wall.
And “understanding the climate system”? You anti-science types don’t.
You had your chance to make an intelligent comment, Pup.
You blew it.
5-minute response time, Will. You’re slipping again.
That’s the kind of trolling you can afford, Pup.
Keep at it.
Willard, please stop trolling.
“Since the 1950s. The change actually went backwards between 1960-1970. i.e. the yellow peak is to the left of the red peak.
Or are you saying that CO2 has only had that effect since the 1960s? ”
I’m restarting. The thread was getting too long.
Firstly, distinguish between warming and statistically significant warming.
Increasing CO2 has been warming the climate since the increase began in 1880. Global average temperature was 13.8C or anomaly -0.2C.
Statistically significant warming required a temperature rise of 0.2C, which didn’t occur till the 1970s at 14.0C or anomaly 0C
The warming has been taking place for 140 years, but we’ve only been 95% confident that warming is occurring since the 1970s.
Secondly, you’re getting as bad as CO2isLife. For the umpteenth time, the increase in CO2 is causing the long term upward trend, but it is not the only variable. Everything from weather to ENSO, PDO, volcanoes and industrial pollution can change the rate of warming. This can cause the slope to increase, decrease, flatten or even go negative for a few years.
E man,
Yeah, make sure your model has those frequent negative sloping variables. It would be too embarrassing otherwise.
Talking of embarassment, perhaps you should resist this temptation to make foolish statements.
Well either you accept what the diagram you mentioned shows or you do not.
Do you recognize that world wide temps were falling from 1400 or so to 1800 or so and rising from 1800 onwards?
and yet
https://climatedatablog.files.wordpress.com/2021/07/mann2008-1.jpeg
Mann’s hockey stick is clearly on show (as also in his 2003 work) and he doesn’t match in detail almost anything else from 1400 onwards either from other sources.
Are you saying that the Medieval Warm Period and the Little Ice age didn’t exist?
The hockey stick is cleaner with your graph, dummy.
https://climateaudit.files.wordpress.com/2012/10/ipcc-1990-figure-7-1-bottom-panel.png
The hockey stick is Mann’s invention.
I bet you never played hockey in your life, that you don’t know what’s the most important part of a hockey stick, and that you have no idea when the MWP happened, Richard.
What do you mean by exist?
http://railsback.org/FQS/FQS22katoFutureTemps03.jpg
You can see a flat spot around 1000AD which is presumably the MWP. After the MWP the downward slope is steeper than before the MWP, which is presumably the LIA.
Neither varies enough to go outside the green confidence limits, so neither is statistically significant.
Perhaps I should reverse the question. Are you convinced that the MWP and the LIA existed? What temperature data do you have to support your belief?
When did the MWP end?
“Neither varies enough to go outside the green confidence limits, so neither is statistically significant.”
So you fall into the group who do not recognize either the MWP or the LIA.
“Analyses from central and southern Greenland (see Greenland Stable Isotopes) show that this region did experience a Medieval Warm Period (culminating around ad 1000), a Little Ice Age cool period (ad 15001900), and warming to the mid-twentieth century (Alley and Koci, 1990; Cuffey et al., 1994; Dahl-Jensen et al., 1998).”
“Medieval period of warming, also known as the Medieval climate anomaly, was associated with an unusual temperature rise roughly between 750 and 1350 AD (the European Middle Ages). The available evidence suggests that at times, some regions experienced temperatures exceeding those recorded during the period between 1960 and 1990.”
“The Medieval Warm Period (MWP) was a time of warm climate from about 900 A.D. to 1300 A.D. when global temperatures were apparently somewhat warmer than at present. Its effects were evident in Europe where grain crops flourished, alpine tree lines rose, many new cities arose, and the population more than doubled. The Vikings took advantage of the climatic amelioration to colonize Greenland, and wine grapes were grown as far north as England where growing grapes is now not feasible and about 500 km north of present vineyards in France and Germany. Grapes are presently grown in Germany up to elevations of about 560 m, but from about 1100 A.D. to 1300 A.D., vineyards extended up to 780 m, implying temperatures warmer by about 1.01.4 C (Oliver, 1973). Wheat and oats were grown around Trondheim, Norway, suggesting climates about 1 C warmer than present (Fagan, 2000).”
> roughly between 750 and 1350 AD
A pity we can hotlink graphs, Richard:
https://climatedatablog.files.wordpress.com/2021/07/mann2008-1.jpeg
“The climatic mechanisms driving the shift from the Medieval Warm Period (MWP) to the Little Ice Age (LIA) in the North Atlantic region are debated. We use cosmogenic beryllium-10 dating to develop a moraine chronology with century-scale resolution over the last millennium and show that alpine glaciers in Baffin Island and western Greenland were at or near their maximum LIA configurations during the proposed general timing of the MWP. Complimentary paleoclimate proxy data suggest that the western North Atlantic region remained cool, whereas the eastern North Atlantic region was comparatively warmer during the MWP—a dipole pattern compatible with a persistent positive phase of the North Atlantic Oscillation. These results demonstrate that over the last millennium, glaciers approached their eventual LIA maxima before what is considered the classic LIA in the Northern Hemisphere. Furthermore, a relatively cool western North Atlantic region during the MWP has implications for understanding Norse migration patterns during the MWP. Our results, paired with other regional climate records, point to nonclimatic factors as contributing to the Norse exodus from the western North Atlantic region.”
Mann 2008 (and 2003) is a perfect example of contamination in the later record. No other study shows such deviation over that time period.
That also suggests that his whole determination is suspect.
“If you consider the world today, many communities will face exposure to climate change,” says Dugmore. “Theyll also face issues of globalization. The really difficult bit is when you have exposure to both.””
https://www.smithsonianmag.com/history/why-greenland-vikings-vanished-180962119/
“After all, they remained in Greenland for at least a century after the climate changed, so the onset of colder conditions alone wasnt enough to undo them.”
“How profitable was the ivory trade? Every six years, the Norse in Greenland and Iceland paid a tithe to the Norwegian king. A document from 1327, recording the shipment of a single boatload of tusks to Bergen, Norway, shows that that boatload, with tusks from 260 walruses, was worth more than all the woolen cloth sent to the king by nearly 4,000 Icelandic farms for one six-year period.”
Oh, and I think you meant to emphasize:
“at least a century after the climate changed”
Updated Greenland T record:
https://www.carbonbrief.org/factcheck-what-greenland-ice-cores-say-about-past-and-present-climate-change
Good grief, Richard.
You’re really not as good as you pretend to be at this:
There are various suggestions as to when the MWP ended. I chose 1400 as being beyond the end of it and when temperature would definitely have started to fall.
Do you differ?
So lame. Using Wikipedia to define MWP. Talk about being out of date and wrong. Will should invest in time doing research about all the papers that have found evidence of warming all over the globe during that period. Time to get current with the science.
> Do you differ?
Mike’s graph does not cover the MWP, dummy.
Mann’s graphs make up his hockey stick.
I prefer your own hockey stick, Richard:
https://climatedatablog.files.wordpress.com/2021/07/mann2008-1.jpeg
Tell me what (other than Mann’s other work) that corresponds to.
A shaft.
“what other”
Many.
https://www.nature.com/articles/s41561-019-0400-0
All AGW fanatics agree that CO2 (and other such things) are the only drivers of global temperatures. Now there’s a surprise.
False, dummy:
“All AGW fanatics agree”
So you admit that you were wrong that just Mann who is finding a hockey stick shape?
So you are forced to now claim that all who do this kind of measurement must be fanatics?
Are they all faking the results?
For the diagram in question (Fig 2)
https://imgur.com/reyOdIH
You might find this interesting.
http://berkeleyearth.org/archive/summary-of-findings/
You are still hooked on trying to disprove your own straw man, the idea that you should be able to explain post-1880 temperature changes using only CO2.
In fact it is considerably more complex. Talk to anyone in the climate trade. They’ll all tell you that industrial pollution, variations in albedo, ENSO and other factors have all added noise to the temperature record.
Look at the second and third graphs in my link. You’ll see that something lifted temperatures above the trend in the late 1930’s and early forties, then depressed temperatures in the 1960s. That’s where your flat spot comes from.
I am suggesting that between 1400 and 1800 temperatures were falling (mostly) and 1800 they have been rising.
“I am suggesting that between 1400 and 1800 temperatures were falling (mostly) and 1800 they have been rising.”
We can agree on that.
You’ve heard my hypotheses regarding the reasons why and seen data like this
http://railsback.org/FQS/FQS22katoFutureTemps03.jpg
Unfortunately you’ve been rather vague regarding your own explaination and haven’t supplied data in support.
The most extreme hockey stick ever presented.
Perhaps you could show me your global temperature data for the period from the MWP to the present.
I am suggesting that between 1400 and 1800 temperatures were falling (mostly) and since 1800 they have been rising.
The lowest point is likely to be about -2c below present and the highest about +1c higher than present.
Willard, please stop trolling.
Who? Me?
“The lowest point is likely to be about -2c below present and the highest about +1c higher than present.”
Or unlikely, if one prefers evidence-derived facts.
Berkley Earth are believers.
Here’s why BEST sucks for you, Stephen:
https://www.nytimes.com/2012/07/30/opinion/the-conversion-of-a-climate-change-skeptic.html
Dragons don’t exist outside blogs.
It’s been a good career choice for him. He was nothing before, now he has a secure income.
Anti-science has its rewards.
> He was nothing before
You really should stick to pure trolling, Pup:
https://en.wikipedia.org/wiki/Richard_A._Muller
Silly Dragons die by the first para of the Wiki entry they fail to check.
Don’t be a silly Dragon.
Anti-science has its rewards.
I thought you were against namecalling, Pup.
Woeful Willy doesn’t realise Sky Dragons are GHE cultists. Well, actually he probably does, but has put his foot in his mouth, and then compounded his stupidity by shooting himself in the foot!
As to Muller – called his tax-exempt non-profit propaganda organisation “Berkely Earth . . . “, obviously hoping that donors would be silly enough to think it was associated with UC Berkely, which of course it isn’t.
Silly enough to include Steve Mosher as a “scientist”.
According to its form 990, one of two main projects in 2019 is –
“Continued work on the science of global warming”. Really? Science? At least Elizabeth Muller gets 94500 USD for 10 hours work per week. Tough job, but someone has to do it!
Mike Flynn,
TL;DR.
Willard, please stop trolling.
EM
” Increasing CO2 has been warming the climate since the increase began in 1880.””
–
This is why debate is so hard.
–
Pick a date,any date??
Why 1880?
No humans on the planet before that??
–
perhaps the comment, “Global average temperature was 13.8C or anomaly -0.2C.” gives it away.
Temperature goes up 0.2C since then, claim CO2 goes up then by mankind only. Claim evidence of an effect that took another 90 years before manifesting itself.
–
Yes CO2 increase on its own mandates a temperature increase long term. But natural variability, cloud cover and compensatory mechanisms are not taken into consideration
Why pick 1880?
It is the first year for which enough stations are available to measure global average temperatures.
Before then you have to rely on proxies.
Much of your post is inaccurate. You might want to check the temperature record.
The temperature record includes the effect of all variables.
When you match the physics with the record you find that the best fit projection for temperature is the warming effect of the CO2 concentration 25 years earlier. The lag is due to the effect of the ocean heat sink on surface temperatures.
Thus the current temperatures were set by the CO2 concentration in the mid-1990s. Current CO2 is setting the temperatures for the 2040s.
Ent, you anti-science types can make up nonsense faster than a blow torch melts ice!
CO2 does NOT heat the oceans. There is NO 25-year lag.
You’re out cherry-picking again.
Clint R says:
CO2 does NOT heat the oceans.
–
It does heat up the air which does help heat up the oceans.
No atmosphere equals an icy meteorite.
255C average means melting temps at equator during day which gives an atmosphere then a sea then global warming.
–
There is NO 25-year lag.
I am happy to concede a mild lag during adjustment due to some feedback.
Entropic man says:
Why pick 1880? It is the first year for which enough stations are available to measure global average temperatures.
–
No.
Man did not start making CO2 only in 1880.
Temperature records do exist before this time.
–
When you match the physics with the record you find that the best fit projection for temperature is the warming effect of the CO2 concentration 25 years earlier.
–
Did they have enough stations to measure global average CO2 in 1855?
No. What did they use?
Proxies.
–
Before then you have to rely on proxies.
I see.
So perhaps you should be comparing proxy temps with proxy CO2?
Awfully messy and often inaccurate.
–
Much of your post is inaccurate. You might want to check the temperature record
.-
The proxy ones? the real ones? The adjusted temps?
The historical written descriptions?
The adjusted UHCN using proxy stations?
–
No. the one whose figures agree with the best fit projection for temperature is the warming effect of the CO2 concentration 25 years earlier.
–
Current CO2 is setting the temperatures for the 2040s.
–
That is such a relief to know. The 415 ppm is actually not doing anything for 25 years.
The air temperature today knows it does not have to respond to 415 ppm.
Voodoo science?
It should be much colder now.
Have you told the IPCC that we do not have to worry for 25 years?
For the diagram in question (Fig 2)
https://imgur.com/reyOdIH
“I would agree. By your logic Mercury, being warm, should have an atmosphere, so should the Moon.
Something wrong with your logic?”
Hello Entropic,
Mercury has pretty much finished cooling. Thus I suspect its observed surface temp will be pretty close to the computed floor temp of a BB absorbing the insolation that Mercury does…
A planet loses atmosphere as it cools, either blown off to space or deposited on the surface…
Saying that the planet would be colder without an atmosphere, is akin to saying that when the planet has cooled… It will be colder… Well of course! No GHE needed..,
“A planet loses atmosphere as it cools..”
You ought to audition for ‘Climate deniers say the darndest things!’ the new reality show on the History Channel.
Again, literally nothing is happening.
Again:
https://www.woodfortrees.org/plot/uah6/plot/uah6/trend
angtech…”The surface of the earth receives 240 W/M2 which all goes out to space. No heat is retained.
The TOA is identical to the surface of the earth in the amount of incoming and outgoing radiation.
That is why it is called the TOA.
The surface is not magically providing an extra 150/W/M2 to heat the atmosphere”.
***
There are problems with the notion of energy balance.
1)Start with Stefan-Boltzmann. The equation started with Stefan, Boltzmann was his student who later took the equation into the realm of statistical mechanics. Stefan got the idea from Tyndall, who had heated a platinum filament wire electrically, noting the different colours produced in the wire as the current was increased.
Another scientist correlated the colours to colour temperature, that is the equivalent colours emitted by a typical piece of metal when heated in a forge. Stefan noticed a T^4 relationship between the temperatures of the heated wire and the frequency of light given off, which is electromagnetic radiation with different frequencies.
The thing to note is that the S-B constant that relates EM intensity to emissivity, area, and temperature, applies only in the temperature range of about 700C to 1400C through which Tyndall’s heated wire ranged. However, scientists since have applied S-B to a theoretical blackbody range of temperatures.
Gerlich and Tscheuschner have already pointed out that the S-B constant does not apply at terrestrial temperatures.
2)Your analysis presumes that radiation is the only means of heating and cooling the atmosphere. It’s far more complex than that. The surface also heats air molecules that touch it and those molecules rise to higher altitudes, being replaced by cooler air molecules from above.
R.W. Wood, an expert on gas radiation/absorp-tion, has pointed out that once the major atmospheric gases, nitrogen and oxygen, are heated at the surface, they cannot radiate away the heat. So, they maintain it. Eventually, as the gases rise to higher altitudes, the pressure will drop and the heat will dissipate naturally.
That is why it becomes so complicated. Heat is being retained by atmospheric gases and the oceans, and there is no way to easily calculate an energy balance. Furthermore, the planet is rotating so that parts of it are receiving solar energy while parts are not.
Also, the planet is tilted and in an orbit that varies the amount of solar input to various parts of the planet. That sets up varying circulations in the atmosphere and oceans, not only annually, but decadally.
“Your analysis presumes that radiation is the only means of heating and cooling the atmosphere.”
–
No
–
Demands, because radiation is the way that the atmosphere cools by radiating to space.
–
Note Roy often mentions extra cloud cover as another way of cooling the atmosphere.
–
“R.W. Wood, an expert, has pointed out that once the major atmospheric gases, nitrogen and oxygen, are heated at the surface, they cannot radiate away the heat. So, they maintain it.
–
The surface radiates intensely in the IR band, this radiation heats H2O and CO2. The molecules move faster transfering energy to O2 and N2 by collision.
This creates the heat rise.
It takes time to build up a steady state in which the O2 and N2 are moving fast enough to give kinetic energy back to the H20 and CO2 so the can emit IR.
At this stage there are three sources of energy to GHG, radiation, back radiation and kinetic energy.
and one way out.
To space.
Convection etc is just a lot of hot air transferring heat around in the atmosphere.
Earlier on, Whacky Wee Willy Gongbeater wrote the following comments at different times –
– and yet
– You’re in my thread, Pup. So you’re the Reply Guy here.
Still no answer. How about emissivity: is that a real object?
– Correction. You’re in EM’s thread.
God I hate Roy’s parser.
– Is OLR an object, Pup?
– Of course it can.
– Of course it can.
– From theorical to abstraction to illusory.
Things escalate quickly in dragon-land.
And so on.
The usual collection of nonsense from idiots of the climate crackpot variety.
He also asked me to prove that the Earth has cooled to its present temperature from its molten state.
Hmmmm. How difficult is that?
I could suggest to the brain dead Wonky Wee Willy Willard that he look at his feet, but he is obviously so delusional that he would not know that his feet are not actually on fire!
What a ninny he is!
I, and others by the look of it, are still waiting for dim-witted climate cranks to come up with a physical reason that would prevent the Earth cooling to its present temperature.
The wait will be long, and in the meantime the GHE cultists will continue their mad denial of reality. All good fun.
Good morning, Mike Flynn.
Is there something you’d like to say?
Willard, what do you think Mike would do if we admitted the Earth has cooled? Hyperventilate? have a stroke? explode?
Boys, you are being mean to an old man. Let him be.
I’m more interested by the next part, DMT:
https://www.drroyspencer.com/2021/07/uah-global-temperature-update-for-june-2021-0-01-deg-c/#comment-746997
Perhaps you don’t know Mike:
https://judithcurry.com/2015/12/27/year-in-review-top-science-stories/#comment-754797
Craig the Warmist Worm!
[Snigger.]
Wriggly Wee Willy,
So you deny the Earth has cooled to its present temperature, do you, idiotic one?
Keep wriggling. Deny, divert, and confuse.
No GHE. No 255 K. Just accept reality. You’ll feel like an idiot, because that’s what you are.
Just like the rest of the denialist climate cranks.
Got anything useful to contribute?
Mike Flynn,
No trace of “CO2” in your comment.
Skipped.
Joy!
Willard, please stop trolling.
studentb…”How do you explain the fact that, worldwide, warm records are being broken at a much faster rate than cold records?
Dont tell me the data is fudged”
***
It’s just the era in which e live. Furthermore, it is only recently that anyone cared.
I don’t think the so-called record temperatures are being fudged, although I have queried the obvious use of weather models in predicting the temps. I am wondering if they are using models locally and messing with the thermometer data to match their predictions.
At the same time, I am not in denial that temperatures were inordinately high in the Vancouver, Canada area ***FOR THE END OF JUNE***. We also set a record cold day for June earlier in the month.
Environment Canada’s records from the Vancouver Airport, which are on the ocean, are several degrees cooler than other reporting media. I am wondering how they determine temperatures farther from the airport.
I contacted EC recently and asked why they have no thermometers at the tops of the local mountains, which average 300 feet. They seemed amused by my suggestion that they were only measuring hot temperatures in heat island atmospheres.
How much of the record temperatures are due to the massive heat islands in our cities?
Re fudging. It is known that GISS has fudged temperatures downward in the 1930s for the US and Canada to give the impression that a uniform warming has occurred since 1850. We really don’t know if we are experiencing unprecedented warming these days.
No one is looking for record cold temperatures since NOAA and GISS are alarmists who have fudged the record to replace cold areas with warm areas via interpolation and homogenization.
“Lapland under extreme heat right now. 34.3°C at Banak, Norway Flag of Norway This level of heat has never been observed above 70 degrees north in Europe before. Scandinavia has been in the oven for a while. A very hot June followed by a hot start to July. Widely 10-15°C hotter than average.”
The question now is:
WHAT PARTS OF THE PLANET ARE NOT EXPERIENCING AN INCREASE IN TEMPERATURE AND HEAT WAVES.
Take a look for yourself, … https://earth.nullschool.net/#current/wind/surface/level/overlay=temp/orthographic=-66.94,79.36,506/loc=-129.443,42.984
What parts of the planet are not experiencing an increase in temperature and heat waves?
See the data in the graph at the top of the thread. None of it, other than localized extreme weather events such as BC Canada was experiencing last week.
This week temperatures in BC Canada are normal.
Meanwhile the cold spot is -62C and the ice is not melting.
Ken
” See the data in the graph at the top of the thread. ”
What’s that for a sheer nonsense?
That data is a worldwide average of temperatures measured at an altitude of 4-5 km.
The student is talking about SURFACES.
And when I look at locations like Kitimat, Stewart, or Fort Simpson above BC, I’m not quite sure the temperatures there are ‘business as usual’.
But… feel free to do your best in looking away, no problem!
J.-P. D.
“NOAA and GISS are alarmists who have fudged the record to replace cold areas with warm areas via interpolation and homogenization.”
You are not paying attention. I explicitly said:
“Dont tell me the data is fudged”
I am not interested in paranoid conspiracy theories.
What? They admit they’ve adjusted it, especially third world data.
“Fudged” ain’t “adjusted,” Stephen.
Also, beware your wishes:
https://www.carbonbrief.org/explainer-how-data-adjustments-affect-global-temperature-records
Whickering Wee Willy,
And of course, you can’t say how much the “world” has “warmed”, can you?
Maybe you could post a link to an irrelevant site which doesn’t know, either?
Give it a try.
Mike Flynn,
Enjoy your afternoon.
Willard, please stop trolling.
> Environment Canadas records from the Vancouver Airport, which are on the ocean, are several degrees cooler than other reporting media
Still 4-8C higher than normals:
https://climate.weather.gc.ca/climate_data/daily_data_e.html?StationID=51442&Month=6&Day=1&Year=2021&timeframe=2&StartYear=1840&EndYear=2021
Willie,
Please explain showing evidence why Vancouver’s temperature is 4-8C higher than normal?
Stephen,
There you go:
https://www.drroyspencer.com/2021/07/uah-global-temperature-update-for-june-2021-0-01-deg-c/#comment-747148
Most welcome!
Witless Wee Willy,
Still trying for a job as a weather reporter?
Keep trying.
Mike Flynn,
Gordon mentioned the Vancouver Airport.
He made me look.
Go bite his ankles!
Bite your own.
You are 75 years old, Richard.
Wrong.
No, Richard.
U are wrong, I am correct.
Should I bother with the Monday LaNina update ?, The forecast has come a long way since I pointed out the second Lanina is brewing 3 month ago, Everyone is now pretty much aware it is coming,
except few climate wackos like Bidendong and barry, they still can’t see it, but don’t tell them, make it a surprise.
https://www.cpc.ncep.noaa.gov/products/CFSv2/imagesInd3/nino34Mon.gif
http://www.bom.gov.au/climate/ocean/outlooks/archive/20210703//plumes/sstOutlooks.nino34.hr.png
But we can’t have a La Nina later on this year. Global temperatures are not likely to rise if that is the case.
What puzzles me is that denialists are happy to place their faith in the models which forecast weather and El Ninos. Yet they disparage the very same models which predict global warming. Can somebody pleas explain this?
Short term forecasts are more likely to be accurate than long term ones?
ENSO models are based on REAL data.
AGW models are based on nonsense.
Surprise? What surprise?