Summer Causes Climate Change Hysteria

July 3rd, 2018 by Roy W. Spencer, Ph. D.

Summers in the U.S. are hot. They always have been. Some are hotter than others.

Speaking as a PhD meteorologist with 40 years experience, this week’s heat wave is nothing special.

But judging from the memo released on June 22 by Public Citizen (a $17 million per year liberal/progressive consumer rights advocacy group originally formed by Ralph Nader in 1971 and heavily funded by Leftwing billionaire George Soros’s Open Society Foundations), every heat wave must now be viewed as a reminder of human-caused climate change. The memo opines that (believe it or not) the news media have not been very good about linking weather events to climate change, which is leading to complacency among the public.

The June 22 memo focus was on the excessive heat in New York state, so let’s begin our journey down Hysteria Lane there. The official NOAA average maximum temperatures for every June since 1895 in New York looks like this:
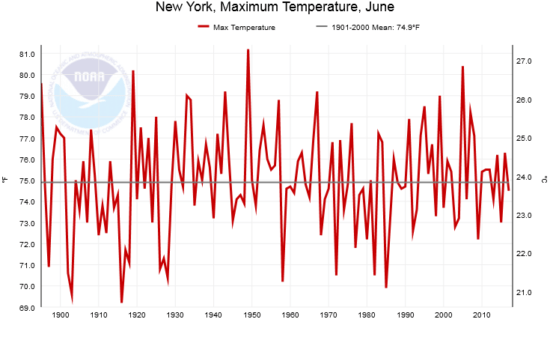
Fig. 1. Average June maximum temperatures in New York state for every year from 1895 through 2017 (Source: NOAA)

The long term trend is not statistically different from zero. June 2018 is not yet available at the NOAA website, but from what I’ve seen for the global June Climate Forecast System map at WeatherBell.com, it looks like it was near the long-term (20th Century) average.

The memo also made mention of the widespread record warmth the U.S. experienced in May, 2018. New York had it’s 7th warmest May on record this year, and the long-term linear warming trend there since 1895 is weak (0.22 F/decade) and not statistically different from zero at the 95% confidence level. The May warmth in the U.S. was regional, as expected for weather variations, with much of Canada being exceedingly cold:
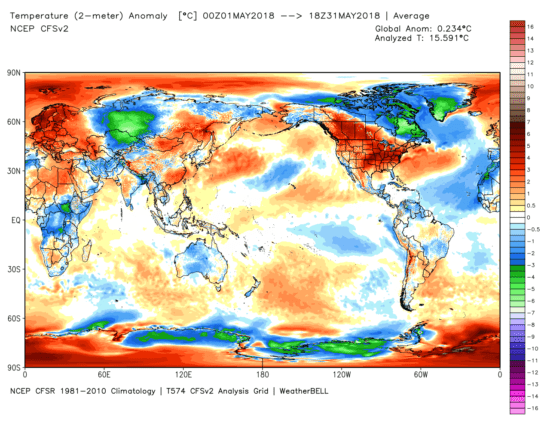
Fig. 2. NOAA CFS model-diagnosed surface temperature departures from normal for May, 2018, showing the regional nature of the record U.S. warmth that month (graphic courtesy of WeatherBell.com).

When do you suppose the hottest temperature ever recorded in New York was? Clearly, with global warming, it must be in the last 20 or 30 years, right?

Wrong.

It was 109 deg. F. on July 22, 1926 in Troy, New York. In contrast, the state record for the coldest temperature was much more recent: -52 deg. F on Feb 18, 1979, at Old Forge, New York.

What about this week’s heat wave? Let’s look at NOAA’s GFS forecast model 5-day average temperatures for this week (Monday through Friday, July 2-6, 2018, graphic from WeatherBell.com):
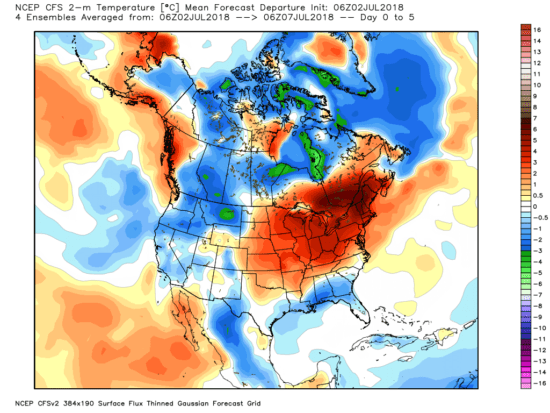
Fig. 3. 5-day forecast average temperature departures from average over North America from the GFS model (graphic courtesy of WeatherBell.com).

As you can see, the excessive heat is (again) regionally isolated, which is exactly what we expect for weather… not for climate change. See those colder than average areas? Why aren’t those being blamed on climate change, too? They look like they approximately cancel out the warm area over the Northeast U.S., which is often the case for weather (not climate change) variations.

That was a 5-day forecast for this week. Next let’s look at what was actually observed over the last couple days (July 1-2), which were very hot in the Great Lakes and Northeast:
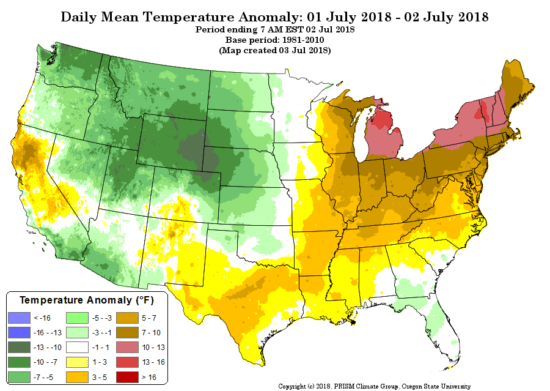
Fig. 4. Oregon State University Prism temperature analysis for July 1-2, 2018, as departures from the 1981-2010 average.

What we see is that there were unseasonably cool temperatures in the western U.S., again an indication of a temporary and localized weather pattern… not “global warming”, which would be warm everywhere.

How about extreme high temperatures in the U.S in general? Here are the yearly total number of days above 100 and 105 deg. F, again for the years 1895 through 2017, based upon official NOAA data:
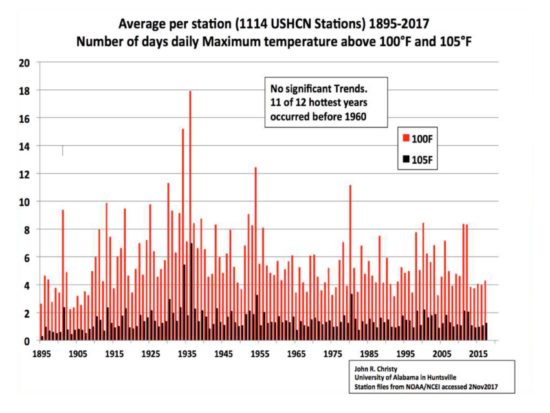
Fig. 5. Yearly average number of days per U.S. station having at least 100 or 105 deg. high temperatures, 1895 through 2017.

We see no trend in the number of days with excessive heat.

So, what do we make of the claims in the Public Citizen memo? Well, they mention that we have seen 1.1 deg. C of warming since the Industrial Revolution. Think about that. Less than 2 deg. F warming in about 200 years, part of which is likely to be natural, based upon temperature proxy estimates over the last 2,000 years for the Northern Hemisphere:
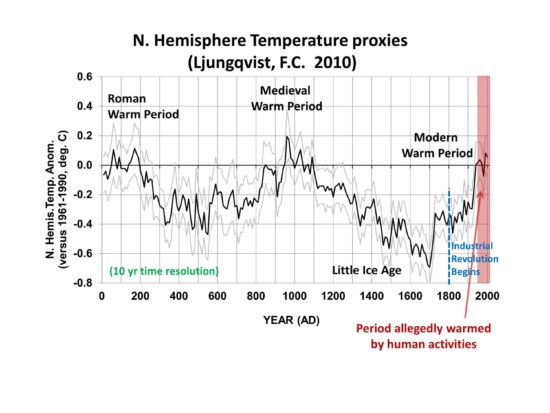
Fig. 6. 2,000 years of Northern Hemisphere temperature variations from an average of a number of temperature proxies. The period of substantial human-caused warming is generally agreed to be only since 1950 (U.N. IPCC AR5).

Am I claiming that there is no such thing as human-caused warming? No. I’m claiming that it is overblown. The Public Citizen memo makes much of recent record warm years clustering together, which sounds alarming — if one doesn’t mention the small fractions of a degree involved. If there was no natural year-to-year variability, and the temperature was increasing at 0.01 or 0.02 deg. F every year, then every successive year would be a record warm year…but who would care? The rate of ‘global warming’ is too weak for any one person to notice in their lifetime.

Furthermore, we already know the climate models (which are the basis for proposed changes in energy policy to get us away from fossil fuels) are producing generally twice as much warming of the atmosphere-ocean system as has been observed. The most recent energy budget analysis of surface and deep-ocean warming suggests that the climate system is only half as sensitive to our CO2 emissions as you are being told…. maybe 1.5 deg. C of eventual warming from a doubling of atmospheric CO2. At 410 ppm, We are currently half way to doubling.

And even THAT reduced estimate of future warming assumes ALL of the warming is human-caused! If a portion of recent warming is natural, the less the human-caused global warming problem becomes.

Finally, the Public Citizen memo claims that today’s technology would already allow 80% to 100% of our energy to come from renewable sources. This is patently false. Solar and wind are relatively diffuse (and thus expensive) sources of energy which are intermittent, requiring fossil fuel (or nuclear) backup. It would be exceedingly expensive to get even 50% of our energy from such sources. Maybe someday we will have such technologies, but until that day arrives, the massive amount of money that would be required to achieve such a goal would worsen poverty, which historically has been the leading cause of premature death in the world.


2,644 Responses to “Summer Causes Climate Change Hysteria”

Toggle Trackbacks

  1. John Garrett says:

    Thank you, Dr. Spencer.

    I rely on your work. It is invaluable.

    • Myki says:

      Invaluable?
      That adjective could be be queried. For example:
      Fig 1. Only goes to 2017. Only refers to average maximums
      Fig 2. Only refers to May. Only refers to model-diagnosed (not observed) temperatures. (Why do we suddenly trust models? )
      Fig. 3. Again just a model product.
      Fig.4. Note that the maximum anomaly is greater than +16 while the minimum anomaly is no cooler than -13.
      Fig. 5 Incorrectly refers to hottest years instead of years with highest number of..
      Fig. 6. Time series only extends to about 2000.

      Summary: Not up to publishable standard.

      • Rob Mitchell says:

        Maybe not up to your “pal review” standard.

        • Myki says:

          But definitely above “moronic standard”.

          • Laura says:

            Please provide links to a just few AGW blog posts where you criticize their content as “Summary: Not up to publishable standard.”

          • Nate says:

            Laura,

            Please provide links to a just a few skeptic blog posts where you criticize their content.

            Please provide links to you suggesting some skeptics are Nazi sympathizers.

          • Rob Mitchell says:

            So, is it your point that Dr. Spencer’s work is only above “moronic standard?”

          • Steve says:

            I’m glad someone like Dr Spencer is willing to slow the train. In year 2100, had I to choose between 11.2 billion people or 1 billion (denier or alarmist), I choose the former.

          • Laura says:

            As expected, “Myki” has no standards.

            One more anti-human climate alarmists to completely ignore.

      • E. Swanson says:

        Figure 6 refers to Ljungqvist (2010) and that paper may be repeating some typical errors. For example, Ljungqvist references Loehle (E&E, 2007), which was a deeply flawed work, as noted in a post on Real Climate. The Loehle (E&E, 2007) paper was rapidly “corrected”, but still contained several flaws, which led me to write a letter to the Editor in reply.

        Loehle’s main failure was in his dating of the proxy records, many of which do not continue into the 20th century, especially as the radiocarbon dating used to build date models ends in 1950. The graph in Figure 6 appears to end in the year 2000, but one can’t know whether these data are correct without checking each proxy record for dates. One such example is the Kegwin (1996) results, which include a reservoir correction to the radio carbon ages which is dubious. And, of course, Figure 6 is a NH extra tropical compilation, not global result, so one must be careful with the interpretation of these combinations.

      • Dave N says:

        “Fig 1. Only goes to 2017. Only refers to average maximums”

        Wow.. 1 year short of being current. AGW is supposed to have been happening since way before 2017, and the trend is what is important. If runaway warming was happening, the averages would be increasingly higher, significantly – they are not, at all.

        “Fig. 5 Incorrectly refers to hottest years instead of years with highest number of..”

        Speaking of incorrect: you are. Fig 5 *correctly* shows the *number of days* above 100 and 105 for *each year*. Again, if there was out of control warming, the numbers would be becoming significantly higher. Again, they are not.

        Summary: Your review isn’t up to standard.

      • pbweather says:

        That adjective could be be queried. For example:
        Answer: Queried perhaps, but not wrong.

        Fig 1. Only goes to 2017. Only refers to average maximums
        Answer: 2018 is not finished yet so average not yet available.

        Fig 2. Only refers to May. Only refers to model-diagnosed (not observed) temperatures. (Why do we suddenly trust models? )
        Answer: Global observations stations are not evenly spaced around the world. All global temp calculated maps from major climate centres use model initalization gridpoint analysis values to get a smooth cover of the globe or use homogenization.

        Fig. 3. Again just a model product.
        Answer: Same as above. Normal practice from Climate monitoring centres. e.g. GISS https://data.giss.nasa.gov/gistemp/maps/ Try to plot obs stations on this map and work out how they came up with the temp anomaly contours https://data.giss.nasa.gov/gistemp/warm_stations/used_stations.gif

        Fig.4. Note that the maximum anomaly is greater than +16 while the minimum anomaly is no cooler than -13.
        Answer: Irrelevant and false. It has <-16 cold anomaly range.

        Fig. 5 Incorrectly refers to hottest years instead of years with highest number of..
        Answer: The graph clearly states it is the average number of days per station in the hottest range. More average hotter days = some years hotter than others therefore using hottest years is a valid statement

        Fig. 6. Time series only extends to about 2000.
        Answer: Ljungvist proxies only run to 1999. It is common for proxy temps to finish years if not decades prior to current temps due to the nature of the proxies. The paper was published in 2010

        Summary: Not up to publishable standard.
        Answer: It is a blog post and never designed for journal publication so why compare it? However, if you ever bothered to take off your blinkered pro AGW glasses you might look at the data and what is shows….rather than blindly attacking the author.

        • Rob Mitchell says:

          Confirmed! Myki Mouse gave a “pal review” assessment of Dr. Spencer’s blog post!

        • Myki says:

          “Fig 1. Only goes to 2017. Only refers to average maximums
          Answer: 2018 is not finished yet so average not yet available.”
          FOCUS! The graph refers to JUNE temperatures, NOT annual average temperatures.

          “Fig 2. (and Fig. 3) Only refers to May. Only refers to model-diagnosed (not observed) temperatures. (Why do we suddenly trust models? )
          Answer: Global observations stations are not evenly spaced around the world. All global temp calculated maps from major climate centres use model initalization gridpoint analysis values to get a smooth cover of the globe or use homogenization.”
          FOCUS! The topic is summer, and specifically last week.
          Secondly, you are now telling me that you trust models over observations! Why not simply show the observational-based map for May? They are available.

          “Fig.4. Note that the maximum anomaly is greater than +16 while the minimum anomaly is no cooler than -13.
          Answer: Irrelevant and false. It has +16). There are NO blue regions shown (<-13).

          "Fig. 5 Incorrectly refers to hottest years instead of years with highest number of..
          Answer: The graph clearly states it is the average number of days per station in the hottest range. More average hotter days = some years hotter than others therefore using hottest years is a valid statement"
          FOCUS FOCUS! The legend refers to:
          "11 of 12 hottest years occurred before 1960"
          It does not follow that the year with the largest number of hot days corresponds to the "hottest" year. A simple, but significant error.

          "Fig. 6. Time series only extends to about 2000.
          Answer: Ljungvist proxies only run to 1999. It is common for proxy temps to finish years if not decades prior to current temps due to the nature of the proxies. The paper was published in 2010"
          THEN WHY SHOW IT? There are plenty of more up-to-date (hockey-stick) graphs which could have been shown.

          "It is a blog post and never designed for journal publication so why compare it? However, if you ever bothered to take off your blinkered pro AGW glasses you might look at the data and what is shows….rather than blindly attacking the author."
          I am glad you agree that it the post is not publication standard. That is all I did. Where did I "blindly attack the author".

          Summary: you are an idiot.

          • pbweather says:

            Myki now you are blindly attacking me by calling me stupid so setting out your stall on behaviour.

            Re 2018 data ….June data has not yet been collated so he can’t put it on the graph if you had bothered to check.

            No I don’t trust wx or climate models I used them every day in my job and know their faults. I pointed out the folly of homogenization or using model derived grid point initialization values as though they are observations particularly in sparse sample areas like the Arctic, Antarctic or ocean regions.

            The 11/12 hottest years was clearly referring to the graphed data and is a true statement with respect to that graph. Your assumption that it referred to some other metric is your own mis-reading of the statement.

            Feel free to show a more up to date temp PROXY dataset than 1999. They are hard to find and are probably unreliable anyway. The hockey stick was modern observed temp data spliced on to proxies that have huge error bars and are not comparable. You will note that Dr Roy did not (correctly) even attempt to do this….unlike the Mann hockey stick cult.

      • Joe says:

        RE 1) Basic Math suggests you are missing the point (I hope not avoiding it) that even if 2018 is tied or even tops the highest record, it would still be statistically insignificant.

        The data is from NOAA, not a denier site.

        Fig. 1 might have a better label, but it clearly shows June Maximum temps not “Only average maximums”.

      • Thermo says:

        If you know anything about temperature data, then you know there’s no such thing as an “average daily temperature.” There is “average daily maximum” and “average daily minimum.” That’s why the chart “only refers to average maximums.” That’s how the data is collected — that’s ALL THE DATA THERE IS (besides “daily minimum”)

        If you have an issue with the data, then take it up with NOAA or NASA. 😉

    • jane says:

      Trump won election, the assholes lost.

    • jane says:

      The problem is Dr. Roy is using B.S. democrat government stats. And we all know the democrats are lying assholes.

  2. jimc says:

    “Am I claiming that there is no such thing as human-caused warming? No. I’m claiming that it is overblown.”

    The obvious question is why is it being overblow? Obvious answer, the left wants CAGW – for use as an excuse for more government control. I.E. Never trust the left.

  3. Excellent information and proves all of my points.

    • Mike says:

      This is where David A comes in, shows Salvatore’s previous statements… several other people jump in arguing about slightly off-topic areas until we are completely off topic and it goes on and on and on and on.

      • WizGeek says:

        MIKE! You made my day! [ROFLMAO] Your comment is, in a nutshell, the progression of most of Dr. Spencer’s posts. The Alarmists vs. Realists conflict likely will continue well into the next time our solar system cycles back through the galactic gas and dust disk of the spiral arm in which our system resides.

      • Laura says:

        That’s fine, Mike. People are free to do as they wish. The important issue is that there is nothing going on climate-wise that is of alarm.

        • Rob Mitchell says:

          I agree with Laura. I’ve been hearing nothing but doomsday stories during the past 40 years. And I am most certain that every generation that comes up will always create a new version of DOOMSDAY!

        • Nate says:

          This particular one is quite persistent- 30 y so far

          • Rob Mitchell says:

            And quite persistently wrong! The Arctic ice was supposed to have melted by now according to the gloom and doomers. As more and more data pours in, the more and more so-called global warming will be seen as a natural multi-decadal cycle.

          • Nate says:

            Nope. No serious people said that.

  4. Curious George says:

    Summer IS climate. Winter is only weather.

    • Laura says:

      Anti-human climate alarmists do not care about weather or climate. They are just anti-human.

      Consider this thread and its comments. Everyone’s intentions are patently clear.

      The good doctor tries to calm people down. Hysteria is clearly a bad thing. The resident anti-human climate alarmists attack him for it.

      Why? Because anti-human climate alarmists want people to be hurt as much as possible, to be as distressed as possible, to be as desperate as possible, to be as anti-human as they themselves are.

      Consider the resident anti-human climate alarmists offer no criticism whatsoever of the false reports that are making people hysterical. Instead, anti-human climate alarmists are fanatically critical of anything and anyone trying to relieve people of the fears created by the reports fabricated by anti-human climate alarmists.

    • Nate says:

      Oh boy.

      Laura understands people’s intentions.

      For example, she judges that leading climate scientists would have been pro-Nazi, and would have wanted to go to Nazi Germany and work at concentration camps ( a previous comment of hers).

      Laura encapsulates all that is wrong with America right now.

      She believes people that disagree with her, or have different priorities than her, are not just wrong.

      They are also evil.

  5. Tim Folkerts says:

    Roy, you have me rather confused.

    You say: ” The June 22 memo focus was on the excessive heat in New York state”. You show a chart of maximum June temperatures in New York.

    Yet according to the linked memo:

    “Summer is just starting, and already we are smashing heat records. In May 2018, every state in the U.S. experienced above-average temperatures, and eight set records. We experienced not only the warmest May on record, but also the warmest three-, four- and five-year periods on record. These developments follow a disturbing long-term trend: The hottest year on record was 2016, with 2015 and 2017 close behind. Seventeen of the hottest 18 years on record have occurred since 2001, and people born after 1977 have never experienced a year in which temperatures were below the 20th century average.”

    • I’ve added a paragraph and an additional plot to address the warmth in May, and later in the article I’ve added a discussion of record warm years clustering together.

      • Rob Mitchell says:

        During my 38 years in the weather biz, I can’t help but notice how the AGW alarmists get so fixated on some regional weather event, and then try to attach some sort of meaning to it; that being WE CAUSED IT. Instead of getting so fixated on something, why not look at everything?! Maybe looking at everything gets in the way of “The Planners.”

        I remember the late great Dr. William Gray publicly stated that there never has been a real dialogue between atmospheric scientists. And the reason for that was because a group of folks in government made a proclamation that the earth is warming and that humans are causing it. And the only way to get your atmospheric research funded was to prove this point. Gray said that the proper way this issue should have been handled was to split the research 50/50 between AGW causes and natural climate variation. Then, the geo-scientists could compare their results and make their suggestions together to the policy makers after both sides have had their dialogue. But instead, the funding ended up being extremely one-sided, and I think we all know what side that is!

        Dr. Spencer, is there any sign that things might be changing on this front? I’m glad that I work in the private sector, so I don’t have to personally worry about it. But I am interested about how government funds science from the standpoint of a taxpayer.

        • Nate says:

          ‘And the reason for that was because a group of folks in government made a proclamation that the earth is warming and that humans are causing it. And the only way to get your atmospheric research funded was to prove this point. ‘

          Weird conspiracy theory yur tossin out there.

          Most of the people who studied climate change and discovered AGW do not work for the US government. Many live in other countries.

          Of course some do work for NASA and NOAA, but they don’t control the rest off the science world, as you seem to think.

          An example: Roy Spencer worked, in some fashion, for NASA, or received funding from them. Was he compelled to prove AGW true? Obviously not.

          • Rob Mitchell says:

            The late great Dr. William Gray sure thought government funding for climate research was awfully one-sided! In fact Gray said much of his own funding was severely cut by Al Gore when he was running the show, and whipping up AGW hysteria.

            I’m sure Dr. Spencer can tell you about the pro-AGW agenda that exists at NASA.

          • Nate says:

            ‘cut by Al Gore when he was running the show’

            Al Gore was never in charge of science funding.

          • Nate says:

            ‘the pro-AGW agenda that exists at NASA.’

            or is it a pro-science agenda that exists at NASA?

          • Chic Bowdrie says:

            There is a reason they called it the InterGOVERNMENTal Panel on Climate Change.

        • Myki says:

          Apparently, there are no peer-reviewed climate papers by William Gray that take a negative or explicitly doubtful position on human-caused global warming.

          • Richard M says:

            Apparently, there are no peer-reviewed climate papers by William Gray that take a positive or explicitly supportive position on human-caused global warming.

            That should tell you something. One of the recognized world experts couldn’t get his views through peer review??? However, we know what his views were and they are being supported more and more every day by reality.

            https://tropical.colostate.edu/media/sites/111/2018/01/Bill-Gray-Climate-Change.pdf

          • Myki says:

            “That should tell you something. One of the recognized world experts couldnt get his views through peer review???”
            Huh?
            More likely he didn’t write or submit any.
            If he did, but couldn’t get through peer review, then that would indicate his ideas were insufficiently substantiated.
            Even if he failed peer review, he still got his views disseminated- as you attest.
            So, what is your problem?

          • Richard M says:

            Myki, I see you are in complete denial. Must be tough with the global temperature dropping so much. LOL.

          • Rob Mitchell says:

            Allow Bill Gray to tell you what happened to his funding after his encounter with Al Gore. Go to 3:45

            https://www.youtube.com/watch?v=Lr2DEiPHlkg&t=169s

          • Myki says:

            All that happened was he didn’t join a panel. No link to funding issues.
            Secondly, why would an 82 year old be in line for public research dollars? By that age you could fund your own research.

      • Mark B says:

        “The June 22 memo focus was on the excessive heat in New York state . . .”
        It’s odd then that the linked memo doesn’t make any mention of New York state.

        It’s also curious that the memo focused on something that hadn’t yet happened at the publication date.

  6. steve case says:

    If you add a trend to Figure 1, the trend is up since 1895 and since 1918 it’s down. If you plot out the warm months (May-Oct) for each state and map the results (how far back can you find a negative trend), it looks like this:

    http://oi67.tinypic.com/10er3ps.jpg

  7. ren says:

    You can see that the jet stream will draw warm air from the southwest to the Great Lakes.
    http://virga.sfsu.edu/gif/18070312_jetstream_h24.gif

  8. barry k says:

    Roy,

    I think your last paragraph sums things up and renders much of the spirited debate on this blog moot. Getting 50% of our energy from solar/wind would require either a fully functioning smart grid up front (estimated to cost a few trillion) or massive energy storage capacity (probably more than doubling the cost). It would also take decades to accomplish given the permitting and lawsuits that would accompany building out new transmission lines. But that isn’t going to matter to the liberal-minded. My experience is they somehow believe they have a moral obligation to require others to live up to their standards (i.e. going green…) without realizing their standards are off. They apparently seem to think that a reasonable effort by the collective middle class in our country (keep in mind the poor and rich are generally ‘free’ from an income tax) is enough to actually bend the needle on global CO2 levels. If they practiced what they preached and actually attempted to substantially reduce CO2 emissions (what everyone in the world would need to do…), maybe they would understand…

    Barry

    • Nate says:

      50% of electrical energy?

      Already being done in some countries:

      https://en.wikipedia.org/wiki/Renewable_energy_in_Denmark

      Many US states already have high % renewable

      https://en.wikipedia.org/wiki/List_of_U.S._states_by_electricity_production_from_renewable_sources

      • barry k says:

        …. trying to post again the right spot…

        Nate,

        I was referring to solar/wind in the USA. In your second link the USA gets about 8% from non-hydro (more than just solar/wind). To get 50% in the USA from wind/solar would be a massive undertaking costing trillions of dollars and taking many decades.

        Cheers,
        Barry

      • Nate says:

        1st example, Denmark, demonstrates feasibility.

        States-

        some have > 35 % wind and/or solar, again showing feasibility, and willing investment in it.

        Both continue to see price declines, so that incentives are phasing out.

        Just the beginning, but it seems to be ramping. Couple of decades, ok, why not?

        • barry k says:

          Nate,

          Your second link above has US electricity from wind at 6%. Your first link has Denmark wind generating capacity of 5GW. A Wikipedia page titled “Wind power in the United States” has the USA at 82GW. Basically, Denmark proves nothing. Besides the fact that orders of magnitude separate the two, much of the wind resource in the USA ins’t near population centers. The permitting alone that would be necessary to build out transmission lines on a large scale would take decades.

          Regarding individual states, are you referring to the w/o Hydro column, because that includes more than just wind/solar (i.e. biomass). Furthermore, using Vermont (with a whopping 0.05% of the electricity consumption in the USA) as an template for the whole country is questionable at best.

          That being said if individual states want to push and build out wind capacity, more power to them. Some states have better wind resources and less need. Furthermore, individuals and businesses can vote with their feet and leave….

          Cheers,
          Barry

          • Nate says:

            ‘That being said if individual states want to push and build out wind capacity, more power to them. Some states have better wind resources and less need. ‘

            Agreed.

            ‘Furthermore, individuals and businesses can vote with their feet and leave.’

            They will want to leave Texas because its rapidly expanding wind power??

            See also regarding govt support of energy:

            https://www.eia.gov/analysis/requests/subsidy/

        • Bill_W_1984 says:

          Denmark has 6 million people clustered mostly
          in a handful of large cities.

      • Rob Mitchell says:

        Nate, I checked your link out about US states. Did you see that nice, neat little pie chart in the upper right-hand corner? In case you pretended that it didn’t exist, allow me to tell you what it shows for US sources of electricity in 2016.

        Natural Gas – 33.8%
        Coal – 30.4%
        Nuclear – 19.7%
        Hydro – 6.5%

        That is a total of 90.4% so far.

        Wind – 5.5%
        Biomass – 1.5%
        Other – 2.6%

        I guess solar was included with “other.”

        Using government force to make other people buy the type of electricity you like is nothing but pure authoritarianism. That is why many of us not on board the human-caused global warming bandwagon consider much of AGW research to be agenda driven.

        I like what Dr. Lindzen stated. “You control carbon, you control life.” I know Dr. Spencer and Dr. Christy have stated similar things before Congress.

        • Nate says:

          The point was to show that near 50% is feasible-it is nearly so in some states and countries, even now.

          But yes, overall in US, electric generation by wind and solar was 5% in 2016. But 10 y prior to that it was ~ 0.

          What does that tell you?

          • Rob Mitchell says:

            No big surprise Nate, especially if you take a drive through West Texas. There, you will behold a sea of wind turbines. Do I have anything against that? Of course not! In fact, the wind energy generation in Texas is something I am proud of. But I don’t want to force this type of energy onto anybody. I prefer that this method of power production grow by market choice.

            I am a Tesla owner. And I am constantly battling Tesla owners from California in the Tesla Forum about whether to use the force of government to make people buy battery electric vehicles or not. I want Tesla and other Battery Electric Vehicles (BEV) grow by market choice. Not by government mandate! And if you are opposed to government mandates for “green” energy, then you are a “denier.”

            This is why I consider AGW proponents to be more interested in an agenda than they are in actual climate science.

          • nate says:

            ‘In fact, the wind energy generation in Texas is something I am proud of. But I dont want to force this type of energy onto anybody.’

            Agreed., totally. Whos saying it should be forced?

            I am for all the market determining the source.

          • Nate says:

            Regarding whether the market is truly free, Im sure subsidies will be brought up.

            This may be of interest, from EIA. It shows that subsidies for renwable have been much much lower than those for fossil fuels or nuclear.

            https://www.eia.gov/analysis/requests/subsidy/

          • Nate says:

            ‘This is why I consider AGW proponents to be more interested in an agenda than they are in actual climate science.’

            IMO, one should not judge the science through an ideological lens.

            But, in discussions I find many AGW opponents are more driven by an agenda than they are by legit problems with the actual climate science.

            Eg, the acceptance of conspiracy theories about climate scientists and their findings, as fact.

          • David Appell says:

            Rob Mitchell says:

            No big surprise Nate, especially if you take a drive through West Texas. There, you will behold a sea of wind turbines. Do I have anything against that? Of course not! In fact, the wind energy generation in Texas is something I am proud of. But I dont want to force this type of energy onto anybody. I prefer that this method of power production grow by market choice.

            Do you care about the damage costs of fossil fuel pollution?

            To health and to the environment?

            What is it worth to keep the climate — a valuable resource — from changing?

            PS: energy is energy. You will still plug your toaster into the same outlet.

          • Nate says:

            ‘It shows that subsidies for renwable have been much much lower than those for fossil fuels or nuclear.’

            Whoops, misread it.

            Actual breakdown shows more for W and S than coal, gas, oil, nuclear.

            https://www.eia.gov/analysis/requests/subsidy/pdf/subsidy.pdf

        • Nate says:

          Power generated (TWh) from US EIA 4/2017-4/2018

          https://www.eia.gov/electricity/monthly/epm_table_grapher.php?t=epmt_1_01_a

          https://www.eia.gov/electricity/monthly/epm_table_grapher.php?t=epmt_1_01

          wind 264

          solar 83

          W+S 347

          All sources 4070

          % W+S 8.5 %

        • Bart says:

          Denmark is surrounded by waters subject to the North Sea winds. Its population is all of 6 million – about that of metro Atlanta.

          • Mark says:

            I think what he is trying to say is if eliminate everyone besides 6 chosen people (very green people), we too can achieve this.

          • nate says:

            The conversation started with PERCENTAGE renewable cannot be high. In Denmark it is high.

        • Gordon Robertson says:

          Rob…”Using government force to make other people buy the type of electricity you like is nothing but pure authoritarianism”.

          It’s also called capitalism with a fascist flavour. Fascism is a reference to a small group controlling the economy. Here in Canada we are being held ransom by gas companies fixing gasoline prices. When their capitalist-oriented government friends investigate they claim there is no evidence.

          Every gas company here sets their prices within tenths of a cent of each other and they go up and down in unison. They call it supply and demand but when is there not a demand for gas?

          The greenie politicians don’t get that or they don’t want to see, because playing the carbon game pays big dividends for them.

          • Nate says:

            Gordon, Here you can see how the US govt supporting non-Green energy, more so than Green.

            http://www.drroyspencer.com/2018/07/summer-causes-climate-change-hysteria/#comment-310538

          • Gordon Robertson says:

            nate…”Here you can see how the US govt supporting non-Green energy, more so than Green”.

            I agree that politicians are hypocritical. When it comes to a tax dollar they talk out of both sides of their mouths. Here in Canada, our PM, Justin Trudeau, strongly advocates green initiatives yet he is strongly in favour of an oil pipeline.

          • Rob Mitchell says:

            Gordon, I also think it is a way for government to find yet another way to separate the working class from their hard-earned dollars. Authoritarians want to slap a massive carbon tax onto the populace because of their gasoline and electric power consumption. Richard Lindzen stated that if government can convince its citizens that they have to pay higher taxes to save the world, then the citizens would be more willing to pay. I think that is the driving force behind AGW mantra.

          • Nate says:

            Rob, recall you said this ‘This is why I consider AGW proponents to be more interested in an agenda than they are in actual climate science.’

            Yet most of your posts have to do with concerns over ‘agendas’ and policies, not the science.

            Could it be that your agenda is biasing your judgement of the science?

          • Rob Mitchell says:

            Nate, I have been battling fellow Tesla owners about free market choice vs. government intervention during the past 4 years in their Forum. I have been a marine/aviation weather forecaster for 38 years. I can’t help but notice that those who are devout believers in AGW are the ones who want to alter other people’s lives in the type of vehicle they can buy or the source of electricity they can use. I see the field of Meteorology/Climate being used as a tool to affect policy decisions.

            I don’t think research meteorologists should get into the business of telling the public what their motor vehicle and electric power choices should be. And of course, those of us who are opposed to a massive carbon tax are immediately labeled as “deniers.”

          • Nate says:

            All that has to do with policy, values, philosophy. Nothing to do with whether AGW as science is correct or not. Seems that is less important to you.

        • gallopingcamel says:

          “I like what Dr. Lindzen stated. You control carbon, you control life. I know Dr. Spencer and Dr. Christy have stated similar things before Congress.”

          Good point Bob Mitchell. The benefits of rising CO2 concentrations far outweigh any of the claimed negative effects. For example, the planet is greening as plants become more drought resistant.

          Rising temperatures are a benefit if you heed historians rather than “Climate Scientists”. The learned Dr. Roy included Figure 6 in his post showing peaks and valleys in the temperature record for the last 2000 years. The peaks correspond to prosperous periods while the valleys correlate with plagues and famine.

          • Nate says:

            ‘peaks and valleys in the temperature record for the last 2000 years. The peaks correspond to prosperous periods while the valleys correlate with plagues and famine.’

            For who? Whose historical record? For Northern Europeans, possibly.

            For the rest-probably not.

      • pbweather says:

        Denmark rarely gets above 50% of electrical energy and this only tells a small part of the story.
        https://ens.dk/en/our-services/statistics-data-key-figures-and-energy-maps/annual-and-monthly-statistics

        What is most important is that Denmark can not guarantee enough generation to cover it’s own domestic demand. Every year between 10-30% of energy is supplied by net import from abundant Norway hydro, Swedish Nukes and any German excess if they have it available via interconnectors. Sure on windy days they use these to export excess wind energy, but most of the time the flow is the other way into the country. What’s more this external imported power supply from other countries is used to control the grid instability caused by intermittent wind supply.

        This is the untold story of both Germany and Denmark’s push towards renewables and is now the reason why Angela Merkel has now been forced by her coalition partners to stop issuing subsidies for new solar and wind installations. The intermitency of wind has also seen CO2 emissions plateau since 2008 and arguably has even increased slightly.

        Denmark and Germany, far from being the poster child of renewable energy are fast becoming good examples of why countries should not invest in them.

        • Nate says:

          ‘What is most important is that Denmark can not guarantee enough generation to cover its own domestic demand.’

          I don’t understand why this is important. I’m sure tiny Denmark trades many commodities with its neighbors in European Union. I’m sure it can’t cover its own domestic beer demand. Trade is a good thing.

          The same can be said for many US states or regions.

          In New England we get some power from Canadian hydro. The grid is designed to reroute power to adjust to demand.

          What you did not mention about Germany was their decision, after Fukushima, to shutter nuclear plants, which meant they had to use more coal.

          • pbweather says:

            I don’t understand why this is important. I’m sure tiny Denmark trades many commodities with its neighbors in European Union.

            As someone who works in EU power commodity trading the move away from self reliance of essential supply of electricity and water etc means prices go up and if one domino falls they bring down the others. If one country has a major problem the rest all suffer. E.g. France last year when they found faulty parts in their Nukes and had to shut them down for checks. e.g. When Russian gas was curtailed in an extreme winter because they kept it for their own supply or Ukraine decided to not let gas flow through it’s territory.

            Re Fukishima and DE Nuke shutdowns

            Fukishima occurred in March 2011. DE emissions show little change and have flatlined since 2008 before any Nuke shutdowns.

            https://www.cleanenergywire.org/sites/default/files/styles/lightbox_image/public/images/factsheet/20180326-uba-german-greenhousegasemissions1990-2017.png?itok=-Y-xcb52

          • Nate says:

            ‘Flat lined since 2008’

            Honestly, the graph does not look that way to me.

            Here are all sources over time

            https://upload.wikimedia.org/wikipedia/commons/c/c9/Energiemix_Deutschland.svg

            Nuclear is Kernenergie. You can see that its downward trend has been significant. Just as Wind and solar and biomass have grown essentially making up the difference.

            Pretty clear.

          • Nate says:

            ‘move away from self reliance of essential supply of electricity and water etc means prices go up’

            That is not the usual effect of free trade, and market forces on prices. Odd. If someone across the border can supply energy cheaper, great, they will.

  9. Nate says:

    I also cant find reference to NY temps in the memo.

    Are you saying political advocacy groups should stick to facts that they can prove, never exaggerate, never selectively present information favorable to their message, never deceptively use stats?

    IOW, you would expect political advocacy groups to behave like scientists?

    Ok.

    • nate says:

      Speaking of

      Selectively presenting favorable information:

      In Fig 6 the modern warm period shows almost no warming. Yet graph claims 10 y time resolution? Hows that make sense?

      Deceptively using stats:

      Fig 1. One month, one state, more noise.

      ‘It was 109 deg. F. on July 22, 1926 in Troy, New York.’

      C’mon finding some location in the US that has a record high in 1920s?

      ‘Less than 2 deg. F warming in about 200 years’

      Really 200y? Why not 300 y? Most of it occurred in last 50. Wow.

      ‘temperature was increasing at 0.01 or 0.02 deg. F’

      US temps increased 0.05 F/year for last 50 y (NOAA). Similar to all NH land.

      • phi says:

        US temps increased 0.05 F/year for last 50 y (NOAA). Similar to all NH land.
        Yeah.
        Real US temps increased 0.03 F/year for last 50 y (NOAA). Similar to all NH land.
        Climate scientist add to US temps 0.02 F/year for last 50 y. Similar to all NH land.

      • Nate says:

        Wishful thinking? Or do you have real evidence?

        • phi says:

          All this is perfectly known.
          http://curryja.files.wordpress.com/2014/07/slide14.jpg?w=500&h=375

          In fact, it is below reality because the effect of aggregation is not taken into account.
          Some use only short and cut series, pretending not to add warming when it is perfectly wrong. The increase in warming is then at the aggregation stage.

          Reminder, the aggregation is done by preserving the slope of the homogeneous segments. So by eliminating information on the long-term trend.

        • Nate says:

          ‘Reminder, the aggregation is done by preserving the slope of the homogeneous segments. So by eliminating information on the long-term trend.’

          Explain this.

        • Nate says:

          The graph is not explained, no caption, no context. Where from? Who made it?

        • Nate says:

          Phi,

          If your posts only make sense to you, what’s their point?

          • phi says:

            What is not clear? The fact that US warming is partly artificial? The mechanism of aggregation of temperature series?

          • phi says:

            Aggregation of series (or homogeneous sections) is not done by averaging temperatures but by averaging temperature differences (similar to anomalies). The absolute level of the series (the actual measured temperature) is an information lost in the treatment. This is problematic for long-term trends as potential instruments drift accumulates. The result is that over 50 years the observed warming of thermometers is generally 0.5 C lower than what climatologists claim.

            This difference between observed and calculated warming indicates a bias in the measurements (the mechanism described by Hansen). To my knowledge, only the use of proxies makes it possible to quantify this bias (estimated at about 0.15 C per decade for the lands of the Northern Hemisphere, https://tinyurl.com/yb2jxol6, https://tinyurl.com/yap8b6nx).

            Is it clearer ?

          • Nate says:

            ‘Is it clearer?’

            Not really. It would help if this discussion could be found in a publication, that we could read.

            ‘Aggregation of series (or homogeneous sections) is not done by averaging temperatures but by averaging temperature differences (similar to anomalies)’

            Uhhh, is that true for all groups? Berkeley, GISS, HAD, ..?

            Temperature difference from what, a local long-term average?

            ‘The result is that over 50 years the observed warming of thermometers is generally 0.5 C lower than what climatologists claim.’

            Not obvious how you can arrive at this number. It appears out of thin air.

            If this was indeed a problem, why isn’t anyone aggregating the data differently?

          • Nate says:

            ‘To my knowledge, only the use of proxies makes it possible to quantify this bias ‘

            It is difficult to believe that, in the modern era, proxies are better than thermometers. After all thermometers are a direct temperature measurement.

            Proxies are quite indirect.

          • Nate says:

            If you would correct me if Im wrong. From what I understand, the temperature anomalies are assumed to be spatially correlated over some distance. I think is testable, and is true. An makes sense since weather patterns are strongly correlated.

            Give this spatial correlation, they can use surrounding data to correct anomalies from errant stations.

            But i don’t believe these corrections should be needed so often that the trend is messed up significantly.

        • Nate says:

          What is clear is that surface temps must be weighted and averaged by some means. And certain measurement issues must be dealt with. Several groups are doing it, each somewhat differently.

          Yet they all arrive at similar trends for last 50 y.

          You claim they are (all) doing it wrong, and that the ‘correct’ trend is much lower.

          But thus far, you’ve only shown snippets of information with little explanation.

          You show a random unexplained graph showing difference after adjustment. Where from? What is supposedly wrong with it?

          Again, adjustments are made and can be legitimate.

    • Nate says:

      Fig 5 doesnt make a lot of sense, given that there has been overall warming.

      Here is analysis of that for various cities-showing increasing # of 100F days.

      http://www.climatecentral.org/gallery/maps/days-above-100f-projections

  10. Snape says:

    Dr. Spencer

    Looking at NOAA’s “Climate at a glance” for the lower 48, a clear trend jumps out. Daily lows (nights) are getting warmer, daily highs…not so much. The average of the two is slight warming. June in New York State is a perfect example:

    1895-2018 trend
    Daily maximums 0.0 F
    Daily minimums 0.2 F
    Daily average 0.1 F

    An increase in water vapor/humidity is the obvious explanation, at least from my novice viewpoint. Do you agree, or is that an over – simplification?

    (Sorry, I’m not able to show the NOAA link)

    • Gordon Robertson says:

      snape…”(Sorry, Im not able to show the NOAA link)”

      Does it have NCD-C in the link? If so, change it to NCD-C and advise readers to change the link by removing the hyphen.

      And remember, NOAA has seriously fudged the record to the point where it is not reliable.

  11. ossqss says:

    “todays technology would already allow 80% to 100% of our energy to come from renewable sources.”

    I cringe every time I see these type of statements. Nobody seems to remember the vast amount of referenced renewable energy comes from burning wood and dung!

    https://s3.amazonaws.com/jo.nova/graph/energy/renewables/world-energy-iea-global-2016.gif

  12. barry k says:

    Nate,

    I was referring to solar/wind in the USA. In your second link the USA gets about 8% from non-hydro (more than just solar/wind). To get 50% in the USA from wind/solar would be a massive undertaking costing trillions of dollars and taking many decades.

    Cheers,
    Barry

  13. bilybob says:

    Thanks Roy,

    Is there a corresponding figure 5 for the world?

    An often repeated statement on this blog is how new record highs out pace record lows. As I have time I have been sampling these new records and finding most do not have temperature data going back before the 1970’s. I have also sampled stations that have records going back to the early 1900’s and the majority of these have high temp records prior to 1960. I would think someone must have done a world wide study similar to your figure 5.

    • Gordon Robertson says:

      bilybob…”I have been sampling these new records and finding most do not have temperature data going back before the 1970s”.

      That’s not surprising considering the state of the world prior to 1970. The Soviet union was under shutdown as was mainland China. There was essentially no coverage of the oceans, nor the Arctic nor the Antarctic. There were two major wars, 1914 – 1918, and 1939 – 1945. There was the Korean conflict and Viet Nam.

      As an example of 1930s Africa, explorer Bill Tillman, having lived in Kenya for 10 years decided to head back to England. The most expedient manner for him was to ride a bicycle from Kenya near the east coast, to the west coast, where he could pick up a steamer.

      Much of the world was like that. No one was concerned about climate or global warming and record were mainly for local weather in civilized areas.

      The current records trotted out by NOAA and BEST are highly speculative, made worse by NOAA freely amended them retroactively to temperatures they think better represented the past.

  14. Roy Spencer says:

    It tells me if the government forces you to pay enough extra, you can even send a Tesla into space.

  15. Gordon Robertson says:

    Roy…thanks for the reality check in your article.

    You must have gotten this graph before NOAA amended it to remove the warming in the 1930s.

    http://www.drroyspencer.com/wp-content/uploads/US-extreme-high-temperatures-1895-2017.jpg

    • An Inquirer says:

      My understanding is that NOAA does not adjust history on maximum temperatures. It does liberally adjust history on “average” temperature, but not on the high temperature.

  16. Dan Pangburn says:

    To keep things in context, the area of the south 48 is only 1.6% of the area of the planet.

    • Gordon Robertson says:

      Dan…”To keep things in context, the area of the south 48 is only 1.6% of the area of the planet”.

      If you don’t count the 70% surface area that is oceans, what is the percentage then?

  17. Myki says:

    Australia just had its warmest financial year on record based on maximum temperatures.

    http://www.farmonlineweather.com.au/news/record-hot-financial-year-in-australia/528111

  18. Myki says:

    Last month was the hottest June on record for Northern Ireland and Wales, and the fourth-hottest for Scotland and England based on 24-hour mean temperatures.
    https://www.theguardian.com/uk-news/2018/jul/02/uk-heatwave-continues-as-thunderstorms-threaten-south-west

    • Gordon Robertson says:

      myki…”Last month was the hottest June on record for Northern Ireland and Wales, and the fourth-hottest for Scotland and England based on 24-hour mean temperatures”.

      Sources, sources. The Guardian is the climate equivalent of the US National Enquirer. Utter propaganda.

      • David Appell says:

        Notice that when, as always, Gordon has no data, he needs to impugn the source — paper, article, or scientist — based on nothing but his say-so. It’s always the same with him.

  19. Myki says:

    Lets face it.
    If record warm temperatures stop being broken – that will be news.

    • Gordon Robertson says:

      myki…”If record warm temperatures stop being broken that will be news”.

      It’s weather, as Roy claimed, there is no sign of a trend for maximum warming.

      When Scotland sets a record of 32.9C which broke a record for 1893, there is no trend.

      • Myki says:

        Lol.
        If cool records were being broken you are telling me you would not bother commenting?
        Pull the other one!!!

        • Vieras says:

          To make new warm records is what to be expected. The world has warmed after the little ice age and especially after the last real ice age. It would be bad news to reverse that trend and to go colder. One can of course hope for stable climate, but even that involves breaking records at both ends every now and then.

          Now, warming can be a problem if there is too much of it. However, theres no signs of that. Were just arguing about less than one degree and are worried sick about 2 degrees within 100 years, which is pretty amusing.

          • Myki says:

            “Now, warming can be a problem if there is too much of it. However, theres no signs of that. Were just arguing about less than one degree and are worried sick about 2 degrees within 100 years, which is pretty amusing.”
            This comment is interesting. There are several stages to denialism. One of the last is to accept the world is warming but that there is nothing to worry about. Here we see an example of rapid retreat in full action. It also demonstrates ignorance about impacts- since a global average rise of “only” 2 degrees will be far from “amusing”.

        • An Inquirer says:

          Myki,
          You talk of many stages of denialism and accuse Vieras of being in the last stage.
          Sorry to bust your theory that was probably created by internal thinking rather that listening to what others are saying, but skeptics have been agreeing for over 30 years that some warming is to expected for a couple of reasons. First, we are in a natural warming phase. Second, CO2 does have some marginal contribution to overall warming. The skepticism is that there is not a scientific link between catastrophic weather and increased CO2 levels. We could go through hurricanes, tornadoes, heat waves, snow cover, etc., and doomsday developments are not happening. The GCM models predicting these catastrophic developments are not accurate and not reliable. The one place where GCM models under-predicted concern was loss of Arctic ice, but perhaps the reason they under-predicted is because the GCM models are not the best tool for the issue of Arctic ice. The loss of Arctic ice was driven by factors other than CO2. Now, even as CO2 continues rise, the volume of Arctic ice has not only stabilized, but has also increased.

          • Myki says:

            Give me a break!
            Remember when predictions of loss of Arctic sea ice were met with howls of derision by denialists.

            As for: “but skeptics have been agreeing for over 30 years that some warming is to expected’
            !!!
            This is a portent of the very last stage of denialism. i.e. “We always knew it was going to happen.”
            Commonly described as rewriting history.

          • Vieras says:

            Myki: [Remember when predictions of loss of Arctic sea ice were met with howls of derision by denialists.]

            Yes. This was about the utterly ridiculous predictions about the Arctic being ice free in 10 years. One of those predictions came from Professor Wieslaw Maslowski. And Dr. David Viner predicted that kids would grow up without snow. 10 years went and those predictions were proven utterly wrong. And yes, their predictions were for that short time frame.

            Myki: [This is a portent of the very last stage of denialism. i.e. We always knew it was going to happen.]

            If you take even a little time and read what sceptics actually said (instead of reading what others say they said), you should notice that nobody (besides bloody idiots) claimed that NO warming would be expected. The beef was always: How much? And: How much of that is natural vs. caused by humans?

            This argument has always been about sceptics critisizing predictions that predict a lot of warming or runaway warming. They have been gravely mistreated by claiming that sceptics deny climate change. No, they do not deny climate change or that humans would not have any effect. They deny CAGW where he C means CATASTROPHIC.

          • Eric says:

            Dr Judith Curry has claimed there would be no warming for decades to come. Are you calling her an idiot Vieras?

        • Vieras says:

          Myki, you have a cartoonish image of sceptics. As long as I can remember, there have been lukewarmers. Is this something new to you?

          2 degrees Celsius is about the same as moving 200 km south. Its pretty hard to find that terrifying unless 200 km south lands you in Venezuela.

          • Myki says:

            Vieras, you have a cartoonish image of global warming and impacts.
            +2 degrees is the global average. At the equator somewhat less, but much greater (+6 to +8) towards the poles.
            Your comment again represents the final stages of retreat by denialists:
            “It is going to warm, so what? A bit of warming will be good.”
            The next stage (when it is too late) is:
            “Well, we cannot do anything about it, so why worry?”

          • Vieras says:

            Here we go again. Denialist Why is it so hard for you to have a civilized discussion? I already told you about lukewarmers. Go read about what they have been saying for 20+ years. Its worth your time as recent studies point to their having been right. Estimates of climate sensitivity have gone down all the time. That should have caused a recalibration of the doomsday predictions, but that has not happened – yet.

            And, you know, I happen to live in the north. 6-8 degrees would be a blessing. But even then, there are no signs of future warming being anywhere close to that.

          • Myki says:

            Vieras,
            at the moment, the world is experiencing all the symptoms of global warming being expressed as severe events (see post below):
            “The past seven days have set global heat milestones and sparked safety concerns from Quebec, where at least 34 people have died in the province from the heat and humidity, to northern Siberia, home to the coldest town on Earth, which recorded temperatures 40 degrees above normal on Thursday.

            In Denver, the temperature reached an all-time high of 105 degrees. Just shy of 98 degrees, Montreal broke a 147-year-old record with its hottest measurement ever. In Bergen County, New Jersey, 81-year-old Rep. Bill Pascrell (D-N.J) passed out from the 90-degree-heat at a local fire department event. ”

            You so-called “luke-warmers” have contributed ABSOLUTELY NOTHING in terms of :
            1. contradicting the denialists
            2. assisting the warmists in sounding warnings
            3. contributing towards the calls for limiting emissions
            4. providing a sensible discussion of the economics
            Forgive me if I can’t find the time to treat you seriously. You lot will forever be regarded as cowards by the rest of us.

          • Vieras says:

            Myki: [Long list of weather]

            Your listing warm weather is nothing different from me listing:

            Europe’s deep freeze conditions kill dozens – Vatican News
            Scientists announced Tuesday they have recorded the coldest temperatures ever on Earth.

            Uhhuh, those happened also this year. But they are weather and not climate. Just as your example were. When you study climate, you quote temperature series, satellite data sets and sea level datasets.

            Now, why should lukewarmers assist warmists in sounding warnings? The whole point of lukewarmers is:

            a person who recognizes global warming, but doubts the severity of the problem, and the certainty of climate science predictions.

            Now, about limiting emissions? A lot of sceptics do like Nuclear Power, myself included. At the same time sceptics do criticize policy that is ineffective or counterproductive. Have a look at Jo Nova as a prime example. And if you actually read what sceptics think about policy, you’d see that economics is THE thing they talk about.

            Myki: [Forgive me if I cant find the time to treat you seriously. You lot will forever be regarded as cowards by the rest of us.]

            Look, you’re obviously not been following this debate for a long time and when you have, you’ve exclusively been following it in a one sided way. You have a choice to make: You can continue doing it and think of all this in a black or white, polarizing way or you can actually verify what I have written and notice that this is not a simple issue.

            There’s really no reason to insult people and be impolite.

          • Myki says:

            Vieras, you are missing the point.
            It is not just hot weather. It is the fact that weather records are being broken. And it has been a fact for decades that the number of warm records continually exceeds the number of cool records. It is consistent with an overall increase in average temperatures accompanied by severe weather events.
            Only a fool would state:
            “..We are worried sick about 2 degrees within 100 years, which is pretty amusing.”
            Don’t complain to me about insults and impoliteness when you are effectively inviting it.

          • Myki says:

            Vieras: “The whole point of lukewarmers is: a person who recognizes global warming, but doubts the severity of the problem, and the certainty of climate science predictions.”

            Ok then – tell us what your prediction is?
            And after you do, tell us whether it falls within the lower end of probabilistic climate predictions.
            And after you do that, tell us what the difference in certainty is?
            And while you are at it, give us your estimate for the probability of a +2 deg rise by 2100 ?
            (Don’t tell me it is zero.)
            I seriously doubt that you understand the concepts of probabilities, risks and impacts.

          • Myki says:

            Finally, please don’t pretend to be an even-handed, reasonable, “luke-warmer” and then refer to Jo Nova as some sort of expert. That is called shooting yourself in the foot.

  20. Myki says:

    Hysteria?
    Red-hot planet: All-time heat records have been set all over the world during the past week.

    “These various records add to a growing list of heat milestones set over the past 15 months that are part and parcel of a planet that is trending hotter as greenhouse gas concentrations increase because of human activity”

    https://www.washingtonpost.com/news/capital-weather-gang/wp/2018/07/03/hot-planet-all-time-heat-records-have-been-set-all-over-the-world-in-last-week/?noredirect=on&utm_term=.429e1dbe0d4b

    • Gordon Robertson says:

      myki…”Red-hot planet: All-time heat records have been set all over the world during the past week”.

      You posted one in Scotland where Glasgow had set a record. The same article mentioned that the hottest June temperature of 32.2 C for Scotland was in 1893 in Ochertyre.

      They have claimed a new record the other day of 32.9C in an urban area but we are looking here at Urban Heat Island effect. In 1893, there was nothing near the heating in cities we have now due to asphalt and concrete holding heat.

    • coturnix says:

      Hysteria? yes, even if it was grounded in reality i think it would still qualify for hysteria, as it doesn’t matter whether tehre is any reality underlying the hysteria.

      quote mode
      “No single record, in isolation, can be attributed to global warming. But collectively, these heat records are consistent with the kind of extremes we expect to see increase in a warming world.”
      end uote mode

      uhm, no. It is not at all obvious that GW should lead to extremes, apart from the already-cold polar areas, or to the increase in the magnitude of weather variability. It might (and i can even construe a rough theory of how), but it requires a separate proof, different from the standard ‘co2 warms the world due to forcing’ story.

    • Gordon Robertson says:

      myki…”Red-hot planet: All-time heat records have been set all over the world during the past week”.

      Even if that’s true, where’s the proof it is related to anthropogenic sources?

    • Richard M says:

      And when all-time cold records were being set last winter I bet your response was “that’s weather, not climate”. Do you even have a clue how silly you look now?

  21. Chris Hanley says:

    To support its contention that “it scarcely could be clearer that human greenhouse gas pollution {sic]” is the cause of the claimed GAT rise of 1.1C rise above pre-industrial the Public Citizen website links to U.S. National Climate Assessment and quotes that “there is no convincing alternative explanation”.
    What in any other branch of science would be regarded as a logical fallacy (argument from ignorance).
    Instead of a simple chart showing extremes (fig.5) the National Climate Assessment includes a chart indicating that record-setting warm daily temperatures in US are occurring more often.
    That could be an artefact of modern more sensitive electronic sensors recording spikes that are more likely to be highs than lows as Jo Nova has discussed on her blog.

    • David Appell says:

      Chris: So what are convincing alternative explanations?

    • Chic Bowdrie says:

      Claiming no convincing alternative explanations to human caused 1.1 C rise belies two underlying assumptions. One, that humans cause the vast majority of any rise in IR-active gases and two, that said gas increases cause significant global temperature rise. No sufficient evidence for either hypothesis.

      • David Appell says:

        Chic, you’ve been given lots of the evidence, and if you were self-motivated you’d go out and research it on your own.

        But you don’t want evidence, no matter how much you ask for it. You just want to keep thinking you’re right, when the entire world science community has, over the last 150 years, shown you wrong.

        • Chic Bowdrie says:

          It is not up to me to prove a negative by spending the rest of my days proving your claims. The null hypothesis that increasing CO2 does not increase global temperatures stands until someone proves otherwise. It doesn’t take the entire science community to show me wrong, only one person. Are you the one? If not you, who?

  22. Gordon Robertson says:

    Roy…”Well, they mention that we have seen 1.1 deg. C of warming since the Industrial Revolution. Think about that. Less than 2 deg. F warming in about 200 years, part of which is likely to be natural…”

    Let’s not forget that the world was 1C to 2C cooler during the Industrial Era. It was in the middle of phase 2 of the Little Ice Age. There’s a good chance all of the warming since has been natural.

    • Myki says:

      only natural ?!
      You are implying the absence of cause and effect.
      Maybe god did it?
      What foolishness!

      • Harry Cummings says:

        Milki
        Your logic is odd It warm then cooled then warmed then cooled etc etc
        Natural cause and effect
        Now you want to alter the cause and keep the same effect
        Regards

        • Nate says:

          Harry,

          There is more than one way to skin a cat. The fact of AGW does not mean natural variation is cancelled out. It is also present.

      • Richard M says:

        Myki says: “Maybe god did it?”

        Or maybe the oceans did it. Oh wait, they did.

        • Myki says:

          You mean:
          Poseidon, Olympian God of the Oceans and king of the sea gods; also god of rivers, storms, flood and drought, earthquakes, and horses. He controlled every aspect of the seas.
          ????

    • David Appell says:

      Gordon Robertson says:
      Lets not forget that the world was 1C to 2C cooler during the Industrial Era. It was in the middle of phase 2 of the Little Ice Age.

      Not true. (1) the LIA wasn’t global, and (2) the temperature was only about 0.6 C cooler at most. See: https://tinyurl.com/y7ko3jnj

      Theres a good chance all of the warming since has been natural.

      What natural factors caused it?

      • Chuck Wiese says:

        How can you claim CO2 is causing warming when the OLR record shows it increased 2 Wm-2 since the beginning of the satellite record?

        No matter what is presented to you, Appell, you refuse to accept it if it doesn’t conform to your environmental religion.

        • David Appell says:

          Again, where is your data??

          • Chuck Wiese says:

            climate4you.com

            Click on the “big picture” and scroll to the OLR radiation charts. The site is maintained by Dr. Ole Humlum.

            If that isn’t convincing then read this from MIT news. Here are a couple of postdocs from MIT scratching their heads about why the OLR has been increasing when climate models forecast it must drop in support of GHG warming. These two claim the reason is that CO2 melted snow and ice and changed the albedo. Problem is, that isn’t accurate. There has been no discernible trend in the snow and ice albedo for many years.

            http://news.mit.edu/2014/global-warming-increased-solar-radiation-1110

            The article is nonsense except for the fact they admit the OLT spectrally integrated is going the opposite way of the failed climate models.

            You are wrong again, Appell.

          • Ball4 says:

            Chuck, David – Appears both of you need to read the CERES Team reports as there are satellite instruments measuring facts you are discussing, see Loeb 2018.

            —-

            Chuck writes: “the OLR record shows it increased 2 Wm-2 since the beginning of the satellite record”

            CERES Team 2018 table 7 satellite record 3/2000 to 9/2016: All-sky OLR increased 0.19 +/- 0.21 W/m^2/decade or about 0.3 W/m^2 in the satellite era (~1.6 decades) with a range of confidence interval that includes 0.

            —–

            Chuck also writes: “There has been no discernible trend in the snow and ice albedo for many years.”

            CERES Team on all-sky albedo trend in satellite era (1.6 decades): Decrease of about 0.92 W/m^2 give or take a little.

            For a net increase of radiation INTO the earth-atm. system during the satellite era of about 0.56 W/m^2, again give or take a little.

            —-

            David writes: “What natural factors caused it?”

            CERES Team in the satellite era: “CERES TOA fluxes exhibit pronounced interannual variability driven primarily by ENSO. SW TOA (albedo) flux variations in the Arctic are noteworthy and are tied to changes in sea ice coverage.”

          • David Appell says:

            The planet is warming constantly in order to regain OLR balance.

            “While greenhouse gases trap one type of radiation, its the other type visible, shortwave radiation that is really sustaining global warming over the long term, said co-author Kyle Armour, a postdoctoral researcher at MIT who will join the UW faculty this fall with a joint appointment in oceanography and atmospheric sciences.

            “The result could help people better conceptualize global warming. It could also help better detect climate change in satellite data, which can measure both shortwave radiation reflected by the Earth and long-wave radiation emitted by the Earth.”

            http://www.washington.edu/news/2014/11/10/global-warming-not-just-a-blanket-in-the-long-run-its-more-like-tanning-oil/

          • Ball4 says:

            The Donohoe 2014 paper concludes any OLR forced imbalance “recovers quickly”:

            “..OLR recovers quickly in response to GHG forcing and that global warming is driven by enhanced ASR.”

            That is in accord with Loeb 2018 CERES Team observational data in the satellite era since all-sky OLR trend in that period is measured near zero to maybe somewhat positive and all-sky ASR trend is measured consistently higher than 0. However, Donohoe doesn’t discuss natural ENSO variations in the period as does Loeb 2018.

          • Chuck Wiese says:

            Ball4 and Appell: My BS meter is about pegged with these stories from Donohoe and Kyle Armour.

            So if OLR recovers quickly to GHG forcing ( contrary to failed model predictions that show that it doesn’t ) then why are we being told by Kevin Trenberth and many others that the “missing heat” during the temperature stasis is being absorbed into the deep oceans?

            If you look at the 700 meter depth ocean heat graphs from NOAA, since 1985, there has been a claimed accumulation of 150 zetta Joules of energy. On average, that is equivalent to a constant radiative forcing on the oceans of about 1.67 Wm-2. If you re-integrated this radiation by limiting its accumulation to just 30 meters of the mixed ocean layer, that absorbed energy equals nearly 3.74 degC of warming temperature, far, far from a short term equilibrium that this radiative “imbalance” would exert on a black body surface at a mean temperature of 288K. That rebalancing would change the temperature by .31 degC, NOT 3.74 degC.

            And so for these two to claim that a radiative forcing by GHG’s is re-emitted by the earth in short order is just plain crap, and does not fit any observational data if NOAA is correct about ocean heat. And since the oceans cover 70% of the earth’s surface, these explanations by Donohoe and Armour are proven to be nonsense.

            It appears the climate community in support of this CO2 warming nonsense can’t get their facts straight. But cover up ( CYA ) will often lead to unexplainable discrepancies such as this when the claims of the hypothesis begin to fail.

            Given the facts, there is only one way for the OLR to go if the surface is being warmed by GHG’s based upon the data, and that is downward. Not up and not sideways.

          • Ball4 says:

            Chuck 6:09pm, you seem to prefer to debate with the 5 finger salute instead of actual data. Not buying it.

            What NOAA’s global satellite observatories actually report for measured global OLR lately is in PI Loeb 2018. The data in the satellite brightness temperature era shows global OLR 12month running mean anomaly trending up, then down and sometimes sideways (Fig. 9c, p. 910) in several oscillations attributed by CERES team mainly to ENSO (statement I clipped for you already).
            With overall trend in satellite era at 95% significance flat to slightly up.

            That is consistent with Donohoe paper (only skimmed the news report). That “slightly up” might be the signal from added CO2 ppm & might match UAH mean trends with a delay & the oscillation from ENSO. That would be interesting comment & research, G. Callendar showed how to do it in 1938.

            If you want to make a believable science argument on CO2 ppm you need to utilize that data say vs. UAH 6.0 to stay at least semi-on-topic around this blog. You also would want to base your arguments on any trend in global TLT humidity observations in the period.

            Just commenting on the reading of your personal BS meter ain’t cutting it.

            “If you look at the 700 meter depth ocean heat graphs from NOAA..”

            I already have & more; here’s what NOAA’s PI Loeb 2018 writes with data and analysis thereof:

            “The uptake of heat by Earth for this period (July 2005-June 2015) is estimated from the sum of (i) 0.61 +/- 0.09 W/m^2 from the slope of weighted linear least squares fit to Argo OHCA data to a depth of 1800m analyzed following Lyman and Johnson (2008), (ii) 0.07 +/- 0.04W/m^2 from ocean heat storage at depths below 2000m using data from 1981–2010 (Purkey and Johnson 2010), and (iii) 0.03 +/- 0.01 W/m^2 from ice warming and melt and atmospheric and lithospheric warming for 1971-2010 (Rhein et al. 2013).”

          • Chuck Wiese says:

            Ball4: Well now my BS meter just broke with your response. Stay on track? You are describing your own response.

            I just showed you what the OHC was claimed by NOAA for 700 meters. It was 150 zetta Joules from 1985 until now. I showed you how much heat this was if you re-integrated it to just 30 meters of ocean depth which was 3.74 degC It is far above the BB forcing mean of 1.67 Wm-2, which translates to .31 degC of temperature change to re-radiate the claimed blocked IR mean, which today from RCP8.5 is even greater at 3 Wm-2 at TOA. So the calculated forcing over the oceans by Loeb et. al doesn’t match what even their failed models indicate.

            Another way of looking at this is that the delta T for 700 meters of ocean at 150 zetta Joules is .14 degC, half of an expected BB re-radiating temperature to offset the mean forcing,( which is actually at 3Wm-2 from RCP8.5 so by no means is the troposphere at radiative equilibrium according the models and even if you re-radiate .45 degC of SST warming back to TOA, that’s 2.5 Wm-2 and yet the OLR today is static to increasing according to CERES and the OLR should be down anywhere from .5 to 3 Wm-2 just by model comparison alone.

            First these guys wanted to tell us that water vapor did all the heavy lifting, and now that OLR doesn’t match their failed modeling, well gee! Its the sun! Do you know how stupid and unrealistic this sounds? It is NOT supported with ice albedo records.

            And who are you to tell me what I need to focus on to make a point when you haven’t done so in the least and post with a pseudonym name rather than a real one. Who are you? And what is your area of expertise?

          • Ball4 says:

            “So the calculated forcing over the oceans by Loeb et. al doesn’t match what even their failed models indicate.”

            Loeb et. al. doesn’t report “calculated forcing”, NOAA instruments measured net TOA flux into the earth-atmosphere system which Loeb reports as PI. Loeb 2018 isn’t about climate models. Your calculations fail to compare to CERES actual measurements or show how they do. You provide no source for your data.

            “And who are you to tell me what I need to focus on..”

            Well, if you comment on climate system OLR, system forcing & failed models, measured data for OLR and net TOA flux into the system of interest ought to be your focus if you want to convince your readers and/or listeners. Without that, no source cites, data without attribution, calculations not shown matching observations, you have no reliable focus. Your comments will not and do not convince the informed, critical reader.

          • Chuck Wiese says:

            Ball4: “Loeb et. al. doesnt report calculated forcing, NOAA instruments measured net TOA flux into the earth-atmosphere system which Loeb reports as PI. Loeb 2018 isnt about climate models. Your calculations fail to compare to CERES actual measurements or show how they do. You provide no source for your data.”

            Me: Do you understand English? I’m not comparing the surface data to the accuracy of CERES. I’m comparing calculated radiative forcing from RCP8.5 (a climate model)
            and the NOAA calculated ocean heat at 700 meters (That Trenberth and the rest of the climate cabal claim was “sucked into the deep ocean to attempt to explain the global temperature stasis after 1998).

            Assuming Trenberth is correct about that, THIS is the basis for calculating a tropospheric radiative forcing from increased CO2 as an average from 1985 until now. The upper end of this can be taken right off of the calculated RF from RCP8.5 and where it says we are at now.

            Comparing this to CERES OLR tells you how accurate the failed models are. And they fail.

            Ball4 : ” Well, if you comment on climate system OLR, system forcing & failed models, measured data for OLR and net TOA flux into the system of interest ought to be your focus if you want to convince your readers and/or listeners. Without that, no source cites, data without attribution, calculations not shown matching observations, you have no reliable focus. Your comments will not and do not convince the informed, critical reader.”

            Me: Huh? What gibberish! That’s what I just did. What part of my posts do you not understand?

            Why won’t you use a real name if you are going to exert any authority as an expert? I asked you to provide this.

          • Nate says:

            Chuck, you are misrepresenting the OLR chart from climatechange4you.

            It has no clear upward trend. It wiggles up and down around a horizontal line, and only if you cherry pick 2 points, such as 1979 and 2015 could you get 2 W increase, other years no increase or decrease.

          • nate says:

            ‘Given the facts, there is only one way for the OLR to go if the surface is being warmed by GHGs based upon the data, and that is downward. Not up and not sideways.’

            No that’s not correct, Chuck.

            If GHG are increasing, and surface temps are increasing than sideways is possible, and likely.

          • Chuck Wiese says:

            Nate: “Chuck, you are misrepresenting the OLR chart from climatechange4you.

            It has no clear upward trend. It wiggles up and down around a horizontal line, and only if you cherry pick 2 points, such as 1979 and 2015 could you get 2 W increase, other years no increase or decrease.”

            Me: Nate,No I’m not misrepresenting the OLR. Since the satellite era, the OLR has remained at or above the effective emission of 231 Wm-2. As CO2 increased all through this time, the OLR never dipped below this value. It reached it twice during the Pinnatubo eruption and the super El Ninio of 1998. That’s it.

            If you’re going to claim GHE from CO2, you had better be able to show the OLR falling below this value until the surface can re-radiate the RF at a higher temperature or the premise fails. When it operates consistently above the effective temperature, it tells you the surface is getting more energy from the sun. That’s what it has been doing, which implies the warming has been solar driven.

          • Chuck Wiese says:

            Nate: “Given the facts, there is only one way for the OLR to go if the surface is being warmed by GHGs based upon the data, and that is downward. Not up and not sideways.

            No thats not correct, Chuck.

            If GHG are increasing, and surface temps are increasing than sideways is possible, and likely.”

            Me: Nate, no. You are not correct. If there is GHE from the GHG’s the OLR MUST fall below the effective emission and recover as the temperatures increase. Nowhere has it done this. It runs consistently higher than the effective emission of 231 Wm-2. If you can’t see a clear decline period before recovery, you are not seeing a GHE signature.

            The response time for GHE the modelers tell us is at least a decade for the land masses and much longer for the oceans that cover 70% of the globe.

            If more solar is causing warming, the response time is immediate at the surface and within a few months for the troposphere to respond as the record shows well with UAH satellite temperatures that track El Ninio warming.

          • Nate says:

            Chuck,

            ‘Nate, no. You are not correct. If there is GHE from the GHGs the OLR MUST fall below the effective emission and recover as the temperatures increase. Nowhere has it done this. It runs consistently higher than the effective emission of 231 Wm-2. If you cant see a clear decline period before recovery, you are not seeing a GHE signature.’

            Argument by assertion. Show me any modeling study requiring OLR must fall.

            For the last couple of decades, the NET TOA imbalance has been ~ 0.5-1 W/m^2. That means OLR is being restricted, while T is rising trying to restore OLR balance.

            The result is wiggles around a horizontal line, which is indeed what we see in the figure.

          • Ball4 says:

            “which implies the warming has been solar driven.”

            More accurately: implies any warming has been more net solar driven (ASW) in the UAH satellite era temperature series than LW which measures a flat to small increase in OLR per CERES Team 2018 Table 7.

          • Ball4 says:

            Chuck 9:39 am responds: “I’m not comparing the surface data to the accuracy of CERES.”

            Well you are Chuck unless you have another English meaning than what you write: “How can you claim CO2 is causing warming when the OLR record shows it increased 2 Wm-2 since the beginning of the satellite record?”. I am pointing out Chuck has his facts wrong based on actual CERES OLR data from NOAA PI Loeb 2018 team since the beginning of the UAH TLT series.

            “Comparing this to CERES OLR tells you how accurate the failed models are.”

            I am pointing out you have your CERES OLR facts wrong based on actual CERES OLR data from PI Loeb 2018. Using the correct measured OLR data (flat to slightly up) since the beginning of the UAH satellite record would give some credibility to your comments.

            “What part of my posts do you not understand?”

            I don’t understand from which source you obtained your inaccurate OLR data & “NOAA calculated ocean heat at 700 meters” as you have not provided a published paper cite. Care to fill us in?

            And I am citing the experts in the field, their data doesn’t depend on anyone’s screen name at all. The NOAA PI expert led the work and responsibly expects to be accurately quoted by Chuck.

          • Chuck Wiese says:

            Nate: “Argument by assertion. Show me any modeling study requiring OLR must fall.”

            Me: Here is a detailed description of how climate models treat radiative forcing from a GHE:

            https://www.nap.edu/read/11175/chapter/3#22

            With respect to climate forcings on the oceans, reference page 22, “A relaxation timescale of 2000-3000 years is determined by the deep ocean mixing timescale. If only the upper ocean is considered, the system can reach equilibrium in about 50 years, which corresponds to an e-folding response time of 2-3 years.”

            So with the oceans covering 70% of the earth’s surface, your claim that the Earth responds immediately to GHE in short order is nonsense. This is especially true since downwelling IR cannot warm directly, but only be reducing a surface cooling rate. We have also observed stratospheric cooling and yet the OLR is higher than effective emission in spite of this.

            If there is a GHE signature, it must show up in the record as the OLR values falling beneath the effective emission with a slow recovery. The story being revealed in this record is that more insolation from the sun has reached the surface and caused some warming (about .5 degC in the satellite record).

          • nate says:

            ‘So with the oceans covering 70% of the earths surface, your claim that the Earth responds immediately to GHE in short order is nonsense.’

            Where did I say that? You’re twisting my words into something I did not say.

            I agree with you that a tau of 2-3 y is reasonable for a response time of mixed layer.

            That is quite short compared with the decades over which CO2 has risen.

            ‘If there is a GHE signature, it must show up in the record as the OLR values falling beneath the effective emission with a slow recovery. ‘

            What you are describing is the response if CO2 made a sharp step-up in value a couple of decades ago. But that is not at all what the history of CO2 is.

            CO2 has risen continuously, therefore the response of the OLR will be continuous, one of both reduction, due to GHG and recovery due to warming. If increase is slow enough (it is), the reduction is not going to be dominant over recovery.

          • Chuck Wiese says:

            Nate: “For the last couple of decades, the NET TOA imbalance has been ~ 0.5-1 W/m^2. That means OLR is being restricted, while T is rising trying to restore OLR balance.
            The result is wiggles around a horizontal line, which is indeed what we see in the figure.”

            Then Nate said: “Where did I say that? You’re twisting my words into something I did not say.

            I agree with you that a tau of 2-3 y is reasonable for a response time of mixed layer.

            That is quite short compared with the decades over which CO2 has risen.”

            Me: Nate, like I said, the ENTIRE record of OLR to 2010 shows the values stayed above the effective emission of 231 Wm-2 except twice and we know why that was. It was Pinatubo and El Ninio.

            The response time of 2-3 years that is deemed reasonable does not give you any information about the inverse time coefficient that is taken to get one e-fold or a 36% residual of the forcing response. If that is 2.5 years, then you’re saying the oceans are in equilibrium in 10 years at 4 folds, but the paper says it takes 50 years. So the coefficient is likely 12.5 years for one e-fold, meaning at 2.5 years, the response leaves 82% of the forcing imbalance at TOA.

            That is not enough time for the OLR effective emission to be restored in the record, so for you to say that the OLR is being held constant as the temperature response tries to re-radiate the imbalance is wrong, especially when the OLR emission is above the effective emission of 231 Wm-2.

            There is no GHE signature.

          • Chuck Wiese says:

            Ball4: ““What part of my posts do you not understand?”

            I don’t understand from which source you obtained your inaccurate OLR data & “NOAA calculated ocean heat at 700 meters” as you have not provided a published paper cite. Care to fill us in?”

            Me: This is blathering nonsense. I gave you the sources. The OLR graphs at climate4you were prepared by Dr.Ole Humlum, a climate research scientist. The OHC data from NOAA:

            https://www.climate.gov/news-features/understanding-climate/climate-change-ocean-heat-content

            Now, of course, we all know that those who protect the AGW climate racket insist that any climate metric data provided by the same reliable sources used by authors who publish in the revered and compromised “climate journals” is not really accurate data unless they say it is and rubber stamp it. So black is not black and blue not blue unless we say it is, even though the data says exactly that.

            This is beyond ridiculous and if you just calculated the numbers yourself like I did using this data yourself, you would see it is accurate, coming from reliable sources.

            And who is “us”? This is why I asked you to provide me with a real name. You’re exerting an authority that you know better than I and I can’t be correct. Citing your sources and papers does not prove anything I said wrong. I never challenged the CERES data. I just claim it doesn’t disprove my assertions that I made with accurate data.

          • Ball4 says:

            Chuck claims: “I gave you the sources.”

            No but thank you for doing so at last. That dot gov link is the one and only search hit in these comments.

            Your source is WG1AR5 Ch3 from 2013 which compares exactly to Loeb 2018 since they cite many of the same published papers (none from Humlum) and draw the same conclusion for ocean energy uptake 1993-2010 p. 265 Box 3.1 “a mean (net energy) flux into the ocean of 0.71 W/m^2 over the global ocean surface area.” Which is same total as I clipped from Loeb 2018 above. This is the GHE signature from your own source FAQ 3.1 p. 266:

            “It takes about a decade for near-surface ocean temperatures to adjust in response to climate forcing (Section 12.5), such as changes in greenhouse gas concentrations. Thus, if greenhouse gas concentrations could be held at present levels into the future, increases in the Earth’s surface temperature would begin to slow within about a decade.”

            “You’re exerting an authority that you know better than I and I can’t be correct.”

            I have no authority beyond published papers cites, a screen name is completely irrelevant, and you are still not correct as I could not find any ref. to OLR in your entire source “when the OLR record shows it increased 2 Wm-2 since the beginning of the satellite record?”. So either you have changed the original terms or you have another source. Or point to published page number confirming your statement.

            You are not correct either with “the OHC was claimed by NOAA for 700 meters. It was 150 zetta Joules from 1985 until now.” See fig. 3.2a p. 262: the published estimates range from eyeballometer roughly 80ZJ to 180ZJ with no mean published. So you can cherry pick all you want from-to many dates. “150” is not a hit in the entire document except for a mark on the chart ordinate 3.2a.

            “I just claim it doesn’t disprove my assertions that I made with accurate data.”

            Your data is not accurate according to your own published sources. Your assertions are therefore unfounded.

          • Nate says:

            Chuck,

            ‘If that is 2.5 years, then youre saying the oceans are in equilibrium in 10 years at 4 folds, but the paper says it takes 50 years. So the coefficient is likely 12.5 years for one e-fold, meaning at 2.5 years, the response leaves 82% of the forcing imbalance at TOA.’

            So if it is 2.5 y, as you originally said, then you seem to agree that the OLR can remain relatively flat. Ok.

            Well it is easy to see the relaxation time of CO2 after volcanoes, like Pinatubo, and large El Ninos, is consistent with 2-3 y and not consistent with 12 y.

          • Nate says:

            rather: relaxation time of global temp after volcanoes.

          • Chuck Wiese says:

            Ball4 said:”Your source is WG1AR5 Ch3 from 2013 This is the GHE signature from your own source FAQ 3.1 p. 266:

            It takes about a decade for near-surface ocean temperatures to adjust in response to climate forcing (Section 12.5), such as changes in greenhouse gas concentrations. Thus, if greenhouse gas concentrations could be held at present levels into the future, increases in the Earth’s surface temperature would begin to slow within about a decade.”

            Me: No! It is not my source. My source is from the National Academy of Sciences, Engineering and Medicine published in 2005:

            https://www.nap.edu/read/11175/chapter/3#22

            From page 22:

            “With respect to climate forcings on the oceans, reference page 22, “A relaxation timescale of 2000-3000 years is determined by the deep ocean mixing timescale. If only the upper ocean is considered, the system can reach equilibrium in about 50 years, which corresponds to an e-folding response time of 2-3 years.”

            And so as I told Nate, if a GHG radiative forcing takes 50 years to become neutralized over the oceans, then at a 2.5 year response time, you still have 82% of the forcing operating on the upper ocean mixed layer, not 36%. You don’t reach one e-fold for 12.5 years. That is certainly more than long enough for the OLR emission to have to drop below the effective value of 231Wm-2 but yet it didn’t.

            Ball4: ” I could not find any ref. to OLR in your entire source “when the OLR record shows it increased 2 Wm-2 since the beginning of the satellite record?”.

            Me: Its right on the global OLR chart published on climate4you.com.

            Ball4: “You are not correct either with “the OHC was claimed by NOAA for 700 meters. It was 150 zetta Joules from 1985 until now.” See fig. 3.2a p. 262: the published estimates range from eyeballometer roughly 80ZJ to 180ZJ with no mean published.”

            Me: I have no idea where you’re looking to range 80-180 ZJ, but the mean of that is 20 ZJ lower than 150 ZJ.

            Ball4: “Your data is not accurate according to your own published sources. Your assertions are therefore unfounded.”

            Me: This exchange is a snapshot of the mess “climate science” is in. Within 8 years, the response feedback from the oceans to neutralize radiative forcing by CO2 on the oceans is determined to have been off by a factor of 5. Instead of 50 years, it now just turns out to be 10.

            I challenge you to show me just what was discovered to reveal such an error. I submit nothing. The sorry state things are in defends the indefensible by the same practice of adjusting data with time or length to match whatever the current state of the climate is when it doesn’t match reality. For WG1AR5 to have stuck to a 50 year equilibrium time with an RF from CO2 would have revealed obvious problems with the failed modeling.So the modeling is re-initialized from this to make another run with different parameterizations in hopes of matching a new future prediction and with brand new expectations coming closer to reality near real time.

            This isn’t science. It is playing games with statistics to engage in curve fitting exercises.

            There is no GHE signature in the OLR record.

          • Chuck Wiese says:

            Nate: So if it is 2.5 y, as you originally said, then you seem to agree that the OLR can remain relatively flat. Ok.

            Me: No, Nate, thats not what I said. If it takes 50 years for the upper ocean to reach equilibrium with an RF from CO2, in 2.5 years, 82% of the RF is still operating at TOA. And at 12.5 years, 36%.

            This means it should be below the effective emission of 231 Wm-2 and it is not.

            Nate: Well it is easy to see the relaxation time of CO2 after volcanoes, like Pinatubo, and large El Ninos, is consistent with 2-3 y and not consistent with 12 y.

            Me: These are totally different, Nate. Volcanoes directly block SW and LW at TOA and the dispersion is much more rapid, just like transient Kelvin waves that cause El Ninios in the tropical Pacific.

          • Ball4 says:

            Chuck 2:33am: “No! (https://www.climate.gov/news-features/understanding-climate/climate-change-ocean-heat-content) is not my source.”

            First you comment this dot gov site is your source, now this dot gov site is not your source. Your science credibility is about zero once you change your data references to suit your personal views.

            “It’s right on the global OLR chart published on climate4you.com.”

            OLR is measured by NOAA instruments & published by their PI et. al. on CERES team so go there for accurate OLR charts not any website; you have been misled.

            Again, Chuck’s data is not accurate according to his own published sources. Chuck’s assertions are therefore unfounded.

          • Nate says:

            Chuck,

            The e-folding time is 2-3 y according to your cite (NAS). That has a specific definition, time to reach 1/e = 1/2.71= 37% of original value. You can’t arbitrarily change it how you like.

            Now, the radiative forcing due to GHG has been growing almost linearly since 1980, and has increased by ~ 1 W/m^2 since then.

            https://en.wikipedia.org/wiki/Radiative_forcing.

            Meanwhile the TOA radiative imbalance has remained relatively constant since then ~ 0.5 W/m^2.

            https://journals.ametsoc.org/doi/10.1175/JCLI-D-13-00294.1

            So with a relatively steady imbalance, the decrease in OLR due to the 1 W/m^2 of forcing MUST have been ~ cancelled by the increase OLR due to temperature rise.

          • Chuck Wiese says:

            Ball4 : “First you comment this dot gov site is your source, now this dot gov site is not your source. Your science credibility is about zero once you change your data references to suit your personal views.”

            Me : Bullskat! The dot gov site deals with NOAA plotted OHC. That IS a source. I did not use WG1AR5 Ch3 for a relaxation time for the upper ocean because that was changed from 50 to 10 years. I asked you to explain this and just like every other climate troll I run across like you, you NEVER answer any of the questions or explain anything.

            Your MO in my exchange with you is to claim I quote all the wrong things and from bad sources even though the sources for the processed data I use are the same, with the same raw data CERES uses, except CERES doesn’t talk about absolute OLR, the speak in delta OLR over time. Then you say stupid things like I claim one thing and then another.

            This convinces me you are one of today’s “climate scientists”. When you troll on the internet, you hide behind an assumed pseudonym name and then obfuscate and refuse to answer any question asked of you, but you know the material in the IPCC bible all to well and defer to anything in it to defend any question, even though that defense doesn’t answer the question that is asked.

            With someone like you, it is pointless to continue a discussion because you’re not being honest.

          • Ball4 says:

            “I did not use WG1AR5 Ch3 for a relaxation time for the upper ocean”

            Of course not since we were discussing your inaccurate OLR and OHC 0-700m data.

            “I asked you to explain (relaxation time for the upper ocean because that was changed from 50 to 10 years).”

            You did not. You were discussing relaxation time with Nate.

            “you NEVER answer any of the questions or explain anything.”

            I did. And I referred you to the specialist papers for the detail explanations and question answers.

            “except CERES doesn’t talk about absolute OLR”

            They do! Along with absolute incoming solar, see Loeb 2018 Table 5.

            With someone like Chuck, it is pointless but entertaining to continue a discussion because his commented data is known to differ with actual measurement. But Chuck can make progress by simply spending some time actually reading about and comment using the measured data from published, cited papers for OLR and OHC & not being misled by website editors with their own agendas.

          • Chuck Wiese says:

            Me: Bullskat! Again! I asked you this in my post above. What is wrong with your comprehension?

            “Me: This exchange is a snapshot of the mess climate science is in. Within 8 years, the response feedback from the oceans to neutralize radiative forcing by CO2 on the oceans is determined to have been off by a factor of 5. Instead of 50 years, it now just turns out to be 10.

            I challenge you to show me just what was discovered to reveal such an error.”

            Ball4 is a climate scientist troll,trying to defend what cannot be defended and deflects to IPCC reports to do this and claims if anything isn’t published there, it isn’t accurate, which is a lame response, just like using a pseudonym for a name is when exerting authority.

          • Chuck Wiese says:

            Nate, your last post above is completely wrong. I’ll respond this evening when I have more time.

          • Ball4 says:

            “I asked you this in my post above.”

            Chuck, what you clip is a statement not a question. Questions have an “?” after them not a .

            “deflects to IPCC reports to do this”

            Not moi, Chuck deflected me and other interested readers to IPCC’s WG1AR5 Ch3 from 2013.

            I exert no authority Chuck; I’ve been using CERES Team to point out Chuck’s inaccuracies in OLR and OHC. Chuck can make progress by simply spending some time reading about and comment using their measured data.

            Chuck will enjoy much more credibility responding to Nate later by commenting with actual CERES Team data.

          • Chuck Wiese says:

            Ball4: “Chuck, what you clip is a statement not a question. Questions have an “?” after them not a ”

            Me: Yes, Ball4, with you there is no common sense. It depends on what the meaning of is,is. People who understand English certainly know that challenging another to explain a discrepancy is asking for a response. Only in the world od a dissembler is it not.

            Ball4: “deflects to IPCC reports to do this”

            “Not moi, Chuck deflected me and other interested readers to IPCC’s WG1AR5 Ch3 from 2013.”

            Me: You silly mook. What do you think me deflecting you to this and declaring anything else is not valid?

            Ball4: “I exert no authority Chuck; I’ve been using CERES Team to point out Chuck’s inaccuracies in OLR and OHC. Chuck can make progress by simply spending some time reading about and comment using their measured data.”

            Me: Silly response. The problem is you haven’t shown where and why the data I presented you is wrong. But you are exerting authority by claiming the IPCC and CERES data is the only correct data or forms of it. And that is why I keep asking you for a real name.

            You should read my forthcoming response to Nick. You might make some progress by digesting it.

          • Ball4 says:

            “People who understand English certainly know that challenging another to explain a discrepancy is asking for a response.”

            You misdirect readers about me not answering your question (which didn’t exist) and then change to misdirect them not answering a challenge on a subject (relaxation) we weren’t even discussing. This is your issue not mine.

            “The problem is you haven’t shown where and why the data I presented you is wrong.”

            I did. I cited your own source: “See fig. 3.2a p. 262” to which you answered you have “no idea” which is obvious. Your OLR & OHC 0-700m data doesn’t agree with CERES Team ref.s or your own source ref.s.

            “You should read my forthcoming response to Nick.”

            Think you mean Nate. I will read your response but Nate is handling your inaccuracies just fine on his own.

          • Chuck Wiese says:

            Nate: The e-folding time is 2-3 y according to your cite (NAS). That has a specific definition, time to reach 1/e = 1/2.71= 37% of original value. You can’t arbitrarily change it how you like.”

            Me: This is wrong. 1/e is not a physical equation. The correct form which you already alluded to was e^-tau, where tau must contain the “half life” coefficient that represents one e-fold where the residual RF imbalance is at 36%. Tau = t/te so that if the total time for the oceans to reach radiative equilibrium is 50 years, then one full e- fold is 12.5 years which equals te, NOT 2.5 years. This means exactly what I told you in that at 2.5 years, the RF “imbalance” from CO2 is still at 82% and doesn’t reach 36% until 12.5 years. If te equals 2.5 years, that means the radiative “imbalance” response by the oceans is neutralized in 10 years.

            In the NAS report released in 2005 that I reference, everyone agreed the upper oceans need 50 years to neutralize a RF from CO2. Then suddenly in the IPCC report 2013 that Ball4 and apparently you like to tout,WGA1AR5 Ch3,the FAQ reports the oceans need only 10 years to reach equilibrium. I’ve looked everywhere to why this was changed and wondered how in the world could all these scientists be off by a factor of 5 in such a calculation. I can’t find a single reason but in looking at how RF is calculated by CO2 at TOA and the fact that there is no GHE visible in the OLR record, this becomes the excuse as to why you can’t see it. Curve fitting. Not science. Do you or Ball4 care to explain this? I’ve asked this of both of you and never get an answer. Kind of embarrassing for you both I would imagine.

            Nate: “Now, the radiative forcing due to GHG has been growing almost linearly since 1980, and has increased by ~ 1 W/m^2 since then.

            https://en.wikipedia.org/wiki/Radiative_forcing.

            Meanwhile the TOA radiative imbalance has remained relatively constant since then ~ 0.5 W/m^2.

            https://journals.ametsoc.org/doi/10.1175/JCLI-D-13-00294.1

            So with a relatively steady imbalance, the decrease in OLR due to the 1 W/m^2 of forcing MUST have been ~ cancelled by the increase OLR due to temperature rise.”

            Me: Except this is nonsense. Right now the integrated OLR is on the wrong side of an RF from CO2, being slightly above the effective emission. Here is a more recent OLR graphing that adds the ERBE record to CERES and was provided by a blogger on Roy’s site here with a different topic that specifically addressed what the satellite records are telling us:

            https://okulaer.files.wordpress.com/2016/06/uahv6-tlt-trop-x.png

            This is in the tropics but you can clearly see there is no GHE signature in this record and you can see how temperature responds nicely from Pinnatubo and the El Ninios as the OLR drops and then recovers as temperatures rise. This is another reason why I believe the equilibrium response time for ocean warming was shortened to 10 years from 50 because the modelers like Gavin Schmidt, et al can’t explain RF from CO2 without changing the ocean equilibrium time to something much shorter so they could cover up model failure and expectation. But in any event, the OLR is on the wrong side of the effective emission mean ( given by CERES as 239.6 Wm-2) which translates to 231 Wm-2 with the atmospheric window blocked such as at the climate4you.com graphs. Your claim that relaxation times for volcanoes, El Ninio’s and such are short so therefore ocean response is the same or 10 years has no physical basis for the claim. There are completely separate processes

            But to take this business about OHC further, the assumption has always been that because of the large lag time in warming from CO2, that the “imbalance” RF it is expected to cause would surely show up in the satellite record to confirm failed modeling. But I also have wondered how these modelers like Schmidt, Trenberth, Hansen and Santer could distinguish OHC from solar shortwave forcing vs. that from CO2.

            If you look at CO2 radiation at 15 microns with respect to a plane of water, the ab-sor-ption coefficient is so large (around 1000cm-1) that all the incident radiation is ab-sor-bed in just over 10 microns from the surface. Visible and UV light, however, is much more energetic. The blue spectrum penetrates 100-200 meters and the green, yellows and reds including UV penetrate in the range of 10-70 meters. So how do you know what fraction of solar shortwave is adding to OHC storage vs. a claimed (and unproven in the presence of the hydrological cycle) RF from CO2? Any idea?

            I’d say this is physically impossible. Just a dirty little secret that that I thought I would share with you and Ball4.

            Roy Spencer talks about many of the other internal and natural forcings in the Earth’s climate system as well in his latest paper on this with Braswell in 2009.The internal mechanisms quite complex. Did you read it?

            Concluding, there is NO GHE in the satellite record that is apparent anywhere. The IPCC and modelers have covered this up by changing the CO2 RF relaxation time with upper ocean heat content and without a physical reason to 10 years instead of 50 years agreed upon just 8 years earlier before IPCC 2013 and there is no way to distinguish solar shortwave warming on the oceans from a theoretical forcing by CO2.So any forcing calculation is meaningless, which I showed you by the calculations that don’t match OLR or warming of the oceans from any mean forcing derived comparing how much the upper oceans have warmed to how much heat is being stored at depths to 700 meters or beyond.

            The AGW claims from CO2 and other GHG’s are now on life support and will die an agonizing death. Lots of hysteria money to be lost along with some reputations and egos. OUCH!

          • Nate says:

            Chuck,

            See new thread at bottom.

          • Ball4 says:

            “Do you or Ball4 care to explain this?”

            Depends on the depth of ocean being discussed Chuck. Pay attention to that bulk. Takes centuries for deep ocean to equilibrate a surface temperature change but the upper near surface levels equilibrate quickly measured in years, the reports you ref. lay it out for you. Read them, report back what you find.

          • Chuck Wiese says:

            Balll4 said “Depends on the depth of ocean being discussed Chuck. Pay attention to that bulk. Takes centuries for deep ocean to equilibrate a surface temperature change but the upper near surface levels equilibrate quickly measured in years, the reports you ref. lay it out for you. Read them, report back what you find.”

            Me: You are completely dishonest and the typical climate dissembler when caught in a corner you can’t escape from. For someone who claims “no authority” as you do to me on this thread, I invite the reader to look at the other threads in this article where you have posted that show how you exactly exert authority as an expert in climate but yet continue to operate in anonymity with this nonsense to me.

            It has been made perfectly clear that the entire discussion about OHC in every climate paper I can find deals with defining the “upper ocean heat content” as the OHC between the 0-700 meter layer. Here is just one of them:

            https://www.tandfonline.com/doi/pdf/10.3878/AOSL20150031

            And it makes perfect sense that at those depths, the response time required to neutralize an RF from a GHG like CO2 would take 50 years since that only regulates cooling rates from the surface and does not directly warm as solar energy does the surface.

            But somehow, the NAS version in 2005 was switched to 10 years by the IPCC in 2013 an error that is off by a fact or 5 with no justification for the change offered.

            You have yet to offer an explanation and I am asking you for one too,just in in case you want to try and say I did not ask for one. You know, that depending on what the meaning of is, is thing used in dissembling.

            I would conclude there is not even a way to determine a RF from CO2 because you have no way of separating the theoretical calculation from the reality of observation. The GCM’s can’t model clouds, the hydrological cycle or absolute humidity with any accuracy in special or time coordinates, so looking for a RF from CO2 is like trying to find a needle in a haystack. Just as founding principles suggested that demonstrate empirically that CO2 IR cannot control the earth’s optical depth. Solar insolation along with water vapor, clouds and the hydro cycle do which means CO2 cannot amplify it.

            Climate models fail in every aspect of this and the modelers realized what I said is true so they switched the feedback equilibrium time to 10 years from 50 years in the IPCC reports so that the RF signal from CO2 can be claimed to be obscured in the other short term climate noise and from that they will claim it sill exists without a verifiable record to match failed OLR predictions.

            Nice way to obscure failed modeling that has wasted BILLIONS in taxpayer money. It is obvious egos, reputations and money are what are now driving this fraudulent dishonesty.

            THERE IS NO GHE SIGNATURE IN THE CLIMTE RECORDS.

          • Ball4 says:

            Chuck writes inaccurately about “entire”: “It has been made perfectly clear that the entire discussion about OHC in every climate paper I can find deals with defining the “upper ocean heat content” as the OHC between the 0-700 meter layer.”

            Chuck’s own 5:57pm source ref. that apparently Chuck doesn’t bother to read thoroughly p. 257 1st paragraph: “The strongest warming is found near the sea surface (0.11 [0.09 to 0.13] degree C per decade in the upper 75 m between 1971 and 2010), decreasing to about 0.015 degreeC per decade at 700 m.”

            Chuck then claims “the NAS version in 2005 was switched to 10 years by the IPCC in 2013 an error that is off by a fact or 5 with no justification for the change offered.”

            Same paragraph: “It is virtually certain that upper ocean (0 to 700 m) heat content increased during the relatively well-sampled 40-year period from 1971 to 2010. Published rates for that time period range from 74 TW to 137 TW.”

            Chuck’s same source does offer justification for that assessment which Chuck demonstrates not reading: “Confidence in the assessment for the time period since 1971 is high based on increased data coverage after this date and on a high level of agreement among independent observations of subsurface temperature [3.2], sea surface temperature [2.4.2], and sea level rise, which is known to include a substantial component due to thermal expansion [3.7, Chapter 13].”

            Going deeper in the ocean, Chuck is correct about response time: “And it makes perfect sense that at those depths, the response time required to neutralize an RF from a GHG like CO2 would take 50 years” see the 2nd paragraph:

            “It is likely that the ocean warmed between 700 and 2000 m from 1957 to 2009, based on 5-year averages.”

            “You have yet to offer an explanation and I am asking you for one too”

            I just clipped the specialist explanation for Chuck and others since he was too busy to read it and would call any explanation written by me “dishonest” anyway since: “You are completely dishonest”

            “The GCM’s can’t model..”

            I pointed out to you and David where the actual OLR and OHC measured data can be obtained (Loeb 2018); you keep drifting to complain about GCMs which are not data, they are models as that is what the M stands for – just look at actual measured OLR and OHC data if you want to understand how the climate system works. But you seem more interested in calling commenters “dishonest” than discussing this stuff and spending time doing the actual reading & understanding the research data.

          • Chuck Wiese says:

            Ball4: Your obfuscation continues. It doesn’t matter whether the NAS paper talks about OHC at various levels. The point is, upper OHC content is the sum of heat energy computed within the 0-700 meter depth.

            NAS had the response time relaxation at 50 years from a CO2 RF at TOA. In IPCC 2013, they say 10 years based upon the FAQ box in chapter 3 you referenced.

            Explain why.

          • Ball4 says:

            Already explained, increased oean temperature data coverage, especially the added Argo fleet after your 2005 date: “Confidence in the assessment for the time period since 1971 is high based on increased data coverage after this date and on a high level of agreement among independent observations of subsurface temperature [3.2], sea surface temperature [2.4.2], and sea level rise, which is known to include a substantial component due to thermal expansion [3.7, Chapter 13].”

            Loeb 2018 also already explained OHC warming p. 904 3) para. 1 I clipped for Chuck who simply circles back – reading and making progress understanding would be a better use of limited time.

        • David Appell says:

          Source for 2 W/m2 number?

      • Gordon Robertson says:

        DA…”the LIA wasnt global….”

        So it was 1C to 2C cooler in Europe but not in the rest of the world. Neat trick.

      • Chuck Wiese says:

        Ball4: The OLR I reference excludes the atmospheric window and only references opaque wavelengths that absorb and emit IR radiation in the earth’s atmosphere. Not sure what “all sky means” but it probably includes the 10 micron window. That would change the numbers and possibly obscure the trend that emerges without the window. You can see the charts at climate4you.com. Click on “big picture” and scroll down to the OLR radiation charts.

        With respect to CERES data on albedo, the point I make is that the snow and ice albedo is static. Earlier in the record of research, it was shown that the cloud albedo declined .6% from 1984-1997 and Legates’s research showed in had no trend from 2000 onward. That is about 2.3 Wm-2 of additional energy reaching the surface for that time frame. The CERES data does not obviously cover this.

        • Ball4 says:

          All-sky includes clear sky plus cloudy sky to the limits of what satellites can detect as a difference in the two scenes.

          “The OLR I reference excludes the atmospheric window..the snow and ice albedo is static.”

          Any important variation in “atmosphere window” in the satellite period then is excluded as well as any important variation in total albedo components other than snow and ice which means the data you ref. is less complete, less meaningful than CERES reports which include those variations in the period.

          “scroll down to the OLR radiation charts.”

          What is the source of the OLR data in the charts?

          • Chuck Wiese says:

            “Any important variation in atmosphere window in the satellite period then is excluded as well as any important variation in total albedo components other than snow and ice which means the data you ref. is less complete, less meaningful than CERES reports which include those variations in the period.”

            Not entirely correct. Any cloud will radiate at an opaque wavelength, including the atmospheric window. That is BB radiation. There is no differentiation there. What we are trying to surmise is whether the OLR in the GHG wavelengths is declining as predicted by failed climate models. If the temperature increased by 1 degC from the global mean, the 9-11 micron window difference is only .2Wm-2. How is this meaningful to the rest of the BB spectrum? You could correct for it with less noise than getting the signal you would get ranging anywhere from a warm surface to a cold cloud 6 Km high.

          • Ball4 says:

            “What we are trying to surmise is whether the OLR in the GHG wavelengths is declining as predicted by failed climate models.”

            That would be in an effort to trouble shoot the climate models and debate their performance. To properly debate explanations for system global surface temperature trends in the satellite era based on measured TOA input & output data though, use CERES Team publications.

        • David Appell says:

          Chuck says:
          With respect to CERES data on albedo, the point I make is that the snow and ice albedo is static.

          Where is this data?

      • Vieras says:

        If we are only 0.6 C from the Little Ice Age, Id say that we need a bigger safety buffer between now and famine.

        • Nate says:

          Vieras,

          0.6 C, where from?

          Not the very misleading Fig 6 above, which shows almost no modern warming?

          Here is what the record actually shows.

          https://tinyurl.com/yc4e659y

          • Vieras says:

            David Apell claimed that (1) the LIA wasnt global, and (2) the temperature was only about 0.6 C cooler at most.

            Its just an example of have the cake and eat it. You cant worry about the world being too hot if you claim that wed be that close to LIA. If what he claims is true, wed better have a warmer world just to be safe. And if the LIA was a lot colder, natural warming plays a bigger role.

        • Nate says:

          He meant .6 below average of preceding periods, not 0.6 below today.

      • Jake says:

        https://www.historicalclimatology.com/blog/did-the-little-ice-age-really-exist-november-24-2013

        and ….

        https://www.swsc-journal.org/articles/swsc/abs/2017/01/swsc170014/swsc170014.html

        … both seem to indicate that the LIA was global. DA, you cannot claim emphatically that the LIA wasn’t global. Speaking in absolutes isn’t what scientists do when dealing with information that isn’t LAW. You can”t claim that AGW is LAW when there is ongoing research. Treat the subject as such.

      • Chuck Wiese says:

        Nate: “So if it is 2.5 y, as you originally said, then you seem to agree that the OLR can remain relatively flat. Ok.”

        Me: No, Nate, that’s not what I said. If it takes 50 years for the upper ocean to reach equilibrium with an RF from CO2, in 2.5 years, 82% of the RF is still operating at TOA. And at 12.5 years, 36%.

        This means it should be below the effective emission of 231 Wm-2 and it is not.

        Nate: “Well it is easy to see the relaxation time of CO2 after volcanoes, like Pinatubo, and large El Ninos, is consistent with 2-3 y and not consistent with 12 y.”

        Me: These are totally different, Nate. Volcanoes directly block SW and LW at TOA and the dispersion is much more rapid, just like transient Kelvin waves that cause El Ninios in the tropical Pacific.

    • Gordon Robertson says:

      myki…”You are implying the absence of cause and effect.
      Maybe god did it?”

      It was geophysicist Syun Akasofu who formulated the theory. He was a pioneer in the study of the solar wind, you’d think he’d be up on cause and effect.

      Akasofu put numbers to it. The Little Ice Age ended circa 1850 and he hypothesized 0.5C re-warming per century. He claims the IPCC erred by not allowing for that natural re-warming.

  23. Myki is one of those extremist when it comes to the false AGW theory, which I suspect will be proven wrong before 2020, as the climate cools. I should say continues to cool because thus far 2018 is cooler then 2017.

    • Myki says:

      An “extremist” ?
      That is a bit harsh.
      How about I call you an extreme “goal-post mover”
      Didn’t you sat that you will be proven right/wrong by the end of this year (and not 2020)?

  24. La Pangolina says:

    bilybob says:
    July 3, 2018 at 2:32 PM

    I have been sampling these new records and finding most do not have temperature data going back before the 1970s

    *

    bilybob, it is not the first time you tell us that.

    4GP.ME/bbtc/1530700261210.jpg

    What now concerns a worldwide version of Mr Spencer’s Fig. 5, my life companion J.-P. alias Bindidon will manage to produce it out of the GHCN V4 daily record, encompassing in the sum since 1880 over 35,000 stations all over the world.

    Rose J.

    • La Pangolina says:

      The link above is not directly clickable.

      http://4gp.me/bbtc/1530700261210.jpg

    • bilybob says:

      Thanks La Pangolina,

      If Bindidon can do it, I think it will be an eye opener. I do not have access to a complete data set of temperature extremes. It is a slow process to look up individual areas.

      Your graph of sites shows where the problem lies. There are only 1000 global sites in 1900 and 2700 sites now. When looking at new high temperature records it should be no surprise that these 1700 extra sites (an I am giving the benefit of the doubt here because some of the original 1000 have closed so the number is probably higher) which give a potential of 1700*365=620,500 daily temperature data points versus the 365,000 daily temperature data points for the 1000 sites that go back to 1900 would likely produce a new temperature high given there limited history.

      So if your friend is capable and interested, or if you could link me to the data, I would be interested in

      A) what percent of the original 1000 sites are still active today?
      B) what percent of these have max temp record prior to 1960?
      C) what percent of the new max temp records come from the 1700 new sites?

      My guess is all three answers will be above 90%. But again, I have only sampled about 150 sites over the past several months.

      • Bindidon says:

        To (A) I think in 2017 I registered about 300 stations with activity range 1880-2017.

        The evaluation will of course be based on percentiles: you see the Globe’s station number bump within 1950-1990. Ignoring it would produce nonsense.

        • bilybob says:

          Thanks Bindidon,

          The 300 would be about 80% of the original for 1880 if I am looking at this correctly. In 1890 there was a jump to 1000 sites. The bump in 1950 – 1990 I viewed as sites that were added then removed due to budget reasons. There data would be limited to determine if extreme heat was significantly different prior to 1960 compared to now.

          • Bindidon says:

            There were not only budget reasons for removing lots of stations.

            A very important aspect if not the primary one has been that a huge amount of stations still are alive but were dropped off the record because they are not remotely accessible and their data transmission therefore is bound to the responsible persons’ goodwill.

            That is a point you cannot live with anymore today.

            Please apologise for my english mostly originating from
            https://translate.google.de/?hl=fr&tab=wT#fr/en/

      • David Appell says:

        I’ve heard it said, by a scientist on Twitter who was at a conference listening to a talk, that the speaker said 100-150 temperature stations around the world would suffice to get a “good enough” measure of the average global surface temperature.

        • Gordon Robertson says:

          DA…Ive heard it said, by a scientist on Twitter who was at a conference listening to a talk, that the speaker said 100-150 temperature stations around the world would suffice to get a good enough measure of the average global surface temperature”.

          Then he wasn’t a scientist. NOAA can’t even give an accurate global average using 1500 stations, which they have slashed from 6000 stations.

          • David Appell says:

            Yes, he was a scientist. Andrew Dessler quoted him. It costs money to maintain stations, and international cooperation, and there’s no need to have so many stations when that many aren’t needed.

      • Gordon Robertson says:

        bilybob…”If Bindidon can do it, I think it will be an eye opener”.

        Binny is a rank amateur and an uber-climate alarmist. What do you think the chances are that you’ll get an objective assessment?

        Binny has already produced favourable comparisons between UAH data, with a 1980 – 2010 baseline, with fudged Had-crut data with a 1950 – 1990 baseline. Only a serious alarmist could offer such garbage.

        Binny does not understand that number crunching is fraught with error if you don’t specify the context from which the data is derived. A serious alarmist has no problem aligning trends from different baselines to show an agreement even though the data shows entirely different contexts.

        For example, using their baseline, Had-crut shows a steep positive trend from 1980 onward. UAH does not over their baseline beginning in 1980. UAH shows a recovery from cooling from 1979 – 1997 followed by a flat trend for 15 years. Had-crut and NOAA show no such flat trend.

        NOAA used to show a flat trend from 1998 – 2012 but they have re-written the record to eliminate it. Binny does not care about such scientific misconduct.

        • bilybob says:

          Gordon Says “Binny is a rank amateur and an uber-climate alarmist. What do you think the chances are that you’ll get an objective assessment?”

          “There is a Vulcan saying. Only Nixon can go to China.” Spock

          It will have more meaning to me to get Bindidon’s opinion. It would be difficult to distort this information anyway. I have had a relatively positive experience with discussion with Bindidon in the past. I started this blog about a year and half ago. You may have had a longer history though.

    • bilybob says:

      One other quick observation,

      While looking individual sites I came across in Alice Springs where they moved the site from the Post Office to the Airport.

      The extreme heat record is now based on the Airport even though the Post Office recorded a higher temperature pre 1960. There was a 15 year overlap of the two sites showing comparable temperatures, and yet the higher temperature from the past was removed.

      Also, GISS somehow has reduced the average temperature by 2C starting in 1880 and reducing the correction over time. Not sure why. I went to BOM and the data did not have issues. When taken together the two sites (post office/airport) show no significant warming for Alice Springs but GISS will have you believe it has warmed 2C. I believe you mention to me to look at the data issues at BOM, but I could not find any for Alice Springs. Your thoughts?

      • Bindidon says:

        bilybob, when there is time enough to do, I will manage to look at your Alice corner.

        I will ll create for both GHCN daily stations:
        ASN00015540 -23.7100 133.8683 580.0 ALICE SPRINGS POST OFFICE (1878-1953)

        ASN00015590 -23.7951 133.8890 546.0 ALICE SPRINGS AIRPORT (1941-2017)

        a separate time series, so we can compare them more accurately during their common period (1941-1953).

        On thing is clear right now: the difference in elevation (24 m) cannot be the problem if there is any.

    • Gordon Robertson says:

      binny…”my life companion J.-P. alias Bindidon will manage to produce it out of the GHCN V4 daily record,”

      That gives me great confidence. An armchair climate enthusiast is over-turning the work of professionals in the field like Roy Spencer and John Christy of UAH.

      I have already revealed how Binny’s amateur comparison’s between fudged NOAA/Had-crut data and UAH data does not agree with either source.

      Binny is interpolating data from different baselines and getting it completely wrong.

      • Bindidon says:

        “I have already revealed how Binny’s amateur comparison’s between fudged NOAA/Had-crut data and UAH data does not agree with either source.

        Binny is interpolating data from different baselines and getting it completely wrong.”

        *

        Why are you lying all the time, Robertson?

        This comment is particularly disgusting, as you never have been able to show anything wrong.

        But though you have here lots of followers willingly absorbing all your ignorant and denigrating nonsense, there will be more and more who don’t and will rather believe me.

  25. Brendon says:

    You forgot to tag this article with “cherry pick”.

  26. The key metric for now is overall oceanic sea surface temperatures in particular the N. Atlantic but really the whole aggregate of sea surface temperatures and where they go the climate will follow.

    Right now oceanic sea surface temperatures are around +.22c from 1981-2010 deviation meaning if they even stay at these levels no more additional global warming is going to take place.

    My thought is overall sea surface temperatures are going to have to fall more in response to very low prolonged minimum solar activity.

    This is why I say the climate is at a crossroads now.

  27. Joe R says:

    I regularly notice that all participants not interested in good science project isolated weather events as proof of their global climate views, and it only weakens their side. Be happy all we have places to speak our minds, and other views can be spoken also. Cherish that, respect that, teach that.

  28. David Appell says:

    Roy, you need to be careful interpreting that chart of average maximum temperatures. Much of New York state is very rural, and the Adirondacks have 46 mountains higher than 4000 ft. Upstate it’s more like New England than downstate NY.

    For example, right now, July 4th, 2:10 pm EDT, Albany is at 95 F. Rochester NY is at 93 F.

    Perhaps Public Citizen is wrong. But the USA48 is definitely getting warmer, and fast.

    Since 1895 the total warming is 1.0 C.

    But in the last 30 years, the trend is +0.27 C/decade. In fact, this has been the trend, +/- a few hundreths, since the early ’60s.

    That’s +0.49 F/decade !

    The five warmest CONUS years in the record are 2012, 2016, 2017, 2015, 2006.

    Sure, it’s easy to find fault somewhere. But the Continental US is warming at a rapid rate, and you can’t dismiss by highlighting one apparent error.

    • Chuck Wiese says:

      This is a lie, Appell. I told you last week when I debated you that official weather stations of NOAA in Oregon and Washington away from urban heat island effects are showing either long term cooling or a static record. Those include Salem, Eugene, Astoria and Tatoosh Island in Washington State. Atmospheric CO2 is the same there as it is everywhere else, but there has been no warming. How do you explain that, Appell, especially since you claimed in my debate with you that the oceans are warming at the same rate as the continents?

      You never answer legitimate questions.

      • David Appell says:

        Chuck never presents any data, he just waves his hands and, presto, out comes a pronouncements.

        Oregon’s average temperature has increased by 1.5 C since 1895. Data from the usual NO.AA site, which must not be linked to.

      • Gordon Robertson says:

        Chuck…”official weather stations of NOAA in Oregon and Washington away from urban heat island effects are showing either long term cooling or a static record”.

        NOAA has eliminated stations showing cooling from their database. They admitted on their site to slashing reporting stations from 6000 globally to less than 1500, then using the 1500 in a climate model to SYNTHESIZE the slashed stations.

        It’s called interpolation and homogenization. If a cooler station appears they eliminate it and interpolate between hotter stations to raise the average.

        • Chuck Wiese says:

          Hello Gordon: You are correct. I have been following the station drop outs and deliberate backfilling of rural sites being used to distort the climate record with.

          This practice is shameful and fraudulent.

          • David Appell says:

            Chuck, Gordon:

            Which specific stations have been eliminated?
            When?
            Show the data and evidence to support your claim.

            Which specific stations have been “backfilled?”
            When? In what way?
            Show the data and evidence to support your claim.

          • Gordon Robertson says:

            DA…”Show the data and evidence to support your claim.”

            You have been shown several times and you just come back with the same dumb questions.

          • Bindidon says:

            What about showing us these stations, Chuck Wiese?

            Because when you write about GHCN V3 Oregon stations like

            42572694000 44.9200 -123.0000 61.0 SALEM/MCNARY 93U 108FLxxno-9A 1COOL CROPS C

            Salem’s population: about 150.000 people

            or

            42572693000 44.1200 -123.2200 114.0 EUGENE/MAHLON 117U 113HIxxno-9A 4COOL CROPS C

            Eugene’s population: about 160.000 people

            and describe them as being ‘away from urban heat island effects’, you show nothing else than absolute ignorance; both have station type ‘U’ (urban) and highest nightlight level ‘C’. No wonder when considering their population!

            *

            It seems to me that like Robertson, you pretend much more than you know.

            And while naming Appell a liar, you yourself do not seem to be averse to writing lies.

          • Chuck Wiese says:

            Blindidon: Eugene’s weather station is on the far north end of the metro. I have no idea why it is designated as urban.

            But Climatologist Mark Albright uses this station as a reference to urban networks, and tells us it is far enough away from the urban part of Eugene to where it does not have the UHI effect that many other metropolitan stations have.

            But he nor I are in charge of NOAA designation, so I don’t know what point you are trying to make.

          • David Appell says:

            Chuck, Gordon:

            Which specific stations have been eliminated?
            When?
            Show the data and evidence to support your claim.

            Which specific stations have been backfilled?
            When? In what way?
            Show the data and evidence to support your claim.

          • David Appell says:

            Chuck Wiese says:
            But Climatologist Mark Albright uses this station as a reference to urban networks

            Notice that the data only go to 2013.

            Why is that, when it’s now 2018?

    • Chic Bowdrie says:

      “Since 1895 the total warming is 1.0 C.”

      That’s about the same as the rest of the world. So the US warming fast is basically a hand-waving pronouncement. Without sufficient evidence that increasing CO2 causes the warming and that humans produce the majority of the CO2 increase, you are pissing into the wind.

      • David Appell says:

        The 30-yr trend for CONUS is 0.27 C/decade, which is indeed fast.

        Everyone knows that CO2 causes warming. You can go learn, or pretend you know more than every scientist on the planet. Your choice.

        • Chuck Wiese says:

          It’s fast if you distort and change a record by throwing out rural stations and backfilling with urban ones and then expand this record into rural locations where there are no records or deliberately delete the ones that don’t give the trend you want. This is called fraud.

          • David Appell says:

            You always have some excuse, don’t you Chuck? Always some nefarious reason why things aren’t going your way. Meanwhile, you have no proof or evidence of anything such as that — it’s just an convenient excuse for you. You can’t disprove the science, so you try to claim it’s all a conspiracy, the lazy man’s approach to everything he can’t disprove.

            Where is your evidence or “throwing out” rural stations?
            Of “backfilling” with urban stations?
            Of deliberately deleting stations?

            Put up or shut up.

          • Gordon Robertson says:

            DA…”You always have some excuse, dont you Chuck?”

            Chuck’s claims and mine have been intricately logged at chiefio’s site.

            https://chiefio.wordpress.com/gistemp/

          • David Appell says:

            Gordon, to be frank, no one cares in the least about your claims. You’ve shown repeatedly that you understanding of science is very poor.

        • Chic Bowdrie says:

          “Everyone knows that CO2 causes warming.”

          Many assume CO2 causes warming. No one has any unconfounded temperature measurements caused by increased CO2 and those who claim CO2 warms don’t agree on how much warming.

        • Chuck Wiese says:

          CO2 could cause warming if you eliminated all the water on this planet, Appell. But then, without water, you would be starting at a temperature 28 degC colder than now. The earth would be a giant piece of frozen tundra.

          CO2 does not cause warming once you add the water and its hydrological cycle back in. That is what controls the optical depth of this planet, Appell and you cannot change this from any human influence. You are woefully ignorant in atmospheric science.

          • David Appell says:

            Where is the data and evidence proving what you claim?

          • Chuck Wiese says:

            It’s in all the dynamic meteorology texts I have on atmospheric radiation, Appell. We have been through this. I cited the references and pages for you and you just ignore what I give you.

            This work in atmospheric radiation was done post Einstein which superseded and disproved Arrhenius’s claims about CO2.
            Does Walter Elsasser from Harvard ring a bell?

            I’m not going to repeat answering your requests for “data and evidence”. You ignore anything that contradicts your narrative.

          • David Appell says:

            How ancient are these texts, Chuck?

            How come you never name them or link to them?

            How come you think climate hasn’t progressed in the century and a half since you were a wee lad?

          • David Appell says:

            Chuck says:
            CO2 does not cause warming once you add the water and its hydrological cycle back in.

            Prove it.
            Let’s see your data and evidence.
            Let’s see your equations and analysis.

          • David Appell says:

            Chuck says:
            CO2 does not cause warming once you add the water and its hydrological cycle back in.

            Add water? How?
            Let’s see your equations and data.

            Hydrological cycle.
            Means what?
            Let’s see your equations and data.

            You know there’s very little water vapor in the atmosphere in the polar regions, right?

            That Antarctica has some of the driest deserts in the world?

            That the amount of water vapor in the atmosphere can’t increase until the temperature first increases (such as from CO2, etc.) Clausius-Claperyon equation.

            That the cloud feedback is very probably positive, according to science?

            Let’s see your equations, definitions, data and evidence.

          • David Appell says:

            No equations, Chuck?

            How come?

          • David Appell says:

            Chuck thinks Elsasser’s work was the end of climate science.

            He doesn’t analyze or understand Elsasser’s approximations that were needed for him to solve the equations without a computer.

            Chuck thinks climate science stopped in 1942.

            Because, I think, he read something of Elsasser’s when he was trying to get a Bachelor’s degree, but never read anything further.

            Chuck B.S. thinks scientists didn’t know about Elsasser’s paper and, what, intentionally ignore it?

            Or did they improve on his analysis with better handling of radiative transfer with radiation code models?

            Chuck thinks that science stopped when he stopped learning about it.

    • Gordon Robertson says:

      DA…”the USA48 is definitely getting warmer, and fast.”

      Amusing. There was no warming trend from 1998 – 2015 then the 2016 EN raised global temps temporarily. After two years of a gradual negative trend we are back at the flat trend mark.

      Ergo, no warming whatsoever for more than 18 years that can be related to CO2.

      • David Appell says:

        Gordon Robertson says:
        DAthe USA48 is definitely getting warmer, and fast.
        Amusing. There was no warming trend from 1998 2015 then the 2016 EN raised global temps temporarily

        Gordon lies again. In fact, the warming trend for USA48 from Jan1998 to Dec2015 is +0.21 C/decade.

        data from NO.AA

  29. David Appell says:

    Trends of Tmax for New York, by month:

    Jan 0.09 F/dec
    Feb 0.39
    Mar 0.24
    Apr 0.24
    May 0.11
    Jun 0.05
    Jul 0.00
    Aug 0.11
    Sep 0.05
    Oct 0.04
    Nov 0.32
    Dec 0.32

  30. barry k says:

    Nate,
    The issue is cost. If it costs more to install wind generators than something else consumers and businesses will pay more for electricity. If a state is doing it, a business could move to a state with lower electricity costs. But some states have a very good wind resource and may have a need for a bit more electricity because of growth. This reasoning doesn’t apply to the USA going from 6% to 50% over ‘a few decades’. Costs would skyrocket, partly because much of that 44% replaced is a paid for resource not in need of replacement. You’re talking something like 100x the number of turbines in Denmark and massive new transmission lines resources plus the need for some backup generators.

    • David Appell says:

      In places wind power is at parity with FF sources, and cheaper if you take into account the damage done by fossil fuel pollution to human health and the environment.

      “Xcel Energy receives shockingly low bids for Colorado electricity from renewable sources: Solar and wind generation with storage now competitive with coal power,” Denver Post 1/16/18

      https://www.denverpost.com/2018/01/16/xcel-energy-low-bids-for-colorado-electricity/

      • barry k says:

        David,

        ‘take into account the damage done by fossil fuel pollution to…’
        Ah, so you get to add in a made-up number to make it look cheaper. If it is ‘cheaper’, then it is ‘cheaper’. There is also a ‘cost’ to humanity for more expensive energy… i.e. more poverty. I am sure there are cases where wind power is at parity… for example, if there is a plentiful wind resource and there is actually a need for more power in that spot. However, trying to say the USA should go from 6% of it’s electricity from wind to 50% within decades is way outside that realm of reasoning. You would need ~100x the global supply of wind turbines, massive new transmission line resources, and no doubt much of it would go in places with lower wind resource.

        I can only assume if you consider CO2 ‘pollution’ that you have cut your own carbon footprint to ‘zero’?

        Cheers,
        Barry

        • barry k says:

          I meant 10x, not 100x, but even that is off….

          To go from 6% to 50%, the USA would need an additional 600GW installed wind capacity. Last year (per Wikipedia page titles “Wind power by country”) there was approximately 51GW installed worldwide (about 14GW in USA). So, at our current rate of installation, we would add 600GW in 43yrs. To get there in 20yrs would require the average supply of wind turbines (globally) to increase by 16GW or 30%. The bigger issue is this 600GW installed in the appropriate places (USA plains or off the coasts) would require massive amounts of new transmission lines and the permitting for those alone would take decades…

          Barry

        • Nate says:

          ‘However, trying to say the USA should go from 6% of it’s electricity from wind to 50% within decades is way outside that realm of reasoning.’

          Wind and solar both are growing rapidly, like it or not.

          A ramp-up of a new infrastructure over two or three decades is a recurring theme in our history.

          Think of railroads, telegraph network, electric grid, telephone network, hi-way system, cable TV, internet, fiber optic networks, cell phone networks, gas pipeline network.

          BTW, each of these has had an economic benefit.

          • barry k says:

            Wind and solar are growing rapidly…
            So far, they are a relatively minor component of the grid power, so their intermittent nature is more easily dealt with. At 50%, that would not be the case… Getting there is much more difficult than you apparently realize. As I’ve said, just getting the permits through for the necessary transmission lines will take that long. Look, I’m sure that at some point in our future we will get more than 50% of our electricity from green sources… it will just be much longer than 20yrs from now…
            Cheers!
            Barry

        • David Appell says:

          Barry: Generating electrical power with coal and oil creates more damage than value-added, according to a 2011 study that included noted Yale economist William Nordhaus:

          “Environmental Accounting for Pollution in the United States Economy,” Nicholas Z. Muller, Robert Mendelsohn, and William Nordhaus, American Economic Review, 101(5): 164975 (2011).
          http://www.aeaweb.org/articles.php?doi=10.1257/aer.101.5.1649

          Summarizing that paper’s findings: for every $1 in value that comes from coal-generated electricity, it creates $2.20 in damages.

          Total damages: $70 billion per year (in 2012 dollars).

          Petroleum-generated electricity is even worse: $5.13 in damages for $1 in value.

          The National Academy of Sciences estimated that fossil fuel for more than just electricity use causes damages of at least $120 B/yr to health and the environment:

          Hidden Costs of Energy: Unpriced Consequences of Energy Production and Use
          National Research Council, 2010
          http://books.nap.edu/catalog/12794.html

          (Dollar figure for 2005, in 2007 dollars.)

          • barry k says:

            blah, blah, blah…
            So, I guess if $1 of value from CO2 based coal-energy results in $2.20 in damages that means you have already successfully reduced your carbon footprint to ‘zero’ so you are not part of the problem?
            Barry

  31. Joseph Dickinson says:

    The AGW scientist zealots are pawns being used by the advocates of the Global State (GSA). The IPCC is an adjunct to the GSA. Europe is leading the way. Most climate scientists are oblivious to their designs to form a single global government. The GSA takes a “long run” approach to their activities. The Global State crowd is currently focusing on two prongs to achieve its goals. The first prong is open borders.

    Open borders is the key to making a world wide government happen. Once most first world industrialized nations have open borders then they can force it upon the rest of the world. The concept is that if there is one global country,then world wars will cease to exist and humans can direct resources away from defense and have a thousand years of peace.

    The second prong is global warming. No rational person believes that economical CO2 reduction can occur. The only way to maintain the current standard of living in the first world nations is to limit population. The Global State does not believe the level of resource use in first world countries can continue for one or two thousand years into the future. We must begin limiting resource use in the near term, not because it is truly believed we will over cook the planet, but because we must ration resources now to protect human life a thousand years from now and longer. Therefore population control is a necessity.

    This is not to say AGW scientist zealots are trying to fake us all out and have bought into lying to us to help their political buddies achieve their goals. Having AGW win the day is one step out of many in the right direction for the GSA. However, should actual results eventually prove AGW to be just a little noise in a global climate system dominated by a stochastic combination of natural forces including PDO, AMO, solar wind, eccentricity, cloud cover and dozens of other natural systems affecting climate at the margins, you will not see a reduction in attacks on the use of fossil fuels.

    • David Appell says:

      Joseph Dickinson says:
      No rational person believes that economical CO2 reduction can occur.

      “Fixing Climate Change May Add No Costs, Report Says,”
      Justin Gillis, New York Times, Sept 16 2014.
      http://www.nytimes.com/2014/09/16/science/earth/fixing-climate-change-may-add-no-costs-report-says.html

      PS: What is the cost of *not* addressing climate change?

      • Chuck Wiese says:

        “What is the cost of *not* addressing climate change?”

        It is nothing, Appell, considering the GHG radiation and temperature fingerprint is missing from the climatological record that validates the failed hypothesis and claims, and that contradicted founding principles in atmospheric science developed years ago with accurate radiation physics.

      • barry k says:

        Barry,

        There is also a ‘cost’ to addressing climate change via higher energy prices. The cost of higher energy prices is experienced immediately. Any ‘cost’ of not addressing climate change (forget about the fact someone would have to pull the number out of a hat…) would be experienced what decades out… 50yrs… 100yrs from now? Look no further than the debate over the Social Security Trust Fund, etc to see how that would go even if you could convince people of the validity of your numbers…

        Barry

        • Nate says:

          Changing how get we our energy, has not in the past caused poverty. The opposite in fact.

          The history of energy markets is one of constant change. Hydro, Nuclear (both supported by govt), Natural Gas, Petroleum, all had periods of rapid growth in market share over 2 or 3 decades.

          • David Appell says:

            Yes. In fact, US per capita CO2 emissions since 1973 have decreased by 1973, while real GDP per capita has increased by 107%.

            Data from EIA.

          • barry k says:

            Sigh…
            Poor examples by comparison.
            All of those sources you can plunk down anywhere and they provide a constant output. Calculating the ‘cost’ of wind/solar is much more complicated because it depends on where you put it (solar/wind resource varies drastically geographically) and the amount you need. Adding a little bit here/there is no big deal, but getting a lot of wind/solar energy onto the grid would be a nightmare due to the intermittent nature of it.

            Bottom line… I am all for green energy sources… as long as they are only subsidized the same as any other energy source. But, something like carbon cap-and-trade or the other schemes I’ve heard of to ‘penalize’ carbon-based energy due to potential damages down the road would in-fact (whether you want to admit it or not…) make energy prices go up (in fact, they do so on purpose to try to make green sources more competitive) and cause poverty to increase…

            Barry

          • Nate says:

            ‘make energy prices go up (in fact, they do so on purpose to try to make green sources more competitive) and cause poverty to increase…’

            How much of someone’s budget goes to an electric bill?

            http://eyeonhousing.org/2015/03/average-monthly-electrical-bill-by-state-2013/

            If a family electric bill went up even 10%, due to Green energy regs, that amounts to $12/mo.

            There are many things that contribute to being in poverty-cost of public transport, health care, college, etc.

            To single out the elctric bill, which is typically a tiny percentage, as CAUSING poverty, is hyperbolic.

          • barry k says:

            Nate,

            Replying here to your July 13 6:47a.m. post below because no Reply button there…

            I did not say higher energy prices ‘CAUSE’ poverty. I said ’cause poverty to increase’.

            Apparently, you make plenty of money… to someone near the poverty line, $12/mo is a big deal.

            Furthermore, energy prices don’t just affect people’s pocketbooks via utility bills… the cost of everything would go up.

            Furthermore, your comment about 10% increase leads me to believe you are one of these folks that actually believe a reasonable effort by a reasonable amount of people for a reasonable amount of time can solve climate change…

            $12/mo per household in the US amounts to about $22 billion per year. You think that’s going to make a dent in anything? Besides the fact that carbon-cap-and-trade would be just a tax and the revenue would get spent elsewhere…

            Barry

          • Nate says:

            Barry K,

            OK, point taken. Energy costs add to everything.

            Carbon tax. We already tax gasoline. We already have a sales tax. We already have a payroll tax. If we want to really help poor people, maybe we shouldn’t have those. But we do have them. We need the revenue.

            Probably need a higher gas tax to maintain crumbling hiways. But nobody likes taxes.

            But we TRY to make the tax structure help poor people, Im sure it can be improved. Same would be desirable for a carbon tax.

          • barry k says:

            Nate,

            Carbon tax would for sure be another regressive tax as it would affect poor disproportionately. My guess is it would have to be instituted along with another credit to the poor somewhere else. But in my opinion it’s also bad because it would put pressure on manufacturing because it would be even more attractive to manufacture somewhere else.

            Also, in my opinion all entitlement based taxes (i.e. helping the poor) should be done at the state and local level anyway because this would allow for more accountability and we could have 50 examples of how to do things and the better ideas could boil to the top. What we really need when it comes to taxes is less tax systems and much less complexity (assuming revenue neutral for a start…). It is a crying shame that someone needs to go to school for multiple years to understand the federal system… it’s too complex by orders of magnitude.

            Barry

        • David Appell says:

          “Fixing Climate Change May Add No Costs, Report Says,”
          Justin Gillis, New York Times, Sept 16 2014.
          http://www.nytimes.com/2014/09/16/science/earth/fixing-climate-change-may-add-no-costs-report-says.html

    • Gordon Robertson says:

      Joseph…”The AGW scientist zealots are pawns being used by the advocates of the Global State (GSA)”.

      Google ‘Club of Rome’.

    • Nate says:

      GSA is either Gerontological society of America or Geological Society of America. Which one is it?

  32. Chuck Wiese says:

    “Red Hot Planet”…..Really, Appell? How do you explain the fact that at Eugene Oregon, a century old low temperature record was broken in the last few days?

    Eugene Oregon this morning (3 July 2018) shivered through their coldest July morning “ever” (107 years) with 38 deg F.

    Downtown Eugene:

    https://wrcc.dri.edu/WRCCWrappers.py?sodxtrmts+352706+por+por+mint+none+mmin+5+01+F

    Eugene Airport:

    https://wrcc.dri.edu/WRCCWrappers.py?sodxtrmts+352709+por+por+mint+none+mmin+5+01+F

    -mark albright

    PS: Did anyone see the haynado yesterday near Albany Oregon?

    https://twitter.com/ScottSKOMO/status/1014192502738337792

    Mark Albright
    Dept of Atmospheric Sciences
    Box 351640
    University of Washington
    Seattle WA 98195-1640 USA

    • David Appell says:

      Of course records lows are sometimes being broke, Chuck. Nothing about AGW says they won’t.

      “Daily Record Highs are Dramatically Outpacing Daily Record Lows,”
      December 6th, 2017, Climate Central

      http://www.climatecentral.org/gallery/graphics/daily-record-highs-are-dramatically-outpacing-daily-record-lows

      • Gordon Robertson says:

        DA…”Of course records lows are sometimes being broke, Chuck. Nothing about AGW says they wont”.

        The overall implication is that the global average is rising. Makes no sense that records for cold weather would be included in that propaganda.

      • Chuck Wiese says:

        Appell, your dishonesty or incompetence is glaring. If the AGW claims were true, CO2 has increased from 280 ppmv to 410 ppmv today and the increased atmospheric opacity would make it impossible to break this century old all time record of low temperature if atmospheric CO2 was controlling on temperature. But as I have explained so many times to you, Appell, water vapor and the hydro cycle control nocturnal radiation, not CO2. You don’t get to have it both ways and you’re obviously not bright enough to comprehend that you’re engaging in doublespeak.

        • David Appell says:

          You never “explain” anything, you just wave your hands and expect people to believe you. I don’t believe you — I’ve seen you make too many basic physics errors. (Not to mention using laughable sources like CO2science.org or Steve Goddard.)

          Where are your data? Your numbers? Your calculations? Your publications?

          • Chuck Wiese says:

            I’ve shown them to you repeatedly, Appell. Just like here. You ignore any data presented and label the sources as “denier” sites, when in fact, they use the same data from the same source you do. Difference is, they don’t “adjust” it like NOAA and NASA GISS does to unjustifiably get the spurious warming trends they do.

            If anyone doesn’t comprehend physics, it is you. And that is just downright amazing, coming from a guy who claims a Phd in it.

            For example, when I told you the OLR has risen rather than dropped off, which is a critical test of what caused the warming ( AGW or natural ) of the last 30 years, you just ignore relevant facts and go off on a lark and say stupid things like I claimed CO2 is a blackbody, which I never said. You dissemble, distort and change the subject just like anyone who is parroting nonsense does. You NEVER answer a relevant question. You have a trail of playing duck and bob at every site you visit and everyone can see it, Appell.

          • David Appell says:

            WHERE is your data and evidence Chuck? You’ve ever shown me anything. All you do it a lot of hand waving, as if you’re constantly saying goodbye. Which in a way you are.

            No one will pay any attention to you as long as you read pages from CO2science.org, throw in a Steve Goddard link, and refuse to at least try to publish your ideas in a decent journal, where transparency and analysis will be required to pass peer review.

          • David Appell says:

            Chuck Wiese says:
            For example, when I told you the OLR has risen rather than dropped off,

            I don’t want to be *told* — I don’t believe a word you say — I want the DATA AND EVIDENCE. I want citations to the research.

            It’s easy to tell you never went past your claimed bachelor’s degree.

          • Chuck Wiese says:

            And I don’t want to be TOLD by an arrogant atmospheric science incompetent like you, Appell, that CO2 is causing “climate change”. This contradicts all the founding principles in atmospheric science, and only someone completely ignorant of science would call a textbook in it “ancient” like you just did, which further demonstrates your incompetence.

            Is relativity and gravity invalid because it was described and defined in physics over 100 years ago?

            You’re a colorful cloth of frivolity , Appell.

          • David Appell says:

            Again, where is your data and evidence?

    • David Appell says:

      CONUS records set in the last 365 days, total as of today:

      high max: 31477
      high min: 39355
      low max: 22028
      low min: 15136

      Data from the agency that must not be named:

      https://tinyurl.com/lqs6wcz

  33. Bindidon says:

    Essayons de calmer un peu les esprits échaudés!

    I’m wondering about how often some people still insist about the so-called UHI problem in CONUS.

    I separated for CONUS the GHCN V3 stations in two subsets
    – rural (station type ‘R’, nightlight level ‘A’);
    – nonrural (station type ‘S’ or ‘U’, nightlight level ‘B’ or ‘C’).

    And I generated time series out of GHCN unadjusted data for the two CONUS station subsets.

    Here are 2 charts plotting the time series in anomaly form wrt UAH’s baseline (1981-2010). Only the running means are plotted to avoid graphic overhead.

    One for 1893-2018:
    http://4gp.me/bbtc/1530747186962/001.jpg

    and one for 1979-2018:
    http://4gp.me/bbtc/1530747306275/001.jpg

    to which the plot of UAH6.0 TLT’s regional series ‘USA48’ was added.

    You see that while the 1893-2018 period shows a higher estimate for the nonrural stations than for the rural ones (0.08 C / decade vs. 0.03), the satellite era presents a different situation: nonrural and rural stations show the same estimate of 0.18 C / decade, exactly as much as does UAH.

    Interesting: the rural and the nonrural corner show an inverse behavior for 1997/98 and for 2015/16.

    *

    BTW: why does everybody talk about UHI but never about the inverse, namely RCI (Rural Cooling Island) ?

  34. Snape says:

    Chuck Wiese

    In your debate with David, if I remember correctly, you said the 30 year trend for Salem, OR. was flat and the 30 year trend for Eugene, OR. was actually negative.

    I just checked out NOAA’s “Climate at a glance” and found something different:

    Salem, OR. 1988 – 2017 trend:
    0.5 F. /decade

    Eugene, OR. 1988 – 2017 trend
    0.0 F. /decade

    Could you provide a link to your source?

    • Chuck Wiese says:

      Snape: Those records I referenced were plotted by Washington States Climatologist Mark Albright. The record I have runs from 1940-2013 before the last El Ninio of 2015-17. The trend then was flat. It always goes up with an El Ninio, but you wouldn’t get a trend going from flat to .5 degF per decade from the start with a two year El Ninio.

      There has been discussion about this that the record has been altered like so many in the network at urban sites and we know the thermometer sensors have been malfunctioning at some of these places.

      Mr. Albright called NOAA out on the fact that the Yakima, WA site was reading 2 degF higher than it should have been. When they checked the site, they indeed found a malfunctioning sensor and claimed to have replaced it. I don’t know what that means with respect to their actions. We are seeing that NOAA seems more than willing to play with and manipulate their climate records to show warming. To see how badly this has occurred, visit realclimatescience.com.

      • David Appell says:

        We are seeing that NOAA seems more than willing to play with and manipulate their climate records to show warming.

        Spoken like a true denier, with no evidence given whatsoever.

        PS: Adjustments reduce the long-term global warming trend. See Karl et al Science 2015 Fig 2.

        • Chuck Wiese says:

          Karl gave no rational justification for what he did with the sea surface records. They had already undergone quality control.

          No evidence? Bull! But like I said, anyone who doesn’t feed the AGW propaganda mill to you is a “denier”.

          You have no credibility, Appell. Anyone can see the evidence of the manipulated climate records by visiting realclimatescience.com. And yes, Tony Heller is more than qualified to examine the NOAA record and analyze it. He is a quality control engineer in engineering and has extensive experience doing exactly what he did with the NOAA and NASA GISS temperature records in the engineering profession.

      • David Appell says:

        Chuck Wiese says:
        Snape: Those records I referenced were plotted by Washington States Climatologist Mark Albright. The record I have runs from 1940-2013 before the last El Ninio of 2015-17.

        So where are these data? I’d like to examine them….

        Why did you leave the 2015-16 El Nino out?
        Did you leave out the earlier La Ninas?

    • David Appell says:

      Snape: station data for Salem, Oregon:

      https://data.giss.nasa.gov/cgi-bin/gistemp/stdata_show.cgi?id=425726940000&ds=5&dt=1

      There is a data gap from Aug2004-Dec2009, and one around 1978. (I guess the station keepers forgot to cheat those years.) That said, the 30-yr trend is +0.08 C/decade, and the trend since Jan1948 is +0.18 C/decade.

  35. TheFinalNail says:

    “If a portion of recent warming is natural, the less the human-caused global warming problem becomes.”
    ________________________

    Likewise, if a portion of the recent warming has been reduced due to natural (or even human-caused)influences, the more of a problem it becomes.

    TFN

  36. realclimate.org is the equivalent of CNN fake news.

  37. I am interested in the future not the past.

  38. Snape says:

    Chuck

    “The record I have runs from 1940-2013…”

    So why, in the debate, did you make claim “over the past 30 years…..” when this is 2018?

    Am I misremembering?

    • Chuck Wiese says:

      It ran for more than 30 years, Appell. From 1940-2013. And the last 5 years will not have changed the answer by much and any warming from El Ninio is natural.

      • David Appell says:

        Let’s see your data.

        • Chuck Wiese says:

          Here it is, Appell. And I’m sure that since the state climatologist who prepared this ( Mark Albright ) didn’t submit this to a “pal reviewed” journal, you will dismiss it, even though this sort of data compilation is Albright’s specialty. But that is you, Appell. You’re incompetent.

          https://atmos.washington.edu/marka/oregon/salem.1932_2013.png

        • Mike Flynn says:

          DA,

          Another pointless demand, David?

          Trying to divert attention away from your inability to even describe the GHE which seems to be the basis for your pseudoscientific blather, does not seem to work as well as in the past, does it?

          Go for it, David. Keep trying to convince people that stupidity, ignorance, and gullibility are preferable to the scientific method – involving reproducible physical experiments. Stick with Schmidt and his computer games – more your style. A completely pointless waste of time, effort, and money.

          Cheers.

  39. Mike Flynn says:

    David Appell,

    Have you managed to find a description of the reproducible GHE, and a disprovable GHE hypothesis to go along with it?

    Surely it has appeared in a prestigious peer reviewed journal, somewhere?

    Or maybe the idea of increasing the Earth’s temperature by increasing the amount of stupid GHGs between the Sun and the surface, is just too ridiculous even for a pedestrian mathematician like Gavin Schmidt or a dim fraud like Michael Mann to associate themselves with?

    Do you really believe that increasing the amount of CO2 between the Sun and a thermometer makes the thermometer hotter?

    If so, you raise the bar for pseudoscientific stupidity and ignorance (not to mention delusional gullibility), to new heights!

    Maybe you could have a tantrum – threaten to hold your breath until you turn blue. That’ll fix ’em!

    Carry on demanding, David.

    Cheers.

  40. Snape says:

    David

    Thanks for the data.

    I’m generally a fan of Cliff Mass, UW, but he likes to demonstrate a lack of NW warming by presenting daily maximums (little trend), and omitting daily minimums or averages (much larger trend). I wonder if Mark Albright uses the same tactic?

    • Chuck Wiese says:

      Snape: There is no warming in rural records with minimum temperatures as there is in urban sites. Are you trying to say that the UHI is really caused by AGW?

      There is a good reason to focus on maximum temperatures because of this fact.

      • David Appell says:

        I just posted a lot of rural data that shows Chuck is wrong:

        https://davidappell.blogspot.com/2018/07/oregons-rural-warming.html

        • Chuck Wiese says:

          You’re incompetent, Appell. This data is not separating anything, and you have not stated where it came from or whether you plotted it.

          • La Pangolina says:

            Chuck Wiese says:
            July 5, 2018 at 12:23 AM

            Youre incompetent, Appell. This data is not separating anything, and you have not stated where it came from or whether you plotted it.

            Chuck Wiese, I’m not a fan of Appell but here really you do not behave so very honest.

            In

            https://davidappell.blogspot.com/2018/07/oregons-rural-warming.html

            It is clearly visible that Appell’s source is

            https://data.giss.nasa.gov/gistemp/stdata/

            and that the pictures have been plotted using the NASA site itself:

            https://data.giss.nasa.gov/cgi-bin/gistemp/stdata_show.cgi?id=425726930000&ds=5&dt=1

            And let me tell you above all that a person writing

            …and the satellite records also support a static temperature trend for Oregon

            is all you want but competent.

            How can you derive local surface behavior out of satellite date measuring temperatures 5 km above surface?

            And… why did you not condtadict my friend’s data?

            http://www.drroyspencer.com/2018/07/summer-causes-climate-change-hysteria/#comment-310671

          • Gordon Robertson says:

            binny…”It is clearly visible that Appells source is…[NASA GISS].

            Binny, you git. GISS takes fudged data from NOAA and fudges it more. Appell would not post anything that was not fudged, he’s an eco-weenie who interviews only alarmist scientist.

            When NOAA proclaimed 2014 the warmest year in the historical record it used a 48% confidence level. GISS one-upped them by lowering the CL to 37%.

            Hey, why don’t we drop the CL right down to 5% then we can claims catastrophic warming?

          • Chuck Wiese says:

            La Pangolina:

            1) This data is plotted from missing and incomplete sets. Climatologist Mark Albright has actually shown a declining temperature trend by 1 degF in the last 20 years of record with a complete set of numbers for Eugene, OR.

            2) The satellite records are not the surface but the data I’m referencing is not a 5 Km either. It is the LT data at 2 Km. While this also does not match the surface numbers, the trends are most certainly connected by convective heat transfer, so the trends will be identical to the surface except for slight time lags.

            There is no need to “contradict” Roy Spencers data. Why would there be? Where is the conflict.

            There is no dishonesty. Appell is the one who is not being straight with data.

          • La Pangolina says:

            Chuck Wiese says:
            July 5, 2018 at 1:58 AM

            La Pangolina:

            1) This data is plotted from missing and incomplete sets. Climatologist Mark Albright has actually shown a declining temperature trend by 1 degF in the last 20 years of record with a complete set of numbers for Eugene, OR.

            Maybe Bindidon answers to that.

            2) The satellite records are not the surface but the data Im referencing is not a 5 Km either. It is the LT data at 2 Km.

            Here you prove again your lack of competence.

            UAH6.0’s average absolute data for the Globe actually is around 264K.

            Taking the lapse rate of 6.5 K/km, that places the average height at about 3.7 km i.e. at an atmospheric pressure of 640 hPa, but RATPAC-B radiosondes (agreed by Mr Christy, oh yes) operating at this pressure do not reflect the same temperature, which they rather show just above 500 hPa.

            Thus the 5 km are certainly correct.

          • Chuck Wiese says:

            “Here you prove again your lack of competence.

            UAH6.0s average absolute data for the Globe actually is around 264K.

            Taking the lapse rate of 6.5 K/km, that places the average height at about 3.7 km i.e. at an atmospheric pressure of 640 hPa, but RATPAC-B radiosondes (agreed by Mr Christy, oh yes) operating at this pressure do not reflect the same temperature, which they rather show just above 500 hPa.

            Thus the 5 km are certainly correct.”

            La Pangolina: You need to clarify what it is your saying. I don’t claim 5 Km temperatures are incorrect, but it is not correct to say that by “assuming” a lapse rate of 6.5 K/Km, you could be assured that whatever temperature you measure at 3.7 Km compared to radiosonde measurements is what the geopotential height of the 640 millibar pressure surface is. That is a constant pressure and as such will have varying geopotential height depending on the mass and temperature composition of the column being measured. If an airmass is warm, the geopotential of 640 millibars will located at a higher altitude than if it is colder. To assume that is always at 3.7 Km by a theoretical lapse rate is wrong, and if your claiming this is a hold true formula of some sort, then I would say that it is you that is demonstrating incompetence, at least in atmospheric science. Using your methodology, there is always going to be a difference in temperature at an absolute altitude you use with a theoretical lapse rate comparing this to 640 millibars of constant pressure that will vary continuously in geopotential height due to the unequal distribution of atmospheric mass and temperature around the earth.

          • David Appell says:

            Chuck Wiese says:
            1) This data is plotted from missing and incomplete sets.

            That’s just sad. But still laughable.

          • David Appell says:

            Chuck Wiese says:
            Youre incompetent, Appell. This data is not separating anything

            Idiot. There are temperature data from many stations, many of them rural.

            They directly disprove your dumb claim that Oregon has no warming except from the urban heat island. (Note: you have never provided any data yourself.)

        • Mike Flynn says:

          David,

          What is all this data supposed to be showing? I assume it is some veiled appeal to authority, about something unstated.

          There is no GHE, and no disprovable GHE hypothesis, as a result.

          Endlessly examining the past, in a vain attempt to foresee the future, is a pointless waste of time. Pseudoscientific nonsense, of the climatological variety.

          Prestigious journals charge fees to publish. That is their business – and a mighty profitable business it is. Time after time, they publish computer generated gibberish. How this rubbish passes peer review is questionable, but is mirrored by some of the bizarre climatological papers which have been published.

          CO2 as the control knob of the world’s thermostat? Yeah. Right.

          Some people are gullible enough to believe anything. Just like you.

          Cheers.

  41. Snape says:

    Chuck

    “It ran for more than 30 years, Appell. From 1940-2013. And the last 5 years will not have changed the answer by much and any warming from El Ninio is natural.”

    According to NOAA, January, 2013 – December, 2017 was the warmest 5 year period in Oregon history. Data goes back 119 years.

    I’m therefore dubious of your claim that the last 5 years wouldn’t have made much difference!

    • Gordon Robertson says:

      snape…”According to NOAA, January, 2013 December, 2017 was the warmest 5 year period in Oregon history. Data goes back 119 years”.

      NOAA are liars, a load of climate alarmist, eco-weenies. They have blatantly misrepresented science with their statistical propaganda. They have blatantly altered the historical record retroactively. They have lowered confidence levels to move cooler years into first place as records.

      NOAA no longer does science, it throws out real data and manufactures pseudo-data in climate models.

      Since the Feb 2016 EN there has been no further warming, we have experienced a gradual cooling trend.

      Oregon is just down the road from us here in British Columbia, Canada and there has been nothing remarkable going on. The only thing Oregon can claim is being the home of David Appell. Oregonians should be wearing bags over their heads based on that.

      • David Appell says:

        Gordon has no proof whatsoever that NO.AA are “liars,” but Gordon is the kind of man who casts aspersions without evidence. He doesn’t think twice about it, because he’s the kind of man who disparages people without thinking twice about it. Gordon is a bald-faced liar, and that doesn’t bother him in the least. Just like DTrump.

        • Gordon Robertson says:

          DA…”Gordon has no proof whatsoever that NO.AA are liars, but Gordon is the kind of man who casts aspersions without evidence”.

          There is no one so blind as he who won’t see. I supplied evidence from NOAA’s own site that they fudge data by slashing real station data and replacing it with synthesized data from climate models.

          • David Appell says:

            This is also a lie — You’ve never provided any evidence whatsoever.

            And you don’t even care who knows you’re a liar. Perhaps because you’re anonymous here.

  42. Chuck Wiese says:

    Snape:Be as dubious as you want. The warming of the last 3 of the 5 years were caused by El Ninio, an entirely natural phenomena, and the satellite records DO NOT agree with the surface records and support the conclusion that this El Ninio was the warmest in the record. 2016 was nearly a statistical tie with 1998 and 2017 was the 3rd warmest in that record, and the satellite records also support a static temperature trend for Oregon, at least up until the El Ninio of 2015 and 2016.

    All of this talk about comparing one warm year to the next still misses the entire point. How is this modern maximum any different than any other in the glacial or geological record? And you need to face up to the fact that the GHG signature is missing from the upper tropospheric temperature data as well as the OLR signature of declining values vs. what is observed. Without this, it is pointless to be concerned about CO2. The proof required that it is the culprit for temperature changes is NOT PRESENT IN THE RECORD AFTER 30 YEARS OF THIS NONSENSE. Something Appell and all others promoting this refuse to accept, even though this is fact.

    • E says:

      Chuck Wiese

      ” How is this modern maximum any different than any other in the glacial or geological record? ”

      Because this time the inhabitants built a global civilization on the assumption that global temperatures would stay below 14.0C and are now experiencing the consequences of self-inflicted warming.

      • Mike Flynn says:

        E,

        Where can this wondrous global civilisation be found?

        Certainly not in the tropics. Too hot. Certainly not where it is below zero n winter. Too cold.

        Even the cradle of civilisation (now Iraq) has temperatures between -30 C and 50 C. I suppose you think that the average, 10 C, is just about perfect! Stupid averages – only a witless climatologist would use such a thing in these circumstances!

        Global civilisation? You are making stuff up. No such thing. No GHE either.

        So sad, too bad.

        Cheers.

          • Mike Flynn says:

            E,

            Another completely irrelevant and pointless link, eh?

            It starts off –

            “Growing evidence demonstrates that climatic conditions can have a profound impact on the functioning of modern human societies1,2, but effects on economic activity appear inconsistent.”

            Gee. Droughts and floods might affect food production, I suppose.

            This comes as news to these dummies? Obviously affected by the same pseudoscientific delusions that afflict GHE believers!

            Just more evidence that Nature is quite capable of publishing nonsense for profit. Oh well, your appeal to authority reflects your ignorance, stupidity and gullibility, if nothing else.

            Cheers.

      • Gordon Robertson says:

        e…”Because this time the inhabitants built a global civilization on the assumption that global temperatures would stay below 14.0C and are now experiencing the consequences of self-inflicted warming”.

        Where are you getting this propaganda? And where are the consequences? Little or no average warming for nearly 20 years.

    • Mark B says:

      Where would one find the satellite record for Oregon?

      • Chuck Wiese says:

        Mark B: Roy Spencer and John Christy do not publish their monthly temperature composite in the specific sector that was requested of them by a Dr. Jared Black, who asked about what Oregon’s temperature trends were over the length of the satellite record.

        But either Roy or Jon supplied this to Mr. Black when he inquired about it doing his own independent climate research for Oregon.

        The result for the 2 Km LT temperature was the same as what Albright’s surface temperature trends were in the rural stations that included Salem and Eugene. There was no statistically significant warming and the trend line was flat for the entire period over the entire State of Oregon including southern Washington state.

        • David Appell says:

          The funniest thing is that Chuck thinks Oregon warming has something to do with global warming.

          Chuck, what is the ratio of the surface area of Oregon to the surface area of the globe?

    • David Appell says:

      Chuck Wiese says:
      Snape:Be as dubious as you want. The warming of the last 3 of the 5 years were caused by El Ninio, an entirely natural phenomena

      Why were average surface temperatures for the 2015-2016 El Nino 0.4 C higher than for the 1997-98 El Nino, and why were surface temperatures for the latter 0.4 C warmer than for the 1982-83 El Nino?

    • Nate says:

      ‘the OLR signature of declining values vs. what is observed. ‘

      False. We’ve been over this.

      ‘GHG signature is missing from the upper tropospheric temperature data ‘

      Nope not in RSS and RATPAC

      ‘the satellite records DO NOT agree with the surface records’

      Nope not RSS and RATPAC (also troposphere).

      Chuck, what is the reason to favor UAH over RSS and RATPAC, other than one fits your beliefs?

  43. This year cooler and if it continues moving forward AGW theory will be obsolete.

  44. July 5, 2018 at 12:36 AM
    Snape:Be as dubious as you want. The warming of the last 3 of the 5 years were caused by El Ninio, an entirely natural phenomena, and the satellite rec

    What Chuck Wiese said which is 100% correct. Look at the Mei index also.

    As I said watch the overall SURFACE oceanic temperatures as they trend down so does the global temperature.

  45. mandrewa says:

    You wouldn’t use nuclear as backup for solar or wind power.

    If you have a nuclear power plant you run it all the time, it’s high quality energy that doesn’t emit CO2 and it’s usually cheaper than solar or wind. Why in the world would you want to turn off a cheaper source of energy, because that is what a backup does, to replace it with a more expensive source?

    And if by some misfortune due to some regulatory insanity your nuclear power plant is more expensive than solar or wind, then you still run it all the time, because you have to earn back some portion of the money spent on it somehow and you can’t afford to turn it off.

    There are only two backups for solar and wind. Coal power plants and natural gas power plants. You have to have them because people don’t want intermittent power. Every solar or wind power facility has fossil fuel plant behind it that is turned off when it is running and turned on when it is not.

    Somehow this basic point has escaped solar and wind advocates. Not only are the true costs of solar and wind almost always radically understated, but solar and wind mean major CO2 emissions!

    It’s true. It’s not as bad as solely a coal power plant, but kilowatt per kilowatt if the solar or wind plant isn’t producing their maximum energy then the compensating energy has to be coming from a coal or natural gas power plant.

    • David Appell says:

      There are only two backups for solar and wind. Coal power plants and natural gas power plants.

      Smart grids
      nuclear
      hydro
      batteries

      • mandrewa says:

        In many locations hydroelectric is itself an intermittent power source that has to be backed up by a fossil fuel plant. For example California normally a wet season and a dry season and the usage of their hydroelectric power plants is planned so that if there is the normal amount of precipitation the hydroelectric plant can run year around.

        But if there should be a drought and as history and the geologic evidence would suggest droughts aren’t exactly unusual for California, then the hydroelectric plants are shut down and the backup, if there is a backup, is always a fossil fuel plant.

        I’ve already explained why nuclear plants are run constantly. That means that can’t be used as backups.

        Batteries are extremely expensive. That’s the problem. Unless or until they become cheap, then they aren’t part of the solution. The only sense in which cheap batteries are real is that we are hoping that if we continue to do the research we will someday find a way.

        The only relatively practical power storage technology we have is pumped water. That is pumping water up a hill into a reservoir when the sun is shining and/or the wind is blowing and then releasing that water to generate electricity when the sun is not shining and the wind is not blowing. These systems are expensive and you only get back roughly one-third of the energy you put in, but that still puts the idea massively ahead of any other known power storage technology including especially batteries.

        “Smart grid” means a number of things most of which is not relevant in this context. The part that is relevant is the transmission of power long distances from a region where excess power is being produced to a region where it is needed. Practically speaking that excess power right now is almost always coming from fossil fuel power plants, but we can imagine scenarios where it might be coming from wind power and in some special situations solar power. I believe the only way solar can back up solar is if one region has cloud cover where an adjacent doesn’t. Similar idea for wind. I don’t deny that it helps. But there will always be situations, and even very common situations, where this doesn’t do any good at all, and the thing about fossil fuel backups is that unless a population is quite tolerant of power outages, then the fossil fuel power plants have to be built for the normal worst situation. And in the normal worst situation, and by normal I mean it happens a lot, long-distance power transmission isn’t going to help.

  46. jimc says:

    Goal post moving:

    “Future global warming may eventually be twice as warm as projected by climate models and sea levels may rise six metres or more even if the world meets the 2C target, according to an international team of researchers from 17 countries.”

    “Global warming may be twice what climate models predict”
    https://phys.org/news/2018-07-global-climate.html

  47. Snape says:

    From a study co-authored by Mark Albright:

    “The residual time series of Cascade snowpack after Pacific variability is removed displays a relatively steady loss rate of 2.0% per decade, yielding a loss of 16% from 1930-2007. This loss is very nearly statistically significant, and includes the possible impacts of anthropogenic global warming.”

    http://www.oregonlive.com/environment/index.ssf/2010/02/scientists_still_sparring_over.html

    • Chuck Wiese says:

      Snape: what you don’t know is that it was expected analysis like this, using dubious cherry picking of data start and stop times that led to considerable consternation between Albright and his supervisor, Phil Mote, who was then head of the Climate Impacts Group at the University of Washington.

      Albright disagreed with much of the methods Mote and associates were using and this disagreement led to Albright leaving his position as Washington State’s Climatologist.

      There is a lot to be said about honesty and integrity when one feels strongly enough about it to leave on principle.

      And it has been my experience with Mr. Mote that he is not being honest about climatic trends in Oregon since he left CIG and became employed at OCCRI. He insists Oregon heat waves are worsening and reported this claim which was used in a report issued by the Oregon Health Authority a few years back. That seemed suspicious to me so when I checked the records, there was no increase in Oregon heat waves in Multnomah County where the report was issued to cover, which most would define by the number of days official records exceeded 90, 95 or 100 degF. When I confronted Mote with this, he then claimed he believed the statement to be true because of higher minimum temperatures. But the report is based upon blaming GHG’s for the warming, never differentiated between maximums and minimums (but increasing heat implies higher temperatures in the maximum) and the UHI has nothing to do with this which has caused nocturnal warming at urban sites. And yet Mote refused to correct the record with the Health Authority.

      This sort of dishonesty says a lot about those that continue to misuse temperature data for the promotion of something that has no concrete science underpinning. I see this rampant abuse of data in a lot of todays literature on “climate change” that tortures the real meaning of climate metrics used and makes absolutely incorrect and outrageous claims to support this nonsense.

      Albright is true to science. And I’ve found he is trustworthy in using climatology in its proper context.

      • Chuck Wiese says:

        And note the difference in this paper vs. papers and reports from OCCRI is that OCCRI concludes any snowpack loss IS the result of GHG’s. This report does not conclude this, does not show statistical significance to the loss, but rather states it is a possible consequence.

        But we can also look at declining glaciers that started in the record long before atmospheric CO2 was rising beyond pre-industrial concentrations and 75% of the reductions there had already occurred by the 1930’s.

        Also, Cliff Mass believes strongly in his modeling capability, and on this I am miles apart with him, but like Albright, they won’t lie about what something means. This paper, remaining true to science does NOT affirmatively tie the snowpack decline to AGW.

      • Gordon Robertson says:

        Chuck….”Albright disagreed with much of the methods Mote and associates were using and this disagreement led to Albright leaving his position as Washington States Climatologist.

        There is a lot to be said about honesty and integrity when

        one feels strongly enough about it to leave on principle”.

        *********

        U of W seems to be a hot bed of alarmists. Stieg is from there, Mann’s buddy who did the study with him in which they concluded Antarctica has warmed since 1950. Turned out they interpolated warming from the north end of Peninsula to the entire continent. One station cited was under 4 feet of snow.

  48. gbaikie says:

    “Finally, the Public Citizen memo claims that todays technology would already allow 80% to 100% of our energy to come from renewable sources. This is patently false. Solar and wind are relatively diffuse (and thus expensive) sources of energy which are intermittent, requiring fossil fuel (or nuclear) backup. It would be exceedingly expensive to get even 50% of our energy from such sources.”

    Renewable sources includes creating CO2, one could include natural gas as renewable source, but it’s included a fossil fuel, all you to do is change the definition of renewable source, and bingo, it’s possible.
    If one wants emission-free:
    “Nuclear power in the United States is provided by 99 commercial reactors with a net capacity of 100,350 megawatts (MW), 65 pressurized water reactors and 34 boiling water reactors. In 2016 they produced a total of 805.3 terawatt-hours of electricity, which accounted for 19.7% of the nation’s total electric energy generation. In 2016, nuclear energy comprised nearly 60 percent of U.S. emission-free generation.” -wiki

    So increase Nuclear and hydro power use. I think having 25% of energy from nuclear energy, would be a good idea, though having be 75% like France, probably not needed or desirable.
    One could call nuclear and methane gas as a renewable source- some nuclear power could be “created or grown”, and some methane is produced by biological process.
    Natural gas currently is making 31.7% of US power:
    https://www.eia.gov/tools/faqs/faq.php?id=427&t=3
    and it is cheap:
    https://www.eia.gov/dnav/ng/hist/rngwhhdd.htm
    And it growing is our oceans, Methane hydrate deposits and have vast potential supply if one mine Methane hydrate in the ocean, which only done on very small scale at the present.
    So if wants more emission-free or renewable energy that you define as nuclear and natural gas, that could be done by a political process, which does not require robbing from the poor, mere need politicians who are slightly educated or not completely delusional/crazy [as most are].

    • Gordon Robertson says:

      gbaikie…good info, g.

    • gbaikie says:

      Methane Hydrates: A Business opportunity for NOCs in the Middle East and large IOCs?

      [NOC- national Oil Company. IOC international oil company. And
      International vs. National Oil Companies—What’s the difference?
      https://www.spe.org/en/print-article/?art=717 ]

      “According to the experts of this sector…”
      “Methane Hydrates Reserves have been estimated to be about 21,000 trillion cubic meters, about 100 times the total natural gas reserves currently worldwide. They content that even if 10% of these quantities is technically recoverable it can be used for many centuries. ”
      https://energyroutes.eu/2016/04/06/methane-hydrates-a-business-opportunity-for-nocs-in-the-middle-east-and-large-iocs/

      And:
      According to Oil and Gas financial journal in the article “Challenges of the Methane Hydrates” by Darren Spalding and Laura Fox, Bracewell & Giuliani LLP, London on May 7, 2014 the cost of developing any new energy is high and methane hydrates are no different. The current cost of gas produced from methane hydrates is estimated to be US$30 to US$50 per million British thermal units (MMBTUs). The International Energy Agency estimates that once efficient practices and processes are developed, natural gas produced from methane hydrates will cost between US$4.70 and US$8.60 per MMBTU.”

      So competitive in places like India, South America, Europe, Japan, Korea- and if one can work with China.
      US in north east is about $1 cheaper than those countries above] and elsewhere in US much cheaper [Ie due to fracking and increase in US oil production].

      I wonder island nations could mine locally methane hydrates or benefit, if in general, there more ocean produced methane. So say Hawaii has higher electrical costs and assume islands in general have high costs of electrical power.

      Search: natural gas service pacific islands:
      “Hawaii has no proved natural gas reserves and produces no natural gas. Hawaii is one of only two states producing synthetic natural gas, which is called syngas. Syngas is produced in an Oahu processing plant using naphtha feedstock from a local refinery. The syngas is delivered by pipeline to parts of Oahu. Customers in rural areas of Oahu and on other islands, who are not connected to utility Hawaii Gas’s distribution system, are supplied with propane. As part of the state’s shift to renewables, Hawaii is encouraging the use of local biomass as a feedstock for the production of renewables-based synthetic natural gas”
      https://www.eia.gov/state/analysis.php?sid=HI

      “For over 50 years, Origin, one of Australia’s leading energy companies, has been supplying LPG to domestic, commercial and industrial customers in countries throughout the Pacific, including Papua New Guinea, The Solomon Islands, Fiji, Vanuatu, Tonga, Samoa, America Samoa and the Cook Islands.

      Origin’s aim is to maximise the usage of LPG as a preferred energy source in the Pacific. LPG is an environmentally friendly, clean, efficient and reliable product.

      In the Pacific, the majority of energy consumed comes from traditional fuels such as biomass and oil. In Fiji and Vanuatu, LPG accounts for as little as two per cent of total consumption.”

      LPG isn’t using natural gas pipeline like system [like syngas does] so if have ocean methane minning, one need such infrastructure to use the natural gas.
      India:
      “India had 38 trillion cubic feet (Tcf) of proven natural gas reserves as of January 2007.The total gas production in India was about 31,400 mcm in 2002-03 compared with 2,358 mcm in 1980-81.
      http://www.eai.in/ref/fe/nag/nag.html
      Compare US:
      “In 2012, the United States produced 25.3 trillion cubic feet of marketed natural gas, with an average wellhead value of $2.66 per thousand cubic feet, for a total wellhead value of $67.3 billion.In 2013, the country produced 30.0 trillion cubic feet (TCF) of marketed gas.”

      trillion cubit feet equal how much million cubic meter:
      35.2 million feet equals 1 million cubic meter. 31,400 mcm equals about: 1.1 trillion cubic feet. Or about 1/20th of US, and has 4 times as many people, and seems to indicate India has a significant natural gas network

  49. Snape says:

    Chuck

    Please get your facts straight. The figures from the study I quoted were considered a LOWBALL. The authors were Stoelinga, Albright and Mass, and did not include Mote.

    Mote, in fact, was the Washington State climatologist, not Albright.

    ******

    “The arguments and whos behind them:

    50 percent decrease since 1950: Widely used as recently as this year, now dismissed by scientists on all sides as a major overstatement.

    35 percent decrease since the mid-1940s: Offered by Washington State Climatologist and UW climate scientist Philip Mote.

    30 percent decrease since 1945: Professor Dennis Hartmann, chair of the Atmospheric Sciences Department, after a meeting with the different sides and consultations with other scientists.

    10 to 15 percent decrease since the mid-1940s: Professor Cliff Mass, in association with meteorologist Mark Albright”

    https://www.seattletimes.com/seattle-news/how-one-number-touched-off-big-climate-change-fight-at-uw/

    • Chuck Wiese says:

      Snape: You are re-affirming what I just said. The disagreements about how much snowpack had declined in the records were very large, in fact, when just looking a SWE records over the period, Cliff Mass had reported the snowpack had no trend. It was flat over a century of record.

      Mote expected Albright to sign off on the ridiculous 50% decline which was based upon cherry picking part of a record. Albright refused to do this because of his sense of wanting to be honest and this sort of contention led to his departure. This is what I was getting at. And Mote also wanted those working with him to sign off on affirmative explanations that such declines and other climate metrics were absolutely being caused by AGW.

      And my understanding is that Albright was acting as Washington States Climatologist until his departure when Mote then took over his responsibilities. Mote was busy with his failed modeling efforts which in 1998 predicted that regional temperatures in Oregon in 20 years would be +3.1 degF above the 30 year mean. In the last 20 years since this climate model prediction, Eugene Oregon’s temperature has declined a full 1 degF. Mote’s modeling can’t even get the sign of the temperature change correct!

      Honestly, are you telling me you would believe this nonsense with such a record of failure?

  50. Snape says:

    Chuck

    BTW, Not only was Mark Albright NOT the State Meteorologist, it is also not true that he stepped down from the position he held.

    Infact he was, and still is, employed as a research meteorologist at UW:

    https://atmos.washington.edu/people/staff.shtml

    • Chuck Wiese says:

      Are you saying Phil Mote was Washington State’s Climatologist and labeled so by the State of Washington? If so, why wasn’t Mote executing those responsibilities? Mark Albright was.

      You are correct that after his departure from employment by Phil Mote, he was assigned research duties with Cliff Mass.

      • David Appell says:

        When you can’t disprove the science, attack the scientists personally.

        It’s a well-worn path, from tobacco to lead paint to ozone to AGW.

        And it has never once succeeded.

  51. Gordon Robertson says:

    chuck w…”…as I have explained so many times to you, Appell, water vapor and the hydro cycle control nocturnal radiation, not CO2″.

    I can see a scenario where the surface cools significantly with no solar radiation at night. The question arises as to whether the surface gets cooler than the atmosphere. If not, the 2nd law applies and heat cannot be transferred from a cooler atmosphere to a warmer surface.

    The AGW theory proposes that the surface is heating GHGs in the atmosphere. If the surface cools at night does that not means the GHGs, including WV, must cool as well?

    At best, what I am seeing is thermal equilibrium where heat cannot be transferred. Having GHGs warmer than the surface seems odd, especially with increasing altitude.

  52. Bindidon says:

    Mark B says:
    July 5, 2018 at 6:01 AM

    “Where would one find the satellite record for Oregon?”

    *

    Mark B, you raised an interesting point here.

    The zonal and regional temperature record provided since years by Roy Spencer for four different atmospheric layers

    https://tinyurl.com/y997zl7w

    (here: lower troposphere) is not the only visible aspect of what Mr Spencer makes available to the public.

    There is (again: here for the LT) also a 2.5 degree grid (72 latitudes, 144 longitudes) in the directory:

    https://www.nsstc.uah.edu/data/msu/v6.0/tlt/

    consisting of a sequence of yearly files (tltmonamg.1978_6.0 till tltmonamg.2018_6.0) out of which you can obtain finer information by averaging small grid cell subsets, e.g. Nino3+4 or… the Oregon state.

    I generated also UAH time series out of GHCN V3 data, allowing to ‘see’ how UAH behaves above GHCN stations.

    Here is an example of two plots: UAH Oregon zone (42N-46N — 124W-117W) vs. UAH above all GHCN Oregon stations

    http://4gp.me/bbtc/1530836380184/001.jpg

    The difference between the two plots in the chart is nearly imperceptible.

    An interesting detail: the trend of these two time series for 1979-2018 is 0.19 ± 0.05 °C / decade, just a bit more than in the entire CONUS.

    • Chuck Wiese says:

      Blindidon: Could you please provide a link to the plots of the UAH data LT for Oregon as well as the USHCNv3 plot that you worked up?

      Thanks

      • Bindidon says:

        Chuck Wiese

        Maybe you misunderstood what I did?

        1. The plots you see in the graph above where generated by Excel out of a time series generated by my software out of a part the entire UAH6.0 grid data, i.e. the files

        https://www.nsstc.uah.edu/data/msu/v6.0/tlt/tltmonamg.1978_6.0
        till
        https://www.nsstc.uah.edu/data/msu/v6.0/tlt/tltpenamg.2018_6.0

        The software using these files was validated using

        https://tinyurl.com/y997zl7w

        2. I did not use USHCRN but GHCN V3 (they are two different datasets).

        The GHCN V3 time series has been generated by my software as well, and validated by Excel and GIDD data.

        *

        Thus what I can do if you are interested is to send you the generated time series by uploading them in pdf files.

        • Bindidon says:

          The GHCN V3 unadjusted data is here:

          https://tinyurl.com/y9uyykgz

        • Chuck Wiese says:

          Bindidon: I think you misunderstood me. What I want from you is a plotted graphing of the actual temperatures you used from UAH for the Oregon grid as well as from GHCNv3 in a time series that you retrieved along with the trend lines for both.

          I’m not interested in your claim that the difference between the two sets are nearly indistinguishable.

          • La Pangolina says:

            Chuck Wiese says:
            July 6, 2018 at 12:11 PM

            J.-P. isn’t at home.

            I suppose you mean this:
            http://4gp.me/bbtc/1530916873786/001.jpg

            Linear estimates for GHCN V3 Oregon:
            – 1893-2018: 0.03 C / decade
            – 1979-2018: 0.36 C / decade

            Linear estimate for UAH6.0’s grid cells above GHCN Oregon stations:
            – 1979-2018: 0.19 C / decade

            GHCN V3 unadjusted is raw data and therefore shows higher estimates during the satellite era than do e.g. GISS time series.

            Most unexperienced people think or pretend that the process of homogenisation produces higher trends. The contrary is the case.

            Your Eugene example shows that pretty good.

          • David Appell says:

            And Chuck, let’s see a plot from you from Oregon “rural” temperature stations….

          • David Appell says:

            Still nothing from CW.

    • Gordon Robertson says:

      binny…”I generated also UAH time series out of GHCN V3 data, allowing to see how UAH behaves above GHCN stations”.

      Which stations, those among the 4500 they deleted from the 6000 global stations, and synthesized in a climate model, or one of the 1500 they actually used.

      I started calling you an idiot because you don’t understand the difference. Nor do you seem to care.

      • Chuck Wiese says:

        Hi Gordon: I responded to your comment about radiation above Bindidons but I don’t see it posted. I’ll re-address this if it doesn’t appear soon. I don’t know what happened.

        • Chuck Wiese says:

          Hi Gordon: I tried to re-post my response to you about the radiation problem and it keeps going to a trash bin. Probably because it is too long.

          If your not a member of global warming realists, you are welcome to join and I will share this with you there.

      • Bindidon says:

        Why do you write so dumb things all the time, Robertson?

        And why do you call all people idiots when you are not able to understand let alone to grasp what they do?

    • Mark B says:

      If anyone is still following, and if I’ve done this correctly, here’s a plot of the UAH 6.0 annual 2.5 degree grid over Oregon:

      http://tinypic.com/r/w7ok77/9

      I get 0.11 C/decade for this vs about 0.13 C/decade global.

  53. The trends for 2018 looking good ,let’s see if they not only continue but intensify as we forward.

  54. Snape says:

    Chuck

    According to this link, Philip Mote became the Washington State climatologist in 2003. Was Mark Albright his assistant and performing a lot of those duties? I don’t know about that so you could be right.

    https://www.fws.gov/pacific/climatechange/pdf/boise/Mote/Bio/Philip%20Mote.pdf

    • Gordon Robertson says:

      snape…both you and Chuck are right. Mote was the state climatologist and Mark Albright was the Associate State Climatologist.

      Albright was fired for exposing warming myths.

      https://www.heartland.org/news-opinion/news/associate-state-climatologist-fired-for-exposing-warming-myths?source=policybot

      I thought I remembered that corruption. Other climatologists were fired for similar matters, like Tenk Hennekes in the Netherlands and Pat Michaels as the Virginia State CLimaatologist.

      Climate alarmists are corrupt, through and through.

      • Myki says:

        As corrupt as Pruitt?

        • Myki says:

          Patrick Michaels! LOL!
          Patrick J. Michaels once said:
          “I’ll take even money that the 10 years ending on December 31, 2007, will show a statistically significant global cooling trend in temperatures measured by satellite.”

          Then, subsequently, in a Washington Times op-ed in January 2013, Michaels stated “it’s a pretty good bet that we are going to go nearly a quarter of a century without warming.” [The Washington Times, 1/17/13]

          He out-does Salvatore Del Prete !!

  55. Transport by Zeppelin says:

    ” We are currently half way to doubling.”

    Not really. We’ve added about 130ppm. What ever effect that has had we would now have to add twice that amount to get an equal reaction, due to the diminishing effect increasing CO2 has.

    And we also have to consider the LARGE increase in CH4, & chloroflurocarbons.

    Wake me up when something actually bad happens

    • Gordon Robertson says:

      Transport…”Weve added about 130ppm”.

      That’s based on cherry picked samples from ice cores in Antarctica. No one knows what the CO2 concentration was pre Industrial Era.

      The Little Ice Age was at a peak back then and one would expect the atmospheric CO2 to be lower in a cold spell.

      • David Appell says:

        Gordon Robertson says:
        No one knows what the CO2 concentration was pre Industrial Era.

        Baloney. There are plenty of proxies. Go learn.

        • Gordon Robertson says:

          DA…”There are plenty of proxies.”

          You mean like Mann’s 1000 years of proxies that were showing warming in the late 20th century while real temps were rising?

    • Mike Flynn says:

      “Double double, toil and trouble . . . ” –

      Wm. Shakespeare.

  56. Carbon500 says:

    If you passionately believe in dangerous man-made global warming due to CO2 emissions, here are a few tried and tested words and turns of phrase that will help you to overcome those nasty, evil, twisted skeptics.
    Firstly, do not, ever, call it dangerous man-made global warming. It’s such a mouthful and far too hard to say. Climate change is much better.
    Now learn the following:
    97% of scientists
    strawman
    since records began
    cherry pick
    peer review
    highest ever
    record high
    liar
    likely
    the science
    ocean acidification
    extreme
    debunk
    Other suggestions are welcome.

    • Carbon500 says:

      Of course, there’s also…….DENIER!

    • La Pangolina says:

      Hi Carbon500

      feel free to setup the complementary list, starting with
      alarmist
      uberalarmist
      etc etc

      • gbaikie says:

        Those certain we are going to leave this icebox climate, very soon, maybe, tomorrow or the next day.

        Those who think an average global temperature of 16 C is coming soon.

        Those who think 15 C is very warm.

        Those that think Canada which has average temperature of -4 C, will get average temperature of 10 C, soon.

        Those that think a thousand years is soon.

    • David Appell says:

      Carbon500 says:
      If you passionately believe in dangerous man-made global warming due to CO2 emissions….

      What do you mean by “dangerous?”

  57. Carbon500 says:

    More seriously, it’s good to see analyses of data from the real world such the one posted by Dr. Spencer above. It makes for fascinating reading. Given the irresponsible nonsense in so many media proclamations, there’s a real need for some hard facts. Many thanks.

    • Nate says:

      Carbon.

      Lets face it. Roy is throwing you guys some highly select cuts of red meat to confirm your biases, and make you feel warm and fuzzy about your beliefs.

      Just look at Fig 1 (one selected state – one selected month) and Fig 6 (a denier favorite reconstruction with no modern warming!).

      C’mon.

      • Carbon500 says:

        Nate: In my view, these are exactly the sort of studies which are greatly needed. Real world national and regional data, worldwide, going back a century or more, and coming from professional meteorologists, not computer modellers and their like. Then let’s see how much climates around the world have actually changed.
        Have you read the rest of the article? Doesn’t it make you think, at least a little, that the doom-mongers who measure fractional temperature changes (to a hundredth of a degree!) and are claiming climatic Armageddon due to mankind might just have it wrong?

      • Nate says:

        ‘Real world national and regional data, worldwide, going back a century or more, and coming from professional meteorologists,’

        Real world is fine. But cherry-picked real world is not fine.

        Data selected and misrepresented in order to mislead not ok.

        For example Fig 6, shows a red stripe indicating where ‘period allegedly warmed by humans’ is supposed to be, but warming is conspicuously absent. The reconstruction cannot resolve that period of rapid warmth, which we know from the thermometer record is ~ 1 C.

        This is intentionally misleading. If your ok with being misled, well..

      • Gordon Robertson says:

        nate…”Roy is throwing you guys some highly select cuts of red meat to confirm your biases….”

        Roy is telling the truth. It is you alarmists who are so myopic and thick-headed, who cannot see the truth when it hits you.

        • David says:

          Rory cherry picked this particular situation, while ignoring the fast warming taking place across the continental US?

          Is it at all surprising that you UAHs temperature trend is the lowest of everyones?

          • Gordon Robertson says:

            david…”Rory cherry picked this particular situation, while ignoring the fast warming taking place across the continental US?”

            Only an idiot thinks it’s warming in the continental US. Not a shred of proof and no one can go on the NOAA/GISS data since it is fudged. Of course, an idiot would not think so.

        • Nate says:

          Gordon,

          Sounds like you are quite happy to be misled, as long as its leading you where you already want to go.

  58. Snape says:

    Bindidon

    Of those who regularly comment on this blog, my two favorites are you and LP. I can’t decide who I like better. 😏
    Thanks to both for your unique, fact based input.

    • Bindidon says:

      Thanks Snape!

      La Pangolina (Rose in real life) is my lady, we both love to look at data, she is good in using Excel, and I ‘do my very best’ using Linux, writing little pieces of software etc.

      That this blog’s dumbest commenter constantly attacks us with his lies leaves us completely cold. Now and then, Rose is a little harder with him, he deserves that, too.

      *

      There are however people having much a closer look at climate data than I could ever do, e.g. Nick Stokes, or Clive Best who recently created a fantastic evaluation of NOAA’s 30 GB GHCN daily record using icosahedrons.

      Have a look at it! I’m sure you will enjoy.

      http://clivebest.com/blog/?p=7820

      J.-P.

      • Gordon Robertson says:

        binny….”we both love to look at data, she is good in using Excel, and I do my very best using Linux….”

        I am not convinced both of you exist. I think you are such an ego-tripper that when you left here in a snit you needed to invent an alter-ego to return while saving face.

        AFAIC, La P is binny. It’s too cute that you leave one day and a few days later La P shows up complete with the same attitude as you and with a memory of past events.

        What you don’t get is that your amateur number crunching in Excel, by which you produce a close fit between UAH data and that of Had-crut and NOAA, is utter nonsense.

  59. Myki says:

    30-day average SOI is now -8 and dropping sharply.
    The last severe El Nino event in 2015-2016 saw values as low as -20.

    • Mean while the overall oceanic surface temperatures are trending lower which is what really matters when it comes to the climate.

    • Gordon Robertson says:

      myki…”30-day average SOI is now -8 and dropping sharply.
      The last severe El Nino event in 2015-2016 saw values as low as -20.”

      Bring it on. We’ve had two major EN’s since 1997 and one lesser EN in 2010. The net warming of the first 2 was zero and the most recent is heading back to the flat trend.

      No sign whatsoever of a CO2 warming signal nor should there be. A gas comprising 0.04% of atmospheric gases does not control the temperature of the atmosphere. Only an idiotic pseudo-scientists would claim it has a significant effect.

      Roy has claimed it should have some effect and I can live with that, however, talking about catastrophic changes in climate is sheer nonsense.

      • David Appell says:

        And how many La Ninas since 1997?

      • David Appell says:

        Gordon Robertson says:
        No sign whatsoever of a CO2 warming signal nor should there be

        Gordon thinks CO2 doesn’t absorb IR, a statement contrary to reality (J Tyndall 1861 and beyond).

        Observation of a CO2 signal:

        http://agwobserver.wordpress.com/2009/08/02/papers-on-changes-in-olr-due-to-ghgs/

        “Increases in greenhouse forcing inferred from the outgoing longwave radiation spectra of the Earth in 1970 and 1997,” J.E. Harries et al, Nature 410, 355-357 (15 March 2001).
        http://www.nature.com/nature/journal/v410/n6826/abs/410355a0.html
        “Radiative forcing measured at Earths surface corroborate the increasing greenhouse effect,” R. Philipona et al, Geo Res Letters, v31 L03202 (2004).
        http://onlinelibrary.wiley.com/doi/10.1029/2003GL018765/abstract

        “Observational determination of surface radiative forcing by CO2 from 2000 to 2010,” D. R. Feldman et al, Nature 519, 339343 (19 March 2015).
        http://www.nature.com/nature/journal/v519/n7543/full/nature14240.html

        • Chuck Wiese says:

          These are the same stupid, tired and worn out papers that claim you can exclusively count increased opacity around the wing lines of CO2 and claim from that, that this CO2 warming nonsense is validated.

          This discussion has graduated far beyond this, Appell, but being the fool you are, you stay stuck on first base.

          • Gordon Robertson says:

            Chuck…”This discussion has graduated far beyond this, Appell, but being the fool you are, you stay stuck on first base”.

            Amen.

          • David Appell says:

            Chuck Wiese says:
            These are the same stupid, tired and worn out papers that claim you can exclusively count increased opacity around the wing lines of CO2 and claim from that, that this CO2 warming nonsense is validated.

            That’s not even close to a scientific critique.

            You don’t have one.

        • Chic Bowdrie says:

          The papers Appell refers to all use one or more software programs to translate spectral differences into forcings. No actual temperature response was measured. Anderson et al. explain it like this:

          “The task of the climate analyst only begins when good data become available. The spectra in Fig. 8a [Harries el al., 2001] are the result of a superposition of two different effects. First, there is an increase of greenhouse gases from 1970 to 1996 that gives rise to recognizable bands in the observed spectrum. This effect is known and understood theoretically and is the basis for the climate forcings of all GCMs. Harries et al. [2001] showed that the expected bands could be detected in the observed IRIS/IMG difference spectra, confirming the capabilities of the two observing systems. But the important problem for modern climate science is to predict and to measure the response of other atmospheric variables (temperature, humidity and cloud) to a climate forcing. These changes also leave characteristic imprints on the outgoing thermal spectrum. The requirement is to separate forcing and response, and to compare the response to theoretical predictions.”

          https://www.atmos.umd.edu/~dankd/AndersonEtAl2004.pdf

          • Bindidon says:

            Merci / thanks for the intelligent, educating comment. This is a wonderful recovery from Robertson’s incredible scrap.

          • Chic Bowdrie says:

            Thank you. I strive to make my comments constructive as you seem to do as well.

            I am increasingly reluctant to respond to those who pollute this blog with insults and wild speculation. That goes for GR, in particular.

  60. Snape says:

    Chuck

    You claim there has been no recent warming in Oregon, yet admitted the source for that claim, Mark Albright’s plots (where does he get his data from?) ended in 2013, and more up-to-date data shows otherwise:

    1979 – 2018
    UAH/LT: + 0.19 C. /decade

    1979 – 2017
    NOAA: 0.27 C. /decade (climate at a glance)

    ********

    You also said Albright’s analysis of rural stations around Oregon match well with the satellite record. If he is correct, then by looking at the UAH trend above, we can infer similar warming for those sites: +0.19 C. /decade since 1979

    (Thanks again to Bindidon)

  61. Snape says:

    Bindidon

    How does the GHCN data relate to NOAA? As I mentioned above, NOAA claims a + 0.27 C./decade warming for Oregon (since 1979), but your look at the GHCN sites indicate + 0.19 C.

    • Bindidon says:

      …but your look at the GHCN sites indicate + 0.19 C.

      No!

      What you looked at was a comparison between UAH6.0’s 2.5 degree grid data for Oregon
      – using a coordinate rectangle akin to Oregon’s surface (12 grid cells)
      – using the set of 9 cells encompassing the locations of Oregon’s GHCN V3 stations active between 1979 and 2018.

      Both show indeed 0.19 C / decade.

      GHCN V3 Oregon average is 0.36 C / decade.

      I’ll discuss that later together with a zoom into Oregon’s Eugene, incomplete datasets etc etc.

  62. Snape says:

    Bin

    I forgot to say thanks for the Clive Best link. Really interesting.

  63. An Inquirer says:

    Dr. Spencer has done a good job in putting into perspective the heat wave that is driving MSM hysteria.
    My local media will not publish contributions that can be construed as skeptical, so this blog provides an opportunity to say something that is worthy of note.
    We had one day in Minnesota over 90 degrees*, and the media called it an extreme heat wave. I remember heat waves over 100 degrees lasting for days. The media is doing a great disservice by ignoring historical perspective.

    (*Clarification – there were a couple stations with UHI that made 90 degrees on the 2nd day.)

    • David Appell says:

      Memories aren’t reliable. So you have any data?

      • An Inquirer says:

        Yep,
        For the sake of time, I will just give a couple of examples:
        07.05.1936 96
        07.06.1936 106
        07.07.1936 103
        07.08.1936 103
        07.09.1936 101
        07.10.1936 107
        07.11.1936 108
        07.12.1936 109
        07.13.1936 110
        07.14.1936 110
        07.15.1936 107
        07.16.1936 108
        07.17.1936 105
        07.18.1936 104
        07.19.1936 96

        Most years nowadays, the highest temperature for the summer does not reach the lowest of the high temperatures in this heat wave.

        Heat waves have decreased in intensity. Here is the heat wave from 1983.

        07.12.1983 93
        07.13.1983 99
        07.14.1983 100
        07.15.1983 94

        But still hotter than what we are experiencing this year.

  64. The best set up for immediate global cooling is overall sea surface temperatures falling and the N. Atlantic remaining cold.

    Even a weak El Nino would not change the scenario which unlike the former is more transient but like the former is also a natural climatic event.

    This leaves AGW as the odd man out.

  65. Bindidon says:

    Chuck Wiese

    Blindidon: Eugene’s weather station is on the far north end of the metro. I have no idea why it is designated as urban.

    1. Thanks for the humor! I am well known to have ‘Eyes wide shut’.

    2. Interesting point! Where, do you think, does ‘nightlight level C’ (the highest in GHCN V3) come from?

    It stems from a database, look e.g. at

    https://tinyurl.com/yd28cyql

    If you don’t accept nightlight’s correlation with urban development: that is your problem.

    Moreover, I had a closer look at Eugene/Mahlon’s exact location using

    https://www.findlatitudeandlongitude.com/

    Unfortunately, the site does not transfer actual info into the URL; I have to show a screenshot instead:

    http://4gp.me/bbtc/1530893369556.jpg

    Chuck Wiese, if that is not urban for you, please ask Anthony Watts. Sure he is ‘glad to help’.

    Et la même remarque vaut a fortiori pour Salem/McNary, n’est-ce pas?

    http://4gp.me/bbtc/153089403552.jpg

    • Gordon Robertson says:

      binny…”Interesting point! Where, do you think, does nightlight level C (the highest in GHCN V3) come from?”

      Only idiots would use city lights to determine UHI. The same kind of idiots who would drop a confidence level to 37% to move a cool year into first place as a record.

      • Bindidon says:

        Dumb, dumber, dumbest commenter evah.

        Luckily, there are intelligent people writing here useful things.

        You, Robertson, never did and will never be able to.

  66. fah says:

    My current candidate for first prize at claiming cause-effect relationships with natural phenomena is this news from the Jerusalem Post

    https://www.jpost.com/Israel-News/Politics-And-Diplomacy/Earthquake-caused-by-Reform-Conservative-Jews-says-Shas-MK-561646

    Member of Knesset Yinon Azoulai claimed that the recent 4.1 magnitude earthquake in Israel was caused by non-orthodox Jews pushing for egalitarian prayer rights at the Western Wall (i.e. allowing women to pray there) and incurring the wrath of God. The fingerprints are apparently all there. He even calls the offenders an appropriate name – “falsifiers” those who try to falsify the Jewish religion.

    • La Pangolina says:

      Thx 4 mkg me lol

    • David Appell says:

      fah says:
      Member of Knesset Yinon Azoulai claimed that the recent 4.1 magnitude earthquake in Israel was caused by non-orthodox Jews pushing for egalitarian prayer rights at the Western Wall (i.e. allowing women to pray there) and incurring the wrath of God.

      Radical conservatives in America do this all the time, blaming hurricanes and earthquakes on gays, on gay marriage, on sodomy and more. Pat Robertson does it repeatedly. He can read the mind of god you know. Or at least one of them.

      https://www.washingtonpost.com/opinions/did-lesbians-cause-hurricanes-irma-and-harvey-god-knows/2017/09/08/638efbca-94bf-11e7-89fa-bb822a46da5b_story.html

      https://www.snopes.com/fact-check/pat-robertson-flooding/

      https://en.wikipedia.org/wiki/Natural_disasters_as_divine_retribution

      • fah says:

        The dangers of leaping to cause and effect know no political, philosophical, or scientific boundaries. Feynman had a lot to say on this topic such as,

        “The first principle is that you must not fool yourself and you are the easiest person to fool.”

        I believe he also said that one should be the world’s expert on proving one’s own theories wrong. And of course there is the inimitable Feynman quote “So I have just one wish for you – the good luck to be somewhere where you are free to maintain the kind of integrity I have described, and where you do not feel forced by a need to maintain your position in the organization, or financial support, or so on, to lose your integrity. May you have that freedom.” The commencement speech from which the last quote is taken is worthwhile reading for any inquisitive mind.

        • David Appell says:

          Feynman would be warming about AGW if he were alive today.

          I wish I had a nickel for every time some denier quoted Feynman, as if they think he’d be a CO2 denier.

          • fah says:

            Odd. Nothing was said about any particular physical theory. There is an oft-used anecdote about a patient seeing a psychiatrist. It goes like this:

            A man goes to a psychiatrist. To start things off, the psychiatrist suggests they start with a Rorschach Test. He holds up the first picture and asks the man what he sees.

            “A man and a woman making love in a park,” the man replies.

            The psychiatrist holds up the second picture and asks the man what he sees.

            “A man and a woman making love in a boat.”

            He holds up the third picture.

            “A man and a woman making love at the beach.”

            This goes on for the rest of the set of pictures; the man says he sees a man and a woman making love in every one of the pictures. At the end of the test, the psychiatrist looks over his notes and says, “It looks like you have a preoccupation with sex.”

            And the man replies, “Well, you’re the one with the dirty pictures.”

          • Gordon Robertson says:

            DA…”Feynman would be warming about AGW if he were alive today…”

            Feynman was very aware and he would not fall for the propaganda spread by dimwit alarmists.

          • David Appell says:

            Gordon, another of your laughable moments. Thanks for the chuckle.

  67. I currently live in Birmingham AL. Looking at the historical records these past few summers especially this year werent even close to being the hottest summers on record. I am originally from Miami and let me tell you when it gets to be triple digits here in Birmingham Im sure its a totally different ballgame that I do not plan to witness.

  68. In Germany, Solar Power is just 1% of the Primary Energy consumption. Wind Power is 2.4%.

    German Ministry of Economics, 2017.

    Not enough space for Wind Turbines. Actually in Bavaria there will be no new one. There must 2 km distance from any windmill to houses.

    • La Pangolina says:

      Johannes Herbst says:
      July 6, 2018 at 12:41 PM

      In Germany, Solar Power is just 1% of the Primary Energy consumption. Wind Power is 2.4%.

      In theory correct, but… in practice, you first should consider the following repartition of 2,642 TWh consumed in Germany in 2016:

      – mineral oil: 935
      – gas: 644
      – electricity: 515
      – nonelectric renewables, others: 183

      This means that electricity accounted in the end for no more than 23 %. And solar plus wind were no more than 25 % of these 23.

      *

      Not enough space for Wind Turbines.

      Is that really the point?

      How many offshore wind parks were planned for 2020 in… 2010? How many of them will produce electricity in 2020?

    • Gordon Robertson says:

      Johannes…”In Germany, Solar Power is just 1% of the Primary Energy consumption. Wind Power is 2.4%”.

      How many coal-fired plants are they building to replace their discarded nuclear generators?

      https://en.wikipedia.org/wiki/Energy_in_Germany

    • Nate says:

      Here are all sources of energy for electric power in Germany over time.

      https://upload.wikimedia.org/wikipedia/commons/c/c9/Energiemix_Deutschland.svg

      Nuclear is Kernenergie.

  69. Nate says:

    ‘Solar and wind are relatively diffuse (and thus expensive) sources of energy’

    Are they??

    Lets look an existing source, Hydroelectric power, and compare to solar.

    Hoover Dam, produces max 2 GW, and generates full power 25% of the time (25% capacity factor).

    It covered 400 km^2 of land with water (Lake Meade).

    Suppose we covered 400 km^2 of land with solar panels. 1 km^2 receives max of 1 GW. Suppose we can extract 10% of that.

    That’s 40 GW max.

    We can also get ~ 25% capacity factor.

    So is it too diffuse? Not really.

    Expensive? No. It is now < $ 0.8/Watt installed. Other PP range from $0.6 – $5/ watt installed.

    • gbaikie says:

      “Lets look an existing source, Hydroelectric power, and compare to solar.

      Hoover Dam, produces max 2 GW, and generates full power 25% of the time (25% capacity factor).

      It covered 400 km^2 of land with water (Lake Meade).

      Suppose we covered 400 km^2 of land with solar panels. 1 km^2 receives max of 1 GW. Suppose we can extract 10% of that.”

      One could cover lake with solar panels.

      Oh, but wait, the lake is used for recreational use.
      Wiki:
      “Since about 1900, the Black Canyon and nearby Boulder Canyon had been investigated for their potential to support a dam that would control floods, provide irrigation water and produce hydroelectric power. In 1928, Congress authorized the project.”

      So, it makes lake for recreational use, controls floods, and provide irrigational water. And ” is a major tourist attraction; nearly a million people tour the dam each year.”

      It seems fewer are going visit solar farms. And they don’t stop floods, and don’t provide water, and hoover dam has been used for 80 years.

      Oldest solar farm in world:

      “Toledo-PV: The Oldest Solar 1MW In the World has been Operating for 23 years 1993/2016 Abstract/Summary: The paper is a summary of the energy production during the 20 years, 1994-2014, of operation of the photovoltaic plant, Toledo-PV.
      https://decentesimas.wordpress.com/2017/02/18/toledo-pv-the-oldest-solar-1mw-power-plant-in-the-world/

      That might be tourist attraction in another couple decades- come and see one the dumbest things people wasted money on in 20th century.

      • Nate says:

        Moving the goal posts.

        The question was simply ‘how diffuse’ and ‘how expensive’.

      • Nate says:

        I would imagine coal mines and power plants, ash pits, and toxic runoff from these are also not tourist attractions.

        • gbaikie says:

          Ash pits:
          “Coal ash, also referred to as coal combustion residuals (CCR), can be used in different products and materials. Coal ash can be beneficially used to replace virgin materials removed from the earth, thus conserving natural resources. EPA encourages the beneficial use of coal ash in an appropriate and protective manner, because this practice can produce positive environmental, economic, and product benefits such as:

          reduced use of virgin resources,
          lower greenhouse gas emissions,
          reduced cost of coal ash disposal, and
          improved strength and durability of materials.”
          https://www.epa.gov/coalash/coal-ash-reuse

          And:
          “What is Coal Ash?
          Coal ash is chemically similar to clay, essentially a calcined or fired clay which lends itself as a replacement for natural resources.

          Since 1951, AEP has been a pioneer in many of the utilizations of coal ash in the construction of its own power plants. Dams, plant roads, stacks, cooling towers and even the company’s 31-story headquarters building in Columbus have been constructed with the help of this versatile and plentiful material.”
          https://www.aep.com/about/b2b/CoalCombustionProducts/coalash.aspx

          So if coal ash is used to make a dam, it will be part of tourist attractions.

        • Nate says:

          All very nice, but like putting lipstick on a pig.

  70. Bindidon says:

    Chuck Wiese

    “But that is you, Appell. Youre incompetent.”

    https://atmos.washington.edu/marka/oregon/salem.1932_2013.png

    Well Chuck Wiese, mayby I have ‘Eyes wide shut’ all the time, but what I immediately saw in Albright’s graph was this so pretty inconspicuous letter sequence “Max”.

    That lets me ask you: Are you incompetent or did you intentionally manipulate this blog’s readers?

    I produced a time series out of the GHCN daily station Salem/McNary, and here is the result:

    1. TMAX 1932-2013
    http://4gp.me/bbtc/1530912046112/001.jpg

    2. TAVG 1932-2013
    http://4gp.me/bbtc/1530912108492/001.jpg

    I guess you see a little difference, huh?

    And by the way:

    – Why did Albright choose TMAX when TAVG is the most used measurement? He had everything a hand:

    https://atmos.washington.edu/marka/c30.cgi?sle

    – why did Albright start in 1932? The Salem record is quite a lot incomplete between 1893 and 1913, but starting in 1914 wouldn’t have been that bad, would it?

    http://4gp.me/bbtc/1530912423357/001.jpg

    In my native language we love to say: “Tel est pris qui croyait prendre”.

  71. Chuck Wiese says:

    Blindidon: “That lets me ask you: Are you incompetent or did you intentionally manipulate this blog’s readers?”

    Me: With reference to the use of Tmax or Tmin, when we see that most all of these stations in urban areas have experienced increases in nighttime temperatures due to the UHI, which is the best set to use to subtract out the UHI effect? Tmax!

    And if we are talking about validating the claim that CO2 is causing “climate change”, then both sets should have the CO2 warming signal in them. But they don’t. Why is that Blindidon? Or should I direct that question to the incompetent David Appell, who never answers legit questions?

    There have been significant changes in the morphing versions of the surface temperature records and considerable discussion as to how the plots of temperatures keep changing. An in depth analysis here, and Gordon Robinson has already linked it, but I’ll provide it for you in case you missed it:

    https://chiefio.wordpress.com/gistemp/

    GISS and NOAA have unquestionably buggered the data sets to get the sort of temperature trends they seek to validate their failed modeling, but more importantly, this analysis shows nearly ALL of the warming signal in Tave is obtained with rising minimum temperatures, just like you demonstrated for Salem, OR. That is the reason why Tmax is the only marker that can delineate whether the TAVE is valid for CO2 warming or not. And as you just demonstrated, CO2 is not valid as a cause for Tave because it would have to contain warming from both data sets and it doesn’t. Maybe you don’t care about this, but those of us interested in validating the cO2 warming claims are. That would include Albright, myself and many others.

    You asked why Mark Albright started his record in 1932. I can assure you the reason is not to cherry pick a data set. You just demonstrated why it doesn’t matter.

    Thanks for the plot differentiation to highlight these points.

    Upthread I asked you to plot the UAH temperature grids that you also used, “placed above” the stations like Salem, Eugene, ect. Could you please provide this as well and link it? And what about the entire Oregon grid using UAHv6 LT Could you provide this as well?

    Thank You!

    • Chuck Wiese says:

      One additional point of clarification to my post above. When you plotted Salem temps Tmax with Tave, it needs to be pointed out that in this analysis of these temperature records, another thing that NOAA and GISS did was to deliberately COOL the early part of first order station records. In this category, there is absolutely no reason to do this. We saw this done at EUG and many other first order stations in the record, which explains why Tmax and Tave show warming in your last example. It isn’t real when data is manipulated in this manner.

    • La Pangolina says:

      This

      NOAA/NCD~C: GHCN The Global Analysis

      https://chiefio.files.wordpress.com/2009/11/thermometer-records-by-year.gif?w=622&zoom=2

      is very probably the dumbest manipulation I have ever seen. Simply disgusting.

      Bindidon generates for each run over GHCN V3 monthly or GHCN V4 daily data an associated time series showing the number of stations active in each year.

      No: he won’t invoke the wayback machine to get the GHCN V2 dataset valid at the time your ridiculous ‘Chiefio’ produced the graph, and check if it’s right. There are a lot of more meaningful tasks to do.

      • Chuck Wiese says:

        “No: he wont invoke the wayback machine to get the GHCN V2 dataset valid at the time your ridiculous Chiefio produced the graph, and check if its right. There are a lot of more meaningful tasks to do.”

        Of course. And what would those tasks be? To continue to ignore how data sets have been tortured by NOAA and GISS in the present versions to cover up model failure?

        If it’s so disgusting, then maybe you and your sweetie should take the time to refute it. After all, we all want the truth about this CO2 warming nonsense, don’t we?

        • David Appell says:

          Where is a link to the data?

          Why does the plot stop at 2013, five years before today?

        • David Appell says:

          Chuck Wiese says:
          Of course. And what would those tasks be? To continue to ignore how data sets have been tortured by NOAA and GISS in the present versions to cover up model failure?

          1) How would you correct for the observational biases?

          2) Adjustments reduce the long-term warming trend.

          • Chuck Wiese says:

            Salem McNary was a first order station after 1937, Appell. You don’t even follow this conversation or understand why there are designations.

        • La Pangolina says:

          Chuck Wiese says:
          July 6, 2018 at 5:12 PM

          To continue to ignore how data sets have been tortured by NOAA and GISS in the present versions to cover up model failure?

          Where is a scientific proof of this discriminating, denigrating claim?

          Nowhere, Chuck Wiese, excepted in blogs.

          • Chuck Wiese says:

            La Pangolina : “Where is a scientific proof of this discriminating, denigrating claim?

            Nowhere, Chuck Wiese, excepted in blogs.”

            Me: And just where do you think your going to find it elsewhere? In a revered journal that is heavily invested in fronting this crap about CO2 warming?

            Having these studies published in one of these journals is the equivalent of presenting garlic and a cross to Count Dracula. It would mean a sure and swift death to the billions of dollars being wasted on this racket and the fact that these censored authors from the journals are getting their message out anyway is very damaging.

            Like I said before, if you think all of this blog research is crap, then you should step forward and refute it. It would appear you have all the tools at our disposal for a good start.

            So what is the matter with you? Are you frightened about what you might be able to replicate in these analyses?

          • David Appell says:

            Chuck uses his bias against science to make up accusations about journals keeping people like him out of their pages. (Not that he has ever bothered to submit a paper to any of them, mind you.)

            When you are facing a much better team, try to work the refs.

        • Gordon Robertson says:

          Chuck…”Of course. And what would those tasks be? To continue to ignore how data sets have been tortured by NOAA and GISS in the present versions to cover up model failure?”

          Binny does no care if NOAA/GISS are outright cheats. Neither do any of the alarmists on this blog.

          • David Appell says:

            Gordon is the cheat and liar. He doesn’t have a scintilla of evidence that NO.AA has cheated on anything. But he’s frustrated by reality, and he finds his only option is to make up accusations and denigrate people for no good reason. That’s the kind of guy Gordon is.

  72. David Appell says:

    Chuck, instead of insulting me, why dont you start providing some data and evidence?

    • Chuck Wiese says:

      Appell to me:” Idiot. There are temperature data from many stations, many of them rural.

      They directly disprove your dumb claim that Oregon has no warming except from the urban heat island. (Note: you have never provided any data yourself.)”

      Me: I think Blindidon just demonstrated that I am correct and you are continuing to play the role of a fool that you do very well, here and every place you surface, Appell.

      • David Appell says:

        Chuck, now you can’t even read plots, huh?

        Many of these stations show warming in rural areas. You don’t get to claim that black is white.

        https://davidappell.blogspot.com/2018/07/oregons-rural-warming.html

        PS: There plots ARE data, dingo.

      • La Pangolina says:

        Chuck Wiese says:
        July 6, 2018 at 5:07 PM

        Me: I think Blindidon just demonstrated that I am correct…

        WHAT ???

        Never and never did Bindidon demonstrate that you are correct!

        http://4gp.me/bbtc/1530912423357/001.jpg

        This graph demonstrates exactly the inverse, but you absolutely needed to invent some stuff to reject it (see your own comment somewhere above).

        Do not try to manipulate us, Chuck Wiese.

        • Chuck Wiese says:

          Apparently your comprehension is in need of some work. I clarified to you and Blindidon above that the reason why Tmax and Tave show warming when you go back to the beginning of the record is because NASA GISS and NOAA have mauled that record and COOLED Tmax without any justification near the beginning of it.

          THAT is why you can get a closer match in comparing the records when you go back that far.

          And I’ll ask you a question. Why is Tmax showing no warming beyond 1930 when atmospheric CO2 has risen substantially since then?

        • La Pangolina says:

          In order to be clear:

          I am not at all interested in these unscientific discussions concerning any proof or disproof of CO2’s influence on temperatures, based on so incredibly trivial points like a discrepancy between daily maxima and averages during a well selected period!

          • Chuck Wiese says:

            La Pangolina:

            “I am not at all interested in these unscientific discussions concerning any proof or disproof of CO2s influence on temperatures, based on so incredibly trivial points like a discrepancy between daily maxima and averages during a well selected period!”

            Me: Why? This goes directly to the question of whether CO2 is causing warming. So not answering my question and calling it “unscientific” is just plain nonsense and hardly trivial. Isn’t the claimed radiative forcing from CO2 not present on the day side of the earth’s rotation? It most certainly is and if it was operating as the failed models claim it is, then IR emission from solar side forcing from the surface should also surely slow and allow Tmax to rise as well. Why didn’t it?

            Can you answer the question to save the failing hypothesis?

        • Gordon Robertson says:

          binny…”Never and never did Bindidon demonstrate that you are correct!”

          Will the real Binny please stand up. Chuck addresses Binny and La P replies.

  73. Chuck Wiese says:

    Blindidon just provided it. So what don’t you explain why Tmax shows no warming if Co2 is the cause of Tave warming?

  74. La Pangolina says:

    Chuck Wiese says:
    July 6, 2018 at 4:54 PM

    it needs to be pointed out that in this analysis of these temperature records, another thing that NOAA and GISS did was to deliberately COOL the early part of first order station records.

    Typical paranoid pseudoskeptic blah blah a la Robertson, all bloody stuff he picks up from lying web sites like chiefio, goddard, hockeyschtick etc etc.

    Should you have real interest in communicating with Bindidon and me, so I think it would be a good start to avoid such unproven nonsense in the future.

    A typical example of this unproven nonsense is your Eugene/Mahlon station in OR.

    I obtained from J.-P. a time series he generated out of GHCN V3 for this station.

    Linear estimates for GHCN:
    – Feb 1942 – May 2017: 0.29 C / decade
    – Dec 1978 – May 2017: 0.49 C / decade

    After having downloaded the text file in

    https://data.giss.nasa.gov/cgi-bin/gistemp/stdata_show.cgi?id=425726930000&ds=5&dt=1

    Linear estimates for GISS:
    – Feb 1942 – May 2017: 0.19 C / decade
    – Dec 1978 – May 2017: 0.38 C / decade

    That the estimate for UAH6.0’s grid cell above Eugene and Salem (42.5N-45.0N — 125W-122.5W)
    – Dec 1978 – May 2017: 0.18 C / decade

    is way lower: that is unavoidable when considering only one cell out of 9,504.

    Btw: your claim that stations with an incomplete record are unusable is another nonsense: in that case Albright couldn’t have used the GHCN V3 Salem record due to lots of missing months prior to 1914!

    But exactly that you wouldn’t have been able to detect, unless you did the processing of the original data by your own.

    • Gordon Robertson says:

      binny…”Typical paranoid pseudoskeptic blah blah a la Robertson, all bloody stuff he picks up from lying web sites like chiefio….”

      I have quoted NOAA directly from their own site and you are too stupid to clue in. NOAA admits that they have slashed over 75% of their 6000 global reporting stations. They admit they use less than 1500 stations globally to produce their data.

      Chiefio has done a masterful job revealing which stations they have slashed and how they interpolate data from stations up to 1200 miles apart to synthesize intermediate stations data they have discarded. He claims GHCN has slashed 90% of global data since the early 90s.

      In California, NOAA uses only 3 stations, all along the warm coast. None from the Sierra-Nevada mountain locales. In the Canadian Arctic they have only one station, at Eureka. In Bolivia, where it’s cooler at altitude, they just bypass the cooling and interprlate the area using 2 warmer regions.

      Since they have resorted to using climate models they are required to produce a confidence level. No problem, NOAA reduced the CL to 48% in 2014 and claimed it as the hottest year on the record. On the UAH dataset, 2014 is several tenths C below 1998 and 2016. It’s even behind 2010.

      Alarmists are cheaters and I see you have gotten into the spirit, producing fake graphs on Excel that place the UAH time series and the Had-crut time series nearly on top of each other.

    • David Appell says:

      Gordon Robertson says:
      They admit they use less than 1500 stations globally to produce their data.

      So what?

  75. Chuck Wiese says:

    “Typical paranoid pseudoskeptic blah blah a la Robertson, all bloody stuff he picks up from lying web sites like chiefio, goddard, hockeyschtick etc etc.”

    Really? That’s it? That’s all you can offer? What about showing where these authors made mistakes rather than attack them personally?

    There is NO QUESTION, NOAA and NASA GISS have been manipulating the surface temperature records. Personal attacks against these authors rather than showing they made mistakes and are wrong is not a convincing strategy.

    Where are these authors specifically messing up their analysis?

    • I agree Chuck . So far 2018 looking good as all trends are down.

    • Gordon Robertson says:

      Chuck…”Really? Thats it? Thats all you can offer? What about showing where these authors made mistakes rather than attack them personally?”

      Because La P is really Bindidon and Bindidon is as much an alarmist, troll, idiot as Appell.

      • Chuck Wiese says:

        “Because La P is really Bindidon and Bindidon is as much an alarmist, troll, idiot as Appell.”

        It’s beginning to look that way, Gordon. This is my first experience with these two. It looks like you’ve been there/done that like I have been doing for years with the incompetent David Appell.

        • David Appell says:

          Like Gordon, Chuck substitutes data with name-calling. It seems to be the best they can do.

          • Chuck Wiese says:

            No we don’t, Appell. You have been given every last bit of data from me that you have ever asked for. The problem with you is that if anything disagrees with your misperceived, wrong and incompetent opinions relating to atmospheric science or AGW, you just ignore them and then make the same request for data, over and over.

          • David Appell says:

            You’re the one name calling, not me.

            There was no data for Salem Tmax until I went and found it.

          • Gordon Robertson says:

            Chuck…”No we dont, Appell. You have been given every last bit of data from me that you have ever asked for…”

            It’s the alarmist way of doing things. They actually study such ploys in hope of confounding skeptics. Problem is, skeptics are skeptics because they have more intelligence than alarmists.

          • David Appell says:

            The only data Chuck ever gave was a plot by someone else that was 5-years out-of-date. He couldn’t even link to the plot’s data.

        • Gordon Robertson says:

          Chuck…”Its beginning to look that way, Gordon. This is my first experience with these two”.

          You may have noted that I address both Bindidon and La P as Binny. There’s a reason.

          A while back, Binny got in a snit over proceedings on the blog and announced his/her departure from the blog. A few days later, La P appeared but with the same attitude as Binny and an exacting memory for past events involving Binny.

          I smelled at rat. La P claims Binny is her life mate but I am thinking La P was already posting as Bindidon. When Binny departed with a sad epilogue, claiming he/she could no longer bear the context of the blog, I figured he/she would be back as many do under such circumstances.

          However, it was not Binny who re-appeared a few days later, it was La P. When challenged, La P claimed to be Bindidon’s life mate and that her name is Rose. I think Rose did not have the courage to appear in the blog as a female and took the persona of a male, as Bindidon.

          I have no problem with the possibility that JP, claiming to be Bindidon, and La P, as Rose, are life mates, I just don’t buy into the manipulation of the blog, and science, to appease egos. Rose (La P) is supposed to be the expert in Excel while Binny dabbles with Linux. However, in the past, Binny posted Excel graphs as Binny, not La P.

          None of this would be an issue had these two not been uber-alarmists who manipulate data to produce graphs in which UAH time series are shown to be very close to Had-crut and NOAA time series. Using Excel, as amateurs and alarmists, they manipulate the data between series with vastly different baselines to produce overlapping graphs that appear to be very similar.

          Trolls tend to have ego issues and they will go to great lengths to placate their egos. I have seen trolls appear on blogs under many different personas until being revealed by someone who was smarter. Only trolls would come onto Roy’s blog and use his data against him in such a nefarious manner.

  76. Bindidon says:

    Chuck Wiese

    Concerning your TAVG vs TMAX nonsense, I invite you to have a closer look at a chart with plots comparing them for the entire CONUS.

    { I could do the same for the Globe, but it would take about two hours to process all the 30 GB, and it is here 4 AM now. }

    Tmin / Tavg / Tmax
    http://4gp.me/bbtc/1530927891244/001.jpg

    Active stations in each year:
    http://4gp.me/bbtc/1530927589513/001.jpg

    I’m sure you will manage to cherry-pick some period, and tell me: “You see? I’m right! Tmax has a lower trend than Tavg!”.

    I’m so sad of such ridiculous discussions…

    • Chuck Wiese says:

      Blindidon and Lapangolina:

      This note is also meant to greet you both when you wake up Saturday morning to let you know, that Mark Albright chose 1938 as a starting point because before this time, Salem, OR was not a first order station. The conversion took place in 1937 and before this time, there were months of records missing from the station.

      So why would both of you decide its OK to plot a temperature graph at this location prior to this year? You are guestimating temperatures just like NOAA and NASA GISS do and it would be very easy to rig a cooler record into the volumes of missing months.

      Why would you want to do this? Mixing different classes of observations is a no no for anyone who knows how to generate proper climatological statistics.

      • David Appell says:

        Starting at 1938, my data show a linear trend for Tmax of +0.09 F/decade.

        https://davidappell.blogspot.com/2018/07/is-salem-oregon-warming.html

        • David Appell says:

          By the way, the trend of Tmax since 1970 is +0.31 F/decade. Just saying.

          • Chuck Wiese says:

            This is a good example of how linear trends are meaningless without knowing the cause of their result. This is because of the super El Ninio of 2015 and 2016.

            But someone who as dishonest as you, Appell, will not make the distinction and blame it all on CO2.

            That’s how this game is played by all of the special interests that want money and careers out of promoting this rot.

          • David Appell says:

            Chuck always has some excuse.

          • Gordon Robertson says:

            Chuck…”This is a good example of how linear trends are meaningless without knowing the cause of their result”.

            Chuck, you are dealing with trolls/alarmists who have no idea what a trend means outside of the amateur practice of number crunching. In the case of Binny, he/she enters numbers blindly into Excel without consideration of the contexts represented by the data.

            The UAH trend, quoted as 0.12C/decade has at least three major contexts. The first, from 1979 till 1997 is a recovery from cooling. Most of the data is below the baseline. The second is from late 1997 – 1915, which represents a flat trend. The IPCC admitted to 15 years of the flat trend from 1998 – 2012, calling it a hiatus.

            The third is the EN of early 2016 and its lingering effect. The UAH trend should be quoted in at least three parts but that won’t happen due to scientific protocol and paradigms.

            The trend itself means nothing and it in no way suggests anthropogenic warming.

          • David Appell says:

            The UAH LT v6.0 trend is +0.13 C/decade.

            How deniers like Chuck sees global warming:

            https://tinyurl.com/ya65jlqc

        • David Appell says:

          I do find the trend from 1938-2013 to be zero. These last four years were very warm here, and make a significant difference!

          • David Appell says:

            So it turns out that the “trick” (ahem) to Chuck’s claim is: don’t include all the data.

            Sneaky!

          • Chuck Wiese says:

            Yes. From a natural phenomena called El Ninio. But that doesn’t count in your myopic world, so you just ignore it.

            Very sneaky and dishonest.

            Why wasn’t there any warming in Tmax before this? CO2 was rising steadily through the 70 years of record. Doesn’t CO2 affect Tmax? It absolutely should if it is causing warming.

            Why won’t you answer this, Appell?

          • David Appell says:

            Chuck, can we also take the La Ninas out of the data?

            Why are El Nino seasons getting warmer and warmer?
            And La Nina seasons?
            And neutral seasons?

            https://nca2014.globalchange.gov/report/appendices/climate-science-supplement/graphics/warming-trend-and-effects-el-ni%C3%B1ola-ni%C3%B1a

          • Chuck Wiese says:

            Appell: That you would take a computer simulation by Gavin at GISS (who has also engaged in torturing the surface temperature record) and claim this shows how temperatures have warmed with all three ocean cycles goes to demonstrated that you aren’t bright enough to distinguish between simulations and reality.

            Just look at the UAH temperature records. Such trends do not exist and this crappy graph doesn’t even display time across the abscissa. But that’s your level of sophistication, Appell.

          • David Appell says:

            It’s not a “computer simulation,” it’s merely a plot of the observed data.

            And yes it is true for UAH. (Which you’d see if you ever looked at the data.) For UAH LT v6.0

            * the warmest El Nino season is 2015-2016.
            * the warmest La Nina season is 2016-2017
            * the warmest neutral season is 2014-2015.

            The 2015-2016 El Nino season average 0.47 C for UAH LT v6.0.
            The 1997-98 El Nino season averaged 0.35 C.
            The 1982-83 season averaged -0.16 C.

            Next time try looking at the data before you write.

        • Chuck Wiese says:

          Up until this last El Ninio, Tmax was showing a slight cooling. That was over a span of 70 years. Why was it, Appell? You never answer questions like this. Do GHG’s stop working on the solar side of an earth rotation?

          Atmospheric CO2 rose substantially from just over 280 ppmv to 394 ppmv, but no warming at this first order station in Tmax.

          You aren’t the first person of the army of climate hysterics that always use individual Tmax values as proof of CO2 warming.

          • David Appell says:

            You first used Tmax bub, not me.

            Now you’re trying to cherry pick. Typical denier behavior.

          • Chuck Wiese says:

            Appell, here is you commenting to Roy Spencer:

            “Perhaps Public Citizen is wrong. But the USA48 is definitely getting warmer, and fast.

            Since 1895 the total warming is 1.0 C.

            But in the last 30 years, the trend is +0.27 C/decade. In fact, this has been the trend, +/- a few hundreths, since the early 60s.

            Thats +0.49 F/decade !”

            What do these measurements (that are corrupted by NASA GISS and NOAA) use to give the result they do? Just Tmin?

            You have no cohesiveness in anything you say from one post to the next.

          • David Appell says:

            So now the data are corrupted, you say.
            The same data you cited for 1938-2013!

            You are using every excuse in the denier book, even if they aren’t self-consistent.

          • David Appell says:

            Which is it, CWeise — are the data OK to use, or are they corrupted?

            Explain the dichotomy.

  77. Chuck Wiese says:

    Blindidon: “Concerning your TAVG vs TMAX nonsense, I invite you to have a closer look at a chart with plots comparing them for the entire CONUS. ”

    OK. I looked. Tmin and Tave look like they warm after about 1990, but Tmax doesn’t show this at all, but in fact, slight cooling after the 1930’s which fits into many discussions about how the 1930’s were the warmest decade in the thermometer record for the USA. Before then from the beginning of the record, they warm.

    Why do you think these discussions are ridiculous? Because you can find problems with these records validating the CO2 warming hypothesis?

    • David Appell says:

      Chuck: the NWS data I obtained show a clear warming trend in Salem’s Tmax:

      https://davidappell.blogspot.com/2018/07/is-salem-oregon-warming.html

      • Chuck Wiese says:

        After the super El Ninio of 2015 and 2016. I’ve already pointed this out, Appell. There was no warming before 2014 and before this event. Why is this, Appell, if CO2 is causing warming?

        The positive linear trend in Tave is the summation of Tmin and Tmax, and Tmin was the only part of the record that warmed. That is because of UHI and why you look at both to validate CO2 warming. If it’s not in the record, then it’s not causing warming.

        Why don’t you explain this, Appell? You never do. Anything that warms in your world is proof of AGW.

        This is just one reason why I think you are incompetent. You never address anything like this and frequently will blame something completely natural on AGW.

        • David Appell says:

          shorter Chuck: if you leave out warmest years, there is no warming.

          Typical.

          • Chuck Wiese says:

            I didn’t leave them out, Appell. I’ve explained them. But you won’t answer my question about why the record of Tmax shows no warming at Salem before 2014 with rising CO2.

            Why won’t you, Appell? This is you to a tee. You absolutely refuse to see any warming in a record in any other way, except to blame it on CO2. That is your ultimate confirmation bias.

            If you were a researcher working for any corporation and handled data in this manner in your summary reports you would have been swiftly fired years ago.

          • David Appell says:

            Again, you don’t get to throw away data you don’t like.

            First you use the station data to claim the trend is 0. Then you claim the surface stations aren’t good (Watts).

            Which is it?

          • Chuck Wiese says:

            Salem McNary field is a first order station, Appell. At least for now, the placement of the thermometers meet those standards. Urbanization cannot be controlled to accommodate a thermometer sensor, so the UHI effect cannot be ignored. It is glaringly apparent in this record like many other urban observations and it is obvious that is why Tave shows a positive trend in temperature.

            Your reasoning is shallow and incorrect.

          • David Appell says:

            Chuck: So when you used the data to show no trend, the data were OK.

            But when I included the data you left out, suddenly the data are no good because of the UHI?

            You said the warming in recent years was from an El Nino (even though 2014-15 wasn’t an El Nino, and 2016-2017 and 2017-18 were La Ninos). Now you’re saying the warming is due to a UHI?

            What’s next — Jupiter has aligned with Mars, throwing off global temperatures?

            Get your story straight, man.

          • Chuck Wiese says:

            Appell: ” So when you used the data to show no trend, the data were OK.

            But when I included the data you left out, suddenly the data are no good because of the UHI?”

            Me : No Appell. As usual, you don’t get it. Tave, which shows warming is accurate. The problem is, it doesn’t prove this was caused by AGW as you always claim. For that to happen, Tmax had to increase as well and it didn’t And Albright used Tmax because it hasn’t warmed, and the warming record in Tave was caused by UHI. The question is whether any warming is caused by AGW, and this record does not support that notion.

            I know that’s hard for you to comprehend, Appell, as you demonstrate by asking the same question no matter the answer you are given, because in your world, any warming is proof of AGW.

          • David Appell says:

            Chuck: WHERE IS YOUR DATA?

            Data = a list of ASCII numbers I can download and calculate with.

            Where it is?????????????

          • David Appell says:

            And I mean up-to-date data, not numbers you cherry pick by fraudulently leaving out the warm years.

          • David Appell says:

            This is brilliant:

            Chuck Wiese says:
            Tave, which shows warming is accurate. The problem is, it doesnt prove this was caused by AGW as you always claim. For that to happen, Tmax had to increase as well and it didnt

            Tmax’s trend for Salem from 1938 to present was as I gave, +0.09 F/decade.

            https://2.bp.blogspot.com/-xq6SVuqG_5o/W0D4vW7Ym-I/AAAAAAAAKwU/LCzGuUEM9Hk_VqzsxBCnVi168YgaBhj5gCLcBGAs/s640/Salem%2BTmax%2Bannual%2Bavg%2B1938-2017.JPG

            That’s warming.

          • David Appell says:

            This is brilliant:

            Chuck Wiese says:
            Tave, which shows warming is accurate. The problem is, it doesnt prove this was caused by AGW as you always claim. For that to happen, Tmax had to increase as well and it didnt

            Tmax’s trend for Salem from 1938 to present is, as I gave, +0.09 F/decade.

            https://2.bp.blogspot.com/-xq6SVuqG_5o/W0D4vW7Ym-I/AAAAAAAAKwU/LCzGuUEM9Hk_VqzsxBCnVi168YgaBhj5gCLcBGAs/s640/Salem%2BTmax%2Bannual%2Bavg%2B1938-2017.JPG

            That’s warming.

  78. Bindidon says:

    Chuck Wiese says:
    July 6, 2018 at 8:42 PM

    “Why do you think these discussions are ridiculous? Because you can find problems with these records validating the CO2 warming hypothesis?”

    Of course no! I personally have no interest in discussing about CO2’s influence on climate, because it is a far too complex area, handling thousands of observations, highly interrelated rules, and so son.

    I’m sorry, but your approach is so horribly simple compared with what really scientific educated people do since years and years.

    If I wasn’t so lazy, I would go into the model customisation corner this genial KNMI climate explorer, and I could then show you what you have to do there to gat a little clue of actual work.

    Btw: do you know that your 2 W/m^2 in excess at OLR, which you think is a marker demonstrating CO2’s lack of influence on climate, in fact are below OLR’s standard error?

    What, do you think, does that mean?

    Good luck Chuck Wiese.

    I’m sorry for bilybob who asked me for something far more interesting than your thoughts. I lost a lot of time with you!

    • Chuck Wiese says:

      Blindidon: No! I have lost a lot of time with you. When you are asked legitimate questions, you attack people personally and then run down your rabbit hole.

      Lets summarize.

      You and La Pangolina like to pass yourselves off as some sort of experts in everything climate but you haven’t demonstrated that here and you are full of contradiction. You and La Pangolina both have told me that you are not interested in discussing anything relating to the science of CO2,but yet, La Pangolina tries to assert she has knowledge in atmospheric science by claiming the UAH temperatures don’t match radiosonde measurements on a constant pressure surface of 600 millibars. She apparently thinks a geometric altitude is the same as geoptential height. That is wrong.

      And Now you are telling me that 2Wm-2 is below OLR standard of error. Really? Then why are published research papers being fronted on this site that disagree with your claim?

      “CERES Team 2018 table 7 satellite record 3/2000 to 9/2016: All-sky OLR increased 0.19 +/- 0.21 W/m^2/decade or about 0.3 W/m^2 in the satellite era (~1.6 decades) with a range of confidence interval that includes 0.”

      “CERES Team on all-sky albedo trend in satellite era (1.6 decades): Decrease of about 0.92 W/m^2 give or take a little.”

      Do these published researchers realize your claim of error? Apparently not. Why is that? Do you not know what you’re talking about or does the CERES team play fast and loose with their own estimates? The data published on climate4you with respect to OLR gives numbering to the nearest 1 Wm-2 and you can interpolate in between those numbers on the ordinate axis..Now why would you care about this if you don’t care to get into a discussion about the effects of atmospheric CO2? You argue this and then say you don’t care about it!

      Before I go, I have another request from you. You plotted UAHv6 satellite data over a few of he USHCNv3 stations and show they produce a trend of .19 degC/decade since 1978. What if you widen UAHv6 to include all of the Oregon sector grids so that we can measure the same trends at 2 Km where there are no surface weather stations? Could you check that and get back to me, please? One of the advantages of having satellite data over surface stations is that the grids are far more extensive than you could possibly hope to even guess at in a surface constructed network and because of this fact, they are excellent substitutes for rural zones where there are no measurements at the surface.

      • David Appell says:

        Satellite data are not as good as the surface data. One sign of this is that RSS’s LT temperature trend is about 50% higher than UAH’s LT trend.

        UAH & RSS must now correlate over something like 11 different satellites, going back to 1979. Yes, they have to determine how today’s satellite measurements compare to one 11 generations ago.

        Satellite data also require subtle adjustments for satellite drift, orbital decay, diurnal heating, and more.

        The leader of RSS thinks surface measurements are superior:

        Carl Mears, Senior Research Scientist, Remote Sensing Systems (RSS):

        “A similar, but stronger case can be made using surface temperature datasets, which I consider to be more reliable than satellite datasets….”

        http://www.remss.com/blog/recent-slowing-rise-global-temperatures

        video: https://www.youtube.com/watch?v=8BnkI5vqr_0

        • I will be using only satellite data . UAH is the gold standard for global temperatures.

        • Chuck Wiese says:

          Appell, both methods of temperature measurement can have some issues if careful attention is not given to how data is collected.

          Mears is not being honest if he believes the surface record is more trustworthy in gathering accurate temperature information given how badly the integrity of the measuring stations had deteriorated after NOAA’s MARS program converted the dedicated observing program to ASOS with badly placed Stevenson screens that were not being maintained.

          Anthony Watt’s did a intensive investigation of this and saw the deplorable state this non monitored sites had deteriorated to and this doesn’t even address how NOAA and NASA GISS have tortured the actual records through unjustifiable manipulation, cooling the earlier records and using synthesized algorithms to expand urban influence into rural areas where there are no measurements.

          https://wattsupwiththat.com/2018/03/02/alarmists-throw-in-the-towel-on-poor-quality-surface-temperature-data-pitch-for-a-new-global-climate-reference-network/

          For anyone knowing this and still claiming the surface temperature records are better than satellite’s for monitoring temperature trends is engaging in deceit or incompetent. But with you, that is nothing new, Appell, like I have demonstrated many, many times.

        • David Appell says:

          Carl Mears knows the issue far far far better than you do, Chuck.

          You don’t get to dismiss his expertise.

          UAH has made huge adjustments to their data — last time, some regions were altered more than 1 C for a month.

          https://davidappell.blogspot.com/2015/04/some-big-adjustments-to-uahs-dataset.html

          • Chuck Wiese says:

            Appell: “Carl Mears knows the issue far far far better than you do, Chuck.

            You don’t get to dismiss his expertise.”

            Me: I just did dismiss his assertions and with robust authority that Watt’s explains well.

            And blogs can be as scientific as the participants want to make them, Appell. Your idiotic reasoning always asserts that anything that isn’t published in financially vested journals that promote AGW isn’t worth considering.

            UAH has always been on the lookout for anything that can affect the accuracy of what they generate and they always correct for it. The surface temperature record as published by NASA GISS and NOAA has no such luxury. It has been shown many times and in many places how tortured and fraudulent the surface record has become, and even with the problems in measuring, nobody has done a thing to correct much of it today.

            And Nobody reads your blog Appell,so if you have something you want to show, just post it here. Your blog doesn’t have the traffic to educate anyone and I’m sure most that do decide to check it out leave after a good laugh.

          • La Pangolina says:

            Chuck Wiese says:
            July 7, 2018 at 3:09 PM

            I just did dismiss his assertions and with robust authority that Watts explains well.

            Sorry, but Watt is a former TV weather reporter.

            That he managed to setup the most visited site related to climate matters doesn’t make a climate specialist out of him.

            Nor am I a climate specialist let alone ever pretended to be one.

            There are good guest posters at WUWT, e.g. Eschenbach, Javier;
            and there bad ones too.

          • Gordon Robertson says:

            binny…”That he managed to setup the most visited site related to climate matters doesnt make a climate specialist out of him”.

            Watt is popular because he exposed the dilapidated state of surface stations throughout the States. He revealed surface stations heated by the warm exhaust of an air conditioner in one case and surface stations affected by the heat from cement in others.

            Watt is as much a climate specialist as Michael Mann, a geologist, or Gavin Schmidt, a mathematician.

          • Gordon Robertson says:

            Chuck…”Appell: Carl Mears knows the issue far far far better than you do, Chuck”.

            Appell should not be too sure of that. I am not convinced that Mears is not an alarmist at heart. I challenged him once on using reds and browns in his graphics to represent minuscule warming. More recently, he has aligned himself more closely with NOAA with the RSS average rising sharply.

            I don’t think RSS can be trusted.

          • David Appell says:

            Gordon, sometimes all one can do is laugh at you. This is one of those times.

          • JDHuffman says:

            David Appell has nothing to offer except insults and pseudoscience, as usual.

          • David Appell says:

            JD, you’re laugh too, if you were smart enough.

        • Gordon Robertson says:

          DA…”The leader of RSS thinks surface measurements are superior:”

          That’s why I think Mears is an alarmist and proof that RSS was set up to destroy confidence in UAH. How could anyone in his right mind compare fabricated surface data, that barely covers the 30% of land surface, to state of the art technology that covers 95% of the surface, including oceans?

          Surface data is deceit. It is based on discarding most of the real data and using some of it in a climate model to fabricate the discarded data. In other words, the surface quacks at Had-crut, GISS, and NOAA have taken to guessing at what they think global temps should be and have manipulated data to realize that guess.

          All of them are climate alarmists and have a political bent. That was exposed in the Climategate email scandal when several top IPCC scientists were caught interfering with peer review and adjusting time series to hide cooling. One of them, Mann, referred to that process as The Cause.

          Another one, Phil Jones, head of Had-crut, claimed he and ‘Kevin’ would see to it that skeptics’ paper would not get to the IPCC review stage. Kevin seems to be Kevin Trenberth with whom Jones is partnered as a Coordinating Lead Author at IPCC reviews.

          Another, Michael Mann, a good friend of Gavin Schmidt of GISS, has admitted to a trick in which cooling in data is hidden. Jones bragged about using the trick himself.

          The IPCC is crooked and so is the entire alarmist movement, which is in control of Had-crut, NOAA and GISS.

          Now it appears Mears is associated with that mob, which suggests RSS is just as corrupt as they are.

          • David Appell says:

            Gordon, what is your evidence of all this “cooking” going on?

            You have absolutely none whatsoever.

            You construct fantasies to please yourself.

      • La Pangolina says:

        Chuck Wiese says:
        July 7, 2018 at 9:02 AM

        1. She apparently thinks a geometric altitude is the same as geoptential height. That is wrong.

        Sorry, 640 hPa are well known as the atmospheric pressure where UAH measures 264K.

        2. All-sky OLR increased 0.19 +/- 0.21 W/m^2/decade or about 0.3 W/m^2 in the satellite era (~1.6 decades) with a range of confidence interval that includes 0.

        I was sure you wouldn’t understand because you think of the CI of the increase and not of that of the OLR itself…

        https://tinyurl.com/yd429kr8

        And btw: what, do you think, does the bolded text exactly mean, Chuck Wiese?

        Any idea?

        3. You plotted UAHv6 satellite data over a few of the USHCNv3 stations and show they produce a trend of .19 degC/decade since 1978. What if you widen UAHv6 to include all of the Oregon sector grids so that we can measure the same trends at 2 Km where there are no surface weather stations?

        3.1 No, Bindidon has the USHCRN record too but doesn’t use it. The data was obtained out of GHCN V3. This something different.

        3.2 See

        http://www.drroyspencer.com/2018/07/summer-causes-climate-change-hysteria/#comment-310856

        All you need is in it.

        • Gordon Robertson says:

          binny…”I was sure you wouldnt understand because you think of the CI of the increase and not of that of the OLR itself”

          The use of a confidence level tells you immediately that results are statistically derived. If the observation had been real, the data would have an error margin.

          A CL is a guess (probability), an error margin is an estimate of error from a real measurement.

          • La Pangolina says:

            Gordon Robertson says:
            July 7, 2018 at 4:18 PM

            … with a range of confidence interval that includes 0

            As usual: Robertson shows how incredibly ignorant and pretentious he is.

            Learn, Robertson, learn instead of writing your boring nonsense.

          • David Appell says:

            Gordon Robertson says:
            A CL is a guess (probability)….

            Gordon, Gordon, Gordon…. you are just so dim.

            Everytime.

        • Chuck Wiese says:

          La Pangolina: ” Sorry, 640 hPa are well known as the atmospheric pressure where UAH measures 264K.”

          1) Me : UAHv6 or any other they have had does not “measure” 264K at 640 millibars. That is a calibration point of some sort that is based upon a standard earth atmosphere. In the real world,640 hPa will seldom have 264K temperature associated with it because of the horizontal advection of temperature and mass within the system. But from this static assumption and weighting function, the difference in spectral radiances from a profile to reality can allow their algorithm to calculate a 2 Km temperature.

          The fact that radiosonde balloons do not agree with a static atmosphere at that pressure is to be expected because it is only a reference point. You don’t comprehend this at all if you think that just because of the differences that their algorithm cannot be accurate. And you seem to have already forgotten that you just ran sector grids of UAH data for the points in Oregon placed above these surface sites at 2Km and calculated an identical trend. So your point in all of this would be??

          La Pangolina:”I was sure you wouldnt understand because you think of the CI of the increase and not of that of the OLR itself”

          2.) Me: No! My figure of 2 Wm-2 is a change of OLR from a starting point in the satellite record to the end. If you claim the margin of error in the instrument is at least 2 Wm-2, then claiming that erases my point is wrong. The margin of error in the instrument carries to any absolute value displayed on the graph. So the delta is identical to the delta’s used in developing the CI’s in those examples I gave you. There is a difference between stating any absolute value is correct if the margin of error is 2 Wm-2 versus stating the 2Wm-2 is a difference between two absolute values which is what I used.

          And what’s the point in bringing up the bold text CI of zero? All it means is the authors had good statistical data whose CI interval would have to drop to 5% CI or less not be significant. Are you trying to lecture statistics now to try and obscure that you’re wrong about concerning the meaning of what I said?

          La Pangolina: “3.1 No, Bindidon has the USHCRN record too but doesnt use it. The data was obtained out of GHCN V3. This something different.”

          3) Me: OK. Fair enough. So are you going to generate a graphing of UAHv6 for all of the Oregon sectors like I asked you to do and link it from here like you did with the Salem data?

          By the way, your comment about Anthony Watt’s is ridiculous. You follow the examples of the incompetent David Appell to a tee. Through your myopic lens, nobody is qualified to write about climate, atmospheric science or weather unless they are “designated” by some bogus self proclaimed “authority” that labels all the proponents of this rot “climate scientists”. Do you know what one is? In researching backgrounds like Gordon Robertson did and I have found, they could be just about anybody as long as they have the blessing of the AGW cult.

          • Chuck Wiese says:

            La Pangolina: And before you go off on a lark and claim that if a margin of error in an OLR instrument is 2 Wm-2 or greater that this can invalidate a delta of 2 Wm-2, then if you’re going to assume it does, then the same would apply to the CERES data. It makes no sense if what you claim were true that any delta to an absolute value of OLR much smaller than 2 Wm-2 or outside the bounds of instrument accuracy is valid either, which the CERES team measured as deltas smaller by an order of magnitude. So it doesn’t matter whether they have a good sampling of data that could make their CI good to include zero. If the sampling falls inside the margin of error of the instrument, then the samples are worthless.

            This is a better way to describe what I’m getting at and is why it is very unlikely that Blindidon is correct about a 2 Wm-2 margin of error. Better put, if CERES can claim accuracy to an order of magnitude smaller than 2 Wm-2, my delta is certainly correct. If it isn’t, then CERES is way off and I doubt they would calculate in this manner.

          • David Appell says:

            Did CWiese ever provide the source for his claim of 2 W/m2?

            You really have to hound him about where his data are coming from.

          • Chuck Wiese says:

            Appell, I have already given the source of the data. It is posted on climate4you.com. All of the graphs were prepared by Dr. Ole Humlum and his associates.

            The spectrally integrated OLR is higher today than it was at the start of the satellite record in 1979. It appears up by 2 Wm-2 at the end of this record in 2010 and the dips in the graphs are from well known events such as the Pinnatubo eruption and the 1998 super El Ninio. These graphs end at 2010 but the CERES data shows no trend to slightly up over the record since.

            Take your pick. Bottom line is the OLR is supposed to be in a deficit by 3 Wm-2 from the effective OLR temperature according to failed model RCP8.5, so the excuses offered up by Donohoe et.al are just an affirmation that the models don’t work and now they realize that increased solar energy is driving the warming and then have a silly excuse that the reason for this was that CO2 radiation is melting the snow and ice. This is just absurd and over the top. The snow and ice records do not support this.

            But you would accept this, Appell, because that is what you do. You defend the indefensible. If the global temperatures begin to decline as a result of the deceasing solar magnetic, you will chase that down another rabbit hole and claim either CO2 is causing this or that if it weren’t for the sun driving the climate colder, the planet would burn up and will as soon as we come out the other side because of CO2.

          • Chuck Wiese says:

            And in case you can’t figure out what that means, Appell, Rcp8.5 is claiming an IR imbalance at TOA of 3 Wm-2 right now. The effective emission is 240 Wm-2, so on these graphs I reference, blocking the 10 micron window reduces this by 8.37 Wm-2. So the baseline on the graph is 231.37 Wm-2 The last measurement was 233 Wm-2, so the difference to the effective emission is 1.67 Wm-2.

            But the failed modeling claims the OLR should be down 3 Wm-2 from the baseline. The difference is 4.67 Wm-2. No winder Gavin and all the modelers are scurrying for answers. They look as silly as they are with this claiming CO2 warming defers to solar forcing from an unsupportable assertion that the snow and ice albedo explains it.

            What crap!

          • Chuck Wiee says:

            A slight correction, Appell. I calculated the BB emission temperature of 255K as 239.74 Wm-2 and accidently rounded that to 240 Wm-2.

            My bad. But everything else in order.

          • David Appell says:

            CWeise – you can’t quote 5-digit accuracy from numbers with < 5 digits.

            Didn't you learn that in Science 101?

          • David Appell says:

            CWeise wrote:
            And in case you cant figure out what that means, Appell, Rcp8.5 is claiming an IR imbalance at TOA of 3 Wm-2 right now.

            So what?????????????????????????????

            RCP8.5 isn’t trying to model reality. No RCP is.

            THEY’RE ASSUMPTIONS about the future. As such, not one of them will come true. Not one. Just as not one of Hansen’s projections came true. Which is why that has to be taken into account when looking at his model projections. Something you utterly failed to understand during the debate — and still do fail to understand.

            SCIENTISTS CAN’T READ THE FUTURE.

          • David Appell says:

            Chuck Wiese says:
            Bottom line is the OLR is supposed to be in a deficit by 3 Wm-2 from the effective OLR temperature according to failed model RCP8.5

            Says who?
            In what paper?
            Provide a citation to that paper.
            Quote the paragraph that says what you claim.

            Waiting.

          • David Appell says:

            David Appell says:
            Did CWiese ever provide the source for his claim of 2 W/m2?

            No, he did not.

            CWeise just throws out claims and expects everyone to bow down to him, the oracle.

            Start providing some science, CWeise, or shut up and go back to the raw denierland blogs like EdBerry and WUWT where you are comfortable and take on no risks.

    • Gordon Robertson says:

      binny…”If I wasnt so lazy, I would go into the model customisation corner this genial KNMI climate explorer, and I could then show you what you have to do there to gat a little clue of actual work”.

      You are seriously deluded. Models incorporate pseudo-science to get their results. They assign an arbitrary value to CO2 warming and include a positive feedback that cannot exist in our atmosphere.

      You are likely referring to the model fudging done by NOAA in which they divide the globe into cells which they cannot possibly fill with real data. So, they invent data by any means available, using interpolation, assumption, and homogenization in models. They even alter data retroactively simply because they think it is wrong.

      You talk about scientifically educated people. NOAA, Had-crut, and GISS have abandoned science, replacing it with ego and consensus. They are cheaters, as revealed in the Climategate email scandal. They have no interest in doing science, their goal is the political confirmation of anthropogenic warming.

      Mann, who runs realclimate with his buddy Gavin Schmidt, who is head of GISS, was seen to interfere with peer review in the Climategate emails. He referred to their beliefs as ‘The Cause’ while denigrating Judith Curry for speaking against The Cause. He was involved in snipping proxy data off a time series that was showing cooling and splicing in real data.

      You can call these clowns scientifically educated and I claim that only proves the scientific education of people does not ensure integrity or good science.

      • La Pangolina says:

        Gordon Robertson says:
        July 7, 2018 at 4:06 PM

        Models incorporate pseudo-science to get their results.

        As usual: Robertson shows how incredibly ignorant and pretentious he is.

        Learn, Robertson, learn instead of writing your boring nonsense.

        *

        You can call these clowns scientifically educated…

        Months ago, Robertson, I called you a clown.

        But I stopped to do that, because I felt that calling you a clown in fact would insult all clowns, who – as opposed to you – are mostly intelligent persons.

        For a similar reason, J.-P. stopped to call you a troll.

      • David Appell says:

        Gordon Robertson says:
        Models incorporate pseudo-science to get their results.

        Gordon, point out the pseudo-science in these models for us:

        NASA GISS GCM Model E: Model Description and Reference Manual
        http://www.giss.nasa.gov/tools/modelE/modelE.html

        “Description of the NCAR Community Atmosphere Model (CAM 3.0),” NCAR Technical Note NCAR/TN–464+STR, June 2004.
        http://www.cesm.ucar.edu/models/atm-cam/docs/description/description.pdf

        • Mike Flynn says:

          From NASA GISS –

          “Model development is an ongoing task. As new physics is introduced, old bugs found and new applications developed, the code is almost continually undergoing minor, and sometimes major, reworking. Thus any fixed description of the model is liable to be out of date the day it is printed.”

          New physics? Old bugs?

          These dummies can’t even get their game developed to the point where they can actually describe it!

          Just like the GHE.

          Fumbling bumblers – they can’t even get to the pseudoscience stage with their computer game. At least astrologers are consistent – no new physics used as an excuse for inability to predict the future.

          The climate will no doubt continue to change whether Schmidt and Mann like it or not.

          Cheers.

          • JDHuffman says:

            Mike Flynn, David Appell lives on AGW pseudoscience. It’s somewhat analogous to a fly larvae feasting on a dead carcass.

            You’ve just sprayed insecticide all over his “papers”.

            As you might say, “carry on”.

  79. AGW does not exist that is what those of you who are so into this do not understand. Further the warming that did take place was all natural and it is coming to an end this year.

    Solar rules the climate not AGW.

  80. To set the record straight David and others.

    If you look at my website climatebusters.org which I did 5 years ago or so and look at the overview page, you will find the following:
    I list the low average value solar parameters I think are needed to cause global cooling following x years of sub solar activity in general(changed it shortly after to 10+years). Then it says IF these low solar parameters ARE THE RULE going forward for the remainder of this decade expect global cooling.

    The problem or reality is the low average value solar parameters that I called for necessary to cause global cooling did not even come close to being realized until very late year 2017.

    So according to what I said I would not expect global cooling because the low average value solar parameters which I said are necessary for cooling did not come about until late 2017.

    By the same token now that the two solar conditions I stated are necessary for cooling have arrived that I had called for, I am expecting global cooling with year 2018 being the transitional year and cooling thereafter. I put myself on the line and I also said if it does not happen now I will be WRONG. No excuses.

    For GOLDMINOR and others my theory is DIFFERENT from all others in the following ways.

    1. I list specific low average value solar parameters necessary for cooling.

    2. I list the number of years needed for sub solar activity in general necessary for cooling.

    3. I am just one of the few that states that when the geo magnetic field is in sync with solar like it is now it will compound given solar effects.

    4. I am one of a few that says there is a solar /explosive volcanic connection and a galactic cosmic ray /cloud coverage connection not to mention UV light overall oceanic sea surface temperature connection.

    5. I have the confidence to say 2018 is a transitional year to cooling. Who else has?

    • Myki says:

      SDP, you are a legend !
      You will forever be remembered for your efforts but, sadly, not for your successes.
      I am sure you could keep going for a hundred more years, trying and failing until you got one right. By then, nobody will be listening.
      Tragic!

      • My web-site and what I said on it is all the prove I need. That is why it is good to have a web-site because you can back up what you said and when you said it.

        If you don’t accept those facts that is your problem.

        Also the trends are down not up so far this year, which is the only year that matters for me because this is the year my solar conditions have been met.

        • Myki says:

          I’ve just looked at the difference in sea surface temperatures between June and May:
          http://www.bom.gov.au/products/IDYOC049.shtml
          I don’t see much in the way of downwards trends.
          What glasses are you wearing?

          • Myki says:

            Also, note the warming in the eastern equatorial Pacific. That could be important.

          • You have to go back to last summer. Then the deviation for overall sea surface oceanic temperatures was around +.35c now we are around a deviation of +.165c or so that is a significant down trend.

          • Myki the ocean as a whole is what matters not one region over the other although certain regions due exert a larger influence on the climate due to geographical location .

          • Myki says:

            How about changes over the past 3 months?
            Check out the sub-surface anomalies along the equator.
            http://www.bom.gov.au/cgi-bin/wrap_fwo.pl?IDYOC007.gif
            Almost all cool anomalies have disappeared.
            The chances of an el nino are increasing as we post.

          • Myki what happens underneath does not matter it is what happens on the surface that counts. If El Nino comes it is going to be very weak at best, and is not going to raise global temperatures.

            Even if it did it does nothing to further AGW.

            Overall sea surface temperatures are what counts.

            That aside I wonder what you will think if the global temperatures
            which are trending down this year continue moving forward?

            In other words is there a degree of magnitude change and or duration of time of a global temperature/oceanic sea surface temperature change that would make you doubt AGW?

            I said for my part that if global temperatures continue to rise now- next few years that AGW will be stronger then ever and on pretty firm ground right or wrong.

            What do you say it the opposite should happen? I am curious.

          • Myki says:

            “Myki what happens underneath does not matter it is what happens on the surface that counts.”
            WRONG

            “If El Nino comes it is going to be very weak at best”
            YOU HAVE ABSOLUTELY NO WAY OF KNOWING THIS

            ” and is not going to raise global temperatures.”
            YES IT WILL. AT LEAST FOR A YEAR.

  81. JDHuffman says:

    I hope everyone checks out the link provided above–3rd paragraph, “memo”.

    Amazing agenda-driven propaganda!

    • David Appell says:

      How do you suppose Roy feels about Koch money in politics and advocacy groups? Scaife money? The Mercers? Peabody Coal?

      • JDHuffman says:

        David Appell, you would have to ask him.

        Then, you might want to reveal your sources of income.

        Probably not, huh?

        • David Appell says:

          Inconvenient questions for you. Deniers are full of them. (Although you’re clearly too unknowledgeable for anyone to be paying for your replies here).

          Me? Payment to comment anywhere = $0.

  82. Mike Flynn says:

    And on and on it goes.

    Amazingly, still no scientifically described GHE to be seen – which means that a disprovable hypothesis purporting to explain something non-existent is a fantasy.

    Carry on, chaps – blather about “data”, and “evidence” – supporting a non-existent GHE?

    Pseudoscience writ large. An endless series of gotchas, endless appeals to authorities in the form of “pay to publish” articles. No reproducible physical experiments – just an endless list of excuses why normal scientific methods don’t apply to “climatology”!

    Delusion piled on fantasy! Good for a laugh, but little else.

    Cheers.

  83. Chuck Wiese says:

    Mike: So sadly true. And because this is all taxpayer money driven by selling hysteria through media to scare the public with, makes it so disgusting.

    The Gavin clowns don’t get paid by politicians to tell the world everything is just fine. They lose their funding if that were so.

    That’s why I call climate models the “Oz” machines. All magical, shrouded and protected with claimed sophistication that doesn’t exist. But who are we to say? How dare we challenge the great and powerful Oz!

    It is easy for Toto’s realists to expose Oz as is being done, but Oz extends to the puppet masters of the politicians that control them and are mutually conflicted. This is a difficult bond to break, but it is purely political. Gavin relies on the funding of media blitzes and public education brainwashing of our youth to make it even more difficult to break the political bond.

    It is as rotten as it gets. Unbelievable stink!

    • Myki says:

      What sore losers!
      Reminds me of the wicked witch:
      “Ohhh… You cursed brat (scientist) ! Look what you’ve DONE! I’m melting! Melting! Oh… What a world, what a world! Who would have thought a good little girl like you could destroy my beautiful wickedness?!”

      • Mike Flynn says:

        Myki,

        Only the stupid, ignorant or truly deluded believe that facts have “winners” or “losers”.

        Which are you?

        What is being “lost”? What is being “won”? There is not even a contest!

        There is no GHE. If there was, someone could no doubt describe it. The GHE is a more mythical entity than a unicorn – the mythical unicorn has at least been described – unlike the GHE.

        Keep “winning” all you like. Nature doesn’t care.

        Cheers.

    • Norman says:

      Chuck Wiese

      I have been reading some of your interactions on this blog. You are a meteorologist and would have good knowledge of atmospheric physics.

      The problem is that it seems you point of view is tainted by a Conspiratorial World View. You are assuming that a conspiracy of power and profit is in place (which could very well be the truth) and it will bias the scientific part of your mind.

      I approach climate change from the scientific view point. What does the actual science show. The scientists have daily measurements of DWIR. It is something that empirically exists. Some posters torture science and come up with made up reality that this radiation cannot be absorbed because they hijacked the 2nd Law of Thermodynamics into a version no one ever claimed and try to force this terrible science upon all those who have not got a good grasp of science.

      I have debated for a long time that Skeptics need to keep the science real and not make up their own versions. They do not accept this and continue to make the Skeptic world look like scientific illiterates peddling made up physics as if it were correct.

      http://lidar.ssec.wisc.edu/papers/dhd_thes/img47.gif

      In the linked graph you can see that CO2 (along with H2O) are emitting IR down to the Earth’s surface. If you increase the amount of CO2 this amount increases a bit. The man you debated has linked to empirical measurements carried out over several years to show a slight increase in the DWIR from increases in CO2.

      There are other factors that also effect global temperatures. CO2 is a background constant source of added IR.

      • JDHuffman says:

        Norman, if you believe CO2 is emitting “down”, it would also be emitting “up”.

        “Up” goes into space, never to return, and “down” has little ability to heat the surface, at CO2 wavelengths.

        Are you letting your biases affect your “science”?

        (And why are you still hiding your last name, Grinvalds?)

        • Nate says:

          JD/Ger*an,

          You are still criticizing people for being anonymous? When you were anonymous for so long here as Ge*ran, and still are on other blogs?

          Wait, isn’t that hypocrisy at its finest?

        • Norman says:

          JDHuffman

          Ger*an I like just using my first name. I assume Nate is doing the same. Why are you obsessed with knowing the identity of every poster? It really does not matter, I don’t know you personally and you don’t know me. People who know me address me by my first name.

          The CO2 down does not “heat” the surface. It is energy that is received by the surface added to the other energy the surface receives. Primarily solar input, some geothermal. The use of the term “heat” distorts the reality of IR energy emitted by CO2.

          The CO2 is emitting up as well as down. I am not sure how that point affects any conditions of the surface energy balance.

          CO2 contributes from 10 to 20% of the DWIR flux depending upon the water vapor content since the emitting wavelengths overlap. The average DWIR is 340 W/m^2 so CO2 would contribute from 30 to 60 Watt/m^2 energy to the surface. So the contribution is not large but the addition does have an effect. Scientists have some numbers for the increase in DWIR from additional CO2. It is small 0.2 W/m^2 per decade but it is detected.

          https://andthentheresphysics.wordpress.com/2015/02/26/co2-forcing-observed-from-surface/

          • JDHuffman says:

            Norman, using your real name helps to prevent irresponsible comments. People that hide their identity often have little regard for accuracy. Now that you have revealed your full name, you seem much more concerned about correcting and clarifying your words.

            1) Thanks for admitting that CO2 does not “heat” the surface.

            2) Thanks for admitting that infrared from CO2 is emitted to space. As you don’t understand the significance of that, it means that CO2 is cooling the planet.

            The only criticism might come from David Appell, who tried to teach you upthread that a blog is not science. So, he would declare your link irrelevant, as well as his own blog.

          • Norman says:

            JDHuffman

            YOUR POINT:
            “2) Thanks for admitting that infrared from CO2 is emitted to space. As you don’t understand the significance of that, it means that CO2 is cooling the planet”

            Not actually. CO2 emits to space but it also emits to the surface. If you stripped the atmosphere with the current Earth surface temperature, an average of 390 W/m^2 would be leaving the surface.

            With GHG present the surface emits only about 40 W/m^2 to space directly. The rest of the 350 W/m^2 is all absorbed. CO2 absorbs between 10 and 20% of the UPIR (overlap from water vapor that also absorbs at some CO2 wavelengths).

            Since the CO2 is emitting from a much colder region, it is not emitting nearly as much energy to space as it is emitting to the surface. So it would not be cooling the planet at all. Having an atmosphere forces the planet surface to a higher steady state temperature than without one.

            So in 2, compared with a non GHG atmosphere (or even no atmosphere) CO2 does not cool the planet. Hopefully you think about it and you will see what I am stating.

          • JDHuffman says:

            Norman, infrared from CO2 that goes to space results in COOLING the planet.

            CO2, at any altitude, would be emitting in all directions. It does NOT quit emitting less to space just because it is at a colder elevation, as you stated:

            “Since the CO2 is emitting from a much colder region, it is not emitting nearly as much energy to space as it is emitting to the surface.”

            You want to believe that, but “wanting to believe” is not science.

          • Norman says:

            JDHuffman

            My statements are not “beliefs” they are actually based upon empirical measured values.

            Here is the measured downwelling IR. Note the Y-axis. Both use the same units so they are an apple to apple comparison.

            http://patarnott.com/atms749/images/MeasuredRadianceReno.jpg

            You can see that it emits at a 130 scale number on this graph

            Here is the outgoing emission from CO2
            http://lasp.colorado.edu/~bagenal/3720/CLASS5/EarthBB.jpg

            It is around 50 on the same scale of units. I am not sure why you think it is my “belief” and that my correct information is wrong.

            I am posting science (empirically measured values) yet you claim this is not science. What is the basis of your declaration?

            The gas emits IR based upon its concentration and temperature. Colder gas will emit less IR even at the same concentration. This is very well established physics and even used in actual applications.

          • Norman says:

            JDHuffman

            You are not trying to understand my point. If you compare the energy emitted by CO2 at the TOA with the IR emitted by the surface, in the same wavelengths, the flux from the colder CO2 is less than the surface emission by a significant value.

            The point is that having CO2 is lowering the amount of energy leaving the Earth system. Energy leaving is an overall cooling but it is less cooling rate with CO2. CO2 does not cool the surface, its emission from higher up cools the atmosphere. CO2 forces the surface to higher temperatures than if you removed all of it. You would have 30 to 60 less W/m^2 of energy reaching the surface. This energy would leave directly and you would have a large atmospheric window. The cooling would be greater.

            If you compare Earth with CO2 vs Earth without any CO2 then you claim that CO2 cools the planet is wrong. The Earth would be colder with no CO2. If you have CO2 added the Earth temperature is warmer so how does CO2 cool the planet? The IR would be lost one way or the other (either direct surface emission to space). With CO2 present less IR goes directly to space.

          • JDHuffman says:

            Norman Grinvalds, you seem to be in denial of your own statements.

            At 2:12pm, you tried to distract with links.

            At 2:22pm, you tried to distract by claiming Earth would be colder without CO2. We can check that false belief by looking at the Moon. “Daytime” temperatures there can reach well over 100 C. Temperatures can’t get that hot on Earth because of the atmosphere.

            Your believes continue to get you in trouble:

            Since the CO2 is emitting from a much colder region, it is not emitting nearly as much energy to space as it is emitting to the surface.

            You’ve tried distractions and false accusations. What’s next, insults and attacks?

          • David Appell says:

            JDHuffman says:
            Norman Grinvalds, you seem to be in denial of your own statements.
            At 2:12pm, you tried to distract with links.

            You mean distract with evidence and support for one’s claims?

            Yes, I can see how that might annoy you.

          • JDHuffman says:

            David Appell, Norman was trying to distract from dealing with his erroneous statement:

            “Since the CO2 is emitting from a much colder region, it is not emitting nearly as much energy to space as it is emitting to the surface.”

            Hopefully you will not be annoyed by this assistance with your reading comprehension, such as it is.

          • JDHuffman says:

            DA, you’re still having trouble with reading comprehension, I see.

          • Norman says:

            JDHuffman

            You are using a Mike Flynn tactic.

            YOU: “At 2:22pm, you tried to distract by claiming Earth would be colder without CO2. We can check that false belief by looking at the Moon. Daytime temperatures there can reach well over 100 C. Temperatures cant get that hot on Earth because of the atmosphere.”

            Your point is not valid. I said the Earth not a location or region at a given time. There are average temperatures of planets that take in all the surface temperatures. The Moon’s average temperature is much colder than the Earth’s (surface). The Moon reaches a higher daytime temperature but has a far colder night-time temperature. The average of these makes the Moon’s surface much colder than the Earth’s.

            You are intentionally trying to annoy. Why? My statements are valid and correct and empirically proven. You are, in actuality, a disruptive troll. I still have strong opinion that you are the poster that went by Ger*an in the past and hiding your identity by avoiding “hilarious”.

          • Norman says:

            JDHuffman

            I am getting tired of trying to reason with you.

            YOU: “Your believes continue to get you in trouble:

            Since the CO2 is emitting from a much colder region, it is not emitting nearly as much energy to space as it is emitting to the surface.

            Youve tried distractions and false accusations. Whats next, insults and attacks?”

            It is not a belief. It is a factual statement supported by actual data.

            CO2 emits much more energy to the surface (since the emitting CO2 is warmer and denser) than it emits to space. It is a factual reality. Calling it a “belief” of mine is not a supported conclusion. Making statements, like you do, without supporting evidence is a disruptive troll tactic. You are not even attempting to correct it.

            That is why I have even stronger opinions that you are the troll Ger*an. This poster would make comments. I asked him for supporting evidence, he never provided any. You do exactly the same thing. You make unsupported declarations and will not support them even when asked to.

            So find evidence to prove my claim wrong. Find evidence that shows Carbon Dioxide, in the atmosphere, does NOT emit more IR to the surface than it emits to space. If you make declarations that I am wrong and attempting to distract, then find evidence to support such claims. Ger*an why don’t you just stay on PSI site. They like you there.

          • JDHuffman says:

            Norman Grinvalds, you get tangled up in your own confusion to the point no one can straighten you out. You did this same thing when you could not understand that radiative fluxes generally do not add.

            A layer of CO2, say at 5 km elevation, would actually emit MORE infrared to space than to the surface, due to the geometry. At lower elevations, the emissions “up” and “down” would approach equality.

            You’re so confused, you are distorting science to match your confusion.

          • Chic Bowdrie says:

            David Appell,

            “You mean distract with evidence and support for one’s claims?”

            No, JDHuffman means distract with links that mislead people stuck in the erroneously simplistic GHE hypothesis mentality. This is exactly what you do. Posting links that waste people’s time by providing irrelevant or incomplete information. Throwing everything at the wall to see if it sticks.

          • Norman says:

            JDHuffman

            Why in the world would you do a selective amount of IR emitted from 5 KM up and down and try to prove that CO2 emits more IR to space than the surface. A very pointless argument. I haven’t go a clue why you are doing it, it is just disruptive troll tactics. It has no bearing at all on what I am saying. It is really an ignorant point. It is unlikely any of the IR emitted from 5 KM up will make it to the surface, it will be absorbed.

            The CO2 near the surface is emitting IR downward at a much higher rate than the CO2 at the TOA is emitting IR to space.

            The empirical data shows this. You point is just basically stupid and troll like. You are a complete waste of time.

            I did not want to communicate with you and now I know why. You have zero desire to discuss ideas. You only want to disrupt. Just a troll I think you are Ger*an come back. You do exactly the same things as he did. Stupid points that have no meaning. Never support you claims.

          • JDHuffman says:

            Norman Grinvalds, my “5 km” example clearly demonstrated you were wrong. You refuse to accept the simple evidence. You’d rather try to compare me to Gordon Robertson, Mike Flynn, or Ge*, trying to discredit me. You are obsessed with trying to discredit science. You hold to your beliefs, and anyone that tries to help you gets attacked, insulted, ridiculed, and falsely accused.

            (BTW, I am honored to be compared to other skeptics.)

          • Norman says:

            JDHuffman

            Do you lack logical thought process or are you just trolling?

            Your point about 5 KM is horrible and has nothing to do with my point at all.

            YOU: “A layer of CO2, say at 5 km elevation, would actually emit MORE infrared to space than to the surface, due to the geometry. At lower elevations, the emissions up and down would approach equality”

            And so? It is not what I am saying. It is an irrelevant point. Why do you persist in such stupid behavior? You don’t need to.

            YOU: “Norman Grinvalds, my 5 km example clearly demonstrated you were wrong. You refuse to accept the simple evidence.”

            NO! It does nothing to prove me wrong. It only proves you are a disruptive troll who cares little about truth or science. How does you stupid point prove I am wrong?

            CO2 emits from all molecules in the atmosphere. Those closest to the surface are emitting much more energy to the surface than the ones at the TOA are emitting to space. Are you really that hopelessly stupid you are not capable of understanding this simple reality? Wow!

            Also you never proved at all fluxes don’t add, you only proved you are not very intelligent and a waste of time.

            It you take Snape’s cube from the other thread. You have each side exposed to a different flux. The cube is made of very conductive material so the energy will smooth out. You add each flux that each surface receives to figure out how much energy the overall cube absorbs. It is actually that way. I am sorry you are not bright enough to understand it.

          • JDHuffman says:

            NG, now as predicted, the insults, attacks, and false accusations begin.

            In addition, you have resorted to one of your tricks. You’re denying what you said is what you said!

            “Since the CO2 is emitting from a much colder region, it is not emitting nearly as much energy to space as it is emitting to the surface.”

            Clearly, you were talking about CO2 all in the same region. You clearly got it wrong. But, instead of admitting your mistake, you try to make it look like you were referring to two different elevations.

            Insults, attacks, false accusations, and tricks all symptomatic of a failed belief system.

            And, fluxes don’t add, just as temperatures don’t add. But, maybe if you really, really believe, and tell yourself, over and over….

          • Norman says:

            JDHuffman

            You take my words out of context. You are a disruptive troll. You know you are taking them out of context. They are a portion of a longer explanation. You are just a stupid jerk. I am done talking to a low idiot disruptive troll. Please never respond to any of my posts. Go away and bother someone else Ger*an.

          • JDHuffman says:

            Grinvalds, you’re still playing tricks. I did not take your quote “out of context”. That quote was the first sentence of the paragraph where you tried to bend science to fit your beliefs. You were trying to “prove” that CO2 could heat the surface. You got caught, and then you became belligerent.

            Here are some rules to practice, if you don’t want to trigger responses correcting your comments.

            1) Don’t insult others, unless they insult you first.

            2) Don’t bend reality to fit your beliefs. Bend your beliefs to fit reality.

            3) When you make a mistake, admit it and move on. Don’t use tricks.

            Hopefully your comments will show drastic improvement.

            (I still think you have a cool surname.)

          • Norman says:

            JDHuffman

            Obviously you seem to want to keep communicating.

            YOU: “Grinvalds, you’re still playing tricks. I did not take your quote “out of context”. That quote was the first sentence of the paragraph where you tried to bend science to fit your beliefs. You were trying to “prove” that CO2 could heat the surface. You got caught, and then you became belligerent.”

            I was NOT trying to “prove” CO2 could heat the surface. You take it out of context of what I was talking about in a larger context.

            Because I noticed you were not understanding my point I explicitly came out and told you what I was saying. The sentence was not a mistake or wrong, but it was not fully complete for your understanding so I actually posted to clarify the content of the sentence. The reason I call you a disruptive troll is because I did actually further explain it because I realized you did not get my point. Why do you ignore this?

            Here if you missed it:
            http://www.drroyspencer.com/2018/07/summer-causes-climate-change-hysteria/#comment-311281

            I will help you here:

            With my sentence: “Since the CO2 is emitting from a much colder region, it is not emitting nearly as much energy to space as it is emitting to the surface.”

            It may not be the best written sentence. I will clarify with better words.

            Since the CO2, at the TOA, is emitting from a much colder region, it is not emitting nearly as much energy to space as the CO2, near the surface at a much warmer region, is emitting to the surface. \

            The CO2 is the same in the atmosphere (which is implied in my sentence but not specifically stated).

            It is all the same gas just in different locations. Colder locations are emitting less IR. The IR emitted to space is from the cooler regions so the CO2 is emitting less energy to space than the CO2 near the surface emits toward the surface.

            This should clarify it for you. I will agree it was not a really well written sentence. I think with further reading of comments and looking at the linked graphs, you knew exactly what I was claiming and just pretend that a poorly written sentence means I am wrong. I am still right about the physics.

          • JDHuffman says:

            Well Grinvalds, you’re doing better. You’re no longer ruthlessly defending your statement, in fact, you’re backing away from it:

            “It may not be the best written sentence.”

            “I will agree it was not a really well written sentence.”

            You didn’t apologize for all your attacks, but at least there were no new ones.

            I think we can use the word “progress” here.

      • Chuck Wiese says:

        Norman: I have tried to reply to you three times now on the topic of radiation and just like when I did this with Gordon Robertson, the posts do not go thru.

        I have save them all and so I have to defer to Roy Spencer and ask why this is happening.

        What’s wrong with my replies about radiation and why do they not post here when everything else does, Roy?

        • La Pangolina says:

          Chuck Wiese says:
          July 8, 2018 at 10:52 AM

          Whats wrong with my replies about radiation and why do they not post here when everything else does, Roy?

          Did you check for appropriate separation of
          – d c letter sequences
          – absorp tion

          Especially links to NOAA NCD C pages are a problem, what led many of us to tinyURL these links :-))

      • Chuck Wiese says:

        Norman: “The problem is that it seems you point of view is tainted by a Conspiratorial World View. You are assuming that a conspiracy of power and profit is in place (which could very well be the truth) and it will bias the scientific part of your mind.”

        Me: Not correct. You provided a nice graph that looks impressive when you look at the wavenumber that surrounds atmospheric CO2. ( Center of Q branch at 660cm-1). Any yes, looking at the sky which the plot does shows the surface completely opaque from the downwelling IR. And so as you add more CO2, the wing lines at the edges ( R & P ) become more opaque to surface radiation and the modelers who hijacked atmospheric science claim the result from this will cause warming. They accomplish this by generating a positive feedback with water vapor and increase opacity there at the many wavenumbers that H2O absorbs and emits IR from.

        Continued below.

        • Chuck Wiese says:

          Norman: Breaking my response up into smaller portions isn’t working either.

          Roy, what’s going on here? These posts are no larger than any other that successfully go thru.

          • JDHuffman says:

            Chuck, some commenters have found certain combinations of letters that do not work here. For example, never use “C” immediately after a “D”. Also, ab-sor-p-ti-on does not work, without the hyphens.

            There may be other examples I am not award of.

          • JDHuffman says:

            aware!

          • David Appell says:

            Norman, you’re right. When things don’t go CWeise’s way, he falls back on his excuse of last resort: a long-term global conspiracy.

            He thinks people are faking it.

            From that I can only conclude that CWeise would ALSO fake it to get ahead in his job. CWiese thinks that’s the way to get ahead.

            He’s retired now, I heard — I wonder how much faking it led to a higher pension for him.

        • Chuck Wiese says:

          Norman: “The problem is that it seems you point of view is tainted by a Conspiratorial World View. You are assuming that a conspiracy of power and profit is in place (which could very well be the truth) and it will bias the scientific part of your mind.”

          Me: Not correct. You provided a nice graph that looks impressive when you look at the wavenumber that surrounds atmospheric CO2. ( Center of Q branch at 660cm-1). Any yes, looking at the sky which the plot does shows the surface completely opaque from the downwelling IR. And so as you add more CO2, the wing lines at the edges ( R & P ) become more opaque to surface radiation and the modelers who hijacked atmospheric science claim the result from this will cause warming. They accomplish this by generating a positive feedback with water vapor and increase opacity there at the many wavenumbers that H2O absorbs and emits IR from.

          The problem with this is that it is nonsense. Incompetent arm chair experts like David Appell and many others use this claim because Appell thinks GHG’s warm the atmosphere directly by absorbing surface IR. They don’t. The ab-sor-p-ti-on coefficients of both constituents are very large so that what is ab-sorb-ed is re-emitted through the radiatve transfer equation. The surface radiation does not thermalize as people like Appell claim. It simply gets completely ab-sorb-ed and the GHG’s block its emission to space. That slows surface cooling rates and gives a surplus temperature of 33 degC when solar insolation is added in.

          So what does this mean? It means much of the GHG’s radiate at their own local temperature once the surface emission is ab-sorb-ed and COOL the troposphere in exchange for a warmer surface. This enhances both dry and moist convection from the surface to give the realized surface warming back to the troposphere. But that becomes a NEGATIVE, not positive feedback on water vapor because the cooling in the mid and upper troposphere lowers the saturation vapor pressure of water, thereby limiting it’s growth potential and trimming optical depth back out where CO2 is trying to add it.

          Founding principles empirically calculated these results years ago and modelers claim that the reverse is true is nonsense and the actual measurements of tropospheric water vapor with reference to optical depth prove the modeling is upside down and wrong. Not a surprise to those that studied founding principles in atmospheric science.

          When you see the temperature records being tortured as NOAA and NASA GISS have done, thee is good reason to believe the hijacking of atmospheric science has become a conspiracy to cover up the gross failure of these models that cost taxpayers billions of dollars and are being used to make horrible public policy with.

          • E. Swanson says:

            CW, Your comment notes the fact that the IR energy absorbed by the various Greenhouse gases is re-radiated again. But, one must think in terms of multiple layers thru the atmosphere, because the re-radiated energy is split, on average, with half going upwards and the other half going back toward the surface. That’s the Green Plate effect, or back radiation, which results in a warming as the down welling IR EM from a higher layer is then absorbed by the layer(s) below.

            The result of adding more greenhouse gases to the atmosphere warms the atmosphere above the tropopause, which, due to the lapse rate, then increases the surface temperature.

          • Norman says:

            Chuck Wiese

            Thank you for you thoughtful post. I am thinking about what you posted and will continue to investigate.

            I find your brand of skepticism far superior to the usual group on this blog. You know the physics and atmospheric science. You are not making up physics with zero support of the claims.

            You accept the reality of the GHE. This is one that most the unscientific skeptics cannot accept. They torture the 2nd Law of Thermodynamics to make ridiculous and unfounded claims that energy from a cold body cannot be absorbed by a warmer one. They make up twisted and incorrect Quantum physics to support their fantasy physics.

            I am unsure of you statement about modelers and what they do:
            YOU: “And so as you add more CO2, the wing lines at the edges ( R & P ) become more opaque to surface radiation and the modelers who hijacked atmospheric science claim the result from this will cause warming. They accomplish this by generating a positive feedback with water vapor and increase opacity there at the many wavenumbers that H2O absorbs and emits IR from.”

            David Appell did send me a link to the math of an actual climate model. I am not sure they try to do any of this. I think they just put in several complex math equations and run the program and read the output. I am not sure they added a positive feedback for H2O or not. Maybe they have. The model was several pages long with involved math equations.

            You are very correct that GHG do not warm the atmosphere directly. They absorb and emit at about the same rate and will produce little direct warming. Most atmospheric warming would be from latent heat when water vapor condenses (which lowers the lapse rate considerably), convection and near the surface from conduction.

          • JDHuffman says:

            E. Swanson, you continue to be confused by your own beliefs:

            “The result of adding more greenhouse gases to the atmosphere warms the atmosphere above the tropopause, which, due to the lapse rate, then increases the surface temperature.”

          • David Appell says:

            Chuck wrote:
            Appell thinks GHGs warm the atmosphere directly by absorbing surface IR.

            “Radiative forcing measured at Earths surface corroborate the increasing greenhouse effect,” R. Philipona et al, Geo Res Letters, v31 L03202 (2004).
            http://onlinelibrary.wiley.com/doi/10.1029/2003GL018765/abstract

            “Observational determination of surface radiative forcing by CO2 from 2000 to 2010,” D. R. Feldman et al, Nature 519, 339343 (19 March 2015).
            http://www.nature.com/nature/journal/v519/n7543/full/nature14240.html

            “Measurements of the Radiative Surface Forcing of Climate,” W.F.J. Evans, Jan 2006
            https://ams.confex.com/ams/Annual2006/techprogram/paper_100737.htm
            https://ams.confex.com/ams/pdfpapers/100737.pdf

          • David Appell says:

            CWiese wrote:
            Founding principles empirically calculated these results years ago….

            Who — Elsasser?

            Elsasser’s 1942 paper relied on approximations and guesses that were the best that could be done at the time but were superseded by later calculations using better spectroscopy and radiation transfer codes.

            If Elsasser’s work has been the final word, scientists would have said so a long time ago. I once asked a prominent scientist about Elsasser’s work, and he said he had never heard of him.

            PS: Elsasser was the head of my undergraduate physics department, but about two decades before I was there.

          • David Appell says:

            CWiese wrote:
            When you see the temperature records being tortured as NOAA and NASA GISS have done, thee is good reason to believe the hijacking of atmospheric science has become a conspiracy to cover up the gross failure of these models that cost taxpayers billions of dollars and are being used to make horrible public policy with.

            Like others here, CWiese whines about adjustments, yet never says what’s wrong with them. Not one detail whatsoever. Nothing.

            And he/they ignore the larger adjustments made to UAH’s temperature model.

            The BEST project was formed specifically to take a fresh look at how temperature data is obtained and how it gives global averages. They were partly funded by the Koch brothers, and even had a Nobel Laureate on their project team. What did they find? THE SAME RESULTS AS EVERYONE ELSE.

          • David Appell says:

            Chuck Wiese wrote:
            It means much of the GHGs radiate at their own local temperature

            This is just ignorant. An atom or molecule radiates according to the energy difference of the quantum levels that it’s transitioning from-to, regardless of the temperature.

            There is a small temperature dependence on ab.sorp.tion, and a much larger one for pressure.

            There is no such thing as “local temperature.” It’s junk physics. Junk science is CWiese’s calling card. But then he gets his information from CO2science.org {giggle}.

          • David Appell says:

            Cwiese wrote:
            This enhances both dry and moist convection from the surface to give the realized surface warming back to the troposphere. But that becomes a NEGATIVE, not positive feedback on water vapor

            The water vapor feedback has been observed, and it’s positive, just as expected:

            IPCC 5AR WG1 Ch2 Figs 2.30 & 2.31 documents positive trends in water vapor in multiple datasets.
            http://www.ipcc.ch/pdf/assessment-report/ar5/wg1/WG1AR5_Chapter02_FINAL.pdf

            “Attribution of observed surface humidity changes to human influence,”
            Katharine M. Willett et al, Nature Vol 449| 11 October 2007| doi:10.1038/nature06207.
            http://www.nature.com/nature/journal/v449/n7163/abs/nature06207.html

            “Identification of human-induced changes in atmospheric moisture content,” B. D. Santer et al, PNAS 2013.
            http://www.pnas.org/content/104/39/15248.abstract

            – continued –

          • David Appell says:

            – continued from above –

            “How much more rain will global warming bring?” F.J. Wentz, Science (2007), 317, 233235.
            http://www.sciencemag.org/content/317/5835/233

            “Analysis of global water vapour trends from satellite measurements in the visible spectral range,” S. Mieruch et al, Atmos Chem Phys (2008), 8, 491504.
            http://www.atmos-chem-phys.net/8/491/2008/acp-8-491-2008.html

          • Chuck Wiese says:

            Norman: It is well established with many complaints by those that have looked at “climate” model parameterizations that one of the things modelers did was to hold the relative humidity constant with rising temperature. This, of course, will increase atmospheric absolute humidity which they then build a grossly amplified optical depth with.

            This is just one of many things that you could spend hours talking about concerning these overrated and unscientific heaps of junk created by Gavin Schmidt, James Hansen, Ben Santer and the likes have nothing they can be proud of.

            The history of this says that somewhere, somehow, these clowns told the political class that they had the skills to model the climate. But they took this upon themselves without studying much of any founding work. To believe water vapor is amplified by a GHG like CO2 goes completely against founding principles but they went ahead with this stupid idea anyway. It looks like Hansen was far too enamored by Venus than Earth.

            But even if you give these clowns the benefit of the doubt, to not have studied founding principles, or to get a different result without doing further research is unforgivable. These heaps of junk should have been beta tested in a basement before ever announcing results and lying to the public and political class that there modeling is accurate.

            It just goes downhill from there.

          • David Appell says:

            CWeise wrote:
            To believe water vapor is amplified by a GHG like CO2 goes completely against founding principles but they went ahead with this stupid idea anyway.

            And yet that what’s the measurements show — links just above this.

            You’d better start thinking about how you’re going to dismiss these measurements. Reminder, claiming a global conspiracy theory is always available to you (with no evidence!)(if you don’t mind being laughed at).

          • David Appell says:

            CWeise wrote:
            The history of this says that somewhere, somehow, these clowns told the political class that they had the skills to model the climate.

            Who specifically told whom? And when? And where?

            It must have involved Lee Harvey Oswald, right? And Woody Harrelson’s father?

          • Chuck Wiese says:

            Appell, No matter what you are told about optical depth, you just don’t get it. You trott out the same stupid and worn out papers written by modelers and others who want to validate their failed modeling.

            If the surface becomes any warmer, CO2 is not the cause. The physics of this were well established years ago as CO2, water vapor and the hydro cycle’s roles were defined as I told Norman.

            What really counts in optical depth is whether you can expand water vapor’s influence to a colder pressure, such as where CO2 is at. But you can’t unless you add more energy from an external source. The sun is that source, but to date there is no amplification in optical depth by water vapor and this demonstrates that we don’t fully understand how the suns energy changes and affects the climate system if more insolation reaches the surface.

            The absolute humidity at pressures lower than 700 millibars has been declining over time, except for the blip associated with the super El Ninio of 2015-16 that caused a significant increase in deep tropical convection like they all do. Water vapor is limited in the troposphere by its own thermodynamic and radiative properties.

            If there is an increase at 1000 millibars near the surface, this will have no effect to amplify warming through the optical depth of the troposphere and was likely caused by more insolation reaching the surface.

            Here are the NOAA graph’s, Appell. Real data. But no matter how many times you are shown this, you just keep on ignoring it like someone with a learning disorder.

            http://www.climate4you.com/Text/Climate4you_May_2018.pdf

          • David Appell says:

            Chuck Wiese says:
            If the surface becomes any warmer, CO2 is not the cause.

            You completely misunderstood the Donohue paper, which is about outgoing IR at the *TOA*.

            “In computer modeling of Earths climate under elevating CO2 concentrations, the greenhouse gas effect does indeed lead to global warming. Yet something puzzling happens: While one would expect the longwave radiation that escapes into space to decline with increasing CO2, the amount actually begins to rise. At the same time, the atmosphere ab.sor.bs more and more incoming solar radiation; its this enhanced shortwave ab.sorp.tion that ultimately sustains global warming.”

            http://news.mit.edu/2014/global-warming-increased-solar-radiation-1110

          • David Appell says:

            PS Cweise – you really need to take some real science classes now that you’re retired, instead of relying on the propaganda of CO2science.org.

          • Chuck Wiese says:

            Appell: “This is just ignorant. An atom or molecule radiates according to the energy difference of the quantum levels that its transitioning from-to, regardless of the temperature.”

            Me: Really?

            https://en.wikipedia.org/wiki/Balmer_series

            Click on Paschen series to get the quantum formulas for infrared light. Does this or any quantum level have a temperature dependence on emission? The suns photosphere is radiating over all wavelengths at 5500K, ie 5.188E4 kWm-2, Earth 288K ie .39 kWm-2. Wavelength peak difference 9.52 um. So if the sun was a solid object that lost its fuel at 5500K, do you think the quantum levels in it would change if it cooled to the Earth’s mean temperature?

            Appell: “There is no such thing as local temperature. Its junk physics. Junk science is CWieses calling card. But then he gets his information from CO2science.org {giggle”

            Me: Really? Here is a version of the radiative transfer equation used in the atmosphere:

            I = Io exp [ -k(rho)dz ] + B [ 1-exp( – k rho dz )]

            The Plank function,B, is ENTIRELY dependent on the local temperature at the specified level at which ab-sorp-tion is calculated. The Right hand side deals specifically with radiative emission at the level selected, temperature dependent at the local level.

            You’re an idiot, Appell. A lost cause for a guy with a graduate degree in physics.

          • David Appell says:

            CWeise wrote:
            Me: Really? Here is a version of the radiative transfer equation used in the atmosphere:
            I = Io exp [ -k(rho)dz ] + B [ 1-exp( k rho dz )]

            First of all, the “dz” doesn’t go in the exponential.

            Second of all, you forgot integral over the last term, that starts with “B”.

            And there are two Scharzschild equations, one at the surface and one at the TOA. Both involve integrals.

            Why don’t you get over your juvenile need to call me names whenever you feel threatened and stick to a direct and respectful discussion of the science.

          • Chuck Wiese says:

            Appell: “First of all, the “dz” doesn’t go in the exponential.

            Second of all, you forgot integral over the last term, that starts with “B”.

            And there are two Scharzschild equations, one at the surface and one at the TOA. Both involve integrals.”

            Wrong again, Appell. Click on the link to see both versions of the Schwarzchild equation, one for the surface and one for the top of the atmosphere as they are derived.

            http://www.met.reading.ac.uk/~ross/Science/RadTrans.pdf

            In this example, ds=dz so the derivative dz most certainly belongs in the exponent of the terms rho and k that contain the density and ab-sorp-tion coefficient. It is as plain as it can be through the derivation, Appell and without it, you have a dimension 1/m which you cannot take an exponent of. The quantity has to be dimensionless.

            This is undergraduate atmospheric science, Appell, and you don’t understand this concept with a PhD in physics?

            Very lame and telling about you, Appell. I don’t see how you ever made thru graduate school.

          • David Appell says:

            Chuck, a differential ALWAYS appears behind an integral sign. That’s what you link shows.

            Your’s did not.

            Instead of your perpetual anger, why don’t you try again?

          • Chuck Wiese says:

            Appell: “Chuck, a differential ALWAYS appears behind an integral sign.”

            Me: What absolute nonsense! Whether you’re using dz or ds in Beers Law by itself or in the Schwarzchild equation, this derivative has to integrated to get a change in Io. It is a path length and so if you place it behind the integral sign, you are not calling for integration. Quantities that are constants or derivatives that are in the denominator that will cancel are the only things that belong behind an integral sign.

            Appell, I don’t see how you EVER made it thru graduate school if you don’t comprehend such basic operations in mathematics. There is no physicist or mathematician that would agree with this gibberish of yours.

        • Chuck Wiese says:

          Appell:

          “You completely misunderstood the Donohue paper, which is about outgoing IR at the *TOA*.

          In computer modeling of Earths climate under elevating CO2 concentrations, the greenhouse gas effect does indeed lead to global warming. Yet something puzzling happens: While one would expect the longwave radiation that escapes into space to decline with increasing CO2, the amount actually begins to rise. At the same time, the atmosphere ab.sor.bs more and more incoming solar radiation; its this enhanced shortwave ab.sorp.tion that ultimately sustains global warming.

          http://news.mit.edu/2014/global-warming-increased-solar-radiation-1110

          No, Appell, I did not misunderstand this idiotic analysis. But you’re obviously gullible and incompetent enough to buy it.

          The OLR thru time has NOT decreased from rising CO2 concentration. The records shows this. The long term trend has actually been increasing since the start of the record in 1979. This means THERE IS NO GHG FINGERPRINT IN THE RECORD, APPELL. I already showed you that the OLR is over 1.5 Wm-2 above the effective radiating energy at the end of this record in 2010 and CERES data since show a slight increase as well from then. Failed climate model RCP8.5 has us in a deficit to the effective emission by 3 Wm-2, so the difference is over 4Wm-2 in error.

          So Donohoe and his associates are asking us to believe that CO2 radiation started melting snow and ice and is causing increasing absorbed solar insolation at the surface to cause solar warming and that explains why the OLR never dropped as the failed models have predicted all along. This is also wrong, and like you, Appell, this guy doesn’t bother to check facts before he opens his mouth. The NH snow and ice record remains static, Appell.

          So this is the equivalent of saying the cart drives the horse and only a gullible fool would buy this garbage. I’ve already pointed out to you why this article is nonsense up thread, Appell, but even after a few days for you to think about it, you still believe this article which is why you continue to play the role of a fool very well. You’re a fool expert, Appell. Congratulations.

          • David Appell says:

            CWeise, while you’re still misquoting the Donohue et al study, it’s good to see you finally admit that global warming is happening.

          • David Appell says:

            CWiese says:
            So Donohoe and his associates are asking us to believe that CO2 radiation started melting snow and ice and is causing increasing absorbed solar insolation at the surface to cause solar warming and that explains why the OLR never dropped as the failed models have predicted all along.

            Where did this models predict this?

            Specifically? Show us the published results where the models predicted this.

            (My guess is you can’t.)

            Read what the press release said, quoting Isaac Held:

            “The paper is not challenging the physics of climate models; its value lies in helping the community interpret their output. While this study does not change our understanding of the fundamentals of global warming, it is always useful to have simpler models that help us understand why our more comprehensive climate models sometimes behave in superficially counterintuitive ways, says Isaac Held, a senior scientist at NOAAs Geophysical Fluid Dynamics Laboratory who was not involved in this research.”

            http://news.mit.edu/2014/global-warming-increased-solar-radiation-1110

            To emphasize: doesn’t challenge climate models.

          • David Appell says:

            I apparently wrote:
            To emphasize: doesnt challenge climate models.

            I don’t know where this sentence came from, but it was nothing I ever intended to write. Because I don’t think this at all. It might be something cut and pasted from the press release that I forgot to delete, but I did not intend to include it in my reply and I disown it.

          • Chuck Wiese says:

            Appell:

            “Where did this models predict this?

            Specifically? Show us the published results where the models predicted this.

            (My guess is you cant.)”

            Me:

            Wrong again, Appell. Here is the reference to the radiative forcing predicted by RCP8.5. And RCP8.5 is where we’re at now. “business as usual” for the globe. CO2 concentrations rising steadily. In eyeballing it again, 3 Wm-2 might a tad high,I’d say it could pass for 2.8 Wm-2, but you get the picture. This is what it predicts as a deficit to the effective radiating temperature. So it is still off by over 4Wm-2.

            https://judithcurry.com/2015/12/13/a-closer-look-at-scenario-rcp8-5/

            Panic time for modelers. That’s why the asinine explanation, just like yours, Appell.

          • David Appell says:

            Chuck Wiese says:
            And RCP8.5 is where were at now.

            It is?
            Prove that claim.

          • David Appell says:

            CWeise wrote:
            While one would expect the longwave radiation that escapes into space to decline with increasing CO2, the amount actually begins to rise.

            Why would one expect that?

            The reason the Earth is warming is to emit more outgoing TOA IR, restoring equilibrium with incoming energy.

            In fact, the current energy imbalance is only about 0.71 W/m2 from 2005-2015:

            Improving estimates of Earths energy imbalance,
            Johnson, G.C., J.M. Lyman, and N.G. Loeb
            Nature Clim. Change, 6, 639640, doi: 10.1038/nclimate3043 (2016).

          • David Appell says:

            Chuck Wiese says:
            “The OLR thru time has NOT decreased from rising CO2 concentration. The records shows this.”

            What record?

            Citation?

          • David Appell says:

            CWeise wrote:
            Failed climate model RCP8.5….

            CWeise doesn’t even understand what a projection is.

            How are you supposed to discuss anything with someone who doesn’t even know what a projection is and that it’s not a prediction???

          • David Appell says:

            CWeise wrote:
            THERE IS NO GHG FINGERPRINT IN THE RECORD

            What a raw denier you are. I’ve given you Harries+, Philipona+, Feldman+, all of which you think you get to ignore.

            Here’s another one you can ignore:

            Identifying human influences on atmospheric temperature, Benjamin D. Santer et al, PNAS 2012
            http://www.pnas.org/content/early/2012/11/28/1210514109.full.pdf

            This is why I laid you out on the 28th — you are a liar who repeatedly denies the science as if doesn’t even exist. You’re so wrapped up in anger that can’t even reply to mentions of these findings. You seeth and think climate science ended in 1942 because that’s when you stopped trying to learn to learn anything. You fall for amateurish clowns like CO2science.org and Steve Goddard because you don’t know better, and you aren’t even ashamed of it. You think a meaningful response is to repeatedly yell “you’re an idiot” at someone for three minutes. You are woefully ignorant about what the science says and you toss out every dumb denier tactic from the Book of Denying. You aren’t even decent enough to shake hands after a debate.

            You’re deeply angry and completely sure the science is all wrong, but don’t have the cojones to write even a simple paper to explain it all to the world. Can’t even take a tiny risk, because, poor thing, you might suffer a rejected. Because all the great scientists like you NEVER suffered any rejection, did they Chuck? You won’t because then all your fantasies of your superiority will come crashing down around you. No Nobel Prize for Chuck! Better for him to stick to the denier blogs that no one reads — that’ll show’em, for sure! Yep. A victory for CWeise. Stockholm will call any day now I’m sure, Chuck — you better keep your phone line open!

          • JDHuffman says:

            DA, it must be frustrating for you. All of your sources fail, in the revealing light of real science. CO2 is NOT a “toxic gas”. It is essential for all life on Earth.

          • Chic Bowdrie says:

            David Appell,

            “”I’ve given you Harries+, Philipona+, Feldman+, all of which you think you get to ignore.”

            Those sources show increasing IR active gases in the atmosphere, that’s all. Calculations from selected spectra based on hypothetical equations predict possible forcings of some magnitude. However, there is no signature that those forcings result in any global temperature increase. Your continued un-scientific promoting of those papers as a signature of AGW and calling people deniers brands you as a shill for the propagandists promoting climate change hysteria.

    • David Appell says:

      Chuck Wiese says:
      It is easy for Totos realists to expose Oz as is being done, but Oz extends to the puppet masters of the politicians that control them and are mutually conflicted.

      More conspiracies again, the last resort of the ignorant and desperate.

      How again does Woody Harrelson’s father figure into all this?

  84. Tim says:

    The best summer since 1976 in the UK, however, winters then were cold and are becoming the norm again in the UK. I stopped believing in Agw after working for a carbon management company in 2006, I found out the whole concept was fraud.

  85. La Pangolina says:

    Tim says:
    July 8, 2018 at 4:05 AM

    I stopped believing in Agw after working for a carbon management company in 2006, I found out the whole concept was fraud.

    A few words explaining what you really found out would be interesting!

  86. Bindidon says:

    bilybob says:
    July 3, 2018 at 2:32 PM

    “Is there a corresponding figure 5 for the world?”

    Hello bilybob, as promised I generated data to show such a figure.

    There are some differences: while fig. 5 edited by John Christy and presented by Roy Spencer

    http://www.drroyspencer.com/wp-content/uploads/US-extreme-high-temperatures-1895-2017.jpg

    was created using the USHCRN record for the entire US, I use here the GHCN daily record for the CONUS and the Globe.

    Moreover, I do not use Fahrenheit but Celsius instead. The two limits, 100 resp 105F became here 35 resp. 40 C.

    1. Here is a chart corresponding to fig. 5:

    http://4gp.me/bbtc/1531066690920/001.jpg

    As John Christy noted, there is indeed no significant trend expressing a possible increase of daily maxima per station/year in the US.

    2. And here is the chart for the Globe:

    http://4gp.me/bbtc/1531066827229/001.jpg

    You see a somewhat more significant, but certainly not dramatic trend (excepted for alarmists of course).

    But something appeared strange to me: the plots in the two charts are too similar.

    After a look at

    http://4gp.me/bbtc/1531068330612/001.jpg

    everybody understands that e.g. in 1936, we had for the Globe 5162 active stations, and for CONUS alone, 3582 of these. Thus the entire Globe minus CONUS had in 1936 only 1580 stations, i.e. 44 % of the CONUS set. No wonder the charts look so similar.

    The idea was thus to subtract CONUS from the Globe, giving this, i.e. 98 % of the planet:

    http://4gp.me/bbtc/153106726076/001.jpg

    I won’t comment this graph: that is the job of the blog’s readers.

    A few numbers to close: top tens for maxima per year/station, above 35 resp 40 C for CONUS and the Globe minus CONUS.

    1. CONUS

    Above 35 C

    1936 25.9
    1934 23.5
    1954 22.3
    1931 20.6
    1980 20.6
    1930 19.5
    1933 18.7
    1925 18.6
    1952 18.6
    1953 18.5

    Above 40 C

    1936 5.7
    1934 4.4
    1980 3.0
    1954 2.7
    2011 2.6
    1930 2.5
    1933 2.3
    1937 2.1
    1939 2.1
    1952 2.0

    2. Globe minus CONUS

    Above 35 C

    2010 14.9
    2015 14.6
    2009 14.3
    2016 14.3
    2012 13.7
    2017 13.4
    2014 13.0
    2013 12.8
    2005 12.7
    2006 12.7

    Above 40 C

    2009 3.2
    2010 3.2
    2015 3.0
    2016 2.9
    2017 2.8
    2005 2.7
    2006 2.7
    2012 2.7
    2014 2.7
    2013 2.6

    Again: no comment.

    • Bindidon says:

      Data source: https://tinyurl.com/yb3pr7jn

      (over 29 GB)

      • bilybob says:

        Bindidon,

        Thank you so much for doing this.

        One question on the data used to make your graphics. Are these the averages for sites that go back to 1895 or are you adding in new sites as they come online? The reason I ask is that in Fig 5 Christy referenced 1114 USHCRN sites that I had assumed were available throughout the entire period. Usually there would be holes here and there for what ever reason, but the figure was based on just these sites. No new sites would be added so a apples to apples comparison could be performed.

        I think this is important because the deniers out there will take a hold of this analysis and say the data is skewed because of the new sites. So I just wanted to confirm if it does add new stations or not.

        Regardless, your first figure does show that CONUS had experienced a significant warming in the 30’s that has not been seen since. Though the data I have seen on the minimum side show a significant increase raising the average over that time period.

        On the last figure (globe minus CONUS) that would surprise me significantly if that figure is using only sites that extend back to 1900. If you are including new sites as you move forward however, I am not sure what I can comment on. There would be two possibilities, 1) new sites are skewed to higher temperature extremes or 2) they are not skewed and the rest of the globe is achieving higher extremes while CONUS is not.

        One last comment, since New York was singled out in this blog article, I took a look at Central Park NY. The record high was 106 in 1936.

        Again thanks for your effort. I will be in and out for the next few days working on a few deadlines.

        • Bindidon says:

          bilybob says:
          July 8, 2018 at 5:24 PM

          Thanks in turn bilybob for your convenient answer.

          “One question on the data used to make your graphics. Are these the averages for sites that go back to 1895 or are you adding in new sites as they come online? ”

          Please have a look at the blue plot in the graph

          http://4gp.me/bbtc/1531068330612/001.jpg

          It tells you all you need.

          “The reason I ask is that in Fig 5 Christy referenced 1114 USHCRN sites that I had assumed were available throughout the entire period.”

          No they of course were not:

          http://4gp.me/bbtc/1531130791521/001.jpg

          I scanned USHCN some months ago, and the scan reported a sum of 1218 stations (btw I don’t know how Mr Christy obtained 1114 stations). In 1895, only 609 of them were active, and 907 in 2017.

          “Usually there would be holes here and there for what ever reason, but the figure was based on just these sites. No new sites would be added so a apples to apples comparison could be performed.”

          If there were holes, you would see them in the graph above.

          “I think this is important because the deniers out there will take a hold of this analysis and say the data is skewed because of the new sites. ”

          Deniers looking at a temperature series generated out of only 300 stations having reported from 1895 till 2017 would say ‘What? Only 300 stations? Ridiculous!’.

          “There would be two possibilities, 1) new sites are skewed to higher temperature extremes or 2) they are not skewed and the rest of the globe is achieving higher extremes while CONUS is not.”

          Why should new sites be ‘skewed to higher temperature extremes’ ?

          Manipulating over 30,000 stations to get the world look warmer? Jesus, bilybob. I thought only people like Robertson would think so :-((

          So I think: yes, ‘the globe is achieving higher extremes while CONUS is not’.

          CONUS is a warm country, but over the long term it is not warming so much.

          The 0.18 C / decade registered over CONUS by Roy Spencer in 3-5 km altitude does not tell us anything about what happens 2 m above the surface.

          It might be for example due to huge advection streams moving poleward from the Tropics.

          A last thought: please be careful with daily maxima or minima counts. They have a meaning differing from averaging these maxima or minima.

          A typical example is that in the CONUS, the year with the highest maxima average was NOT 1936, but 1934!

          • bilybob says:

            Bindindon Says,
            “Why should new sites be ‘skewed to higher temperature extremes’ ?”

            Bilybob says,
            Location of new sites could skew the results.

            Bindindon Says,
            “Manipulating over 30,000 stations to get the world look warmer? Jesus, bilybob. I thought only people like Robertson would think so :-((”

            My background is in data analysis, my comment was a statement that there is insufficient data to come to a conclusion on that last graph. However, if I knew more of the new sites, their distribution of their locations, I might be able to come up with a definitive opinion. As such, it is either the new sites are predominately in the warmer zones of Earth or they are distributed evenly across the globe. That would probably apply to rural vs. urban as well. Thus the result could be skewed. I just don’t know.

            The word “manipulating” would suggest that actual data was modified in some way. Or, perhaps the site selection was somehow biased. My impression was either these are the set of sites that have data back to 1900 or it is all the sites. Are you saying it is in-between and specifically selected for your graph? I did not get that impression. I do not see any manipulation of the data or site selection, but if you have evidence I would look at it.

            Bindindon Says,
            “A last thought: please be careful with daily maxima or minima counts. They have a meaning differing from averaging these maxima or minima.”

            BilyBob Says,
            I believe we agree on this. And this has been my point for a while now. The discussion on GHE has been a bit one side, only looking at energy leaving the surface. However, the atmosphere impacts energy from the Sun, it may be a lower percent but it is a higher energy source. Thus, even though average temperatures are increasing, the data shows extreme cold and extreme heat events also decreasing.

            This also in now way suggests that CO2 is the control knob for temperature. I believe most posters here agree that the proxy data going back 500k years or more show that even as CO2 is increasing that global temperature started to decrease (near peak global temperature periods. The data suggests that CO2 is simply ineffective in warming the planet above 300ppm. Perhaps, below 300ppm it does and it seems reasonable. I have been looking for such evidence

            Some other insights for your consideration. The Earth does not receive an average amount of solar energy. One side of the planet receives the full amount and depending on the composition of the atmosphere, angle of refraction/reflection, albedo, photon interaction and surface conditions water/land/desert/forest/urbanized/agricultural etc. the energy can be processed differently. This is also true of the night side of Earth, where energy leaving is impacted by the composition of the atmosphere and surface material. Because Maxima/Minima are changing, it is either due to changes in these conditions or from the natural cycles or a combination of both. Currently, the data I have seen thus far is that changes are more likely driven by natural and some that is human induced. I do think deforestation and urbanization have contributed to this but nature is the driving factor.

            Your thoughts?

          • bilybob says:

            Bindindon Says,
            “A typical example is that in the CONUS, the year with the highest maxima average was NOT 1936, but 1934!”

            I should have better explained, my bad. I was pointing out that Central Park NY which is in the middle of one of the most urbanized areas of the world, has a maximum temperature record dating from 1936. There was criticism by some, not you, that Dr. Spencer was being deceptive by using the whole state, which is very rural has high altitudes. However, the focus of this blog article was on this region so I don’t think it was intentional on his part to deceive.

            However, with that said, if temperature extremes are significantly higher, why are a high percentage of old records still intact? I should have explained better where I was going with that, I apologize. I was not trying to link the Figure 5 to Central Park.

          • Bindidon says:

            Thanks bilybob for the two replies.

            But before commenting them, I would like to show you the results of your own interest in obtaining data similar to what I already sent, but based on stations active over the whole period, i.e. 1895-2017.

            I move that downthread as usual.

            Rgds
            J.-P.

    • Gordon Robertson says:

      binny…”And here is the chart for the Globe:”

      More amateur, creative curve plotting from Binny using Excel.

      • La Pangolina says:

        Gordon Robertson says:
        July 8, 2018 at 5:18 PM

        “And here is the chart for the Globe:”

        More amateur, creative curve plotting from Binny using Excel.

        http://4gp.me/bbtc/1531066690920/001.jpg

        Why did genius Robertson not view that graph not as ‘amateur, creative curve plotting’ as well?

  87. CO2isLife says:

    Argumentum Ad Ignorantiam; Exposing Climate Sophistry

  88. Entropic man says:

    Mike Flynn

    I gather that you were looking for this.

    http://acmg.seas.harvard.edu/people/faculty/djj/book/bookchap7.html

    • Entropic man I thought a while back you favored solar as far as the climate goes? Am I wrong?

      • Entropic man says:

        Salvatore Del Prete

        Rather an oversimplification.

        I think of climate as controlled mainly by seven forcings and tending to settle at one of five strange attractors.

        I dont see how you can explain the last 700 million years using anything less.

    • Mike Flynn says:

      E m,

      If I didn’t know better, I would thin’ you are joking. Alas, you are only deluded.

      “Some of this terrestrial radiation is trapped by greenhouse gases and radiated back to the Earth, resulting in the warming of the surface known as the greenhouse effect.” Except it can’t, of course.

      Just the usual pseudoscientific garbage. Unfortunately, radiation from a body at a given temperature cannot be returned to that body causing a rise in temperature – that would be a magical effect.

      Only the stupid, ignorant or deluded coukd accept such fantasy as truth.

      Maybe you could try describing the GHE yourself? You might start by saying “The Greenhouse Effect is a natural phenomenon which is observed . . . ”

      Complete and utter waste of time, isn’t it? Can’t be done, because it is a fantasy!

      Keep trying.

      Cheers.

  89. Gordon Robertson says:

    Moving this down here:

    DA…”The leader of RSS thinks surface measurements are superior:”

    That’s why I think Mears is an alarmist and proof that RSS was set up to destroy confidence in UAH. How could anyone in his right mind compare fabricated surface data, that barely covers the 30% of land surface, to state of the art technology that covers 95% of the surface, including oceans?

    Surface data is deceit. It is based on discarding most of the real data and using some of it in a climate model to fabricate the discarded data. In other words, the surface quacks at Had-crut, GISS, and NOAA have taken to guessing at what they think global temps should be and have manipulated data to realize that guess.

    All of them are climate alarmists and have a political bent. That was exposed in the Climategate email scandal when several top IPCC scientists were caught interfering with peer review and adjusting time series to hide cooling. One of them, Mann, referred to that process as The Cause.

    Another one, Phil Jones, head of Had-crut, claimed he and ‘Kevin’ would see to it that skeptics’ paper would not get to the IPCC review stage. Kevin seems to be Kevin Trenberth with whom Jones is partnered as a Coordinating Lead Author at IPCC reviews.

    Another, Michael Mann, a good friend of Gavin Schmidt of GISS, has admitted to a trick in which cooling in data is hidden. Jones bragged about using the trick himself.

    The IPCC is crooked and so is the entire alarmist movement, which is in control of Had-crut, NOAA and GISS.

    Now it appears Mears is associated with that mob, which suggests RSS is just as corrupt as they are.

    • David Appell says:

      Gordon Robertson wrote:
      Another, Michael Mann, a good friend of Gavin Schmidt of GISS, has admitted to a trick in which cooling in data is hidden.

      You dummy, you don’t even know what “hide the decline” meant or its context.

      • Gordon Robertson says:

        DA…”You dummy, you dont even know what hide the decline meant or its context”.

        I know the real version, not the political version you offer. When Mann’s hockey stick proxy data began showing cooling when the temps were actually rising, Mann cut off the offending data and spliced in real data.

        That’s what hide the decline means, hiding the cooling proxy data. However, Phil Jones of Had-crut bragged about using Mann’s method on real data.

        • David Appell says:

          Pretty good. It means the proxy data stopped matching the temperature data in certain regions of the globe. (Mann et al used temperature data from about 1900 on, and used the 20th century overlap to correlate past proxy temperatures to real temperatures.)

          What was wrong with doing that?

          • Gordon Robertson says:

            DA…”(Mann et al used temperature data from about 1900 on, and used the 20th century overlap to correlate past proxy temperatures to real temperatures.)

            What was wrong with doing that?”

            For one, when Mann et all were investigated by the National Academy of Science, NAS told them they could not use pine bristlecone for the 20th century. That’s all they had for 20th century proxies.

            For another, they inferred an unprecedented warming during the 1990s from 1000 AD to 1998. If the proxy data was showing cooling, their data would not have shown unprecedented warming, since it was showing cooling. They could only claim the 1000 year unprecedented warming using real data representing a couple of decades.

            The entire study was a scam. For one entire year, around 1400 AD, they only had one tree as a proxy. Mann et al had to eliminated the Medieval Warm Period and the Little Ice Age to get a flat shaft for their hockey stick. They had to splice in real data to get the blade.

        • David Appell says:

          Its context was the decline in tree growth at some high-latitude locations since 1960, an issue in climate science called the “divergence problem.” See http://www.skepticalscience.com/Mikes-Nature-trick-hide-the-decline.htm for a full explanation, and read

          “On the Divergence Problem in Northern Forests: A review of the
          tree-ring evidence and possible causes,” Rosanne D’Arrigo et al, Global and Planetary Change 60 (2008) 289305.
          http://www.ldeo.columbia.edu/~liepert/pdf/DArrigo_etal.pdf

          Then explain what Mann et al did wrong.

          • Gordon Robertson says:

            DA…”Then explain what Mann et al did wrong”.

            It would be far easier to explain what they did right…nothing.

            Mann et al set out to prove the propaganda that the 1990s were the hottest decade in 1000 years and they failed in every manner conceivable. NAS disagreed, a statistics expert disagreed, and ultimately the IPCC disagreed by amending the hockey stick graph to the spaghetti graph which applies from 1850 onward, which re-instates the MWP and LIA that Mann et al discarded, and which generally distances them from the embarrassment of the hockey stick.

    • La Pangolina says:

      Gordon Robertson says:
      July 8, 2018 at 3:21 PM

      How could anyone in his right mind compare fabricated surface data, that barely covers the 30% of land surface, to state of the art technology that covers 95% of the surface, including oceans?

      It becomes, after dozens of ‘comments’ of that kind, more and more obvious that Robertson is dumb enough to believe that ‘surface data’ only means ‘land surface data’.

      He manifestly never heard of HadISST1, HadSST3, ERSST4/5, COBE-SST2 (the coldest sea surface temperature evah), etc etc etc.

      What an ignorant, pretentious boaster.

      Look at this faked graph made out of fudged data, Robertson!

      http://4gp.me/bbtc/1531091738941/001.jpg

      • Gordon Robertson says:

        binny…”It becomes, after dozens of comments of that kind, more and more obvious that Robertson is dumb enough to believe that surface data only means land surface data.

        He manifestly never heard of HadISST1, HadSST3, ERSST4/5, COBE-SST2 (the coldest sea surface temperature evah), etc etc etc.”

        Both you and your alter-ego, La P, are idiots. More evidence you are both one and the same.

        “On August 15, 2017, GISS switched from NOAA/NCD-C’s Extended Reconstructed Sea Surface Temperature (ERSST) dataset version 4 to version 5 in their temperature analysis…”.

        https://data.giss.nasa.gov/gistemp/updates_v3/ersst5vs4/

        No matter how you look at it, the surface data in question is put out by the fabricators at Had-crut, NOAA, and/or GISS.

        Note the reference in ERSST to reconstruction, another word for fudged. They don’t measure anything, they synthesize it using opinion, cheating based on alarmist political views.

        • David Appell says:

          Gordon, do you have an useful thoughts on GISS’s switch from NOAA/NCD-Cs Extended Reconstructed Sea Surface Temperature (ERSST) dataset version 4 to version 5? What was wrong with that decision?

          Did you care when UAH switched from 5.6 to v6.0? (no.)

    • E. Swanson says:

      Gordo complains about computer models and claims that “UAH” is superior to surface data. He doesn’t indicate which “UAH” he thinks is better, nor why he thinks so, apparently unaware that the UAH products are also based on models. So, his attraction to UAH simply shows his duplicity, in which he both rejects and accepts atmospheric models. What a funny guy, his anti-science bias is so obvious that anyone can see it, yet he continues to pontificate, endlessly claiming his knowledge is superior, in spite of his ignorance.

      • JDHuffman says:

        E.Swanson, you are indeed the “funny guy”. Especially after your funny “experiment” and statements like:

        “What a funny guy, his anti-science bias is so obvious that anyone can see it, yet he continues to pontificate, endlessly claiming his knowledge is superior, in spite of his ignorance.”

      • Gordon Robertson says:

        swannie…”apparently unaware that the UAH products are also based on models”.

        There is a difference between a computer and the specific application of a computer as a model. Most alarmists don’t get that and it’s too difficult to explain that to someone who does not get it.

        UAH uses computers to analyze the data they receive from NOAA from NOAA satellites. Roy has revealed how he has written programs to help analyze the data but such a program is not a model.

        A model is a computer using a program that generates data. The program reflects a synthetic understanding of how a system works. Then it must be tested in order to validate the program.

        That is, models synthesize data and produce an imaginary representation. UAH has real data from real satellites and they use computers to synchronize several different sets of data from several different satellites, with the data representing several different altitudes.

        Comparing UAH data to climate models is like claiming heat can be transferred via back-radiation from a cooler surface to a warmer surface.

        • E. Swanson says:

          Gordo, I started programming computers when I was still an undergrad more than 50 years ago. My first job involved building dynamic simulations of electro-mechanical systems used to control satellites. I know the difference between measured data and simulation model results. I’ve attempted to read everything that Spencer and Christy have published and have published a couple of papers on the subject myself. You apparently have no clue regarding what the satellite “temperature data” actually represents or how it’s processed to give those lovely graphs which Roy posts every month.

          Then too, you’ve repeatedly shown that you don’t understand physics, either.

  90. I can’t wait to see how David reacts if the cooling trend which has now started continues year after year.

  91. La Pangolina says:

    Be careful, Salvatore! El Niño is watching you :-))

    http://ds.data.jma.go.jp/tcc/tcc/products/elnino/elmonout.html#fig2

  92. Really and in the meantime the overall oceanic surface waters continue to cool which is what really matters not some half hearted transient El Nino.

    By the way which is NATURAL.

  93. Myki says:

    It is now no longer “ho-hum, just more record warmth”, this is getting serious.

    “The past seven days have set global heat milestones and sparked safety concerns from Quebec, where at least 34 people have died in the province from the heat and humidity, to northern Siberia, home to the coldest town on Earth, which recorded temperatures 40 degrees above normal on Thursday.

    In Denver, the temperature reached an all-time high of 105 degrees. Just shy of 98 degrees, Montreal broke a 147-year-old record with its hottest measurement ever. In Bergen County, New Jersey, 81-year-old Rep. Bill Pascrell (D-N.J) passed out from the 90-degree-heat at a local fire department event. ”

    https://www.motherjones.com/environment/2018/07/this-meteorologist-explains-why-the-extreme-heat-is-way-worse-than-you-think/

    • JDHuffman says:

      Glad to see some warmth. There’s record snow/cold in South Africa, and Greenland snow is well above average.

      • David Appell says:

        Above what average?

        PS: If you want to live in warmer temperatures, move south, instead of expecting the entire world to heat up just so you’re comfortable in your backyard.

        • JDHuffman says:

          DA, you can relax. The entire world is not going to heat up due to burning fossil fuels.

          With atmospheric CO2, it’s “the more, the better”!