About a year ago, Finnish climate researcher Antti Lipponen posted a new way to visualize global warming, an animation he called the “temperature circle”. It displays the GISS land temperature data as colored bars for each country in the world radiating from a circle. As the temperature in a country goes up, the colored bar changes from a blue bar to a red bar, and gets longer…and wider:
I didn’t pay much attention to the ‘temperature circle’ at the time as it seemed rather gimmicky. But yesterday I was asked on social media about it, and I watched it again. The video has about 163,000 views on Twitter and 175,000 views on Youtube, and its impact on people’s perception is evidenced by some of the recent Youtube comments:
“Excellent presentation of a large mass of data. But the denialists will invent reasons to ignore it.”
“We’re toast.”
“This is among the scariest presentations I have ever seen. Yes, I have kids.”
After thinking about the animation for a minute, it quickly became apparent why warming displayed this way looks so dramatic… and is so misleading. The best way to describe the issue is with an example.
Assume all the countries in the world were 2 deg. C below normal, and then at some later time all of them warmed to 2 deg. C above normal. Here’s the way the ‘temperature circle’ plotting technique would display them (ignore the displayed year and ‘real’ data, just focus on the blue and red segments I have superimposed):
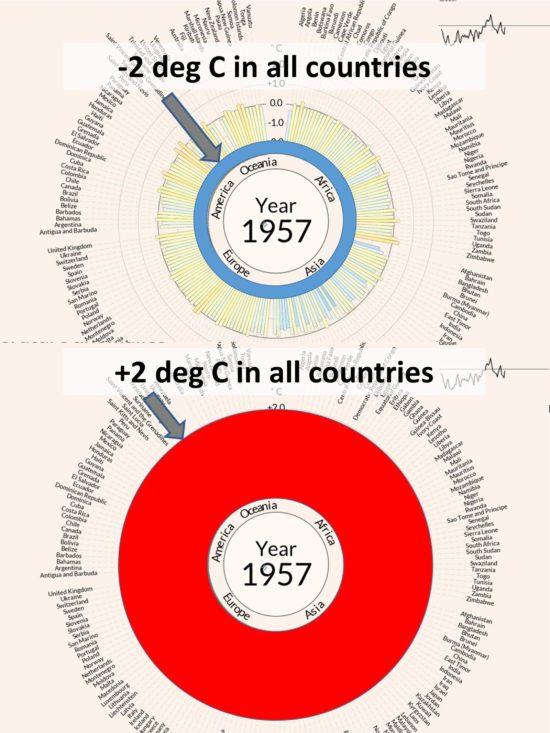
Fig. 1. The “temperature circle” animation exaggerates the perception of warming by non-linearly increasing the area of a colored annulus, even if warming progresses linearly.
Note that the coldest temperatures will have the smallest area covered by blue, and the warmest temperatures will have the largest area covered by red, even though the absolute sizes of -2 deg and +2 deg departures from average are the same.
I consider this very deceptive.
What this display technique does is cause a linear rate of warming to appear like it is non-linearly increasing, or accelerating. The perceived warming goes as the square of the actual temperature increase.
In fact, even if warming was slowly decelerating, it would still look like it was accelerating.
If this was a graphics artist playing around with data in various kinds of display software, I might be able to excuse it as artistic license.
But the fact that a climate researcher would do this is, well, surprising to say the least.
Perhaps a regular histogram would be less deceptive, but I would also add that the bar width should be relative to the size of the country. Somehow, Cuba and USA being the same size is not an accurate representation. Also, Europe represents almost 1/4 of the graph because of the number of small countries that exist there.
Dr. Goebbels would be very happy.
Just last post, anti-human climate alarmists went berserk because the good doctor misplaced a comma.
What are the chances, other than absolute zero, that the same anti-human climate alarmists will criticize in any manner whatsoever these deceptive visualizations or their author?
The good doctor was trying to prevent people from becoming hysterical while Lipponen is unequivocally trying to make people hysterical.
The good doctor was trying to put forth good science while Lipponen is unequivocally making a reprehensible and despicable use of science.
Yes, you do sound hysterical.
Svante, please stop trolling.
The implication being that people concerned about global warming are like Nazis?
You should be banned from this site.
David,
After all the ad hominem things you’ve said and come close to being banned, if memory serves…..
I call Gordon stupid and dishonest when he’s stupid and dishonest. As many people here understand he is.
I ever compared anyone to the Nazis, who exterminated 6 million people like they were rodents and are an example of the most immoral people to ever exist.
If you think that describes those who know and understand the science of AGW and are warning about it, then you are big part of the problem.
David, please stop trolling.
@Appell: I suspect the specific Goebbels reference is alluding to Goebbels’ expertise in disinformation and “The Big Lie” rather than a general reference to Naziism.
The intent is to deceive rather than inform. Another fairy tale to frighten children.
Currently we are in an Ice Age. We should be welcoming higher temperatures and higher concentrations of CO2 in the atmosphere.
Anti-human climate alarmists too know it is all crap that means crap. The YouTube comments do not show fear. If anything, they are gloating.
So, are we supposed to be surprised by this, Roy?
I was surprised. I can’t speak for others.
Yes, very deceptive. A small change in temperature can be made to produce a large change in color, or vice versa. The result can be misleading. Here is another example:
https://www.telegraph.co.uk/news/earth/environment/globalwarming/12117449/Animation-100-years-of-global-warming-in-less-than-a-minute.html
A similar idea is the “climate spiral”, where a small temperature change results in a drastic change visually:
http://www.climate-lab-book.ac.uk/files/2016/05/spiral_optimized.gif
yes, in that case the exaggeration is linear with temperature increase… the line segments get longer with warming. For the temperature circle the exaggeration goes up nonlinearly.
Maybe the diagram is for entertainment purposes only…like that third-order polynomial fit that used to show up here monthly.
a third order fit to the data will always be a better fit than linear. The trouble is people want to then extrapolate it into the future, which is risky at best. You know very well this is a different issue entirely…your flippant comment shows you can’t defend the “temperature circle”, David.
Of course people want to extrapolate trends into the future…. Your’s predicted the world would end in December 2170:
https://davidappell.blogspot.com/2012/04/roy-spencers-entertaining-polynomial.html
Why am I expected to defend this temperature circle? You have a point, though whether AGW’s impacts scale linearly isn’t so clear.
I would say “flippant comment” characterizes David’s output pretty well.
No DA.
Roy was simply trying to show a cyclical nature with that curve. We all got that.
He was not trying to mislead. You know that too. You literally spend more time on here than Roy. You need to chill out. Seriously, go outsid and enjoy the weather before it’s too late.
A 3rd-order polynomial does not model a cyclic curve.
sure it does, albeit very roughly. Just take the taylor series for a sine and cut off higher term an’d u’d end up with some kind of polynomial of nth order. nOt a good predictive tool though.
If you can arbitrarily cut off a function whereever you want, then any polynomial can work.
The purpose of a fit is to summarize the data according to the underlying physics. There is no reason to think that temperature has been a 3rd-order function of time. But there IS a reason to think it’s (so far) been increasing linearly with time…
“But there IS a reason to think its (so far) been increasing linearly with time”
Only if you are a mathematical imbecile.
There is almost zero sign of linearity.
Just two periods of near zero trend, with a step change.
The third order poly was a better fit, but just as meaningless.
” Mike says:
Roy was simply trying to show a cyclical nature with that curve. We all got that.”
If “We all got that (the temperature is cyclical)” without Dr Spencer actually making that assertion, doesn’t that suggest the graphic was at least leading if not misleading?
For what it’s worth, the third order polynomial fit to the full UAH at present is nearly indistinguishable from a linear fit.
Mark B says:
For what its worth, the third order polynomial fit to the full UAH at present is nearly indistinguishable from a linear fit.
a) I doubt that.
b) It certainly wasn’t true back when Roy was putting forth a 3rd-order polynomial fit:
https://davidappell.blogspot.com/2012/04/roy-spencers-entertaining-polynomial.html
I wonder if Roy would have even offered it if the fit near the latest data wasn’t going down….
If I’ve done it correctly, the current linear and 3rd order fit are shown here:
http://i65.tinypic.com/1sdteo.jpg
[IMG]http://i65.tinypic.com/1sdteo.jpg[/IMG]
Bother . . . link to different host:
https://southstcafe.neocities.org/uahPlots.html
DA,
You seem to be the only one confused / frightened / non-comprehending / fixated on the 3rd degree polynomial that was presented for a time. Despite the qualifications, despite attempts to satisfy you, you seem to be unable to go on with life.
Give it a rest. You may enjoy life more, and others will have higher opinions of you.
Lame.
David, please stop trolling.
An Inquirer says:
DA,
You seem to be the only one confused / frightened / non-comprehending / fixated on the 3rd degree polynomial that was presented for a time.
————————-
I guess David didnt feel confused or frightened, but misled by this polynominal fitting.
So did I.
The Graph suggested, warming is over and temperatures would now decrease.
Maybe Dr Spencer just was misled himself? By a kind of wishful-thinking?
The climate spiral starts in 1850, with the earth’s temperature represented as pitch black. That, to me, is the deception.
Better would be to start with a large, bright spiral (representing the pre -industrial global average), and then show temperature changes from there. IOW, we need to see the initial state in order to put any changes in perspective.
Whatever the initial state, it was one we had adapted to. What we’re concerned about is perturbations from that initial state, not whether it was 15 C or 5 C or 30 C. Whatever it was, it was what we have adapted to and, until recent decades, expected to continue.
“Whatever the initial state, it was one we had adapted to.”
And we haven’t adapted to the current state? What kind of bs is this, David?
Are you regarding the “initial state” as the good ole days? How would you know?
I’m always amazed that the consensus crowd, operating from their supposedly irrefutable position, soils themselves with bs like this visual.
And I know that you feel like the consensus world counts on your contributions to this blog, but maybe occasionally you should back off and be silent. There’s not much you can say that can make a silk purse out of this ugliness.
If we’re adapted to the current state, why is Miami Beach spending $500 M of taxpayer money to deal with sea level rise?
Some of that money comes from a $7/month increase in was residents are charged for stormwater services. That’s $84/year.
Some comes from all Florida taxpayers.
We will pay for climate change one way or the other.
DA: What do you mean by ‘deal with sea level rise’, exactly?
This is a typical ‘drive by’ type statement by you – why don’t you clarify and expand what you say in your own words?
You might for example explain what factors affect flooding in Miami? If flooding’s genuinely getting worse, why? What geological factors might affect this,for example? Are the sea defences simply ageing,so are we for example talking about routine maintenance? Are there simply tighter regulations for new or replacement defences in place?
Or are you just trying to roll out yet another weakly researched argument for supposed dangerous man-made global warming – aka ‘climate change’?
For two notable hot spots:
1. melting land ice
2. thermal expansion of water
3. slowing of Gulf Stream current
4. land subsidence
– over 1/2 of SLR for Hampton Beach, VA, https://sealevelrise.org/causes/
– for Florida 20% of SLR,
https://sealevelrise.org/florida/causes/
DA: Thanks for the links.
In Dr. Spencer’s Kindle book in which he critiques Al Gore’s claims, he describes a visit by Gore to Miami Beach during a street flooding event.
Spencer comments that “Its a sunny day with little wind, so we know the event is not due to a storm. Street flooding in Miami and Miami Beach occurs during high tides called ‘king tides’, due to the alignment of the Earth, sun, and moon. For decades they have been getting worse in low-lying areas of Miami Beach where buildings were built on reclaimed swampland. Skyscrapers have existed there for up to 90 years. Clearly, sea level has been rising naturally there for over 100 years, presenting a problem that probably no one was concerned about at the time.”
Spencer also points out that “A study of the area published in 2017 entitled ‘The Contribution of Land Subsidence to the Increasing Coastal Flooding Hazard in Miami Beach’ by researchers in Italy and the University of Miami using satellite radar interferometry, revealed that the land there is actually sinking at a rate of up to 3 mm/yr (about 1 inch per decade). That almost exactly matches the rate of global sea level rise, making the effect of sea level rise (which is mostly natural) twice as bad in Miami Beach. So, here we have Al Gore once again blaming a flooding problem on global warming, when the real proximate cause is clearly dominated by (1) natural sea level rise that has been occurring for over 150 years, combined with (2) gradual sinking of unstable land. Has global warming made the problem worse? Maybe somewhat who knows? But its clear that the low-lying portions of Miami and Miami Beach would have to deal with rising sea levels with or without human-caused global warming.”
The above is from: Spencer, Roy. An Inconvenient Deception: How Al Gore Distorts Climate Science and Energy Policy (Kindle Edition)
If SLR in Miami Beach isn’t a problem, why are they spending $500 M on pumps, to raise streets and to enhance drainage?
People generally don’t spend 1/2 billion dollars on nonproblems, right?
Here’s an eye-opening article that I read several weeks ago:
https://www.miamiherald.com/news/local/community/miami-dade/miami-beach/article209328849.html
This article is about Miami home prices appreciating slower near the coast then further inland, the opposite of what is expected:
https://therealdeal.com/miami/2018/04/20/miami-home-prices-are-feeling-the-impact-of-sea-level-rise-new-research-suggests/
This seems to be candidate for a new book, on the order of
Darrell Huff’s “How to lie with statistics” and
Mark Monmonier’s “How to lie with Maps”
Suggested title: How “climate scientists” lie. By Roy Spencer?
Does deception come about because of evil intent, mischief, ignorance, or merely accident?
Yes.
Does yours?
Or maybe the author just hadn’t thought of this aspect of his graph before he posted it.
Not everything is done for evil purposes.
You did see the “merely accident?” – – right?
How could it be an accident?
“Not everything is done for evil purposes.” Nobody’s saying it’s “evil”, David. It’s just the latest example of the consensus advocates’ inability to resist distorting the facts. What’s wrong with these people? Don’t they have the truth on their side.
Obviously, they’re not as confident in their position as they let on.
Notice how you have generalized from one guy who made one graph to an entire set of people.
Do you think that’s fair?
Would you like it done to you? It’s easy to do; just let me know….
spalding craft says:
How could it be an accident?
You’re kidding, right??
I did not think of what is probably most common: Confirmation bias.
Ignorance is gradually being fixed. Accidents can be corrected.
Hi Dr. Spencer,
just to be on topic about “artistic license”, at the TV news yesterday night I heard a very interesting climate definition. Maybe you in the US already heard that, but for me it is the first time I heard.
The newscaster defined the current weather here in Italy a “climate disorder”, and I find it very “artistic” indeed.
So, as opposite to the current “dangerous” situation should exists also a “climate order” I suppose, don’t you? ; – )
Hoops!
I missed to report you that it’s about three days that the same TV news trumpets that the temperature at the “North Pole” is at a record 32C!!!
The first day I didn’t care of the notice because I believed that they mistaken the units thinking that they read 32C instead of 32F, but the second day when they raised to 34C the value I decided to stop my business and following the news.
The idiots were talking about the city of North Pole (AK) where Santa Clause reads the children letters.
What is important to me is that they still report the exceptional warming at the “North Pole”.
Hope you have the rights to see this video of today:
https://video.virgilio.it/guarda-video/clima-impazzito_ms865863
The shifting banner starts saying: “climate gone mad, warm record at the north pole…” : – )
Have a great day in sunny Alabama (I guess, the climate is so “disordered” now that it could be very cold there these days indeed)
Massimo
Im sure this is a simple colouring error but your teeny little blue ring is -2 to less than -3 degrees (eg 1 degree or less); while the outrageous red ring is -2 to +2 degrees (4 degrees coloured in).
Since you are sensibly explaining the perceived graph errors you should probable avoid your own drawing errors.
Dan, John,
Here is a graph where the colors are, in my opinion, unintentionally misleading. The blue tones dominate, and lead you to believe negative values are the majority. Looking closer, we see that’s not the case. The blue tones represent anomalies of just – 3 to – 6, whereas the red tones represent values of + 6 to + 9.
Positive values are therefore undervalued with respect to graphic design (not enough warm tones compared to cool tones), but there is no reason to believe the author is trying to lie.
http://www.atmos.albany.edu/student/ventrice/real_time/timeLon/u.anom.30.5S-5N.gif
test
I think I am limited by number of characters.
Got a question for the global warming alarmists. If the Arctic sea ice extent stays above 3,387,000 km2 through 2022, that will make it 10 years in a row closing above the 2012 minimum. Will you call that the new “PAUSE?”
Not sure what you are trying to prove here.
If there is no significant change over 10 years then “there is no significant change over 10 years”
If it decreases by 2032, it could well be “a significant decrease over 20 years”
So what?
BTW, the so-called, now extinct PAUSE you refer to relates to global average surface temperatures – not sea ice.
I know what “The Pause” is Myki. And I am not so certain that Dr. Spencer agrees with you that The Pause is over with. I was just doing what you alarmists do and make correlations. The temperature pause is probably followed up by an Arctic sea ice melt pause. I think 2018 will be year number 6 in a row closing above 3,387,000 km2. In fact, I think it will close above 4,000,000 km2 again. Care to make a gentleman’s bet?
$10 says it will come in under the long term (1981 to 2010) average minimum (about 5 mill. km2 in September).
$10 says the Antarctic value will also come in under the long term (1981 to 2010) average maximum (about 18.6 mill. km2 in September).
Myki, I agree that the Arctic sea ice will close below 5,000,000 km2 this year and the Antarctic sea ice maximum will close below 18,600,000 km2 this year. Polar ice does not reverse course on a dime! But you global warming alarmists are the ones trying to make the case that the Arctic sea ice is “falling off a cliff” as your leader Al Gore said it would. I strongly disagree with that assessment. I think the Arctic ice will GRADUALLY recover from its 3,387,000 km2 minimum in 2012. And I think we are currently seeing the recovery in process.
So Myki, how about a gentleman’s bet through 2022? I think the Arctic sea ice will remain above 3,387,000 km2 through the 2022 minimum.
Rob Mitchell says:
If the Arctic sea ice extent stays above 3,387,000 km2 through 2022, that will make it 10 years in a row closing above the 2012 minimum. Will you call that the new PAUSE?
No.
I actually asked about the 2012 Arctic SIE dip of an N.S.I.D.C. scientist two years ago at an AGU Meeting. He told me that 2012 was such an anomalous year — there was a big summer cyclone that chewed up the ice, making it much easier to melt — that he wouldn’t be surprised if we were still talking about it in 10 years.
“Finnish climate researcher Antti Lipponen posted a new way to visualize global warming”
I’m not sure what the fuss is about. It was only a post, not a published bit of research.
Secondly, instead of complaining, try coming up with a less “misleading” representation of the data.
Here’s a representation from NASA GISS, showing the same data as what Lipponen used. The line widths for each year are all identical. It’s a global representation, so it simply and clearly illustrates what’s happening without devoting more space to the current warmer climate. Every year is present.
https://data.giss.nasa.gov/gistemp/graphs/graph_data/GISTEMP_Seasonal_Cycle_since_1880/graph.html
Not quite. Lipponen showed changes in regional annual means.
The GISS graph shows changes in global average seasonal cycles.
b fagan: that GISS graph does not have the characteristics of the graph Roy is writing about in this post.
This is an extreme example of what Dr Brignell at numberwatch.co.uk drew attention to viz. in this case the propensity of alarmists using graphic techniques to visually exaggerate recent temperature trends coining the term ‘chartmanship’:
http://www.numberwatch.co.uk/chartmanship.htm
As an interested layman I recognise many examples of deception e.g. smoothed graphs extended to end points, mixing data points of various resolution on the one graph:
https://en.wikipedia.org/wiki/Eemian#/media/File:All_palaeotemps.svg
How would you try and represent the data?
The circle is deceptive. That doesnt surprise me nor should it anyone. Its what warmers do.
But this is no more silly than pointing to any temperature change in a positive direction and then claiming all the other sources of warming except CO2 have been ruled out. Especially with altered temperature records that cannot be justified excluding the satellite record.
Which natural warming factors haven’t been ruled out? List them.
PS: Adjustments are done to remove biases. They *reduce* the long-term warming trend.
You just answered your own question oh bright one/sarc
That was my point. According to you and your religious followers, all natural effects have been “ruled out”.
So you incorrectly conclude CO2 is causing the warming.
Chuck: What natural factors could be causing the observed warming? Which ones haven’t been considered?
List them.
Meanwhile there is every theoretical reason to expect CO2 causes global warming, both from paleoclimate studies and from simple physics and modeling.
And its radiative forcing has been observed to be increasing, as I’ve told you many times: Harries+ 2001, Philipona+ 2004, Feldman+ 2015.
And the water vapor content of the atmosphere is increasing too.
David, please stop trolling.
Chuck
The temperature will continue to change in a positive direction. How will you explain it given solar output is at or nearing a 100 year low?
My guess: he’ll fall back on conspiracy theories.
David, please stop trolling.
i am still waiting for an answer to the question, “what is Earth’s NORMAL temperature?”
i either get no response, or some guy spewing filthy language telling me to go back to baking cookies, or knitting s**t, or whatever.
Well SewingSusie, if you go back 600,000 years the “normal” for that time frame is much colder than now. And we should all thank our lucky stars we are living in this nice, mild Interglacial Period as opposed to a Glacial one!
It’s more likely the case that the Holocene made civilization possible, not that we just happened to get lucky and be born during the Holocene.
Which is why we should be very cautious about changing the climate we depend on.
Dumb David,
Prove that change cannot be for the better.
Produce prestigious journal peer reviewed research to support your mad assertion!
How hard can it be?
Cheers,
David, please go do some research in History and Anthropology. The Holocene did not per se allow for civilisation, but the unusual stability of the Holocene did. It put us out of reach of the D-O events that constantly destroyed our ancestors ability to settle down.
If it weren’t for the D-O events, civilisation would have started much earlier, just in a different fertile area.
I would say normal is what humans have adapted to over last 1000 y or so.
Normal means our major cities are neither under water or under ice.
Normal means our water supplies for our cities continue to be reliable.
Normal means our agricultural regions continue to have favorable seasonal patterns.
S,
It might be a cliche, but the “normal” temperature is whatever it happens to be.
When the surface was molten – normal.
When cool enough for liquid water to form – normal.
When it was only 10 K hotter than whatever it is now – normal.
Now – normal. It all depends on your definitions, and to a climatologist definitions are flexible. Pseudoscience is defined as science. Cooling is defined as heating. And so on.
Try asking for a definition of the GHE!
Stupid and ignorant GHE true believers have no option but to spew nonsense at people who feel disinclined to worship their graven idols – the hockey stick being one such.
Cheers.
Normal Earth temperature is the entire ocean average temperature of about 10 C.
Icebox climates have this ocean temperature in range of 1 to 5 C and the other climate extreme is hothouse climate which is ocean around 15 C or warmer.
Our ocean current has average temperature of about 3.5 C and we have been in an Ice age or icebox climate for millions of years.
And in the last interglacial period about 120,000 years, ocean became as warm as about 5 C- and had tropical or semi-tropical life living in Germany.
Another aspect of icebox climate is have permanent polar ice caps- which we have have for over an million of years. So in last interglacial period [btw, called, Eemian] in warmest periods we still had polar ice caps.
Wiki, Eemian:
https://en.wikipedia.org/wiki/Eemian
The last hothouse climate was, Wiki:
https://en.wikipedia.org/wiki/Paleocene%E2%80%93Eocene_Thermal_Maximum
Our entire ocean is about 3.5 C. The entire ocean average surface temperature is 17 C.
Tropical ocean surface is about 26 C.
Average of all land temperatures is about 10 C.
US average land temperature about 10 C, but just the lower 48 states are about 12 C.
Ocean surface temperature has varied over the last 100 centuries, and decreases or increases in ocean surface temperature have large effects upon land average surface temperatures- and land is only 30% of surface area of Earth.
Tropical ocean is about 40% of entire surface, and tropical ocean is known as heat engine of global climate.
We have an average global surface temperature of about 15 C, because the ocean average surface average is about 17 C
That post “The dog that did not bark” attracted some comments from David Appell who accused me of being a “liar”. He is good at name calling but seldom offers evidence that makes sense.
Back in 2013 David was trolling amateur climate scientists like this camel but today he thinks he can handle Dr. Roy and his canny fans. Dream on.
You have to love his persistence!
Yet again, where is your missing 150 W/m2?
David, please stop trolling.
We are mammals and we got our chance to fill niches vacated by the dinosaurs that used to dominate the planet about 65 million years ago.
It is no accident that the “Mammal Explosion” occurred when oceans at high latitudes were 18 Kelvin warmer than today. The average global temperature was probably about five or six Kelvin warmer than today and there was much more CO2.
What I am trying to say is mammals did well during the PETM (Paleocene-Eocene Thermal Maximum). Here is the proxy temperature record:
https://en.wikipedia.org/wiki/Paleocene%E2%80%93Eocene_Thermal_Maximum
This Wiki contains much “Science” that is questionable but this statement is confirmed by the fossil record:
“Success was also enjoyed by the mammals, who radiated extensively around this time.”
Notice that the last two million years have been unusually cold with icecaps at both poles even during the warm periods. We are fortunate to be living in a warm period ((Inter-glacial). Inter-glacials are relatively short compared to glacial periods as can be seen in the Vostok and EPICA ice core studies:
https://diggingintheclay.wordpress.com/2013/05/04/the-dog-that-did-not-bark/
Civilization developed during the Holocene. Not before.
We change climate at our own peril.
how much civilization do you think would survive an ice age?
Tactics designed for the lowest common denominators to whom plain numbers would be completely meaningless , coloring book for the sheeple.
Sewing Susie
This might answer your question, although a bit outdated (as of 2010):
https://www.currentresults.com/Environment-Facts/changes-in-earth-temperature.php
The temperature will continue to change in a positive direction.
And how do you know this, Snape?
How will you explain it given solar output is at or nearing a 100 year low?
What does that mean? Solar irradiance? Solar magnetic? How long does either take to respond and exactly in what manner with respect to the atmosphere? Care to explain?
Why is the climate still cooler today that past interglacials that had less CO2?
I dont have all the answers, Snape, except that Im certain atmospheric CO2 doesnt have anything to do with it, and that doesnt take much reasoning when you look at facts. The fact that water vapors ab-sorp-tion bands in one of its rotational frequencies overlap the bending mode of CO2 s 15 micron band and water vapor absorbs just about everywhere else in the earths IR spectrum including the atmospheric window when condensation occurs. And the ab-sorp-tion coefficients are very weak where the RF is being calculated. It takes 6800 meters from the ground to get much further ab-sor-bing at the wings from the surface, and yet I see many make the mistake these wavelengths can be treated like the bands are that ab-sorb rapidly near the surface like water vapor for a maximum GHE.
There is no way that atmospheric CO2 can control the earths optical depth given that both constituents cool the troposphere in exchange for a warmer surface. The optical depth of water vapor and clouds are controlling on CO2 and water vapors optical depth is self limiting by its own thermodynamic properties. It does not amplify because if CO2, it can only amplify from solar irradiance increasing.
Therefore, atmospheric CO2 does not drive earth temperature. These were all founding principles in atmospheric science that were trashed when self centered modelers showed up and wanted huge government grants to model the climate with, something they would have never gotten had they not told the political establishment there could be a problem with CO2, and that moronic slob Al Gore helped to lead the way on this. He is still waiting for his carbon trading fraud to sweep the country that promises to make him billions more on the scam.
Dont be a fool.
Chuck Wiese says:
Why is the climate still cooler today that past interglacials that had less CO2?
Should it be warmer at this point? Says who?
Interglacials last at least 10,000 years, and up to 40,000 years. Our global warming is just getting started — it’s been around for only about two centuries. On a graph of 40,000 years that time interval is barely a blip.
DA,
Should it be colder at this point? Says who?
Are you still stupid and ignorant?
Cheers.
Ah, but a 30 year period is sufficient to use as the baseline to determine anomalies today? I see.
Slippery little bugger!
There’s nothing stopping you from choosing your own baseline and calculating anomalies with respect to it.
But, again, trends don’t depend on the choice of baseline.
Interglacials last at least 10,000 years? Since when? The ice core records says that the vast majority don’t make it to 10,000 years. Our Holocene is unusually long in fact.
I dont have all the answers, Snape, except that Im certain atmospheric CO2 doesnt have anything to do with it, and that doesnt take much reasoning when you look at facts.
But refuses to write up a paper giving these facts and submitting it to a peer reviewed journal.
What a shame. Chuck apparently holds the golden key that would eliminate the AGW problem once and for all, but he just can’t bother to let the rest of the world know about it.
https://www.giss.nasa.gov/research/briefs/schmidt_05/curve_s.gif
DA,
What is the AGW problem? Is it something to do with the GHE which you cannot describe?
Do you still believe that the undistinguished mathematician Gavin Schmidt is a world renowned scientist of any sort?
Are you really stupid and ignorant, or just pretending?
Cheers.
Appell, this is the same graph you shoved in my face when I debated you on KXL radio last month. You were so enthralled by it, it made you wet your pants and you just couldn’t refrain yourself from using it as a distraction to my closing comments that you so rudely interrupted with using this and tapping your pen on it as you placed it in front of my face when I was speaking.
What would the area under the CO2 curve on this graph look like if CO2 magically disappeared from the earth, Appell?
Only an idiot like you would assume it would backfill to the IR BB curve plotted to represent the Earth’s mean temperature. (The red line)
Go study atmospheric science, Appell. Again. Your past attempts seem to have done you no good.
What would the area under the CO2 curve on this graph look like if CO2 magically disappeared from the earth, Appell?
The question is about now, not your hypothetical world.
Do you have any kind of scientific response, Chuck? Or just one insult after another, rooted in fear?
David, please stop that trolling.
These were all founding principles in atmospheric science that were trashed when self centered modelers showed up and wanted huge government grants to model the climate with, something they would have never gotten had they not told the political establishment there could be a problem with CO2, and that moronic slob Al Gore helped to lead the way on this. He is still waiting for his carbon trading fraud to sweep the country that promises to make him billions more on the scam.
Ah, it’s all a big conspiracy.
That explains you very well, Chuck — it precedes your science, and then determines it.
DA,
No, David, no conspiracy. Just a ragtag collection of fumbling bumblers adored by people who cannot be bothered thinking for themselves. Are you one of the gullible GHE true believers?
Cheers.
What “science” are you talking about, Appell? Modeling failure?
You are the idiot that follows deceit off of a cliff and let alone with a PhD in physics and no matter what someone tells you, your curiosity is blinded to prevent it.
Show one piece of evidence that shows the integrated optical depth (all sky over ALL IR WAVWLENGTH ) of the troposphere has increased with increasing CO2.
I know that’s hard for you, Appell, because your third rate understanding of this is limited to showing the increased opacity to the wavelengths surrounding the wing lines of CO2 and nothing else is proof.
It’s more complicated, Appell, and beyond your understanding. I’ve tried to explain it too many times to count with you. You are incapable of understanding and that I’m absolutely convinced of.
Why do we feel compelled to call people idiots, stupid, ignorant? Why don’t you criticize peoples’ statements rather than getting personal?
Let’s grow up here.
Chuck calls me names because he has no response rooted in science. And he feels threatened by that.
spalding…”Why do we feel compelled to call people idiots, stupid, ignorant? Why don’t you criticize peoples’ statements rather than getting personal?”
I realize it must seem harsh from the outside but many of us involved regard it with humour. It also serves as a safety valve. I don’t think people with thin skins should immerse themselves in blog debates.
I would prefer the debates were civil and lead to a better understanding of science. Having observed more genteel blog discussion I find them somewhat inane. Many reveal insight but just as many spew utter garbage, albeit in a civil manner.
Gordon Robertson says:
I realize it must seem harsh from the outside but many of us involved regard it with humour.
I don’t use it as humor. I really DO think Gordon is an idiot — the most stunning example of the Dunning-Kruger effect I’ve ever encountered.
And many people here have made it clear they agree with that assessment.
David, please stop acting out.
No science, Chuck.
As usual for you. Just name calling.
Chuck Wiese says:
Show one piece of evidence that shows the integrated optical depth (all sky over ALL IR WAVWLENGTH ) of the troposphere has increased with increasing CO2.
“Improving estimates of Earths energy imbalance,”
Johnson, G.C., J.M. Lyman, and N.G. Loeb
Nature Clim. Change, 6, 639640, doi: 10.1038/nclimate3043 (2016).
http://www.nature.com/nclimate/journal/v6/n7/full/nclimate3043.html
From the abstract:
“Here, we update our calculations (Fig. 1), and find a net heat uptake of 0.71 0.10 W m−2 from 2005 to 2015 (with 0.61 0.09 W m−2 taken up by the ocean from 01,800 m; 0.07 0.04 W m−2 by the deeper ocean4; and 0.03 0.01 W m−2 by melting ice, warming land, and an increasingly warmer and moister atmosphere1).”
Appell, perhaps you and these authors would like to tell us how they calculated what potion of their estimates are directly related to a claimed RF by CO2 vs. solar insolation. How do they separate insolation from the claimed CO2 RF?
I’ve asked you this question several times and you NEVER answer it, nor do any of these authors provide a satisfactory answer.
But you just keep parroting this nonsense as though it offers a proof the climate is warming from human CO2 emissions.
To those that don’t know Appell, that is is MO. You answer his questions with data, he ignores the informattion completely or cclaims it is from a “denier” site and then just keeps asking the same question over and over as though it has never been addressed.
You’re a piece of work, Appell, and that is not a compliment.
Chuck Wiese wrote:
How do they separate insolation from the claimed CO2 RF?
If the Sun were causing modern warming, the stratosphere would be warming (after accounting for ozone loss). Instead it is cooling (after accounting for ozone loss), a *prediction* of greenhouse theory.
Solar insolation is measured every day by satellites. It has been slowly decreasing since the 1960s:
http://spot.colorado.edu/~koppg/TSI/TIM_TSI_Reconstruction.png
But surface/tropospheric temperature has not.
So how can the Sun be responsible for modern warming? You never answer that. Nor do you ever give a theoretical value for the climate sensitivity due to solar. The IPCC says it’s about 0.1 C/(W/m2), which is the same number that comes from the simple energy balance model
(1-albedo)S/4 = epsilon*sigma*T^4
which gives
dT/dS = T/4S = 0.1 C/(W/m2)
—
This is very simple science that you should already know, CW.
You didn’t answer the question again, Appell, because you can’t.
Intead, you try and insert “solar sensitivity” which is only for BB radiation that has NOTHING to do with the hydrological cycle or what I asked you.
So what about that actual question, Appell? How can you separate RF from CO2 compared to water vapor, clouds and variable insolation on the oceans that change because of those factors?
Anyone who says they solved for this is a liar. Could that be you, AGAIN, Appell?
This is a basic and very severe problem for any modeler running an Oz machine because they have already admitted they cannot solve for the convective terms that contain these components.
THAT is something after all the years that YOU claim to have spent studying climate that YOU should know, Appell.
Read about “convective adjustment” in this paper by your pal modeler Ramanathan on page 464. Very lame. It reduces the model output to an overrated heap of junk, not to mention the other crippling limitations the models have…they are Oz machines, a craetion of the climate “wizards” that don’t even know how the hot air balloon works.
http://www-ramanathan.ucsd.edu/files/pr15.pdf
Correction to above. See page 467 for model teeatment of convection laneled “convective adjustment”.
Chuck Wiese says:
So what about that actual question, Appell? How can you separate RF from CO2 compared to water vapor, clouds and variable insolation on the oceans that change because of those factors?
Chuck I’ve answered this question many times before.
Why are you ignoring those replies?
When are you going to publish — or just get up the courage to submit — your Nobel Prize winning that proves every scientist in the world wrong for the last 125 years?
What are you waiting for?????
Roy’s site is never big on allowing links to actual data, and it won’t allow them here again.
Maybe I can provide them piecewise, but that’s the best I can do.
2) large regions where CO2 absorbs but there is little water vapor — the polar regions, the stratosphere
3) mean water vapor concentration in the atmosphere is increasing
4) the cloud feedback is very probably positive
—
https://tinyurl.com/y7d2s5gs
Roy just won’t allow specific data to be posted here. Convenient.
There are lots of CO2 ab.sorp.tion lines that don’t overlap water.vapor–
Between 665669/cm there are over 2,000 lines.
Between 647 687 cm-1 there are over 16,000 lines.
Between 500 800 cm-1 (12.5 μm 20μm) there are almost 63,000 lines.
Over 248,000 lines for CO2 are above 800 cm-1 , i.e., between 0-12.5 μm.
https://tinyurl.com/y7d2s5gs
https://scienceofdoom.com/2011/03/07/understanding-atmospheric-radiation-and-the-%E2%80%9Cgreenhouse%E2%80%9D-effect-%E2%80%93-part-eight/
Roy’s site also deletes many characters.
Between 665669/cm there are over 2,000 lines.
*Between 665 & 669/cm…
Between 647 687 cm-1 there are over 16,000 lines.
*Between 647 & 687/cm….
Between 500 800 cm-1 (12.5 μm 20μm) there are almost 63,000 lines.
*Between 500 & 800/cm….
David, please stop accusing Dr Roy of nefarious activity because of your bizarre need for attention.
Chuck,
I agree with your CO2 comments. I have used a thermodynamic calculator to calculate the atmospheric heat capacities through a range of compositions from zero to 280 to 410 to double that and to 1600ppm CO2. Holding water constant at 0.986% and methane constant at 0.000179 mol%. The calculator uses equations of state (in this case I used PR78 Peneoloux (T) to approximate real gases from ideal gases. I applied the flshed calcs through 1km slices of the troposphere at the various pressure and temperature conditions through these 12 individual slices. I then summed all the data for each layer to represent an average tropospheric heat capacity and mass. I then applied the basic equation Tf = Q/mCp + Ti. where Tf is the final temp, Ti is the initial temp (in this case 15C), Q is the net solar input after all the forcings are applied (modified NASA energy budget), m is the mass of the troposphere and Cp the net heat capacity in J/kgC. I tuned the overall energy budget to two scenarios. 1) Global satellite tempes from 1979-June 2018 being 0.139C/decade and 2) Soon and Connelies (2015 paper) rural station data over 60 year TSI cycles being 0.338C/decade. I used a solar cycling of +-0.15%. Hence my overall calcs were matched to a 39.5 year cycle (satellites) and a 60 year cycle. The net result is that increasing CO2 from preindustrial 280 ppm to 1600 ppm (whcic of course is over exaggerrating CO2 increase over 60 years) PRODUCED A -0.0102% INCREASE IN TEMPERATURE. ie a TEMPERATURE DECREASE ASSOCIATED WITH A CO2 INCREASE. In order to address potential critics that only CO2 and water vapour ABSORB in the IR and N2/O2 absorbances in the UV are not part of the equation (which I disagree with), I nevertheless repeated all of the above taking N2 and O2 out of the equation. These two species have higher heat capacities than CO2 which would mean that they would absorb more heat in order to raise the T by 1 degC. That means that with these major components missing, I had to normalise the atmosphere to 100% by keeping water, CO2 and methane at their respective mol% amounts and had to increase Argons mol % substantially to account for the loss of N2/O2. This would actually bias the results beacuse Ar has a significantly lower Cp than these components removed. Nevertheless, I did this and the resulting temp increase over 39.5 years was 0.19C/decade BUT AGAIN THE TEMP DECREASED BY 0.0327% WHEN COMPARING 280 ppm CO2 to 820 ppm CO2.
I have not seen anyone use such thermodynamic calcs in the climate research arena.
Lachlan…”I agree with your CO2 comments. I have used a thermodynamic calculator to calculate the atmospheric heat capacities through a range of compositions from zero to 280 to 410 to double that and to 1600ppm CO2″.
Your methodology is interesting but I wonder if it can explain why the air pressure at the top of Everest, near 30,000 feet, is 1/3 the pressure at sea level. Or the fact that the temperature is commensurately lower?
Gordon, I sliced the atmosphere into 1 km slabs and calculated the net heat capacity at each one of those P/T slices. So my 8km slice had a temp of -37C and a pressure of 0.33 bar to give a net Cp of 1030.35 J/kgC and at 9km P of O.3 bar and -44C gave a net heat capacity of 1030.97 J/KgC. So at 8,800m on top of MtEverest the temp on a bad day would be close to -44C. My method just calculates the varying properties (not just Cp)of the atmosphere at all these different flash points. So the P/T conditions through the Troposphere in my modelling are inputs, not outputs.
Lauchlan says:
I have used a thermodynamic calculator to calculate the atmospheric heat capacities through a range of compositions from zero to 280 to 410 to double that and to 1600ppm CO2.
The mechanism of anthropogenic global warming isn’t based on heat capacities.
This is exactly the problem David with so called anthropogenic causes of global warming. The only basis for this theory was a correlation of increasing CO2 with increasing global temperatures. Not very scientific at all. Then of course the so called Green House Effect is entirely based on heat capacities though it has never been articulated as such. Water vapour, and its heat capacity of 4500J/kgC, plus its way higher composition in the atmosphere than CO2 with a heat capacity of approx 880 J/KgC is the GHG driver by a million country miles. Not CO2. And please dont quote Shakums 2012 paper that global warming was preceeded by CO2 concentrations during the last deglaciation. So, in summary, if heat capacities are excluded from explainining the GHG effect then basic science clearly has no place in the climate debate. Which of course is obvious from the 100Os of papers written on anthropogenic causes of climate warming that basic thermodynamic science has no place.
Thanks for your response, Lauchlan. Interesting calculations you have made that mirror the founding principles in atmospheric science.
The conclusions by the founders of the discipline reached a similar conclusion in that even though atmospheric CO2 makes a “contribution” to the GHE, it cannot control the IR radiation balance in the troposphere because both constituents cool the mid and upper layers in excahnge for a warmer surface by radiation and the cooling self limits the presence of water vapor by lowering its saturation vapor pressure that is contributed from CO2.
The ensuing convective overturn creates a hydrological cycle that releases latent heat back to the troposphere and the resulting cloud formations “reset/reduce” optical depth with respect to water vapor and CO2 as the clouds radiate the latent heat at a lower pressure, meaning re-absor-binance at the lower pressures continues to be reduced in the upward flux. The clouds also short circuit solar insolation with reduces surface heating.
The hydro cycle maintains a steady mean optial depth that CO2 cannot control.
Lauchlan says:
This is exactly the problem David with so called anthropogenic causes of global warming. The only basis for this theory was a correlation of increasing CO2 with increasing global temperatures.
Very wrong.
You need to study more.
You should read “The Discovery of Global Warming” by Spencer Weart, and then “The Warming Papers,” edited by Archer and Pierrehumbert.
As usual Chuck presents a lot of gobbledygook hand waving with no data or evidence to support his many claims.
Chuck thinks the way to win a science debate isn’t with data and evidence, but by being the angriest guy in the room.
David, please try to resist the urge to troll.
“Why is the climate still cooler today that past interglacials that had less CO2?”
The answer is that CO2 does not drive temperature. Temperature drives CO2 given that high resolution ice core studies show that temperature leads CO2 by 500 to 800 years. This time delay is easily explained in terms of Henry’s law. It takes hundreds of year to warm up the oceans so that they release dissolved CO2. Here is a link that I used earlier on this thread:
https://diggingintheclay.wordpress.com/2013/05/04/the-dog-that-did-not-bark/
A) You’re talking about natural periods of warming, not like today’s when we’re digging up fossil fuels and burning them.
B) During the PETM, CO2 lead temperature.
C) “Global warming preceded by increasing carbon dioxide concentrations during the last deglaciation,” Jeremy D. Shakun et al, Nature 484, 4954 (05 April 2012).
http://www.nature.com/nature/journal/v484/n7392/full/nature10915.html
David-Take a look at Global satellite temp anomolies. Plot the MaunaLoa CO2 levels on this graph. Just start for example in 2005 and end in July 2018. You will see oscillating CO2 levels. The overall CO2 increase for this period is 1.87 ppm /year (presumably humans right?). But look at say the last 1.5 CO2 oscillations from 2016.7 to June 2018.There is an increase of 9.45ppm/yr to the max and then a decrease of 11.71ppm/year. So clearly humans went on a binge during the 9.45 ppm/yr period, realised the folly of their ways, and then stopped all emmissions to reduce the CO2 by 11.71ppm/yr. Well done humans you say! You may acknowledge the major max temperature peaks throughout the 39.5 years of satellite data to be ENSO events? You may also acknowledge these major C02 swings of above amplitudes to be driven by the oceans? You clearly dont acknowledge suns solar cycling-as little as we understand today, apart from the 11 year TSI cycles?
Why do you think 13 years is an adequate representation of climate change?
David, Of course 13 years is not an adequate representation of climate change trends but sometimes one has to evaluate trends over a small period of time as well, as I was attempting to explain with this 2 year time period to cover an entire CO2 oscillation. These oscillations are reflected across the entire data set of CO2 readings so was just making a point on one of them. But clearly when one sees the very high correlation between ENSO events and temperature spikes over the 40 year global satellite data history then it is clear that the atmospheric response times to ENSO events in the order of < 1 year shows how dynamic the ocean/atmosphere interractions are. Which we all know anyway from the anomolous climate events associated with El Nino vs La Nina. One could speculate that these high ramps ups and ramp downs of the CO2 trends are oceans spewing CO2 on a periodic basis but at this stage I just put this observation in the speculation basket.
Lauchlan:
Why are El Nino seasons getting continually warmer?
Why are La Nina seasons getting continually warmer?
Why are neutral seasons getting continually warmer?
Here are those data:
https://davidappell.blogspot.com/2018/07/increasing-temperatures-of-enso-seasons.html
Why is the ocean steadily gaining heat, year after year? Where is that heat coming from?
https://is.gd/H9wXag
cam…”Why is the climate still cooler today that past interglacials that had less CO2?”
While reading on one of the Shackleton expeditions to Antarctica, circa 1910, an expedition geologist, who was an expert in glaciation, explained that glaciers, on average, have been receding for a long time. Long before the IPCC inferred that anthropogenic gases are causing the current recession.
Glaciers did expand during the 400 years of the Little Ice Age but prior to the LIA they have been receding for millenia.
Shackleton was a geologist, not a glaciologist. By your own standards, Gordon, he was therefore not allowed to speak on glaciers.
gallopingcamel says:
July 24, 2018 at 11:44 PM
….
The answer is that CO2 does not drive temperature. Temperature drives CO2 given that high resolution ice core studies show that temperature leads CO2 by 500 to 800 years. This time delay is easily explained in terms of Henry’s law. It takes hundreds of year to warm up the oceans so that they release dissolved CO2.
————————–
But today oceans dont release CO2. They still absorb.
We know for sure, that human emissions drive CO2. The amount is known. Nature with Plants and oceans absorb about the half of it; fortunately.
Chuck wrote:
The optical depth of water vapor and clouds are controlling on CO2 and water vapors optical depth is self limiting by its own thermodynamic properties.
What does this gobbleygook mean???
Explain. Details. Equations. Data. Graphs.
Appell, this is another thing I’ve explained to you over and over and over and over and over.
You just don’t get it or you don’t want to get it because like most warmers I deal with, your “science” is an environmental religion.
Try looking up radiative flux divergence.
If you had a clue which you should have by now, you would realize that absor-bin-ance of IR radition is not constant after a re-emission from lower altitudes and higher pressure. With each succsessive step upward, less is ab-sor-bed at lower pressures and thus more of the re-emission from lower altitudes escapes to space..called flux divergence.
This causes cooling of the upper layers, Appell.
You should be able to figure out the rest from intuition, but I realize that is a challenge for you considering how much time I’ve already wasted trying to explain it to you.
I’m not your personal atmospheric science instructor, Appell. Explaining these concept once should be enough for you to get a picture of what is going on.
As far as the use of equations, you demonstrated on Roy’s article posted on summer climate hysteria that you are having a problem understanding the concepts of basic integral calculus.
Equations? Data? Evidence?
You never have any Chuck.
I actually don’t think you have any data whatsoever to support your story that you read in some undergraduate textbook from the 1950s.
I also don’t think you’ve made any attempt whatsoever to find such data, or to understand why all modern scientists think/know that CO2 is causing warming.
Chuck Wiese wrote:
This causes cooling of the upper layers, Appell.
Of course. Everyone knows that GHG theory implies a cooler stratosphere. And stratospheric cooling is observed, once you correct for ozone loss. Which rules out solar warming.
So what’s your complaint?
No, Appell. I’m talking about the middle and upper troposphere where cooling is occuring from wavter vapor and CO2 flux divergence, not the stratosphere.
Chuck my boy, why don’t you provide data and evidence so EVERYONE will know what you’re talking about, instead of having to guess.
Maybe they don’t teach this to Penn State bachelor’s student in the ’40s, but they will when you go to get some advanced degrees in your retirement.
Appell, for someone who claims to understand radiative transfer and the theory behind it, these asinine statements of yours just dig you further into displaying your utter ignorance of atmospheric science.
The water vapor bands beyond 15 microns cause significant heat loss in the tropsphere. You of all people should be able to reason and calculate that yourself. With ab-sorp-tion coefficients that range from 500m-1 to 5000m-1 above 15 microns, surface radiation is ab-sorb-ed completely within 1/2 centimeter from the surface and depleted rapidly in re-emission. Cooling rates are calculated to be 2-2.5 degC/day.
Have you ever seen the temperature lapse rate in radiative equilibrium, Appell?
Appell, there is no excuse for your ignorance. You demonstrate you have no further knowledge about atmospheric science or basic meteorology over what would be taught in a general high school course, and yet you are supposed to be a PhD in physics, and you parrott the same gibberish that founding principles in atmospheric science are no good only because they were derived 80 or more years ago.
With your absurd reasoning, gravity and relativity should be no good anymore because of the age of their discovery.
Chuck: the world is flat.
David: here’s the long-known evidence for why everyone understands that the world is round.
Chuck: You’re parroting!
Chuck Wiese says:
July 27, 2018 at 7:53 PM
Im talking about the middle and upper troposphere where cooling is occuring from wavter vapor and CO2 flux divergence, not the stratosphere.
Where is the evidence of this cooling, Chuck?
UAH v6.0’s data for the middle troposphere show a warming trend of +0.09 C/decade since 1979.
That’s warming, not cooling.
Appell, only a fool would think that the cooling rates I gave are given as absolute values to any longer term trend. The climate can warm. The climate can cool. In either scenario, energy input to the atmosphere from solar, solar magnetic ( possibly but not enough understood yet to be sure ) or convection from the surfcae can add heat.
Regardless of the longer trend if any, water vapor contributes to a significan heat loss in shorter term time,(daily) and the radiative cooling especially from wavelengths greater than 20 microns has an equivalent loss of 2-2.5 degC/day. In the warmer months there is a net gain to warm the troposphere and a net loss for cooling in the fall and winter months. The radiation emission leads to a constant loss of energy that moves the temperature lapse rate towards convective instability to re-warm the troposphere when the lapse rate approaches dry adaiabatic or greater.
If more energy is added to the system from an external source, of course, things will get warmer as we see regularly with the change of seasons in each hemisphere. If there is a longer term change in solar or solar magnetic, albedo, ect. the earth will respond by warming or cooling, but water vapor will continue to remove heat from the troposphere continuously.
I should have realized with your lack of analytical ability that you would mistake the daily rate of equivalent heat loss as something that overpowers much larger forcing mecahanisms and therby establish a tropospheric warming or cooling trend as you just tried to do by giving the long term trend of the mid troposphere from the satellite record.
Chuck Wiese says:
July 27, 2018 at 7:53 PM
Im talking about the middle and upper troposphere where cooling is occuring from wavter vapor and CO2 flux divergence, not the stratosphere.
Again, where is the evidence of this cooling, Chuck?
The UAH v6 middle troposphere is warming, not cooling. (Download the data and see for yourself.)
Chuck Wiese says:
The radiation emission leads to a constant loss of energy that moves the temperature lapse rate towards convective instability to re-warm the troposphere when the lapse rate approaches dry adaiabatic or greater.
Where is the data showing that?
Chuck Weise wrote:
If more energy is added to the system from an external source, of course, things will get warmer as we see regularly with the change of seasons in each hemisphere. If there is a longer term change in solar or solar magnetic, albedo, ect. the earth will respond by warming or cooling, but water vapor will continue to remove heat from the troposphere continuously.
What is the evidence for this claim?
Malevolent entity, please stop trolling.
Chuck
I should have time tonight to respond to most of your comments. For now, here is an analysis of the current solar cycle and how it compares to previous ones.
https://wattsupwiththat.com/2018/06/07/the-approaching-solar-cycle-24-minimum/
So we are approaching a solar cycle minimum. With decreasing successive sun spot numbers since 2000 for each cycle.
According to the Russian solar physicist Abdussamotov, it takes 14 years for the climate to respond by their own research estimates. We just passed this with a major El Ninio that “blocked” the predicted response to temperature.
Will we finally begin to see this? I can’t be certain because I readily admit I am not a solar physicist and don’t have the expertise to criticize Abdussamatov or others in solar physics.
But don’t try and state the grand “solar maximum” was in the 1960’s. The sun has remained active with respect to spots in each cycle nearly as much as the 1960’s until 2000. It was only after this that we have begun to see a marked decline.
We will see soon enough whether earth temperatures will respond to these changes. There is an excellent inverse correlation to solar cycle length and temperature.
But dont try and state the grand solar maximum was in the 1960s. The sun has remained active with respect to spots in each cycle nearly as much as the 1960s until 2000.
Solar irradiance has been slowly decreasing since the 1960s:
http://spot.colorado.edu/~koppg/TSI/TIM_TSI_Reconstruction.png
But surface/tropospheric temperature has not.
DA,
And your point is?
Cheers.
The argument David makes about solar irradiance does not make sense. As I said many times solar activity should have caused warming until 2005.
Why doesn’t it make sense?
Where is the cooling since 2005?
Salvatore, since you’ve given no response, I’ll take it that you don’t have one.
Obnoxiate, please stop trolling.
So .2 Wm-2 since 1906? What does this mean, Appell? Does it mean cooling for earth if the cloud albedo decreases?
Solar magnetic has not decreased since 1960. The number of spotless days did not change with any significance until after the yaer 2000.
So you point is?
Since the 1960s, not 1906.
Read more carefully.
http://spot.colorado.edu/~koppg/TSI/TIM_TSI_Reconstruction.png
Chuck Wiese says:
Solar magnetic has not decreased since 1960. The number of spotless days did not change with any significance until after the yaer 2000.
So what?
Sunspots are an imperfect proxy for total solar irradiance.
TSI is measured directly by satellites at L1. That trumps sunspot proxy counts.
They show that average TSI has been slowly declining since the 1960s….
http://spot.colorado.edu/~koppg/TSI/TIM_TSI_Reconstruction.png
So it looks like a .2 Wm-2 decresae in irradiance since 1960.I didn’t mean 1906.
That’s very small, Appell. And solar magnetic is not the same as irradiance.
Your statements imply that the suns energy has been decresaing since 1960 enough so that if CO2 weren’t countering it, we would see cooling.
That’s an unproven concept because not enough is known about solar magnetic and how it may influence climate. The point is, the suns solar wind has remained very active in spite of a small change in irrradiance so to claim we should have been cooling is unsupportable without further understanding of how it works.
Now your statements are the true definition of “hand waiving”, not the statements I make that ARE supportable with atmospheric science and impiricle calculation.
Chuck Wiese says:
And solar magnetic is not the same as irradiance.
Then cite the data on “solar magnetic,” whatever you think that means.
Then give the Earth’s climate sensitivity to changes in that parameter.
Chuck Wiese says:
Thats an unproven concept because not enough is known about solar magnetic and how it may influence climate.
Shorter Chuck: Let’s dismiss warming factors that are obvious in favor of those we can’t prove.
Get real, Chuck my boy.
Relentless apprentice, please stop trolling,
There is an excellent inverse correlation to solar cycle length and temperature.
Where are the data showing that?
DA,
Are you really so ignorant and stupid you cannot find the data yourself?
What effort did you make? None?
Colour me unsurprised.
Cheers.
The last time I looked at Abdussamotov’s wild prediction for TSI, a year ago, it was veering off course, too low already by about 1.3 W/m2:
https://davidappell.blogspot.com/2017/06/abdussamatov-solar-irradiance.html
Where did you get this graph, Appell? The one I saved from Abdussamatov shows his expecatation since 2010 to 2018 is for a .5 Wm-2 decrease in solar irradiance.
I gave the link (of course) to the paper in my blog post.
GO read it.
https://davidappell.blogspot.com/2017/06/abdussamatov-solar-irradiance.html
Abdussamatov, H.: CURRENT LONG-TERM NEGATIVE AVERAGE ANNUAL ENERGY
BALANCE OF THE EARTH LEADS TO THE NEW LITTLE ICE AGE,
THERMAL SCIENCE: Year 2015, Vol. 19, Suppl. 2, pp. S279-S288
http://www.doiserbia.nb.rs/img/doi/0354-9836/2015/0354-98361500018A.pdf
Left out of the “hockey-stick” graph, and ignored by the AGW alarmists, are the fluctuations between the Roman Warm Period, the Dark Ages cooling, the Medieval Warm Period, and the Little Ice Age (from which we are still emerging).
i mention those and ask which of these climate periods is Earth’s normal.
Where are the data that show all these different periods?
Where are they in Marcott et al 2013?
Graph:
http://www.realclimate.org/images//Marcott.png
…and ask which of these climate periods is Earths normal.
The one to which a species has adapted.
icebox for modern humans and for most of life: both iceboxs and hothouses
Even species that lived during the hothouse climate era have adapted to today’s relatively cool climate.
“Even species that lived during the hothouse climate era have adapted to todays relatively cool climate.”
In terms of temperature or weather in general, there is not a lot of difference between Icebox and Hothouse climates.
Icebox has more deserts and glacial ice. Not many creatures live in deserts and fewer live on glacial ice.
So if flipped a magical switch from icebox to hothouse, most places where animals and people are living would not notice much difference.
Though glacial and desert area would fairly rapidly transform into non glaciers and non deserts.
If instead the magical switch transported you to such different times, it would be like flying from Iceland to Hawaii- the landscape changes with different life which is best adapted to these different climate/environments. But if in tropics and climb a large mountain, you are likewise going thru different environments.
And you have less tree-less and/or tundra regions we now have, though gain in such region where is currently just glacial ice.
So if like vast deserts and glacial ice in hothouse climate one is not going to have such vastness of these different kinds barren deserts of sand and ice. Or as said currently 30% of land area is deserts, and instead, it will be 1 or 5% of total land area.
gbaikie says:
In terms of temperature or weather in general, there is not a lot of difference between Icebox and Hothouse climates.
Nonsense. That I’m not interested in discussing.
“David Appell says:
July 25, 2018 at 4:12 PM
gbaikie says:
In terms of temperature or weather in general, there is not a lot of difference between Icebox and Hothouse climates.
Nonsense. That Im not interested in discussing.”
In southern UK, warmest summer ocean surface water is about 20 K [68 F].
In warmer world, ocean surface water would be warmer.
What happens if coolest ocean surface in winter anywhere around UK
[as in, the northern part Scotland] is 20 C, and in summer it is 25 C or warmer in southern part UK?
It would mean UK average land surface temperature, would have to be warmer, or it’s average yearly surface land temperature which is currently about 9.5 C, has to be a lot warmer.
And if average volume temperature of 3.5 becomes 15 C, then surface temperature of water around UK have increase in their average temperature, and particular winter ocean temperature has significantly increase in it’s average temperature.
But land temperature can change a lot depending on weather and further inland from ocean the less affect it has land surface air temperatures.
So near coast in UK, in summer, it will have lower average temperature, and depending weather it could be a lot cooler- it can be cloudy at coast and clear skies inland [that is not unusual]. With warmer ocean, coastal regions could still be cooler than inland- assuming both coastal and inland have clear skies.
Or ocean surface of 25 C whereas land surface ground could be warmed by sun to about 60 C [which allows air temperature of say 35 to 40 C]. If cloudy coast and clear inland, the cloudy coast will not get as cold as it would with colder ocean surface temperature.
With UK current ocean temperature, in winter, coastal regions don’t get as cold, but if cloudy coasts and clear weather inland it can warmer during winter day. And with much warmer ocean, coastal areas would be much warmer might be always warmer the inland, even if cloudy coast and clear inland.
Now, with such warmer ocean, UK would tend be tropical, it would rain more and in summer more like tropical weather, in which like clockwork it rains every day- and that causes inland temperature to more resemble coastal temperatures- moderate temperatures in both summer and winter.
And roughly same with Europe except European has more inland less affected by the warmer surface waters the further inland you are.
And of course one should expect different weather patterns then one has currently.
Or in terms of GHE religon, hothouse climate is the increase of global water vapor- outside of tropics has 1% to 2% water vapor, r
Hit wrong button and it posted. Anyhow hothouse climate at least doubles global water vapor, or might triple the 60% of global surface area’s water vapor [the regions outside 40% area of tropics which are currently less than 1 %- and tropics presently having 3 to 4%. And tropics despite having more sunlight, is not where find highest daytime temperature- rather these are found in desert regions [low level of water vapor]].
–David Appell says:
July 25, 2018 at 4:12 PM
gbaikie says:
In terms of temperature or weather in general, there is not a lot of difference between Icebox and Hothouse climates.
Nonsense. That Im not interested in discussing.—
How about discussing:
Ben Santer: Climate Change Responsible for Hotter and Colder Weather
https://wattsupwiththat.com/2018/07/26/ben-santer-climate-change-responsible-for-hotter-and-colder-weather/
“…Satellite data and the anthropogenic fingerprint predicted by climate models show common large-scale changes in geographical patterns of seasonal cycle amplitude. These common features include increases in amplitude at mid-latitudes in both hemispheres, amplitude decreases at high latitudes in the Southern Hemisphere, and small changes in the tropics. Simple physical mechanisms explain these features.
… ”
[[“Ben Santer is one of the more colourful climategate characters. He rose to fame after his email threat to beat the cr*p out of Pat Michaels was uncovered in the Climategate archive.”]]
gb: What’s your point, in 25 words or less?
David, please stop trolling, in zero words or less.
–David Appell says:
July 27, 2018 at 6:29 PM
gb: What’s your point, in 25 words or less?–
Different believers have different views, I wondered if you agree with Ben Santer’s view?
Ie, does global warming cause both hotter and colder weather.
Or by year 2100 AD can we expect for there to be much colder weather and much warmer weather, as compared to weather during 20th century?
gbaikie says:
Different believers have different views….
I don’t “believe” in anything.
I go where the evidence points.
Dave and his crazy devolution theories.
“i mention those and ask which of these climate periods is Earth’s normal …”.
There is an official definition by the World Meteorological Organisation (WMO) of the alleged global average temperature over the 30 year period 1961-1990 which includes the colder period ~’60 – ~’75 when a coming ice age was all the rage.
The average over the past say 8,000 years would be higher than now and over the past 100,000 years much lower during which life on Earth was somewhat challenged.
An ‘ideal’ GAT is teleological concept IMO, I’d say it doesn’t exist, the GAT is what it is — end of story.
Here are two 1000 year proxy-based NH temperature reconstructions Loehle and McCulloch (2008) in blue and Ljungqvist (2010):
https://wattsupwiththat.files.wordpress.com/2010/09/loehle_v_fig21.png
Oops 2000 year proxy-based …
Loehle and McCulloch (2008) was published in Energy & Environment, right? It is the denier journal of last resort, whose editor admitted it’s OK to be biased.
And if it were a scientific graph, it’d have an error band.
DA…”Loehle and McCulloch (2008) was published in Energy & Environment, right? It is the denier journal of last resort, whose editor admitted its OK to be biased”.
No, it’s because the alarmist scumbags have taken over the peer review process in most other journals and won’t allow skeptical articles to be published.
Gordon, name one instance where this has happened.
You won’t. You can’t. You make up lies about people as if it’s second nature. You have no hesitation about lying if it satisfies your emotional needs.
Very much like the current US president.
DA…”Gordon, name one instance where this has happened”.
I can name two, Roy Spencer and John Christy of UAH. In his bragging in the Climategate emails that he and Kevin would see to it that skeptic papers would not get to the IPCC review, he was talking specifically about a paper by John Christy.
Even Lindzen had to complain about delays in the publishing of his papers because he offered skeptical views.
Your buddy Trenberth interfered in peer review over a paper from John Christy.
When are you going to get it that these alarmists you support interfere in peer review on a regular basis?
Gordon Robertson says:
In his bragging in the Climategate emails that he and Kevin would see to it that skeptic papers would not get to the IPCC review, he was talking specifically about a paper by John Christy.
Which paper, specifically?
What was the paper’s subject?
It’s title?
Where was it submitted?
When was it rejected?
What is your source of this information?
Proof demands facts. Let’s see yours.
No answers, Gordon?
As usual: you’re real good about making accusations up out of thin air.
Gordo, Loehle and McCulloch (2008) was presented as a “correction” to Loehle (2007), which contained serious errors. But the later paper was an entirely new analysis and was also flawed, as I pointed out HERE
Gordo, have you ever published ANYTHING thru peer review?
Appell and Swanson, please stop doin what you do.
The main point of the discredited Mann, Bradley & Hughes (1998) paper was to create a “Hockey Stick” and that required the elimination of the Medieval Warm Period. Unfortunately for the Hockey Team tree rings are less believable than ice cores and ocean sediments.
Greenland ice core data refutes MBH98 as explained here. Please understand that these were my first attempts to understand “Global Warming”:
https://diggingintheclay.wordpress.com/2010/12/28/dorothy-behind-the-curtain-part-1/
https://diggingintheclay.wordpress.com/2010/12/30/dorothy-behind-the-curtain-part-2/
On the link …
https://diggingintheclay.wordpress.com/2010/12/30/dorothy-behind-the-curtain-part-2/
… the graph showing the GISP Ice Cores – Central Greenland Mean temperature vs. year 1510 – 2010 is an example of what bugs me with graphic presentations, in this case combining two different data series on the one graph of very different resolutions.
For instance the longest thermometer record for Central England back to 1650 shows 11 year running average temperature variations over say 50 year periods of up to 2C (see climate4you) while the ice core record is almost a flat line at -32C to 1910.
Joining two datasets is a dodgy business. In this case I made an error of 55 years in the GISP record that Richard Alley was kind enough to point out in off line emails. If this was a peer reviewed paper I would have needed to correct it or retract it.
While an amateur like me can freely admit such errors Michael Mann has not corrected or retracted papers with absurd errors. Steve McIntyre and Ross McKittrick have documented the errors in great detail here:
https://climateaudit.org/
My personal favorite is Michael Mann splicing two records together while “Hiding the Decline”…….hence this little ditty:
https://www.youtube.com/watch?v=WMqc7PCJ-nc
Then there is the single pine tree on the Yamal peninsula.
Michael Mann did use sediment data but had to invert the data set to produce the result he desired.
I could go on but you can see much more at “Climate Audit”.
What do you think “hide the decline” meant? The decline in what?
cam…”My personal favorite is Michael Mann splicing two records together while Hiding the Decline.hence this little ditty:
https://www.youtube.com/watch?v=WMqc7PCJ-nc
Then there is the single pine tree on the Yamal peninsula”.
If I remember correctly that single tree covered an entire century.
Don’t forget that MBH was investigated by the National Academy of Science and an expert statistician. NAS told them they could not use pine bristlecone which was their entire 20th century proxy. They also told MBH they could not claim a full 1000 years.
Statistician, Wegmann, agreed with M&M and claimed further that section 9 of the IPCC review was nepotic. They were all friends of Mann who cited only papers written by each other. When IPCC bigwig, Susan Solomon, told section 9 to investigate they ignored her.
BTW, any defense of Mann has come from his friends or students.
In rebuttal, Bradley of MBH went after Wegmann for plagiarism. I am still trying to understand how an investigator can plagiarize while quoting material he is investigating. At any rate, Bradley could not get him on the science so he diverted with a bogus claim of plagiarism.
The IPCC disowned MBH outright. They claimed only unprecedented warming from 1850 onward but conveniently omitted the fact that the LIA officially ended that year. They redid the hockey stick with a graph including the MWP and LIA and generally closed the door on MBH bs.
DA…”What do you think hide the decline meant? The decline in what?”
I know you can likely reason this out for yourself. MBH was a proxy study of past global temperatures. If there was a decline in temperature what would it be in relation to?
Proxy temps versus real temps, right??? The data upon which their study depended was showing cooling while the real world was warming.
Does that not make you suspect the rest of the proxy data may be just as suspect?
Being the rocket scientist he thinks he is, Mann could not admit his entire study was suspect so he clipped off the offending proxy data and spliced in real data.
That practice is now recognized as ‘hide the decline’, or Mike’s nature trick. His buddy Gavin Schmidt, now head of GISS, vigourously defended the chicanery. Then again, what would you expect from someone who drops a confidence level to 37% to move 2014 into the warmest year ever?
Gordon Robertson says:
Proxy temps versus real temps, right??? The data upon which their study depended was showing cooling while the real world was warming.
Does that not make you suspect the rest of the proxy data may be just as suspect?
No, although I realize that’s the easy, simplistic, nonthinking thing to think.
There are many scientists who spend their entire careers studying proxies. And you think you know something they don’t?? Ridiculous.
Read
On the Divergence Problem in Northern Forests: A review of the
tree-ring evidence and possible causes, Rosanne D’Arrigo et al, Global and Planetary Change 60 (2008) 289305.
http://www.ldeo.columbia.edu/~liepert/pdf/DArrigo_etal.pdf
Gordon Robertson says:
The IPCC disowned MBH outright.
A huge, F-ing lie. Even big for Gordon, who lies all the time.
DA…”On the Divergence Problem…”
You certainly diverged sharply from the explanation I gave for the ‘hide the decline’ (divergence) issue.
You didn’t even glance at that paper, did you?
David, please stop vomiting.
gallopingcamel says:
The main point of the discredited Mann, Bradley & Hughes (1998) paper was to create a Hockey Stick and that required the elimination of the Medieval Warm Period.
A dishonest claim.
MBH wanted to reconstruct the NH past climate based on what the data said. It showed no hemispheric MWP. Nor have any global studies since.
What data do you think shows a global MWP? That hand-drawn graph from Lamb for which no one knows the data source?
Cite your evidence.
DA…”MBH wanted to reconstruct the NH past climate based on what the data said. It showed no hemispheric MWP. Nor have any global studies since”.
They were caught lamenting that things would be much better if they could just get rid of the MWP and LIA. The resulting graph that lead to wet dreams from alarmists had a brutally straight shaft followed by a neat blade. Had they included the MWP and LIA, the shaft would have looked like sine wave, ruining Al Gore’s day.
Gordon Robertson says:
They were caught lamenting that things would be much better if they could just get rid of the MWP and LIA.
Prove it.
No proof to back up your claims, Gordon?
David, please do your research for yourself.
DA…”What data do you think shows a global MWP?”
The same data to which the IPCC was privy when they posted both the MWP and the LIA on their literature covering the 1st review.
page xxviii
https://www.ipcc.ch/ipccreports/far/wg_I/ipcc_far_wg_I_full_report.pdf
“Since the end of the last ice age, about 10,000 years ago, global surface temperatures have probably fluctuated by little more than 1C Some fluctuations have lasted several centuries, including the Little Ice Age which ended in the nineteenth century and which appears to have been global in extent…”
On page 202 (Adobe 252 0f 414), they actually show the graphs.
By the time MBH appeared in 1998, the LIA and MWP had disappeared and replaced by propaganda from Hughes and Bradley of MBH.
The IPCC is corrupt as all git out. Many of their lead personnel appear in the Climategate emails, involved in chicanery.
I was expecting you could direct me to a site when I could download the raw data and plot it for myself.
Those data are almost 30 years old, and there’s been a huge amount of activity in that field since.
David, please stop being so lazy.
Susie…”Left out of the hockey-stick graph, and ignored by the AGW alarmists, are the fluctuations between the Roman Warm Period, the Dark Ages cooling, the Medieval Warm Period, and the Little Ice Age (from which we are still emerging).”
The greater question regarding the Hockey Stick is why it was lead by a geologist who knows about as much about climate science and statistical analysis as my grandmother.
The geologist, Michael Mann, was caught in the Climategate emails trying to interfere with peer review, to block papers from skeptics, and was revealed to have fudged the hockey stick data by clipping off offending proxy data, which showed cooling, replacing it with real data.
In the Climategate emails it was revealed that Phil Jones, of Had-crut, a Coordinating Lead Author at IPCC reviews, partnered with David Appell’s buddy, Kevin Trenberth, had used Mann’s chicanery to ‘adjust’ Had-crut data.
Jones threatened in the emails that he and Kevin would see to it that certain papers from skeptics would not reach the IPCC review.
Mann et al eliminated proxy data that were no longer good proxies.
Would you have preferred they kept them?
“On the Divergence Problem in Northern Forests: A review of the
tree-ring evidence and possible causes,” Rosanne D’Arrigo et al, Global and Planetary Change 60 (2008) 289305.
http://www.ldeo.columbia.edu/~liepert/pdf/DArrigo_etal.pdf
Chuck
“What does that mean? Solar irradiance? Solar magnetic? How long does either take to respond and exactly in what manner with respect to the atmosphere? Care to explain?”
I can see how a change in solar irradiance could take a while to warm or cool the oceans, and therefore a delay in atmospheric warming would be expected. Likely a few months, possibly a couple years…….but decades? Why?
Of course I’m just speculating, but here is some analysis from Spencer:
http://www.drroyspencer.com/2010/06/low-climate-sensitivity-estimated-from-the-11-year-cycle-in-total-solar-irradiance/
*******
Then there’s Mt. Pinatubo. It erupted in June of 1991 and blocked a portion of sunlight from reaching the troposphere. How long was the “delay” before cooling made itself apparent? Decades?
“It injected more particulate into the stratosphere than any eruption since Krakatoa in 1883. Over the following months, the aerosols formed a global layer of sulfuric acid haze. Global temperatures dropped by about 0.5 C (0.9 F) in the years 199193…..”
********
Finally, if a new solar minimum began in 2005, why was OHC record warm in the last quarter of 2017, and even warmer during the first quarter of 2018? (I’m still waiting for the 2nd quarter results).
https://www.no🙂🙂.noaa.gov/OC5/3M_HEAT_CONTENT/basin_data.html
(Please replace the smiley faces with the letters d and c)
The change in solar magnetic was not apparent to much lower sunspot numbers until after 2000.
According to solar physics related to warming and cooling, the Russians claim there is a 14 year lag time to a climate shift with lower solar magnetic. We just crossd this in 2014 at the onset of a super El Ninio, so if true, we will find out soon enough.
I asked you the same question about OHC that I did Appell and neither of you can answer it. Again, how do you separate solar insolation from a claimed RF from CO2 over the oceans?
Also, if the earth cloud albedo decreases only slightly, the solar insolation changes significantly. This occured in the late 1980’s to late 1990’s and records kept since claim little cahnge. The reduction is the 1980’s was equivalent to 2.4 Wm-2 of insolation forcing. ( about a +.5 degC increase in temperature.)
Again, how do you separate solar insolation from a claimed RF from CO2 over the oceans?
Why would there be a 14-yr lag from the time energy enters the Earth system until it shows up?
Where does it hide during that time?
What’s the evidence it hides there?
Average TSI has been slowly declining since the 1960s….
http://spot.colorado.edu/~koppg/TSI/TIM_TSI_Reconstruction.png
Chuck, if you think the Sun is causing modern warming, then prove it.
With data and evidence.
It’s not our job to disprove it. It’s your job to PROVE it.
What’a ya got?
David, please stop reversing the null hypothesis.
whoops, try again
https://www.no🙂🙂.noaa.gov/OC5/3M_HEAT_CONTENT/basin_data.html
Still doesn’t work,
google: Global ocean heat content: basin time series
The data you’re looking for are here:
http://tinyurl.com/jbf2xco
Over a short enough time interval, it damn sure does.
Graphics are like statistics. Beat them about the ears enough and they will tell you exactly what you wish to hear or see.
Antii Lipponen bought two 12″ pizzas for $5.99 each instead of the single 18″ pizza for $10.99…the deception pi*r^2 strikes again.
Autumn at the Beaufort Sea.
https://images.tinypic.pl/i/00968/xmn0jg7w7i1i.png
The cold northern Atlantic causes drought in Europe.
https://pics.tinypic.pl/i/00968/7o6x8qcudjf5.png
This is a ren special — using a graph of a single days’ data to imply larger, longer trends.
Nonsense.
DA…”This is a ren special…”
On a bad day, ren is light years ahead of you and your alarmist nonsense. He reports real data whereas all your is based on consensus and speculation taken from unvalidated climate models.
Ren offers 1-day only data and dishonestly points to it as evidence for a trend.
David, please stop wildly attacking everything for no reason.
“The-temperature-circle-deception”
At the very same time as over 70 Greeks die in bush fires.
Compare this niggling post post by Roy to the following contribution:
“How climate change is increasing the risk of wildfires”
https://theconversation.com/how-climate-change-is-increasing-the-risk-of-wildfires-99056
M,
Natural disasters result in many deaths. How many thousands die in earthquakes, volcanic eruptions or disease outbreaks?
More than 250,000 people die each year in the US each year due to preventable medical mistakes – is that an ongoing unnatural disaster?
The climate has always changed. It is the average of weather over an arbitrary period, and therefore is responsible for precisely nothing, except for the waste of billions of dollars which might have been used to save human life, perhaps.
Carry on worrying. Maybe you might like to worry twice as hard, and save me the effort – if you think I should be worrying about future weather. Nope, I can’t be bothered.
Keep at it. You obviously enjoy a good worry.
Cheers.
myki…”Compare this niggling post post by Roy to the following contribution:
How climate change is increasing the risk of wildfires”
Myki Kneejerk strikes again.
Roy has nearly 40 years of satellite data to prove the kind of catastrophic climate hysteria to which you refer is not happening. There is no proof that such wildfires are caused by anthropogenic warming.
The situation in Greece goes back beyond 1970 and stats show that between 1968 and 1993, over 65% of the fires were caused by negligence and arson-related ignitions.
https://www.lumes.lu.se/sites/lumes.lu.se/files/maheras_georgios.pdf
It’s kind of dumb to relate wildfires to climate change in a region that is very hot and arid and when it is known that most fires are caused by humans, not the climate.
When has Greece never been hot and arid? Now that they have an influx of migrants from Africa, who knows how many of the fires are caused by terrorists or even uneducated people?
Gordon Robertson says:
There is no proof that such wildfires are caused by anthropogenic warming.
What would you consider to be “proof?” Be specific.
Gordo, Spencer and Christy present 39 years of data cobbled together from the data collected by some 13 satellites. Their unique analysis shows less warming than the two other groups which also provide analytical results. Can/could you provide a coherent reason for your obvious choice to exclude these other results from your discussions?
Appell and Swanson, please stop blog-ruining.
Roy…”I consider this very deceptive”.
The entire AGW theory is based on deception.
If the colours had been preserved (red=hot, blue=cold), but the positive/negative directions reversed, the graph would have shown the exact same results in a dramatic fashion. Does Dr. Spencer make a valid point that the current orientation makes it even more dramatic? Yes, absolutely. That does not take away from what the representation does show, and that is what should be addressed.
Someone also made the valid point about the merits of a relative size for each bar, where the U.S.A. should be much larger than many European countries. My counter to this would be the determining factor. Surface area (Russia and Canada dominate), population (China, India, Indonesia), quality of recording stations? A bar for each country recording values seems most straightforward.
“If the colours had been preserved (red=hot, blue=cold), but the positive/negative directions reversed, the graph would have shown the exact same results in a dramatic fashion.”
Wrong. In that case, the animation would have started with (approximately) a huge blue annulus and ended with a small red annulus. In that case the relatively small area of red would have downplayed its perceived importance.
No, Dr.Spencer, it’s not wrong. I conceded that the current choice is more dramatic, but maintain that the visual effect would nonetheless be dramatic if reversed. Had the direction of positive and negative been flipped, it would have started with a pale annulus at a radius of 0deg, with some blue spikes outward and red spikes inward. As time progressed, the overall circle would have contracted and become increasingly, and by the end predominantly, red.
At no point would there be any predominantly blue annulus. Watching the current animation, regardless of your objection to the orientation of the axis, makes this quite clear.
Steve, you apparently did not watch the animation to see how the bars are displayed. I suggest you do so, rather that assuming what the animation contained. All bars originate at the inner circle, then entend outward to various points on the temperature scale. They do not originate at the zero point on the scale.
Dr. Spencer, you correctly point out a lack of precision where I shouldn’t have used “inward” and “outward”. All bars extend outward, as you stated above.
Similarly, you should concede your own lack of precision over the appearance, or lack thereof, of any predominantly blue annulus. A careful watching of the animation, along with a fairly simple imagining of the impact of reversing the orientation of the temperature axis, never produces this result. The only result is a predominantly red/orange annulus, either skewed large (as published, where you make a valid criticism based on area and increased dramatic effect), or skewed small (as imagined, where I maintain the result would still be dramatic, not because of surface area but due to colour contrast and a pronounced retreat from the zero-reference circle).
GIGO, garbage in, garbage out. They use GISS Ground Measurements. To counter this you should do the same graphic using Ice Core Data. By doing so it will reveal that there is absolutely nothing abnormal about the recent temperatures. Simply use their approach against them. They cherry picked the past 150 years, zoom back 5 or 12,000 years and you will get a different picture.
Surface temperatures now are increasing about 30 times faster than the average warming rate out of the depths of the last glacial maximum 23,000 years ago.
yeah, and this morning temperature rose from +12 to +20 in only 5 hours, that’s 14000 degrees/year! way faster than anything that happened during the deglaciation on average
You have much to learn. No better time to start than the present.
And you need to eat less hamburgers, and then perhaps with greater body surface-to-volume ratio, the +.7C rise in temperature would not make you feel like it’s the end of the world.
I’ll be fine. You’ll be fine.
But will the impoverished in the world be fine? Will those whose coastal homes and cities go underwater? The farmers who suffer drought? Will those who can’t afford A/C be fine?
Will David Appell stop trolling?
That is 100% false. This is ridiculous.
Our current rate of warming is about 30 times faster than the average rate after the last ice age (glacial period) ended.
From Shakun et al Nature 2012 Figure 2a:
http://www.nature.com/nature/journal/v484/n7392/full/nature10915.html
global temperature anomaly in year -18,000 is -3.5 C
global temperature anomaly in year -11,000 is about 1.0 C
so the average temperature change is 4.5 C in 7000 years, or ~ +0.006 C/decade, compared to NOAAs current 30-year trend of +0.18 C/decade
So that’s a factor of 30 now compared to then.
http://davidappell.blogspot.com/2015/06/current-warming-30-times-faster-than.html
>>global temperature anomaly in year -18,000 is -3.5 C<<
funny how this number changed with time. It used to be in -6 to -8 range, but since global warming became a political issue this number started rising and withing few decades it will hit zero and the last glaciation will be disproven.
When was it 6 to 8 C?
That’s just not what Shakun et al’s reconstruction shows — see their Figure 2a.
Would you rather they present something other than what their research finds?
PS: Even if the number is 6-8 C, it won’t change the fact that warming is now much faster than after the last glacial maximum, by at least an order of magnitude.
coturn: honestly, I’m interested in your response. I’ve seen (global mean) warming from the last glacial max to the Holocene as 6 or 8 C, but the paleoclimate books and textbooks I read say 5 C.
https://wattsupwiththat.com/2013/06/02/multiple-intense-abrupt-late-pleisitocene-warming-and-cooling-implications-for-understanding-the-cause-of-global-climate-change/
The recent warming trend which by the way is over pails in comparison to other past warming events. Not even close , not on the radar.
Does it really never occur to you to provide data to backup one of your claims?
I just did.
I meant science, not a blog post from a college dropout who lied about BEST.
inverse square law
The colored area increases with in inverse proportion to the square of the distance from the source.
Nice climate shystering.
The animation shows a change in temperature, but doesn’t put the change in context. That’s the only problem. Very basic, but easier to explain with the climate spiral:
http://www.climate-lab-book.ac.uk/files/2016/05/spiral_optimized.gif
What if the earth had only warmed by 0.015 C. since 1850? Just change the outer ring in the graphic from 2.0 C. to 0.020 C.
The animation would be almost identical, and would LOOK just as scary!
The deception is actually more than what Dr. Spencer pointed out: the Color Spectrum has been shifted. They make the Baseline and slightly cool data points represented by a yellow-spectrum, and then anything positive delta they make orange, and larger magnitude delta they make red. SO they’ve visually spanned/linked Warm (Red) with Slightly cool (Yellow) using Orange as a bridge. Yellow is not next to Blue in any Color Chart because it’s, like Blue, a Primary color. If they wanted to honestly represent magnitude through hue, they would have added a blue-green color to represent slightly cool, and Yellow, literally between red and blue , should not exist at all on this graphic: being in the middle between Red and Blue is the same as being in the middle between warm and cold, and yellow should occupy the baseline and nothing else. While there is no intermediary hue of Green to link yellow to Blue in the graphic, there IS a hue of Orange, to link Yellow visually with Red. So essentially the graphic associates slightly cool temperatures as being warm in nature. They also manipulate the color tones so that the slightly cool rods appear to be, not only yellow, but also vanishingly transparent, while warm rods are fully saturated and opaque.
Of course the best quick fix to semi-salvage the graphic is that the rods should radiate out from the baseline, not from the center of the circle, and if color is used it should not be gradated because the delta of 1 to 2 is no greater than the delta from 0 to 1. The use of color spectrum in this context is a manipulation.
None of these critiques address the validity of the data points themselves.
Andrew
Fix all the coloring issues, the problem I mentioned above remains.
Imagine the earth had only warmed by 0.015 C. Then, for example, you could set the color red to represent 0.020 C. warming, orange to represent 0.010 C. warming, yellow to represent average, green to represent – 0.010 C and so on.
The animation would look almost identical…..just as scary.
******
An analogy would be a graph showing the Dow Jones change for a given session. You could make a 10 point gain appear to be a steep rise, and say, “look at this chart, the Dow went up like a rocket!”.
Only by examining where the dow started, (putting the change in context), do you know if the 10 point gain was insignificant or not.
That’s different, because the Dow Jones baseline isn’t the same for everyone.
Hey Snape, thanks for reading / responding. I’m a design guy who communicates through pictures a lot, and thought I could add to the critique about the graphics/ presentation. If I read you right you’re pointing out that they could show the same strobing rainbows (In more fair colors), an order of magnitude less Delta, and it would still have the same effect – yeah I agree with that , the color scale on the whole is misleading or arbitrary. They could have made it worse looking ( more unfair), for example, by gradating the colors even more. While blue kind of stopped at blue, I did notice Red also “exceeded Red” into the Maroon rhelm. They could have made it look even more sinister by tweeking the ‘hottest ever’ into being Ultra Violet Purple. It does what Dr Spencer identified as suggesting that some sort of acceleration is happening….. See here we are hanging out at transparent blue, no color change, then wham wham wham we’re zipping through the spectrum “heating up.”
Andrew
” If I read you right youre pointing out that they could show the same strobing rainbows (In more fair colors), an order of magnitude less Delta, and it would still have the same effect yeah I agree with that , the color scale on the whole is misleading or arbitrary.”
Yes, well put!
******
You could just as easily set the cold end of the color spectrum to 273 C. (Absolute zero) and the warm end to + 273 C.
Then, when viewing the animation, the temperature change from 1900 to present would be nearly imperceptible.
Which would completely defeat the purpose of graphs in the first place — to aid in making sense of the data.
Whoops, should be:
You could just as easily set the cold end of the color spectrum to – 273 C.
Snape- True! Yeah I hadn’t thought of that specifically but it’s a really good idea. I’ve seen similar representations where, rather than (as alarmists always do) putting the most recent hottest year or highest sea level as the top value of a chart, the graph makers give the graph space to breath up top and down below, and suddenly the ‘jump up’ doesn’t look so much like a “jump up”, in a broader context. It looks like a slow gradual climb, hardly registering as anything unusual.
Graphics are certainly powerful weapons of communication not to be trifled with, which is precisely why its important to Identify malicious examples of flogging data to tell a narrative instead of convey information objectively. The Scientific Community REALLY dropped the ball in exposing Mann in good time… so I’m delighted Dr. Spencer is on the ball here to weigh in.
Did this graph appear in the scientific literature?
Is it any worse than Roy’s “third-order entertaining polynomial?”
Once again David Appell is saying “Cite your evidence.”
That is what he say when he can’t “Defend the Indefensible”. The MBH98 paper is junk science and he would know that if he bothered to check how the Tiljander sediment data set was inverted. Was it done intentionally or owing to incompetence?
Likewise the undue weight given to a single pine tree on the Yamal peninsula.
David Appell can find as much detail as he needs at “Climate Audit”. Sadly it appears that he can’t be bothered to read anything that refutes MBH98. I used to think he was lazy but maybe he just lacks reading comprehension.
cam…” Sadly it appears that he [DA} cant be bothered to read anything that refutes MBH98.
David Appell appears to enjoy nepotism in science. He favours the defense of Mann from Mann’s friends and student and rejects evidence from the likes of McIntyre and McKitrick who are experts in statistics.
Gordon doesn’t know what “nepotism” means.
Peter, you aren’t presenting any countering science. A mere link to climateaudit doesn’t prove anything except that you seek to dismiss the hockey stick without doing any work to actually prove your point.
Yes, M&M published a couple of papers. The first one, in E&E, was obviously wrong, with its big warming hump in the middle of last millenium. Their other paper didn’t get much of any support, and has faded away to historical interest only.
Meanwhile many studies subsequent to MBH98 has confirmed their results time and time again.
And the result is expected on easily understood theoretical grounds.
@David Appell,
“What do you think hide the decline meant? The decline in what?”
If you were paying attention you would know exactly what decline was being hidden. You are not fooling anyone here.
OK, I will go along with your dumb games just this one time. Here is the explanation.
https://climateaudit.org/2009/12/10/ipcc-and-the-trick/
If you find fault with what Steve McIntyre says please explain, otherwise creep off into your mommy’s basement and leave us in peace.
@ Galloping Camel: If somebody whose interested enough to argue about the Mann Graph doesn’t know about “Hide the Decline”, then they don’t want to know about “Hide the Decline”.
Having said that, so that @David gets at least a sampler and doesn’t have to click….
The Cliffs Notes are that even after all the data cherry picking, unjustifiable weighting, (in some cases) fabrication, and duplication of data, the inappropriate proxy selection/use (As was definitively determined by the NAS), and of course algorithms designed to take trendless data and produce hockey sticks (thank you M&M), Mann’s graphs STILL reflected cooling down, not warming up, in the last -I think decade or so- of the data points. Unable to explain how C02 could be rising, but Temperature could be declining, he just decided to amputate the data off, hence “Hide the Decline”. It was also famously referred to in leaked East Anglia Emails as “Mike’s Trick”, I think.
Andrew Stout says:
Unable to explain how C02 could be rising, but Temperature could be declining, he just decided to amputate the data off, hence Hide the Decline. It was also famously referred to in leaked East Anglia Emails as Mikes Trick, I think.
A total misrepresentation.
MBH didn’t decide to “amputate the data,” they decided not to use proxy data that wasn’t representative of actual (measure by thermometers) temperature.
Why would anyone use proxies that weren’t good proxies.
Lots more information on this issue here. But by all means don’t let it interrupt your simplistic and wrong understanding of what happened.
“On the Divergence Problem in Northern Forests: A review of the
tree-ring evidence and possible causes,” Rosanne D’Arrigo et al, Global and Planetary Change 60 (2008) 289305.
http://www.ldeo.columbia.edu/~liepert/pdf/DArrigo_etal.pdf
Beaten horse but just wanted to respond to the amputation :
1) YES, precisely. It was a miserable Proxy to use, if the temperature record in contemporary years is accurate, then The fact that the most recent and purest wood samples [ IE: data with the least obfuscations related to insects, freak accidents, and the trials of centuries of time] yields worthless info. Indeed, its so worthless, if you feel justified in jettisoning it, why the heck would you think that damaged and tainted samples , much more difficult to parse, from hundreds of years ago, would yield more reliable results in this Proxy? I’d venture to say, that even a *consensus of Scientists would agree it was a miserable proxy to use for this reason alone (Hence the NAS verdict).
2) The situation is Ironic: Mann’s excuse to amputate data for graphically misleading reasons, is based on it’s non conformity to records, which themselves, are being actively manipulated… errr.. “adjusted”. How convenient. I’d say it’s the best reason in the world why these NOAA/GISS Graphs are doing an enormous disservice constantly homogenizing and smoothing and torturing raw data to present itself as the homogenous monolithic reliable record it isn’t.
Peter, you avoided the question. What was declining in “hide the decline?”
BTW, I couldn’t get your spreadsheet to work — my computer warned me against opening it. I did anyway, but could not scroll through the document or even click on different cells.
To first order it’s not necessary to consider the rotation of the moon when determine its average temperature. I calculated the right value — and the right value all along the sun-side equator — here:
https://davidappell.blogspot.com/2012/04/norfolk-constabulary-made-wrong-charges.html
Why can’t you read the link I gave you? If you think McIntyre is wrong tell us why.
You ask for evidence and then stubbornly ignore it.
Many thanks for showing up here every day to demonstrate that Alarmists have no evidence for their loony CAGW (Catastrophic Anthropogenic Global Warming) hypothesis.
We need more “Global Warming” and more CO2 to make Russia and Canada more inhabitable.
I’m not going to read a link to guess what your point is. If you have something to quote that you think is important, quote it and provide the link to it.
David, please stop being ridiculous.
reposting down here because I think it’s important that readers understand the nonsense perpetuated by climate alarmists, including top IPCC officials, to limit the damage caused by the revelation of Mann’s hide the decline trick.
The IPCC openly admitted circa 1990 that the Little Ice Age and Medieval Warm Period existed and were likely global. By the 2nd assessment in 1995, they had modified their statement based on nonsense from Bradley and Hughes, you helped put out the hockey stick.
*********
DA…”What data do you think shows a global MWP?”
The same data to which the IPCC was privy when they posted both the MWP and the LIA on their literature covering the 1st review.
page xxviii
https://www.ipcc.ch/ipccreports/far/wg_I/ipcc_far_wg_I_full_report.pdf
“Since the end of the last ice age, about 10,000 years ago, global surface temperatures have probably fluctuated by little more than 1C Some fluctuations have lasted several centuries, including the Little Ice Age which ended in the nineteenth century and which appears to have been global in extent…”
On page 202 (Adobe 252 0f 414), they actually show the graphs.
By the time MBH appeared in 1998, the LIA and MWP had disappeared and replaced by propaganda from Hughes and Bradley of MBH.
The IPCC is corrupt as all git out. Many of their lead personnel appear in the Climategate emails, involved in chicanery.
I don’t see any graphs on pg 252 of the FAR.
But so what. Better data and better analytic techniques showed there was no global MWP or LIA. THAT’S HOW SCIENCE WORKS — finding better data and better techniques. Not every old conclusion survives.
That’s what MBH did — better analysis with wider data. And you’re opposed to that simply because of their results. And all the results since that have confirmed their findings.
Sorry. Sometimes — often — science requires learning new things.
While the Holocene is a “Warm Period”, present temperatures are well below the average for the last 9,000 years. While it may be balmy where you live we are still in an Ice Age!
Wrong.
http://www.realclimate.org/images//Marcott.png
DA…”Mann et al eliminated proxy data that were no longer good proxies”.
That’s not the point, the proxy data they had garnered was shown to be seriously faulty. They decided to hide it rather than admit the data was faulty.
How do we know the rest of it was not just as faulty. NAS told them the pine bristlecone they relied for the 20th century was inadmissible as well.
Did you know that Mann had just received his Ph.D in geology when he helped release that botched study? A noob made serious errors and the IPCC eagerly accepted it. What does that tell you about IPCC judgement?
Gordon Robertson says:
How do we know the rest of it was not just as faulty.
People spend entire careers studying proxies. What have their paper and textbooks said on the subject?
Let me guess — you’ve never tried to read a single one.
DA…”People spend entire careers studying proxies. What have their paper and textbooks said on the subject?”
I pointed out that at the time MBH was published, Mann had just received his Ph.D in geology. I know that proxies are put to good use but they are after all is said and done, speculations.
Mann was not one of those experienced in the analysis of proxy data, he made egregious errors and NAS told him so, as did a statistics expert.
I realize the MWP and LIA theories rely on proxy but they are also supported by independent evidence. It is known the Vikings were farming Greenland and there is anecdotal evidence of the severe cold in Europe during the LIA, as well as first hand reports of glacier expansion.
Your claim that the LIA was regional does not hold water. How is it possible for temperature to decline 1C in Europe for 400 years and leave the rest of the planet unaffected?
There are reports of glaciers expanding enormously in Europe and Arctic explorers between 1600 and 1850 were often trapped in ice while trying to find the Northwest Passage. That happened in September in fall and even during certain summer months. When you combine that with proxy evidence globally it lends credence to the LIA being a global event.
Gordon Robertson says:
I pointed out that at the time MBH was published, Mann had just received his Ph.D in geology.
That’s your first lie.
You call people names like “Liars”. That is what Leftists do when they lose a debate. “Ad Hominem” won’t work here with Dr. Roy’s savvy flock. We may debate scientific details but we know you are an empty vessel (aka troll).
Gordon *is* a liar.
Even Gordon knows this.
And many other people here know it, and others have called him out for being dishonest.
David, please stop wildly lashing out at your instructors.
Gordon Robertson says:
Mann was not one of those experienced in the analysis of proxy data,
According to whom, you? You’re making me laugh.
he made egregious errors….
List 3 of these errors.
DA…”he made egregious errors….
List 3 of these errors”.
So easy.
1)his statistical algorithm produced hockey sticks with a white noise input.
2)he used one tree to cover an entire century.
3)he used pine tree bristlecone for the 20th century which NAS told him was not right. It was the bristlecone that started showing cooling when everything else was warming.
https://en.wikipedia.org/wiki/Bristlecone_pine
Why would he use such a strange specimen, that grows in weird areas when he had millions of hectares of normal trees?
Answered elsewhere on this page:
http://www.drroyspencer.com/2018/07/the-temperature-circle-deception/#comment-313939
Gordon Robertson says:
How is it possible for temperature to decline 1C in Europe for 400 years and leave the rest of the planet unaffected?
What data says that happened in Europe?
Gordon Robertson says:
It is known the Vikings were farming Greenland and there is anecdotal evidence of the severe cold in Europe during the LIA, as well as first hand reports of glacier expansion.
Blah blah blah.
I want to see the temperature proxy data. Where are they?
PS: Some thing the Vikings in Greenland were just good marketers, trying to get people join them.
PPS: The Thames River was much shallower and meandering then, so it froze over much more readily.
DA…”DA…”he made egregious errors.
List 3 of these errors”.
So easy.
1)his statistical algorithm produced hockey sticks with a white noise input.
2)he used one tree to cover an entire century.
3)he used pine tree bristlecone for the 20th century which NAS told him was not right. It was the bristlecone that started showing cooling when everything else was warming.
https://en.wikipedia.org/wiki/Bristlecone_pine
Why would he use such a strange specimen, that grows in weird areas when he had millions of hectares of normal trees?
DA…”Blah blah blah”.
You were not so cocky when I saw you on a panel stumbling over a simple question. You were looking at your notes and genuinely lost.
That’s when I really got the measure of you as a bluff artist with pat answers.
What panel?
What was the question?
You like to attack me Gordon, but you never list anything specific. I don’t think you have anything specific. It’s fine to dislike me, but it’s rational to have reasons.
PS: Thanks for watching whatever you watched of me.
Gordon Robertson says:
1)his statistical algorithm produced hockey sticks with a white noise input.
Mann disputes that. It’s hard to believe, since other studies using different methodologies and algorithms also give a hockey stick.
Also, the hockey stick is expected on theoretical grounds — it’s required by basic physics:
https://davidappell.blogspot.com/2014/02/is-hockey-stick-surprising-result.html
2)he used one tree to cover an entire century.
Which century?
So what?
3)he used pine tree bristlecone for the 20th century which NAS told him was not right. It was the bristlecone that started showing cooling when everything else was warming.
Where did they say that?
—
Your error is expecting that revolutionary science has to be perfect. It doesn’t have to, and it rarely is. Scientists find new methods, publish their new results, and later studies fill in whatever weak spots there might be.
Did MBH do anything dishonest?
David, please stop being David.
Gordon Robertson says:
Thats not the point, the proxy data they had garnered was shown to be seriously faulty. They decided to hide it rather than admit the data was faulty.
Absolutely false.
Look at MBH98 Figure 5b. The reconstruction STOPS around 1960.
As always, Gordon, you have no idea what you’re talking about, but have no hesitation to cast aspirations and accuse everyone of fraud and dishonesty.
In fact the fraud and dishonesty is your’s.
DA…here’s the truth about MBH98:
https://climateaudit.org/category/mbh98/
Why is it the truth?
Because you would not recognize Truth even if it bit your butt.
DA…”Why is it the truth?”
Because, Steve McIntyre, who runs climateaudit, is an expert in statistics. He analyzed the MBH data and found egregious errors in it along with his partner Ross McKitrick, another expert in statistics.
Together, they harassed the US government to investigate and finally they did. They appointed the National Academy of Science and a statistics expert Wegmann. Th latter agreed totally with M&M and NAS limited the MBH study to 1600 onward while forbidding the 20th century proxy, pine bristlecone.
The IPCC went even further, limiting the study from 1850 onward and redoing the hockey stick graph entirely.
Besides the link I posted to climatteaudit, here’s a summry by McKitrick.
https://www.rossmckitrick.com/paleoclimatehockey-stick.html
Read it and weep.
And why, Gordon, is Steve McIntyre an expert in statistics?
Merely because he got good grades??
McIntyre spend his life chasing money. Science considered his two papers, and dismissed him as wrong.
http://www.drroyspencer.com/2018/07/the-temperature-circle-deception/#comment-313939
Gordon?
David, please stop asking questions you already know the answers to.
CLIMATE SENSITIVITY IT WILL BE A THING OF THE PAST AS FAR AS CO2 IN CONCERNED.
It is back words it should be CO2S sensitivity to the climate.
This is all an exercise which will soon no longer be necessary as CO2 concentrations will start to slow in reaction to the cooling environment. As the global temperatures, and overall sea surface temperatures continue to fall the CO2 /climate sensitivity issue should fade away, along with AGW theory and all its nonsense.
The reason for overall surface oceanic temperatures cooling is due to the prolonged minimum solar activity and the weak TSI, but in particular UV wave lengths which penetrate the surface ocean waters to depths of 50 meters.
As for EL NINO weak at best, but what is really important if one is expecting at a minimum a climatic shift, if not a climate regime change are the overall ocean sea surface temperatures and in particular the North Atlantic , both which are trending down and should continue to trend down in response to very weak solar activity.
All solar activity moderated by a weakening geo magnetic field which will compound the solar effects. Both being in sync.
I expect a slight up tick in albedo due to an increase in explosive volcanic activity and an increase in global cloud/snow coverage all tied to very low solar activity.
While Richard Lindzen and Dr. Roy are people I respect for their contributions to our understanding of “Climate Science” I sometimes disagree with them.
For example they both discuss the “Sensitivity Constant” in degrees Centigrade per doubling of CO2. This implies that they take the 1896 Arrhenius hypothesis seriously even though there is overwhelming evidence that it is false.
I still love them even though they are are not always “SC” (Scientifically Correct).
It’s been “Celsius” for a long time, not “Centigrade.”
Arrhenius had the right idea, as has been shown since. You, you’re still searching for those missing 150 W/m2. Any progress to report on that?
DA…”Its been Celsius for a long time, not Centigrade.”
I am sick and tired of units of measurement being renamed in honour of scientists.
-Centigrade make more sense than Celsius.
-Cycles per second more sense than Hertz.
-Magnetic flux density in lines per unit area makes more sense than Gauss.
The same applies to Oersteds, Teslas, and every other dumb name applied in lieu of the proper units.
Let’s get off this ridiculous fetish with honouring scientists and get back to units we can all understand.
Gordon Robertson says:
I am sick and tired of units of measurement being renamed in honour of scientists.
No one cares what you think about units.
Nor have you earned any standing for them to care about your opinions.
cam…”For example they both discuss the Sensitivity Constant in degrees Centigrade per doubling of CO2….”
The impression I get from both Lindzen and Roy is they are examining a concept in order to challenge it skeptically. For example, Lindzen challenged the GHE in the form it stands then produced an alternative view that emphasizes conduction/convection while de-emphasizing radiation.
While doing so, he produced a figure of 0.4C warming overall for a doubling of CO2 that is in stark contrast to alarmist figures. I think Roy pretty well takes the same approach, de-emphasizing catastrophic warming and acknowledging a certain amount of warming, although he is not sure how much of it can be attributed to CO2.
Gordon Robertson says:
While doing so, he produced a figure of 0.4C warming overall for a doubling of CO2 that is in stark contrast to alarmist figures.
Care to explain then why GMAT has increased by 1.0 C when CO2 is only up 45-50%?
Oh, caught another display manipulation – maybe already mentioned though: it changes speeds as it goes, and blitzs through colder years while it lingers on warmer years. You could say it’s an honest quirk of making the graphic less lengthly, but it’s underlying raison d’etre is to make sure the lasting impression is an overtly red, ‘hot’ picture.
Or, it could be that the overtly red, ‘hot’ picture, comes from the fact that the last several years are… well, overtly hot? A lot of people here are talking about choices in graphical representation and very few seem to be discussing the actual meaning of the data.
“Contrarians” try to focus on one specific picky thing in order to avoid (you’re right) the much bigger picture — that the Earth is warming, has been warming, and it’s now causing problems.
But, sure, let’s discuss whether one person’s graph has too much read in it.
*red, not “read.”
David surface oceanic temperatures are on the decline and so goes AGW.
“Your conclusions are in a word wrong, and that will be proven over the coming years, as the temperatures of earth will start a more significant decline (which started in year 2002 by the way)….”
– Salvatore del Prete, “Reply to article: IC Joanna Haigh – Declining solar activity linked to recent warming,” 10/8/2010
– http://climaterealists.com/index.php?id=6428
David, please stop patheticking.
DA…”that the Earth is warming, has been warming, and its now causing problems”.
No trend from 1998 – 2015, 15 of those years confirmed by the IPCC in the AR5 review of 2012. Called it a warming hiatus.
Even NOAA showed no trend during that period till, in cahoots with the Obama admin, they retroactively fudged the SST and produced a linear trend where none existed.
You should make it clear your sources are cheaters guilty of scientific misconduct.
Gordon Robertson says:
No trend from 1998 2015, 15 of those years confirmed by the IPCC in the AR5 review of 2012.
Has any new and better data come in since then?
What did Clausius say about this interval?
Gordo, The way that you cherry pick data makes your agenda obvious. That you start with the El Nino year of 1998 and ending before the next big El Nino year in 2016 repeats the old Denialist claim, once again.
For example, using the RSS TLT global data, the trend from Jan 1998 thru Dec 2015 works out to be 0.064 K/decade, while using the data from Jan 1999 thru Oct 2017 yields a trend of 0.196 K/decade. While they both periods show a warming, the trends are for short periods and give a distorted view of reality. The difference is that I’m willing to admit this limitation, whereas you are repeating old denialist disinformation.
ES: +2.
Right, and also on point.
steve…”Or, it could be that the overtly red, hot picture, comes from the fact that the last several years are well, overtly hot?”
Only according to the data fudgers at NOAA, GISS, and Had-crut. It was hot in February 2016 globally due to an exceptional El Nino but the trend has been negative since. As of last month we were back to the global average of the flat trend from 1998 – 2015.
Gordon Robertson says:
Only according to the data fudgers at NOAA, GISS, and Had-crut.
Seeing as how you’re sh!ting on people’s reputations, do you have any evidence to back up your claim about “fudging?”
If not, the honest thing to do is to retract your claim.
Do you care about being honest, Gordon?
DA…”Seeing as how you’re sh!ting on people’s reputations, do you have any evidence to back up your claim about “fudging?””
Reputations????!!!!!
I didn’t think you had any such evidence.
But I didn’t think you’d so readily admit it.
While there is nothing wrong with questioning the motivations and results coming from any agency, the agencies you have listed are generally perceived (by the general scientific community, if not the majority of visitors to this blog) as reputable and non-partisan. That’s not so say that individuals might not have an agenda or political axe to grind, but they are publishing results through a peer-review process using publicly available data.
If you’re going to cast aspersions on their results, you need to back up your claims with sources of equal quality (i.e., peer-reviewed with clear reference to public data sets). A reference to a blog or web page is not a valid or useful source to back up your view, unless it in turn is simply citing peer-reviewed research.
Steve,
I’m just commenting on graphics: As an Architect, that’s my profession. The way data is represented makes a big difference and I caught way more items than Roy choose to comment on which drive a narrative, not communicate fairly or indeed factually.
IE There is not justifiable scientific reason why a ‘hot’ day of equal delta is represented with opaque and highly saturated color , with greater gradation of color (IE: Orange-red-maroon), with greater area of color (what Dr. Spencer commented on), than ‘cold’ days, where slightly cold was just represented as nearly-transparent blue. Indeed the Wheel was specifically designed so that the colder the day, the more it would become vanishingly represented at all, while it’s converse hot day would become magnified by an even greater magnitude. There is no justification for blatantly shifting the color scales to link neutral days (yellow) with ‘hot’ days, and omit intervening colors (green) to disassociate neutral days (yellow) with ‘cold’ days (blue). When you’re presenting scientific data you don’t manipulate variables like this if you’re trying to be honest. When presenting an animation, Time is also a variable. A “year” in 1965 isn’t any longer than a “year” in 1995. There is no scientific reason for manipulating the variable. I’d chalk up the half dozen or so Graphic and temporal manipulations to ignorance of the Primary Color Wheel (that was 5th grade for me), and ‘innocent’ exuberance, but the fact that every data variable manipulation tells the narrative of ‘crisis’, speaks of intent.
The data could be told honestly and it would tell a less alarming story… a story of gradual warming with intervening (inconvenient to alarmists) cooling trends, since we took measurements.
A Technician could also manipulate the data to make it totally unalarming whatsoever.
And again, all of this is graphic and if Alarmists wanted to debate honestly they would concede the fact that the graphic is a manipulation. If I wanted to argue about the data itself, we can talk about “Adjustments” and closed stations and smoothed data and any number of other things Alarmists have done to discredit and taint their own science. AND THEN we could talk about why the warming I’d agree to, is nothing to be alarmed about anyway.
Ditto that.
Dr., I don’t see this is as the least bit deceptive; the scaling and offset appear accurate to my eye. I think your objection is emotional, in that the chart emphasizes a fact that you find discomforting. Reverse the scaling and you would see a large blue star shrink to a smaller reddish star; would this be more to your liking? I wouldn’t see that as deceptive either. By the way, this type of charting is hardly novel; it has been used in IT to represent network traffic for years, and I’m sure elsewhere, as well.
slipstick…”Dr., I dont see this is as the least bit deceptive…”
Have you registered yourself as an official alarmist poster?
We *should* be alarmed.
I’m glad that message is getting through.
David says,
“But, sure, let’s discuss whether one persons graph has too much red in it.”
It goes deeper than that. The temperature circle is an example of propaganda, with the intent being to manipulate the viewer’s perception of global warming.
How would you like it if Dr. Spencer showed a similar graph, but with the color changes I described earlier?
“You could just as easily set the cold end of the color spectrum to – 273 C. (Absolute zero) and the warm end to + 273 C.
Then, when viewing the animation, the temperature change from 1900 to present would be nearly imperceptible.”
I haven’t followed your color arguments, because I found your first comment on it absurd. Sorry.
Someone makes a graphic and all you can see is “propaganda.” That says a lot more about you than them.
David
Based on your comments, I think you have not been ABLE to follow my color arguments.
(The GHE seems absurd to Flynn because he doesn’t understand it)
Sorry, you’re wrong. I read your first comment — about the choice of the pre-industrial GMAT not being sound — and dismissed that. After times like that I turn off my attention and move on. Sorry.
David
https://www.telegraph.co.uk/news/earth/environment/globalwarming/12117449/Animation-100-years-of-global-warming-in-less-than-a-minute.html
Again, it’s clear you have no idea what’s going on in a visual like this. ( I reckon you are not alone.)
An identical graphic could show a temperature change (pre industrial to current) of + 0.001 C. Lots of blue to start, more and more red as the years go by. Just as dramatic. Mathematically accurate.
Conversely, a change of + 10.0 C. could be made to look completely underwhelming…….yet still be mathematically accurate.
******
The designer is therefore able to control the viewer’s impression of whether the change is large or small, regardless of the data. That’s a problem, and why I think it’s more propaganda than science.
It’s completely irrelevant that the GMAT of the Earth was once 6 C cooler, or 10 C higher, or whatever.
What matters is the climate that civilization was adapted to, viz. the Holocene, and the climate change since then.
Gordon?
http://www.drroyspencer.com/2018/07/the-temperature-circle-deception/#comment-313939
Gordon, why do you insist on accusing people of nefarious things when you have no evidence?
I think this blog deserves a reason.
DA…”Gordon, why do you insist on accusing people of nefarious things when you have no evidence?
I think this blog deserves a reason”.
When I do reply with a reason, which is often, you get stumped for an answer and come back with a gotcha or a dumb question regarding what I explained.
You are out of your league. Give it up.
Gordo, You have no claim to “replying with reason”, as you often simply don’t reply:
http://www.drroyspencer.com/2018/07/the-temperature-circle-deception/#comment-314020
http://www.drroyspencer.com/2018/07/the-temperature-circle-deception/#comment-314021
E.S. is right on point — Gordon wouldn’t know evidence if it was a snake hanging in his kitchen.
David
You still have no idea what I’m talking about, do you?
“What matters is the climate that civilization was adapted to, viz. the Holocene, and the climate change since then.”
Of course I agree. But what If the temperature change since the holocene was only + 0.001 C.? The animation could STILL start out mostly blue and STILL end up mostly red. Visually, that tiny little change (0.001 C.) would look identical to the animation I linked…..just as dramatic.
If Earth’s temperature had changed 100 C. since the Holocene (a massive difference), you could construct an animation whereby the color starts out mostly blue, and ends with only a slightly different shade of blue….making that massive change appear to be insignificant.
*****
The animator has total control of the impression he wants to make. The actual data makes no difference.
Snape says:
But what If the temperature change since the holocene was only + 0.001 C.?
It wasn’t.
What if horses had wings?
David
I wrote, “But what If the temperature change since the holocene was only + 0.001 C.?”
If you could follow this example, it would demonstrate that any amount of change, big or small, significant or insignificant, could produce the transition from blue to red we see in the animation.
Unable to do so, you throw out the boneheaded, Flynn – like response, “what if horses had wings?”
Snape says:
I wrote, But what If the temperature change since the holocene was only + 0.001 C.?
AGAIN — it wasn’t.
Is your point that the color scales of graphics are arbitrary?
I totally agree. So what?
David
“Is your point that the color scales of graphics are arbitrary?”
In the case of the specific graphics I presented, then yes, that has been my point. Being arbitrary, the designer is able to manipulate the viewer’s impression of the data. Manipulating someone’s viewpoint (to a desired end) defines propaganda:
“the spreading of ideas, information, or rumor for the purpose of helping or injuring an institution, a cause, or a person”
*******
So what about my initial comment do you find absurd? Can you articulate a problem with it, or were you just hand waving ala Gordon or Flynn?
Is there some reason you can’t reply underneath my comment(s), like normal people do?
Snape says:
Can you articulate a problem with it, or were you just hand waving ala Gordon or Flynn?
Yes.
But this debate over an arcane point just isn’t worth it. Sorry.
You can have the last word.
If you think the point is arcane, and not worthy of debate, then you should have kept your pie hole shut in the first place. Otherwise, you’re just a handwaiving ass, no different from those you’re critical of.
I think your initial point was dumb and ill-thought. Now look at how much time you wasted.
“Dumb, ill-thought, absurd……… bring an argument for why you think that, David. Otherwise, shut the fuck up.
David Appell: a troll.
I made my argument several times.
So GISS land temperature data was used. If you examine past GISS temperature data sets, and yes quite a few of them are available on the Internet Archive’s WayBack Machine, and compare them in order, you will find that the monthly entries have been routinely changed since 2002 (the earliest you can easily find). Some months nearly all the entries are changed and some month few to none. Overall the changes constitute an obvious pattern of increasing recent temperatures since 1980 and prior to that date the corrections mostly lower the temperatures. When plotted out it looks like this:
http://oi68.tinypic.com/wck4lc.jpg
That’s from the GISS Land-Ocean Temperature index but it’s similar to the (meteorological stations only) data.
Here’s the most recent changes to LOTI (Land Ocean Temperature Index) made for just the 2018 entries between May and June:
https://data.giss.nasa.gov/gistemp/tabledata_v3/GLB.Ts+dSST.txt
Year Jan Feb Mar Apr May Jun
2018 78 81 91 87 83 77
2018 77 80 90 85 82
All five months Jan – May were bumped down. Really what in the hell is going on?
“Every record has been destroyed or falsified, every book rewritten,
every picture has been repainted, every statue and street building
has been renamed, every date has been altered. And the process is
continuing day by day and minute by minute. History has stopped.
Nothing exists except an endless present in which the Party is
always right.” George Orwell, 1984
Steve
Do you really want to know what’s going on? Then ask Nick Stokes:
https://moyhu.blogspot.com/?m=1
Or is it more fun to be ignorant and pretend everything is a conspiracy?
********
BTW, almost all (except the most recent) of the original entry’s in the UAH data set have been altered as well. Just as an example, August, 2009:
http://www.drroyspencer.com/2009/09/august-2009-global-temperature-update-0-23-deg-c/
Hola
Muy buena informacion respecto a las placas solares.
Yo compre una placa solar flexible y es una de las mejores compras que hecho. La he colocado en la furgoneta y de cine
Un saludo
It’s called interglacial, and it is one of the cicles on the earth. They had to stop panicking the people. Googlee it. Is there enough information online.
Just one thing, it should be cooling down now, not heating up. So what will happen when the natural cycle of heating up will begin?