The Version 6.0 global average lower tropospheric temperature (LT) anomaly for April, 2022 was +0.26 deg. C, up from the March, 2022 value of +0.15 deg. C.
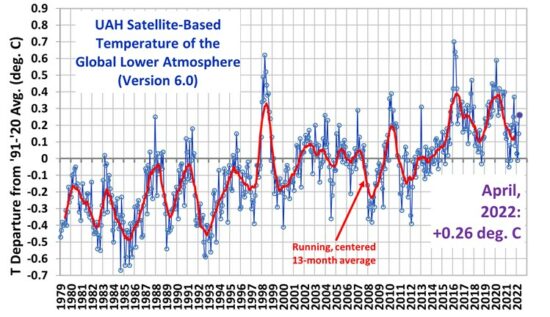
The linear warming trend since January, 1979 still stands at +0.13 C/decade (+0.12 C/decade over the global-averaged oceans, and +0.18 C/decade over global-averaged land).
Various regional LT departures from the 30-year (1991-2020) average for the last 16 months are:
YEAR MO GLOBE NHEM. SHEM. TROPIC USA48 ARCTIC AUST
2021 01 0.12 0.34 -0.09 -0.08 0.36 0.49 -0.52
2021 02 0.20 0.32 0.08 -0.14 -0.66 0.07 -0.27
2021 03 -0.01 0.12 -0.14 -0.29 0.59 -0.78 -0.79
2021 04 -0.05 0.05 -0.15 -0.29 -0.02 0.02 0.29
2021 05 0.08 0.14 0.03 0.06 -0.41 -0.04 0.02
2021 06 -0.01 0.30 -0.32 -0.14 1.44 0.63 -0.76
2021 07 0.20 0.33 0.07 0.13 0.58 0.43 0.80
2021 08 0.17 0.26 0.08 0.07 0.32 0.83 -0.02
2021 09 0.25 0.18 0.33 0.09 0.67 0.02 0.37
2021 10 0.37 0.46 0.27 0.33 0.84 0.63 0.06
2021 11 0.08 0.11 0.06 0.14 0.50 -0.43 -0.29
2021 12 0.21 0.27 0.15 0.03 1.62 0.01 -0.06
2022 01 0.03 0.06 0.00 -0.24 -0.13 0.68 0.09
2022 02 -0.01 0.01 -0.02 -0.24 -0.05 -0.31 -0.50
2022 03 0.15 0.27 0.02 -0.08 0.21 0.74 0.02
2022 04 0.26 0.35 0.18 -0.04 -0.26 0.45 0.60
The full UAH Global Temperature Report, along with the LT global gridpoint anomaly image for April, 2022 should be available within the next several days here.
The global and regional monthly anomalies for the various atmospheric layers we monitor should be available in the next few days at the following locations:
Lower Troposphere: http://vortex.nsstc.uah.edu/data/msu/v6.0/tlt/uahncdc_lt_6.0.txt
Mid-Troposphere: http://vortex.nsstc.uah.edu/data/msu/v6.0/tmt/uahncdc_mt_6.0.txt
Tropopause: http://vortex.nsstc.uah.edu/data/msu/v6.0/ttp/uahncdc_tp_6.0.txt
Lower Stratosphere: http://vortex.nsstc.uah.edu/data/msu/v6.0/tls/uahncdc_ls_6.0.txt
Incredible!
LOL you jinxed it
Im making $80 per/hr to complete some jobs on the laptop.I have not at all believed that itd even possible but my close buddy was making $27k only in five weeks working this easy offer and she had influenced me to join. Check extra instructions by visiting following web
>>>>> https://extrasavingshere1.blogspot.com/
You were more correct than I was. Want to predict next months as well?
Globalchanges in temperature cannot just be estimated or predicted. This is determined with proven scientic monitoring procedure that is plausable.
Reason why many countries wait for PNAS RE PORTS KLMATHIAS UGANDA FORT PORTAL KSBATOL REOir
The Best opportunities To Earn $62,000/Month. Stay at home safe and sound avoiding corona virus but do not sit idol work online and make full use of this hostage period and raise extra money to over come daily financial difficulties…
Visit this web ……. https://coinworks53.blogspot.com/
Repeating an old question:
Dr. Spencer, to my knowledge, you and Dr. Christy have not presented a public description of the method used to produce the equation you use to combine the three MSU/AMSU channels, which is central to your LT product. As with the earlier TLT versions, the logic for this effort was to remove the known cooling influence of the stratosphere on the TMT, which you now call the MT. The Version 6 equation is a weighted averaged of the TM, TP and LS series, given by :
LT = 1.538 * MT .548 * TP + 0.01 * TP
So again, I ask:
Where in published literature do you document your method used to derive this equation? Is the derivation based on an assumption of the U.S. Standard Atmosphere which is appropriate for mid-latitudes? How does well does this equation fit the winter Arctic, which exhibits a lower tropopause than summer, or the low latitudes of the tropics, there the tropopause is higher than the mid-latitudes simulated by the U.S. Standard Atmosphere?
Yes, I’ve read your published paper on version 6.
Dr. Spencer, here’s another question. It’s well known that sea-ice appears warmer than the open ocean at microwave frequencies. In fact, the difference is the basis for the passive microwave data which is used to monitor sea-ice concentration and extent. Given that there’s a well documented decline in melt season sea-ice, along with the possibility for increased melt pond coverage over first year ice, how has this change impacted your MT data?
Regarding the sea ice decline effect on our LT trends, it’s pretty easy to estimate the effect. Arctic sea ice has declined since 1979 at an average rate of about 5.4% per decade. Ice-free ocean is about 0.4 deg. C cooler in brightness temperature than ice covered ocean for AMSU channel 5 (unless there is substantial snow cover, in which case this change can flip, but let’s assume worst case that doesn’t happen)…..
So, assuming 0.054 fractional decrease of the Arctic Ocean per decade, and 0.4 deg. C spurious cooling for that fraction, I get ~0.02 C/decade spurious cooling over the Arctic Ocean in the LT temperature product. This compares to our Arctic Ocean warming rate since 1979 of 0.27 C/decade. So, maybe that 0.27 should be more like 0.29. That 0.02 C/decade error is well within our error bound for that region, which John would probably say exceeds +/-0.06 C/decade or more (I can ask him).
Of course, since the area of the Arctic Ocean is less than 1% of the globe, you can further calculate the declining Arctic sea ice effect on global temperature trends, which turns out to be 0.0016 C/decade (I understand there has been little change in Antarctic sea ice over the same period of time).
“… since the area of the Arctic Ocean is less than 1% of the globe …”
Actually it is 2.75% of the earth’s area. So you might want to recalculate.
as
Antonin, please stop trolling.
Regard the LT equation coefficient question:
I assume you are familiar with the concept of deconvolution (or convolution) of overlapping weighting functions (called an “averaging kernel”), it’s been widely used for decades in the retrieval of atmospheric temperature profiles. We did the same thing for the original LT, which Frank Wentz (RSS) verified was legitimate, as he also started computing LT with our coefficients.
Regarding the new (V6) LT coefficients, AMSU channels 5, 7, and 9 weighting functions can be linearly combined to produce an averaging kernel weighted lower in the atmosphere than channel 5 alone (but not as low as the original LT w.f., which was also a combination of w.f.s at different altitudes, but from different view angles at the same channel frequency).
The sum of the coefficients must be 1.0 so that temperature energy is conserved, and the signs will always alternate, in this case, +, -, +. You basically try different coefficients at many altitudes where the microwave absorption theory gives you the individual channel w.f.s, and just apply the weights at each altitude. This works well in the microwave O2 channels (unlike the infrared CO2 channels) because the weighting functions have very little dependence on atmospheric temperature.
Dr. Spencer,
From now on you can skip all that and just ask gbaikie. I think he missed it by 0.01C.
It was guess and I didn’t expect it to be that close.
Just for the record.
If you don’t mind saying, I have a question about the stock market.
Dr. Spencer, you didn’t answer my question. Your “weighting functions” are derived from theoretical calculations. One assumption in these calculations, AIUI, is the temperature profile vs. pressure height. If one assumes that profile is the U.S. Standard Atmosphere, which begins at the surface with a temperature of 20C and then declines almost linearly to the tropopause at 200 hPa, then continues with a constant temperature well into the stratosphere at 45 hPa, how well do the resulting “weighting functions” represent real world conditions in Arctic winter where the tropopause might be as low as 300 hPa or over the Tropics? Is it reasonable to use one equation for all seasons over the the entire Earth?
Woops, The surface temperature for the US Std atmosphere is 15 C (288.15 K), not 20 C.
E. Swanson, I may be missing something, but I think he did answer your question. In Statistics, there are times when a best fit is desired, and coefficients are selected so that a best fit occurs. From Dr. Spencer’s reply, I understand that he used deconvolution of overlapping weighting functions to derive the coefficients. Although I have not personally used that procedure, it is not all that uncommon in metereological studies.
AI: ES only comes on here to promote RSS over UAH.
AI, Dr. Spencer didn’t really answer my question.
Those three weighting functions of emissions vs. altitude are purely mathematical constructs which are based on certain assumptions. I just think those assumptions, which are not stated, may effect the resulting LT equation, such that the equation is “tuned” to those assumptions. If those assumptions do not match real conditions, then the UAH LT may not be providing a correct assessment of changing climate.
Swanson admits he lied and that Roy did answer his question.
I know for a fact that the LT weighting function has a big impact on the final LT temperature trend. For example, shifting a miniscule 0.01 of weight from LS to MT is enough to flip the trend from +0.13 C/decade to +0.14 C/decade.
But thats not the question bdgwx. A .01 change in clouds would have enormous impact on mean global surface temperature also. One can cherry pick the limitations we live with but ultimately overall confidence is pretty low that anything dramatic is going on.
A .01 reduction in albedo could explain the entire modern warming and there is almost zero certainty if that occurred or not much less if did what caused it.
Hunter wrote:
No, Hunter, Roy did not answer my question about the assumptions used to create those theoretical weighting functions. If you think so, please show where by giving a quote from Roy’s replies posted above.
My question was summed up with this question:
“Is it reasonable to use one equation for all seasons over the the entire Earth?”
Swanson he replied:
”I assume you are familiar with the concept of deconvolution (or convolution) of overlapping weighting functions (called an averaging kernel)”
If you aren’t familiar with that you should ask more about it rather than claim your question wasn’t answered.
Hunter, deconvolution would be what one does AFTER the creation of the 3 sets of theoretical weighting functions.
It’s important to understand that the original purpose for the TLT was to remove the contamination of the TMT by the known stratospheric cooling. Other researchers have taken a different approach, using just the TMT and the TLS data, which RSS provides as the TTT:
TTT = 1.10*TMT – 0.10*TLS
The current trend for the global TTT is 0.171 K/decade and for the North Polar it’s 0.255 K/decade.
Bill Hunter, I’m talking about a 0.01 change in clouds or any element that modulates the energy flows into and out of the UAH TLT layer. I’m talking about the UAH model for deriving the LT temperature via the weighting function. Small changes in the weighting function lead to big changes in the warming trend regardless of what clouds are doing.
Not sure what you are getting at Bdg.
Why make changes in the weighting function? As I understand it UAH is either the best or one of the best of comparing to weather balloon records. That would provide a degree of ground truthing of the results.
Further a .01c/decade difference in trend is practically nothing. Natural variation is much higher than that.
OTOH, Swanson appears to be complaining about the US Standard Atmosphere which is the product of a huge amount of scientific work important to many things. I don’t know if Roy or RSS uses that but if one does not use that what would one use?
Is it the best?
https://i.imgur.com/a31C7Ky.png
I agree that 0.01 C/decade isn’t significant. But if you do say LT = 1.25*MT – 0.25*LS all of sudden the LT trend is +0.19 C/decade.
bdgwx, why does it need to be the best?
I look at the chart you provided and in my view I am perfectly comfortable with the reanalysis products the link offers up.
Reanalysis should be the best product as it incorporates a look at the entire monitoring system. (as discussed in the link to the KCN system I posted below Gordon’s comments on a similar process he is familiar with).
A warming rate of 1.7 is what I have been using. The two reanalysis products are at 1.6 and 1.7, essentially in complete agreement and they should be. I was happy to find the KCN link to see how modern computing can be used to improve on the same kind of work I did as an apprentice mostly manually, at least beyond an IBM XT and a 10 key calculator.
The KCN paper describes what we did with a combination of computations and the expert opinions of the partners to lay out defense positions in litigation support.
So I can’t help but note that UAH is both cooler than the analysis and other monitoring systems but also closer to the reanalysis.
then there is the models. True outliers. If the models were putting out financial data for a private business’ sources of revenues, it wouldn’t pass muster. Heck they could be correct but you need more than a declaration they are correct. The reanalysis (subject to quite a few hours of review work on it) would be what the models would be adjusted to. And I am in good company on that as there are a good number prominent climate scientists that hold the exact same opinion, one does not need to be a climate scientist to understand why.
So I am not sure what the issue is here. I don’t think Swanson has any answers for the FUD he is spreading and completely failed to see the significance of his comment about the tropopause being lower at the poles. Why would that matter? Already the 15C starting point of US Std Atmosphere considers the surface temperature at the poles as well as at the equator as 15C is the global mean surface temperature. I has to be lower because it is obvious the tropopause represents the extinction phase of water vapor that is going to be related to water purity, temperature and perhaps turbulence.
Second we are looking at stuff above and below the tropopause and certainly not below ground level just because the height of the tropopause varies during the year and with latitude. And finally I can understand Roy’s answer to Swanson’s concerns about the loss of ice so Swanson should probably put that one to bed as immaterial.
BH said: “why does it need to be the best?”
I don’t know that it does. You are the one who brought it up.
BH said: “I look at the chart you provided and in my view I am perfectly comfortable with the reanalysis products the link offers up.
I have no problem with reanalysis either. But you specifically asked about “weather balloon records”.
Anyway, matching other datasets is not my primary concern right now. My point is that the UAH TLT warming trend is very sensitive to the weighting function. What makes LT = 1.538*MT – 0.548*TP + 0.01*LS (+0.13 C/decade) more valid then LT = 1.25*MT – 0.25*LS (+0.19 C/decade)?
Hunter, The U.S. Standard Atmosphere was last updated in 1976 from an earlier version in 1962. It’s early roots were the NACA before NACA became NASA. It was useful tool for the design of aircraft and rockets in the early days of high altitude flying with jet aircraft. As the link shows, it is based on clean, dry air, i.e., no rain or storms. Calculating the MSU/AMSU weighting functions using the Standard Atmosphere would a form of tuning which does not well represent conditions over the Arctic in Winter nor the Tropics.
Regarding bdgwx’s comment, there have been some suggestions that a better TTT over the winter Arctic would be:
TTT = 1.15*TMT 0.15*TLS
Hunter further wrote:
As usual, Roy’s carefully framed response regarding sea-ice loss may not really address the question I raised. For example, Roy’s number for the rate of decline of sea-ice extent does not state whether it refers to annual or seasonal decline, nor does it say anything about changes within the total area during the melt season, roughly May thru September.
The greatest warming trend in the LT North Polar Ocean is during the winter. The Nov-March Ocean trend for the LT is 0.29 K/decade while the May-September Ocean trend is 0.20 K/decade. So, i still think that the UAH LT may be understating the summer warming because of the impact of the loss of sea-ice and surface melting over the remaining sea-ice.
bdgwx says:
”I dont know that it does. You are the one who brought it up.”
—————
LOL! You brought it up bdgwx. I didn’t say anything at all about that.
——
——
——
bdgwx says:
What makes LT = 1.538*MT 0.548*TP + 0.01*LS (+0.13 C/decade) more valid then LT = 1.25*MT 0.25*LS (+0.19 C/decade)?
—————–
Well at least you can formulate a good question and write a valid equation. . . .things that Swanson completely flopped on here.
E. Swanson says:
Regarding bdgwxs comment, there have been some suggestions that a better TTT over the winter Arctic would be:
TTT = 1.15*TMT 0.15*TLS
———————
that equation isn’t an equation but even if it were it has no relationship to the equation bdgwx was discussing.
——
——
——-
E. Swanson says:
”So, i still think that the UAH LT may be understating the summer warming because of the impact of the loss of sea-ice and surface melting over the remaining sea-ice.”
—————–
Yeah it sure messed up reporting the temperatures where I lived too.
But maybe that isn’t the intent of the satellite record to give accurate local and seasonal climate trends.
Nor is it the intent to do that for global surface records either.
The location of my official global reporting surface weather station is an airport inland in a completely different microclimate than my home.
But it is also the case that UAH isn’t computing a summer warming trend. You must be doing that and apparently botching up the effort by not going to the raw satellite data and coming up with a publishable piece of work.
But it is my impression that the arctic is generally cooler than historically (baseline 1958-2002) in the summer. So it isn’t clear from what your intuition of UAH underestimating summer warming trends derives from. UAH is reporting overall the NOPOL warming trend is nearly double that of the global trend at .25c/decade
E Swanson,
When I get a chance I’ll use TLT = 1.15*TMT – 0.15*TLS for say anything north of 60N and use the official weighting function for everything else and we’ll see what the difference is. I’m pretty busy these days, but hopefully I can get to this in the next week two. I already have the source code in place to process the UAH grids so it shouldn’t be that big of deal to combine the MT and LS grids with your suggested weightings.
Hunter, sorry the “minus” sign in the equation was lost.
But, you write:
The UAH LT annual North Polar data shows trends of:
NoPol Land Ocean
0.25 0.23 0.27
BTW, The problem of declining sea-ice isn’t limited to the UAH LT. I found similar results using the RSS data, which I presented in my 2018 AGU poster paper.
Anyway, how the hell do you expect one to work with the “raw satellite data”. Perhaps you think I’m not using the UAH LT data to calculate trends. You will notice that my results bracket the yearly results. Perhaps you haven’t heard of the “Arctic Amplification” resulting from the snow_sea-ice albedo feedback? Perhaps you don’t know as much as you think.
E. Swanson says:
Perhaps you havent heard of the Arctic Amplification resulting from the snow_sea-ice albedo feedback? Perhaps you dont know as much as you think.
——————————
Obviously UAH shows Arctic amplification due to the loss of ice. The question I asked is why you think the amplification is too low particularly you mention in the summer.
Hunter, My paper is a bit confusing at the end. The data in Figures 8a, b, c and d are the band passed filtered data, which removes the long term trend. So, what we see there is the difference in trends from the long term trend with the summer months displaying a reduced trend and the winter months an increase in trend over the long term value. But, the snow/sea-ice Arctic Amplification only applies during the melt season when the Sun is higher in the sky, not the long winter night without sunlight.
Also, we see that the largest decline in sea-ice extent is at the end of the melt season. The decline in “area” is greater because of the melt ponds and open water. HERE’s the monthly extent data from N*O*A*A:
Decadal Trend:
Jan = -2.91%
Feb = -2.68%
March = -2.46%
April = -2.59%
May = -2.63%
June = -3.91%
July = -7.29%
Aug = -10.14%
Sept = -12.32%
Oct = -9.58%
Nov = -4.86%
Dec = -3.43%
All months = -4.38%
Roy’s number for the “average” rate of decline is 5.48%/decade, which may refer to the area data, but he didn’t say. Clearly, the decline during the melt season is much greater and that corresponds to the lower trend also found in the UAH LT and RSS TLT products.
OK I understand what you are getting at.
But I have to wonder what you hope to achieve. If UAH uses the US standard atmosphere it already is a product that to some extent averages high and low latitude products into a mid latitude product.
If the US std atm isn’t sufficient wouldn’t it be better to improve it via the research that was done to produce it in the first place?
Hunter, I just ran thru some data on area. Here’s what that looks like, given a few assumptions:
Decadal Trends for Area:
Jan = -2.99%
Feb = -2.75%
March = -2.31%
April = -2.62%
May = -3.27%
June = -5.46%
July = -9.23%
Aug = -13/37%
Sept = -14.43%
Oct = -11.45%
Nov = -5.46%
Dec = -3.73%
These decline rates are larger than that for extent and reflect the presence of melt ponds and open water, which Roy agrees have some influence the UAH LT. This is not directly related to the U.S. Std Atmosphere, which you mentioned.
E Swanson,
I had enough motivation that I went ahead and did the experiment today. Note that I processed 1979/01 to 2022/03 and I think my grid area logic is slightly different than what UAH must be using because I get ever so slightly different monthly anomalies down in the 3rd decimal place. I’m not sure what the discrepancy is here since I’m using standard sine/cosine weighting on the cells.
Using 90S-90N of 1.538, -0.548, 0.010 weights I get +0.131 C/decade which confirms that my source code is working correctly.
Using 90S-90N of 1.150, 0, -0.150 weights I get +0.148 C/decade.
Using 60N-90N of 1.150, 0, -0.150 weights and 90S-60N of 1.538, -0.548, 0.010 weights I get +0.132 C/decade. There’s not much change here because 60N-90N (actually 82.5N because of the unfilled cells north of there) is only (sin(82.5) – sin(60)) / 2 = 6.2% of the surface area.
When I interpolate the cells above 82.5N and 82.5S using a simple strategy it does increase the trend by a hair, but nothing significant. There just is not much surface area in these higher latitudes to effect the averages much.
E. Swanson says:
”These decline rates are larger than that for extent and reflect the presence of melt ponds and open water, which Roy agrees have some influence the UAH LT. This is not directly related to the U.S. Std Atmosphere, which you mentioned.”
——————————–
I think you have to be aware that both open water and melt ponds were more common than they are now when ice extent was greater.
Why, thats because when the sun shines over the vast majority of the arctic sea ice in summer it all is in a melting state. The ponds disappear when extent shrinks. The extinct melt ponds just refroze come the sun dipping back over the horizon each year before extent shrinkage eliminated them. And the open water is reduced as well by virtue of having a smaller circumference of the ice extent. therefore ice extent would be a better measure especially for the summer season.
Hunter wrote:
I think that’s wrong. For the NH sea-ice, both the extent and area metrics show the least decline during the the freeze months ending with March. During the freeze season, the remaining ponds and the ocean freeze again. What has happened is that there is now more first year ice in March than before and first year ice is flatter and thus more able to exhibit melt ponds. The big change is during the summer melt season, with the largest decline at the end of the season in September.
That said, the impact of declining sea-ice on the UAH LT and RSS TLT products will be greatest during the melt season, not the freeze season. Roy’s use of a seasonal average of extent understates these effects.
bdgwx says:
”When I interpolate the cells above 82.5N and 82.5S using a simple strategy it does increase the trend by a hair, but nothing significant. There just is not much surface area in these higher latitudes to effect the averages much.”
———————–
Thats what I would expect. Total mean ice loss is less than 1/2 of one percent of the earth surface.
Even if you look at summer loss only it is about 2/3rds of one percent.
And there are complications using UAH NoPol data what area does that cover? the vast majority of ice loss has been between 70 and 80N.
It is important to use underlying datasets designed specifically for your purpose. If US std atmosphere is used it is designed to be seasonal and latitude independent best representing the mid latitudes. thus the dataset is best designed as a global dataset and making adjustments only for one wing of that dataset has to be done with a lot of caveats.
The other thing to consider is summer temperature really hasn’t changed in the arctic, if anything its slightly cooler. IMO, ice generally doesn’t melt directly due to climate change but instead indirectly due to change in ocean temperatures. Melt ponds just refreeze come winter unless the underside of the ice erodes it away and spills the pond by lowering the ice dam.
And if you accept that you have to look very carefully at how ocean currents operate. It creates some conflict about the expansion of ice that arises from stopping the Gulf Stream.
these natural processes simply cannot be viewed in simplistic terms.
E. Swanson says:
”I think you have to be aware that both open water and melt ponds were more common than they are now when ice extent was greater.”
I think thats wrong.
———————————
Wrong? Why? Winter extent further south, more sunshine, a lot more acreage, warmer climate – why would ice ponds not be more common in those circumstances as the summer arrives and hits a peak melt rate in early summer? Same with erosion of the edges as the ice breaks up along a much longer border of ice. I think you need to find a reference or mention something I didn’t consider.
———
=========
E. Swanson says:
For the NH sea-ice, both the extent and area metrics show the least decline during the the freeze months ending with March.
———————
There seems to be no argument behind your comment above, least decline in what? melt ponds being minimized at ice extent maximum? That seems consistent with my comment not yours.
———
=========
E. Swanson says:
During the freeze season, the remaining ponds and the ocean freeze again. What has happened is that there is now more first year ice in March than before and first year ice is flatter and thus more able to exhibit melt ponds. The big change is during the summer melt season, with the largest decline at the end of the season in September.
—————–
The flatter the ice the more likely the melt ponds will drain off the ice. Its like trying to fry eggs in a pan with no sides.
https://cosmosmagazine.com/wp-content/uploads/2019/12/181601-MeltingIce-Full.jpg
———
=========
E. Swanson says:
That said, the impact of declining sea-ice on the UAH LT and RSS TLT products will be greatest during the melt season, not the freeze season. Roys use of a seasonal average of extent understates these effects.
——————–
So what? Its primarily a non-seasonal record and as bdgwx shows it is an immaterial difference to the overall record. . . .far below the precision of the results that are reported.
Hunter, Both the UAH and RSS products report data for the North Polar area, that is 60N to 82.5N. The UAH LT trend is 0.23 K/decade and the RSS TLT trend is 0.469 K/decade, both of which are the greatest regional trend reported. The RSS data includes some scan data poleward of the nadir footprint at 82.5, whereas UAH apparently does not.
You continue to attempt to ignore these facts, claiming that global data is more important or that the area is only a small fraction of the Earth’s surface, etc. But, the surface area from 60N to 82.5N is 6.37%, not an insignificant number.
You also are confusing the question regarding the weighting functions with the effects of declining sea-ice area. And, while melt ponds may become deep enough to drain into the water below, I doubt that they overflow as you claim and of course, there are no melt ponds by the time of maximum extent and area.
So what? Your posts are just another round of your red herrings in an attempt to ignore the fact that the warming of the Arctic is a strong indicator of Changing Climate.
Swanson says:
”You continue to attempt to ignore these facts, claiming that global data is more important or that the area is only a small fraction of the Earths surface, etc. But, the surface area from 60N to 82.5N is 6.37%, not an insignificant number.”
————————–
Swanson I said melting ice is an insignificant number just as Roy demonstrated and did the math for you. And you just turn around and ignore it. Apparently you have trouble visualizing this stuff like your severe problems with understanding angular momentum equations for orbiting particles.
————
===========
Swanson says:
”You also are confusing the question regarding the weighting functions with the effects of declining sea-ice area. And, while melt ponds may become deep enough to drain into the water below, I doubt that they overflow as you claim and of course, there are no melt ponds by the time of maximum extent and area.”
————————
There are no melt ponds long before maximum, certainly by late December. Freezing of the ponds begins in September and once the light is gone from the decline of the sun they freeze over.
————————-
Swanson melt ponds form exclusively because the ice is NOT flat. If it were perfectly flat any melt will flow off the ice, of course there is no perfectly flat ice but the rougher it is the more melt ponds you get contrary to your statement. Ponds can only occur if there is an ice dam. Ponds on perfectly flat ice would need donut shaped clouds to form.
Old ice contrary to your claims have all the valleys and dams necessary to hold abundant ice ponds as seen the the photograph I provided for you.
When you have dams of ice the water that melts off the top of the dam flows into the valley to combine with melt there where it is trapped. I suppose you just believe flat ice has more ponds because you want to believe they are increasing. Your desires are not science.
Hunter, Roy’s calculations are for full year, not the peak melt season, and his comparison was for the full global area. If he had focused on the local area and timing, I
think that melting sea-ice is NOT an insignificant number. At the very least, we know the September extent has declined from about 7.5 to 4.5 million km^2. The low in 2013 was 3.57, according to the NSID*C data.
The older the sea-ice is, the more it has been deformed, thus there’s less flat area for ponding. The surface of first year ice is usually covered with some snow, which stands above the ice and impedes the drainage off ice flows. You will notice from your photo that there’s a rim of ice around the melt ponds, which would also keep the melt water in place.
FYI, HEREE’s an animation that demonstrates the loss of old ice vs. new ice.
E. Swanson says:
Hunter, Roys calculations are for full year, not the peak melt season, and his comparison was for the full global area. If he had focused on the local area and timing, I
think that melting sea-ice is NOT an insignificant number.
—————–
The only issue in the arctic of any concern Swanson is multi-year (>30year) arctic wide. So why should we be concerned with your petty 3 month limited area concerns?
—————–
================
E. Swanson says:
At the very least, we know the September extent has declined from about 7.5 to 4.5 million km^2. The low in 2013 was 3.57, according to the NSID*C data.
—————–
The only issue in the arctic of any concern Swanson is multi-year (>30year) arctic wide. So why should we be concerned with your petty 3 month limited area concerns?
—————–
================
E. Swanson says:
The older the sea-ice is, the more it has been deformed, thus theres less flat area for ponding.
————————
LMAO! I seriously believe your physics vision is so bad you would never be able to graduate from a plumbing apprenticeship.
I guess I could be wrong about how many donut shaped clouds fly above the arctic, though. LMAO!
—————–
================
E. Swanson says:
The surface of first year ice is usually covered with some snow, which stands above the ice and impedes the drainage off ice flows. You will notice from your photo that theres a rim of ice around the melt ponds, which would also keep the melt water in place.
——————
Ice flows? What we are talking about is both snow and ice melt, not ice flows. What the heck are you talking about?
Hunter, I love it the way you keep posting red herrings. The discussion was about the UAH (and RSS) data for the Arctic region. My concern was a possible flaw in that data, but you would rather to ignore that.
This is a great example:
The sea-ice tends to break up under the influence of wind stresses, forming large blocks of ice called ice floes. Like the one the MOSAIC cruise anchored to for research. Sorry, I misspelled the term.
E. Swanson says:
Hunter, I love it the way you keep posting red herrings. The discussion was about the UAH (and RSS) data for the Arctic region. My concern was a possible flaw in that data, but you would rather to ignore that.
——————
I keep asking why I shouldn’t ignore it.
It just doesn’t seem important and you have given any reason why it should be considered important. There are so many flaws in the world one has to devote ones time only to the important flaws if one wants to be helpful.
So why do you think it might be an important flaw worthy of concern?
Hunter wrote:
There have been many projections pf AGW climate change which point to a stronger warming in the Arctic when compared to the rest of the Earth. One would conclude that tracking the Arctic would provide clear evidence of such changes. If the satellite data is indeed under reporting the warming, then the result would be less public and political concern about the overall changes to the planet.
E. Swanson says:
”If the satellite data is indeed under reporting the warming, then the result would be less public and political concern about the overall changes to the planet.”
————————–
Hmmm that seems about half-baked. Analysis suggests all the warming in the arctic is in the winter not in the summer where the summers are a bit cooler than the baseline of 1958-2002.
https://tinyurl.com/2p94fc4r says that arctic warming is roughly twice the rate of the mean rate for the globe. UAH is consistent in that having it .25 vs .13 respectively.
So where is the meat Swanson? You are selling plant burgers made out of cheap soy beans here and marketing it as the real thing. Parroting radical talking points is a poor excuse for spending money on science.
Hunter, The RSS North Polar Land & Ocean trend is 0.469 K/decade, whereas their global Land & Ocean is 0.213, so, their data shows more than twice the warming of the high Arctic. My analysis indeed found that the RSS NoPolar data shows more warming in Winter than Summer, which is strange, given the serious loss of sea-ice during the melt season.
Then, you wrote:
Don’t know what you are talking about. I’m not “selling” anything, I’m retired. My reply was an answer to your previous question about why the accuracy of the data was important.
E. Swanson says:
My analysis indeed found that the RSS NoPolar data shows more warming in Winter than Summer, which is strange, given the serious loss of sea-ice during the melt season.
——————————-
Try flipping through the archived annual DMI Arctic temperature charts. https://tinyurl.com/ty5eytmy
swannie…”Dr. Spencer, you didnt answer my question. Your weighting functions are derived from theoretical calculations”.
***
Yes, Roy did answer your question and he answered it well. The problem is with your question which is, as usual with you, misguided.
If Roy is still around maybe he can correct misconceptions I have about weighting functions. I am comparing them to bandpass filters in communication.
Weighting functions cannot derived from theoretical calculations IMHO. They correspond to the microwave radiation frequencies given off by oxygen molecules at various altitudes which is related to the oxygen molecule average temperature. If you look at the peak of the channel 5 curve it corresponds to a certain altitude. What do you think it is measuring, the amount of tea in China?
There are no units along the x-axis because the curves represent a relative weighting of the microwave radiation received by different AMSU channels. As far as I can see, a weighting for one channel is relative to the reception of microwave frequency intensities relative to another channel in the AMSU unit.
There would be no point making this up based on theory if it is to be applied to real instrumentation measuring real phenomena.
You are correct. Convolution isn’t theoretical it is similar to but more advanced than traditional kriging and doesn’t suffer the data fallouts that weather stations in sparse distribution create for gridding weather data.
In fact Kriging Convolutional Networks (KCN) are being introduced into weather forecasting retaining spatial data for machine learning. https://ojs.aaai.org/index.php/AAAI/article/view/5716/5572
I think it is fair to say that there are 5 (or more) lower layers to the atmosphere that need to be considered.
1. Tropopause. (TP)
2. Upper Troposphere. (UT)
3. Middle Troposphere. (MT)
4. Lower Troposphere. (LT)
5. Surface Boundary Layer. (SBL)
The first 4 are, as you say, monitored by AMSU channels (or combinations of them).
The 5th is the home of the 2m ground based thermometers (which only cover at max 30% of the globes surface and are point, not volume, measurements).
The channel 5 Roy mentioned is centred somewhere around 4 km but it picks up radiation to the surface as indicated by its curve. The other channels he mentioned are located higher. However, the weighting curves overlap and measure the same microwave radiation from different altitudes from O2 molecules extending to the surface.
I know you place a lot of emphasis on the SBL but it appears to me a more turbulent layer of the troposphere. I don’t see why channel 5 cannot average it.
Maybe Roy has something to say about that. He has mentioned the AMSU units don’t measure right to the surface due to spurious readings. That may have something to do with your SBL.
E. Swanson, It seems like you have looked into the UAH calculation in some detail. Would it be possible for you to explain, in laymans terms, the difference between UAH and RSS?
Gregory J, The short answer is that RSS continues to use the old UAH TLT v5 weighting based on the single MT channel data and RSS excludes scans over ares with high mountains, such as the Antarctic poleward of 70S, the Himalayas and the Andes. The original UAH TLT thru v5 was introduced to compensate for the influence of the stratosphere on the MT channel and the UAH v6 is a different approach which is also supposed to achieve this result.
The long answer requires more understanding of both the instruments and the physics. RSS has some details which might help you.
The even shorter answer is that RSS uses a vertical atmosphere model to predict the weightings instead and also adjusts the AMSU (the later instruments) to correspond to the MSU readings (the earlier instruments).
See the paper “Construction of the RSS V3.2 Lower-Tropospheric Temperature Dataset from the MSU and AMSU Microwave Sounders” that ES references.
rlh…”The even shorter answer is that RSS uses a vertical atmosphere model to predict the weightings instead and also adjusts the AMSU (the later instruments) to correspond to the MSU readings (the earlier instruments)”.
***
This is not a knock on you so try not to be overly defensive.
It makes no sense to have instruments measuring real radiation from O2 molecules at various altitudes then use a model to predict what the instruments should read. That’s what alarmists do.
It makes far more sense that the weighting functions reflect the real data retrieved by the AMSU instrumentation. Of course, the data is in a raw form and gives no correlation between altitude and temperature. That needs to be worked out using a known relationship.
Still, the predominant channel for the troposphere has been channel 5 since its receiver responds best at 4 km. There could be no vertical column theoretically relating channel 5 to the other channels since they all receive there peaks at different altitudes.
If RSS has abandoned real measurements for theorized model interpolation, as NOAA has done with surface stations, then they are playing the same fudging game as NOAA.
RSS
“TLT (TEMPERATURE LOWER TROPOSPHERE)
TLT is constructed by calculating a weighted difference between MSU2 (or AMSU5) measurements from near limb views and measurements from the same channels taken closer to nadir, as can be seen in Figure 2 for the case of MSU. This has the effect of extrapolating the MSU2 (or AMSU5) measurements lower in the troposphere, and removing most of the stratospheric influence. Because of the difference involves measurements made at different locations, and because of the large absolute values of the weights used, additional noise is added by this process, increasing the uncertainty in the final results. For more details see Mears et al., 2009b.”
Thank you E. Swanson and RLH. I appreciate it.
About what I expected given the warm oceans that existed 5-6 months ago. The oceans cooled a little starting in December 2021 which means UAH should start dropping next month.
Richard, I am curious where your “5-6 month” figure comes from. I did a quick correlation, and here is no particular correlation between global temperatures and ocean temperatures 5-6 months ago.
The correlation between current temps and past ocean temps is greatest 1 month ago, and decreases fairly consistently each month further you go back.
There is a well documented correlation between the El Nino index and the various global temperature series on the order of 5-6 months. El Nino indexes are derived from specific sea surface regional temperature contrasts, but it’s not exactly “ocean temperature”.
https://iopscience.iop.org/article/10.1088/1748-9326/6/4/044022
Thanks Mark. That makes sense. A correlation with a SPECIFIC part of the ocean, not the ocean in general.
But the correlation is between ENSO and global temperatures.
Mark B is right that ENSO is the key. As a result the effect is when El Nino or La Nina events are occurring.
My own opinion, which I’ve never checked into, is that tropical effects have a longer lag time than effects that occur elsewhere. Not too surprising given a lot of tropical energy makes its way to the polar regions.
This means polar effects have the shortest lag time.
This means that ENSO and polar variations tend to occur together. Since these are the source of the two biggest anomalies, it tends to make the satellite data more noisy.
“… the effect is when El Nino or La Nina events are occurring.”
According to NOAA (link below), negative ENSO conditions have persisted since period 5 (April/May/June) 2000. Since then, two periods of La Nina have occurred, the second of which began in Jul/Aug/Sep 2021 and continues up to the present. That’s seven, soon to be eight, continuous months of declared La Nina conditions.
Yet here we are, looking at one of the 5 warmest Aprils in the satellite record.
https://origin.cpc.ncep.noaa.gov/products/analysis_monitoring/ensostuff/ONI_v5.php
It would be nice if we had monthly measurements of the global solar energy reaching the surface. The biggest factor appears to be the amount of reflected solar energy. My guess is it would explain the temperature data pretty well.
https://www.mdpi.com/atmosphere/atmosphere-12-01297/article_deploy/html/images/atmosphere-12-01297-g003-550.jpg
The ONI (NCEP) has been negative for each of the past 24 months. The ONI for October was roughly the same as that for March, and when the April figures come it it should not be much different (based on the weekly data).
The global ocean (“Climate at a Glance”) was only 0.03C lower in March than in both September and October.
When you don’t provide a source I guess you can claim just about anything.
I’ve been using HadSST3 as my source.
2021/10 0.591
2021/11 0.579
2021/12 0.484
2022/01 0.509
2022/02 0.482
As you can see the October and November values dropped starting in December. That’s why I expect a similar drop in UAH in the next few months. Nothing complicated.
It would be interesting to compare the length of these reports with the values of the anomalies.
If something big happens, I believe I would typically say more words.
Exactly.
Willard is a dyed-in-the-wool proponent of saying a whole lot when little or nothing is happening.
Not really.
OK I concede to ‘almost’. JAlmost dyed-in-the-wool since I don’t know where else you post.
Not good enough, Bill.
Search for stoichiometry when you have time.
hmmm, maybe you could do a mathematical analysis on your own posts?
Yet more evidence from Dr. Roy that climate change is real.
For those of you following my commentaries on climate change, I’ve posted another video you might be interested in:
https://youtu.be/ZBofU2yk1oE
This one is entitled “Destroying the Volcano CO2 Myth”
What is the use in saying this? How many people in the conversation say that climate change isn’t real? The evidence that the climate does change, historically speaking and in general as a matter of course, is irrefutable. The evidence that the climate has changed in the past 100 years has always been very strong.
If Climate doesn’t change then we should start worrying.
The real worry is that a natural cooling trend of 0.001C/decade has been replaced with an artificial warming trend of 0.2C/decade.
What cooling trend EM?
My guess – the trend since the holocene climatic optimum, after climbing out of the last glacial period.
Yep I would be guessing too.
The title of the video might help answer your questions, Matt.
W
Any time a video starts with climate change denier I know we have a live one. This puts it into the Gretaesque school of who cares. I dont remember anyone on the skeptics side bringing up volcanoes. Strawman much?
More arguments center on the fact that part of the current warming results from coming out the LIA, and that the last several decades have been in the warm phase of the AMO, and the acceleration of SLR is just not living up to the hype.
But, W, I imagine you were enthralled with the little piece given your predilection.
Fernando,
You’re trying to fight against two incontrovertible points.
First, MarkS’ video has little to do with “But Climate Changes”:
https://climateball.wordpress.com/but-semantics/#change
But thanks for allowing me to add that silly line.
Second, “But Volcanoes” is truly ridiculous, even by your standards. Which is why you try to bait me with “But LIA.”
Try again. See if I will bite.
So there is meant to be an average climate that the LIA took us away from, is there? The global average temperature isn’t driven by anything but some unnamed elasticity that ‘rebounds’ after a cold event?
rebounds after a cold event
Sorta like a very long term repressed memory, except that unlike humans going through somata transformation psychotherapy, Mother earth moves back to conditions similar to those of the Minoan, Roman and Medieval Warm periods. We know global temperatures began warming 200 years ago, clearly prior to any effect of CO2.
I’m not sure I buy the “repressed memory” thing, Fernando.
But if you allude to your sock puppet, you might have a point.
Gee Willard do you believe this claim?
”In this video we show that the climate change deniers’ assertion that the bulk of the CO2 in the atmosphere comes from volcanic activity is wrong.”
How do you know that the bulk of CO2 in the atmosphere comes from volcanic activity is wrong Willard?
Of course I do, Bill:
Would you like to know how asked that silly question?
Willard says:
”Of course I do, Bill:”
OK cough it up then!
Would you like an apple strudel with that, Bill?
Sure Willard, why not. If you think its too easy of a question to answer, cook up an apple strudel and throw it at your computer screen while you provide us with that simple answer.
Stay thirsty, sea lion.
Yep figured you were faking it . . . .again!
You are not in high school anymore, Bill.
Did it work back then?
Work to do what?
matt…”The evidence that the climate has changed in the past 100 years has always been very strong”.
***
What evidence do you have of climate change. Just curious.
Are you talking about glaciers that expanded in the mid-Little Ice Age and are now receding, or are you talking about recent climate change? Expanding and retreating glaciers are good evidence of a warmer climate but does it mean the climate in the areas affected is drastically changing?
I think it can get complex. The Mer de Glace glacier near Chamonix in France expanded enormously during the LIA but glaciers form high in mountainous regions and flow downhill. Does that mean the lower regions are necessarily suffering climate change?
Another example, there were famines in the Scottish highlands during the LIA but the Lowlands were unaffected. The Highlands are not that much higher than the Lowlands, the lower parts probably around 1000 feet. Yet that 1000 feet made the difference between a climate that could not support agriculture and one at sea level that could.
— Gordon Robertson says:
May 2, 2022 at 8:41 PM
mattThe evidence that the climate has changed in the past 100 years has always been very strong.
***
What evidence do you have of climate change. Just curious.–
Our global climate is icehouse global climate.
UN says:
–What Is Climate Change?
Climate change refers to long-term shifts in temperatures and weather patterns. These shifts may be natural, such as through variations in the solar cycle. But since the 1800s, human activities have been the main driver of climate change, primarily due to burning fossil fuels like coal, oil and gas.–
UN has stupid definition of it.
UN is stupid.
I don’t think any identified shifts in temperatures and weather patterns related to CO2 levels.
NASA says,
“More than 90 percent of the warming that has happened on Earth over the past 50 years has occurred in the ocean.”
https://www.climate.gov/news-features/understanding-climate/climate-change-ocean-heat-content
I would say changes in heat content of the ocean, would effect our icehouse global climate.
The total heat content of our ocean is very large.
The average temperature of ocean is about 3.5 C.
And it’s been about 3.5 C for thousands of years.
NASA says more 90 percent.
It seems an important question is how much more than 90%.
Or does anyone, argue it’s less than 90%.
85% is not much difference, but 95% a big difference.
I am inclined to guess it’s about 99%
Does anyone have argue/evident/or hunch it’s less than 99%
Or does anyone think it’s 99.9% or 91%.
It seems odd to me that people could ignore more than 90% of warming, if they interested in global warming.
It seems like it’s some form of denial.
I have said that 1 C increase in heat content of ocean would be enormous effect upon global air temperature.
It’s my guess that our ocean average temperature has not been 4.5 C or warmer in last 1 million years.
But even a .5 C increase would also have large effect upon global air temperature, and it seems there widespread assumption the our ocean has been about 4 C for thousands of time in past million years. 10% of million years is 100,000 years.
I would guess less than 10% of last 1 million years has ocean which was about 4 C. But it seems more 5% of million years, has had ocean which was about 4 C, and more than 80% of the time with ocean of about 3.5 C.
It seems it’s accepted that our ocean has been as warm as 4 C {or possibly even warmer] in time periods of last million year.
And it’s accepted our ocean is currently about 3.5 C.
And not aware of any specific time period in which the ocean was 3 C or colder.
As wild guess, I would say less than 5% of the last million years had ocean heat content of 3 C or colder.
Also, in terms snowball climates [which I don’t think Earth has had] I think ocean heat content would need to be 2 C or colder.
How is one a climate change denier if they believe most of the CO2 in the atmosphere is from volcanos? Where does most of the CO2 in the atmosphere come from, your video doesn’t say.
The idea that most of the climate change can be explained with volcanoes implies that it can’t be AGW, Bill.
Why do you ask silly questions?
Willard read the description of the video and his post. It talks about the source of the bulk of co2 in the atmosphere. >95% of the co2 in the atmosphere comes from a different source than the burning of fossil fuels
> read the description of the video and his post.
Good idea, Bill:
Want fries with that?
willard if ”the bulk of the CO2 in the atmosphere comes from volcanic activity is wrong.”
Where did it come from? All the video goes into is what was emitted recently which is a small fraction of the CO2 in the atmosphere.
Bill,
First it was
[JAQ1] How is one a climate change denier if they believe most of the CO2 in the atmosphere is from volcanos?
Then it was
[JAQ2] What is the description of the video and his post?
Now it’s
[JAQ3] Where did CO2 come from if not from volcanoes?
There you go:
https://www.nationalgeographic.org/encyclopedia/carbon-sources-and-sinks/
It was been a pleasure to see you getting served.
Please come again!
bill…”Willard read….”
***
Come on, Bill, Willard is a dumbass troll. If you use sentences longer than two words he gets confused. And please don’t write in paragraphs, he goes right squirrely.
C’mon, Gordo.
This is an Arby’s.
Yep Willard is struggling yet again with his reading comprehension.
Pretty simple stuff the video description speculates on what the source was for the bulk of the CO2 in the atmosphere. Last I heard only about 4% of the CO2 in the atmosphere had been buried for a long period of time and pumped or spewed out of the ground. So does the author know what he is talking about? Or is he like Willard challenged by English?
Yep Bill conflates inference with speculation.
Considering how he reasons, who could blame him?
Willard its hard to say if the inference you claim being made here is a red herring or a strawman.
That is because you misunderstand both concepts, Bill.
The inference you misrepresent is indeed a red herring here, since we were discussing volcanoes.
Thats all I have been discussing Willard. Asking questions about the source of the claim by Shapiro: ”the bulk of the CO2 in the atmosphere comes from volcanic activity is wrong”
Are you hallucinating that I posted something else?
Sure, Bill.
Search for IPCC dot ch.
Why?
Why why?
Do you always recommend stuff without knowing why?
Hunter
Volcanic CO2 output is about 3 % of human output.
Maybe you switch to… SO2 in the stratosphere?
Bindidon you mean currently? But volcanoes have been erupting for billions of years.
Then we should be sing a steadyish growth of CO2 over billions of years?
Maybe some intrepid soul has done some research and calculated the contribution of various sources AND sinks of CO2 to the atmosphere.
Those scratching their heads could us the internet thingy to look at some actual research.
barry says:
Then we should be sing a steadyish growth of CO2 over billions of years?
————————-
Why? I thought it was a carbon ‘cycle’?
———-
=========
Barry says:
Maybe some intrepid soul has done some research and calculated the contribution of various sources AND sinks of CO2 to the atmosphere.
Those scratching their heads could us the internet thingy to look at some actual research.
————
Good advice for yourself. You have a link to where it it claims the bulk of the CO2 in the atmosphere has an anthropogenic source? Oh thats right Shapiro just gave us one, right?
I hunted up information on that years ago. There’s plenty of good research on it.
The majority of the CO2 in the atmosphere is not anthropogenic in origin. The growth of CO2 since 1900 is virtually all because of anthropogenic emissions. Well verified on multiple lines of evidence. This is one of the best corroborated components of AGW.
Barry,
“Hunted up information” is not very convincing. Apart from appeals to authority and other people’s research, what have you done to show the “growth of CO2 since 1900 is virtually all because of anthropogenic emissions?”
Clearly humans have contributed to the rise in CO2. Assuming atmospheric CO2 growth is even a problem at all, determining how much fossil fuel emissions contribute to the rise relative to other potential sources is of primary importance. Moving to net-zero, buying electric vehicles, controlling population growth, or any other efforts to reduce emissions should be a secondary concern until the contribution issue is resolved. Only fools rush in where wise men fear to tread.
“determining how much fossil fuel emissions contribute to the rise relative to other potential sources is of primary importance”
According to you and a teeny tiny collection of contrarians, who will never be convinced.
But the vast majority of skeptics who are also climate scientists (such as Roy), do not consider that to be a controversy of primary importance.
Nate, please stop adding nothing to a discussion.
Have you found any evidence to back up your claim that the Revelle factor causes a bottleneck in ocean uptake of CO2?
Im contributing by pointing out that your views are an extreme minority viewpoint.
Let me ask you. On science issues of importance to humans, how do we decide when to act?
Do we wait until all experts are convinced? 99.9%?
On issues like restrictions on toxic chemicals. There are always people with a vested interest, eg industry funded scientists.
See eg tobacco. Lead in gasoline.
So 99.9% is never achieved.
What then?
“On science issues of importance to humans, how do we decide when to act?”
Unfortunately, “we” are not likely to decide anything, because you bought the AGW dogma and stopped investigating the main unknowns regarding science involving the climate.
It is you and your “we decide when to act” fanatics that doubled the price of gas lately.
BTW, the planet will be fine no matter what your ilk do. It’s we the people that are literally paying the price now.
barry says:
The majority of the CO2 in the atmosphere is not anthropogenic in origin.
—————–
Indeed that is well known. But what was the original source of it. Shapiro claims it isn’t from volcanos. Did you find anything on that?
All I see listed as natural sources of CO2 is from volcanos and from decaying plants. But plants aren’t the source because to decay and release CO2 they must first absorb CO2 from the atmosphere.
So that leaves volcanos and we have Shapiro claiming: ”the bulk of the CO2 in the atmosphere comes from volcanic activity is wrong.”
Nate says:
RE: determining how much fossil fuel emissions contribute to the rise relative to other potential sources is of primary importance.
According to you and a teeny tiny collection of contrarians, who will never be convinced.
But the vast majority of skeptics who are also climate scientists (such as Roy), do not consider that to be a controversy of primary importance.
———————
Thats a bald faced lie Nate. How much feedback comes from a wild guess estimate of how much warming CO2 will directly cause (1c degree by taking the absolute maximum figure possible) is only one third of model projected warming and Roy has said many times determining the validity of that feedback of 2c is of primary importance.
Though from my perspective what is of primary importance is first determining what amount of warming would be harmful because right now its on a 150 year old winning streak of being beneficial with no realistic end in sight.
” how much warming CO2″
Way off topic, Bill.
“stopped investigating the main unknowns regarding science involving the climate.”
You, Chic, stopped investigating the Revelle Factor and ocean chemistry and the mixed-layer bottleneck, that plenty of others have investigated, explained, published, and understood for decades.
Why? Because it doesnt help your cause to debunk anthro CO2.
If you willfully refuse to get yourself informed on this Key topic, then why should policy depend, in any way, on your uninformed opinions?
“You, Chic, stopped investigating the Revelle Factor and ocean chemistry and the mixed-layer bottleneck, that plenty of others have investigated, explained, published, and understood for decades.”
Not true, Nate. I am working on it. But how do you convince a kid there is no boogie man under the bed?
The Revelle factor simply describes the fact that roughly nine of ten CO2 molecules absorbed by the ocean become carbonates. The rate limiting step is thermodynamic, not stoichiometric.
Nate says:
Way off topic, Bill.
————————–
So why did you lie about it?
As usual, Bill, you didnt read, dont know what the discussion is about, and come to erroneous conclusions.
“The Revelle factor simply describes the fact that roughly nine of ten CO2 molecules absorbed by the ocean become carbonates. The rate limiting step is thermodynamic, not stoichiometric.”
And the implications of that were described plainly in Bolin Erickson, which you need to read and comprehend.
“This tells us that 1 percent change in the total CO2 concentration in the sea requires a 12.5 percent change in the atmospheric CO2 to maintain equilibrium. If we consider only the mixed layer of the oceans, i.e. the surface layer which contains about as much CO2 as the atmosphere, less than 10% of excess fossil CO2 in the atmosphere should have been taken up by the mixed layer. It is therefore obvious that the mixed layer acts as a bottleneck in the transport of fossil CO2 into the deep sea.”
Nate says:
Let me ask you. On science issues of importance to humans, how do we decide when to act?
—————————
We are all free to act as individual humans Nate. Nobody asked you to be somebody else’s keeper.
But what I am hearing here is ”we” is exclusive code for some gigantic collective ”we” which should never act until true harm to ‘others’ is well identified.
Fear of change and fear of the unknown should never apply. The freedom to see something better using all the minds of the culture is well managed in the marketplace with a relatively small amount of regulation. Some regulation is called for such as discharging poisons into the commons. However managing the commons needs to be done with good and transparent science within the framework of a very public process.
On the transparency of science I recall a great quote by Dr. William Happer on what constitutes quality science. I wish I could find the quote again but it went something like it is something that any freshman class of students can easily understand and explain to others.
But as we can see there isn’t even consensus among the warmists about how the greenhouse effect actually works. . . .each has simply been willing to trust their daddy’s on this in homage to a form of elitism.
What Happer’s comment does is draw a line between developing science and well-accepted science. Developing science can be very difficult to understand.
It is worthy of experimentation via well-informed volunteers.
But radical politics has judged individual freedom to be dangerous and bigoted and an involuntary experiment on others and thus the stupid masses need management by the elitists. Indeed that is just about the entire discussion around here and your quote above poses a question that most definitely needs an answer apriori to making the decision for others.
There has been CO2 in the atmosphere since the planet formed, and much more than present in prior epochs. The arrival of life, biota and animals changed the atmospheric portion of CO2, and various climate swings over geological time have changed the oceans solubility for CO2, most recently the quaternary glacial transitions, where CO2 was soaked up by global the oceans as the global temperature dropped in cold periods and outgassed as the temperature rose.
The various sinks and sources for CO2 operate on varying time scales, some with at an even pace (silicate weathering), others in fits and starts (volcanic activity, rapid biota changes), at least on geological time scales.
The most recent period of CO2 rise in the atmosphere is very clearly anthropogenic in origin. There are multiple lines of evidence, not the least of which is that human industry pumps out around twice as much CO2 as has accumulated in the atmosphere. Accounting for other sources (eg, the oceans are currently gaining CO2, not losing it to the atmosphere) indicates the origin of recent rise, which is very rapid compared to the geological record, as does the changes in isotopic ratios in atmospheric CO2, which are consistent with the burning of fossil fuels.
This issue is not in any doubt.
barry says:
The arrival of life, biota and animals changed the atmospheric portion of CO2. All life can do is sequester existing CO2 in the atmosphere as before it can rot and emit it it must first absorb it to build the biomass. So biomass is not a source of carbon in the atmosphere except in the case of mining old CO2 sequestered by life forms and burning it.
So that only leaves volcanos as an original source on NOAA’s list of sources of carbon dioxide in the atmosphere. That makes Shapiro’s claim wrong.
“Let me ask you. On science issues of importance to humans, how do we decide when to act?”
As expected from Bill, lots an lots of ranting, except for this sensible part:
“Some regulation is called for such as discharging poisons into the commons. However managing the commons needs to be done with good and transparent science within the framework of a very public process.”
Indeed
2020: Covid pandemic. US committed to fund rapid vaccine production by novel RNA methods, based on the scientific consensus.
1970s: Based on the scientific consensus (minus industry scientists and supporters) that showed Lead harmed child brain development and was building up in the environment, Lead in gasoline was banned..
1980s” Certain chlorofluorocarbons chemicals phased out, based on the scientific consensus that they were destroying the Earths ozone layer.
obviously there are many instances when we NEED to act based on available science.
But yet no answer to the question above.
How do we decide when to act? DO we need to wait until every last contrarian is convinced?
If that is the case, then none of the above examples would have ever been acted on.
Your point?
The point is clearly stated at the end, Bill.
Nate you built a strawman there and claimed no action would have ever been taken.
I answered how action should be taken. I defined a true consensus science determining harm. In fact was regulated not for lead but for the protection of catalytic converters designed to limit pollutants associated with smog that did have science behind it and done in a willing marketplace (the converters didn’t slow adoption of the technology in the marketplace because of a relatively minor cost).
Also COVID vaccines didn’t require regulation of choice. 60% sought and got the vaccination often standing in long lines without any coercion from the government and funding of it was non-controversial and its funding had no real opposition.
OTOH, the CFC regulation was possibly a mistake, advancing myth and fear mongering above science.
High solar activity is the natural regulator of ozone in the atmosphere. Now past that peak of solar activity the ozone hole has closed and we have no idea if regulation had anything to do with it. There is not a clear scientific consensus on that matter. And there isn’t even a clear scientific consensus on a direct threat of lead in gasoline but it passed because of the need to not put in new cars with catalytic converters. Econuts made a big deal about prohibiting it going into a spiritual belief system for justification but the fact was lead just wasn’t that important and not the only product or technology that reduces knock in combustion engines. Today as technology has advanced ethanol as a knock reducer is only mandated as a continuing subsidy for farmers.
So you can take your strawmen Nate and stuff them where the sun don’t shine.
No strawman that I can see, Bill.
And you stated ” good and transparent science within the framework of a very public process.” is what is needed to determine when to act.
Which is fine, but vague wrt to my question:
“How do we decide when to act? DO we need to wait until every last contrarian is convinced?”
Which was a question for Chic (not you), who aligns himself with a teeny tiny group of contrarians who don’t accept that FF carbon is mainly responsible for the rise in atmospheric CO2, and he considers this an issue of “primary importance”.
And he suggested that we should not act on FF emissions until THAT issue is settled. “Only fools rush in where wise men fear to tread.” ( I assume he works for the FF industry)
Hence my question. Because among climate scientists, including the vast majority of skeptics like Roy, THAT issue is not controversial. It is settled that FF are mainly responsible for the rise in atm CO2.
“was regulated not for lead but for the protection of catalytic converters designed to limit pollutants associated with smog that did have science behind it”
The health effects of Lead DID have science behind it and it WAS acted upon by the govt with the Clean Air Act.
“https://www.eia.gov/energyexplained/gasoline/gasoline-and-the-environment-leaded-gasoline.php
“Health hazards associated with lead have been documented since the early 1920s. The U.S. Surgeon General set a voluntary standard for lead content in leaded gasoline. The standard was raised in the 1950s.
The U.S. Congress adopted the Clean Air Act in 1970 and created the U.S. Environmental Protection Agency (EPA). The Clean Air Act set air quality standards that included a timetable for phasing out leaded gasoline.”
Bill Hunter says:
And you stated ”good and transparent science within the framework of a very public process.” is what is needed to determine when to act.
Which is fine, but vague wrt to my question:
”How do we decide when to act? DO we need to wait until every last contrarian is convinced?”
Which was a question for Chic (not you), who aligns himself with a teeny tiny group of contrarians who dont accept that FF carbon is mainly responsible for the rise in atmospheric CO2, and he considers this an issue of ”primary importance”.
——————-
Well indeed the notion that CO2 is responsible for the bulk of the increase of CO2 in the atmosphere is not a matter of science but of politics. That doesn’t mean it isn’t responsible for the bulk of the increase; it just means its a question yet to be answered by science.
Very clearly this shortcut is so much abused by politicians they even have a name for it invented by those who want the politicians to take authoritarian positions on the assumption the masses are stupid and need to be directed. Its called Post Normal Science. So if you accept that Post Normal Science is a legitimate form of science then indeed ff emission are responsible for the bulk of the increase of CO2 in the atmosphere and the popularity of that notion among the elite influencers is so high few question it.
But in fact all we know for sure is that 4% of the CO2 in the atmosphere is due to ff emissions. Meanwhile the atmosphere level of CO2 is alleged to have increased by 30%. However, that also isn’t based on established science. Even the 20% shown by the Mauna Loa monitoring is not solid science as its a single sample taken in the northern hemisphere where CO2 emissions have been the highest. I don’t have a big problem with that but typically science should be based upon more than one method and I am unaware if there are any concurring records that date back to the beginning Mauna Loa record.
And Chic is not alone in this. In fact his statement has fewer conditions than many scientists that are skeptical of anthropogenic causes being 100% of the modern warming. In fact I would venture that if you took a poll that would be the majority of scientists and that position Nate would require many other conditions be met in addition to establishing the bulk of the increases in CO2 in the atmosphere was anthropogenic.
So you can claim its settled but it far from that.
Nate says:
The health effects of Lead DID have science behind it and it WAS acted upon by the govt with the Clean Air Act.
https://www.eia.gov/energyexplained/gasoline/gasoline-and-the-environment-leaded-gasoline.php
————————-
All you are doing here is parading in plain sight your ignorance on this topic.
Check out figure 1 at this link:
The EPA regulation you link to is put the regulation effective date at January 1, 1996. But that time 98% of the gas available was unleaded due to the reasons I previously stated. The 2% on the market still was primarily being used for fueling in the exempted categories (e.g. older cars, aircraft, racing cars, farm equipment, and marine engines.)
Quite simply it was accomplished with regulations to address different issues, didn’t cost a lot (most of the costs being born by those who for various reasons misfueled their engines and damaged them with the inferior fuel). Meanwhile the whole effort increased CO2 emissions by 5% and the government tried to cover that up by claiming ethanol was carbon neutral. . . .while today they refuse to recognize the greening of the planet by CO2 which is even quite apparent in the CO2 data.
“Well indeed the notion that CO2 is responsible for the bulk of the increase of CO2 in the atmosphere is not a matter of science but of politics. That doesnt mean it isnt responsible for the bulk of the increase; it just means its a question yet to be answered by science.”
Makes absolutely no sense, Bill.
“The EPA regulation you link to is put the regulation effective date at January 1, 1996. ”
I was talking about the 1970 Clean Air Act, which clearly stated that Leaded gasoline should be phased out.
Unleaded gasoline was introduced. And as a result, catalytic converters were enabled to come out in 1975 to solve the air pollution requirements. Which, yes, accelerated the use of unleaded gasoline.
https://news.google.com/newspapers?id=9tBOAAAAIBAJ&dq=catalytic-converter&pg=6404%2C6576523
Nate,
“It is settled that FF are mainly responsible for the rise in atm CO2.”
Of course it is NOT settled and your appeals to authority and unfounded assertions are laughable.
The relative amount of FF versus non-FF emissions is of primary importance; because, if FF emissions are relatively minor, why should we risk global recession and adverse consequences on a non-problem?
I am also not troubled about rising CO2 whatever the causes, because its effect on global warming is not settled either.
Nate says:
”I was talking about the 1970 Clean Air Act, which clearly stated that Leaded gasoline should be phased out.”
Don’t you find it strange that the word ”lead” cannot be found anywhere in the 1970 Clean Air Act?
“So that only leaves volcanos as an original source”
The oceans outgassed 100ppm of CO2 over 5000 years about 16 thousand years ago, a 55% increase in total atmos CO2, far more than any volcanic eruption or sequence of eruptions for at least 20 million years prior.
Dunno what you mean by ‘original’. Atmospheric CO2 is mostly turned over about every 4 years (the residence time of an individual CO2 molecule, on average). This means that the major source of atmospheric CO2 is currently biological in origin – from decaying biota. Anthropogenic CO2 is the second most abundant source.
Relaxation time for pulses in atmospheric CO2 (like the one currently ongoing) is 500 to 1000 years, as the sinks available to take up the excess are slow sinks (oceans, silicate weathering).
I don’t know at what time in the past atmospheric CO2 was primarily volcanic in origin. Possibly the Deccan Traps formation 66 million years ago, but that was a build up over 100,000 years, which suggests to me that the majority of CO2 through that period was of plant origin.
What is it you are trying to get at?
Barry says:
Relaxation time for pulses in atmospheric CO2 (like the one currently ongoing) is 500 to 1000 years, as the sinks available to take up the excess are slow sinks (oceans, silicate weathering).
———————-
Barry 1) we don’t know how fast sinks will uptake CO2. We haven’t even figured out a way to measure it yet.
2) Relaxation time is quite quick in terms of removing the material amount of a pulse. C14 bomb uptake was nearly 90% in 15 years. Since as the amount of excess gets smaller it takes longer for each extra percentage. 500 to 1000 years is probably the projected time to get the last molecule of CO2 absorbed into the ocean. A really meaningless fact used to deceive the naive.
Are you naive?
—————
==============
Barry says:
”I dont know at what time in the past atmospheric CO2 was primarily volcanic in origin. Possibly the Deccan Traps formation 66 million years ago, but that was a build up over 100,000 years, which suggests to me that the majority of CO2 through that period was of plant origin.”
Again plants are not considered to a source for 2 reasons.
1) Plants are not considered to be a sink within the context of AGW despite the fact sequestration has a wide range from about one year to 2 thousand years or more.
2) plants are not a source because for a plant to release CO2 into the atmosphere it must first take up even more CO2 out of the atmosphere as the carbon cycle in plants causes some of the carbon absorbed out of the atmosphere is permanently embedded through the processes of petrification.
So plants are not a source of CO2. Currently because of the greening of the planet from elevated CO2 plants are a larger sink than during times with lower levels of CO2 in the atmosphere.
Nate, no bottleneck to be found so far.
https://www.drroyspencer.com/2022/05/uah-global-temperature-update-for-april-2022-0-26-deg-c/#comment-1277882
Bill,
“500 to 1000 years is probably the projected time to get the last molecule of CO2 absorbed into the ocean. A really meaningless fact used to deceive the naive.”
I think you are exactly right about the last molecule bit. Barry is in good company with all AGW dogma followers confused about e-times and “relaxation.”
Regarding plants, the latest data I’m seeing tends to indicate that decomposition, fires, etc. are exceeding uptake by plants resulting in what could be a true net source. By true, I mean not just more emissions each year although being less than what is photosynthetically absorbed.
Bill,
Again, the EIA site clearly states:
“The U.S. Congress adopted the Clean Air Act in 1970 and created the U.S. Environmental Protection Agency (EPA). The Clean Air Act set air quality standards that included a timetable for phasing out leaded gasoline”
They are lying, are they?
“Since as the amount of excess gets smaller it takes longer for each extra percentage. 500 to 1000 years is probably the projected time to get the last molecule of CO2 absorbed into the ocean.”
Yes, that’s what I’ve read. A long tail to being absorbed.
The origin of most CO2 in today’s atmosphere is definitely plants. Because of the annual overturn of CO2, it takes only a few years to renew all the CO2 therein. There is very little CO2 now that is of volcanic origin.
Even taking into account the millennial relaxation time, this remains the case. There has not been a significant volcanic pulse for tens of millions of years.
Of course plants are both a source and sink of CO2. The biannual respiration of CO2 that gives us the sine wave in total atmos CO2 is directly a result of the fastest large-scale carbon cycle on the planet, and is the reason why the majority of current atmospheric CO2 originates from plants. Volcanic CO2 makes up a tiny fraction of annual CO2, and is absorbed by plants, which are not fussy about what CO2 they eat.
Ocean outgassing added 100ppm CO2 (55% increase) to the atmosphere 16 thousand years ago. Depending on the time frame you choose, you could argue that this is the primary source of most CO2 in the atmosphere (ignoring recent anthro contribution).
If you want to posit volcanic outgassing is the primary source of CO2, then your time frame should probably centre on the formation of the atmosphere itself 3-4 billion years ago.
There are fast and slow processes in the carbon cycle. Fast processes are the dominant source of CO2 in the atmosphere. Your argument appears to revolve around some time scale factor, but you haven’t been particularly clear.
Chic,
”
Of course it is NOT settled and your appeals to authority and unfounded assertions are laughable.”
If you mean it is not settled for YOU because you havent yet read the relavant literature on the subject, then yes, I could agree.
But something not settled for YOU because of your lack of knowledge, does not equate to not settled for science and those who are knowledgeable.
I think you are subsituting trust of your chosen contrarian authorities, Berry and Salby, with a proper investigation of the literature.
Not a good substitute. Berry has shown that he is unfamiliar with the Revelle Factor and its bottleneck effect, but he simply feels it can be ignored.
Feelings arent facts.
No sign of a bottleneck anywhere. You will need more than appeals to authority and 60-year old unverified models to show otherwise.
If I am wrong about the carbon cycle, I’ll be glad to admit it. The science is what drives me, not being right or how I feel about it.
“No sign of a bottleneck anywhere. You will need more than appeals to authority and 60-year old unverified models to show otherwise.”
Well of the teeny tiny amount of literature youve been shown on the subject, Revelle, Bolin and Erickson, and Bern group papers the evidence is clear on the ocean chemistry, which you still don’t seem to understand, and in their successful prediction of future atm rise to unprecedented levels.
There are plenty of measurements of Earth’s carbon fluxes, eg
https://www.nature.com/articles/s41597-020-00653-5
You have yet to show that you have looked at any of it to ‘find’ any evidence of your extra natural flux, or any evidence to falsify the bottleneck effect.
“The science is what drives me, not being right or how I feel about it.”
I see little evidence of a desire on your part to learn about the large body of existing science that may contradict your preferred hypothesis.
It is bleeding obvious that a political and/or industry agenda is what drives you. Science with such an aim is generally piss-poor science.
Nate says:
Again, the EIA site clearly states:
The U.S. Congress adopted the Clean Air Act in 1970 and created the U.S. Environmental Protection Agency (EPA). The Clean Air Act set air quality standards that included a timetable for phasing out leaded gasoline
They are lying, are they?
———————
Of course Nate! The EPA lies as much as other unaccountable agencies lie.
After all Nate the stupid populace needs to be lied to. Right?
Read the act for yourself and show me if you find anything like that.
EIA not EPA, dimwit.
Evidence that they lied?
No need.
Flat Earthers simply declare that all the pics from space are fake.
It works for them..and it works for you.
“You have yet to show that you have looked at any of it to ‘find’ any evidence of your extra natural flux, or any evidence to falsify the bottleneck effect.”
Potential sources of non-fossil fuel emissions include land-use changes, fires, permafrost melt, volcanoes, and plant decomposition. Thank you for providing a link to a study on 500 trees showing increasing rates of photosynthesis and respiration of 0.49 and 0.33 GtC/yr. I bookmarked it for later use. In the meantime, I am working on analyzing the box models, similar to B&E and Ed Berry’s, for consistency with data and proper application of physical principles.
As indicated below on this post, I found no bottleneck alleged by B&E. I will now finish updating a spreadsheet providing you evidence falsifying a bottleneck that you can check for yourself.
Chic Bowdrie says:
No sign of a bottleneck anywhere. You will need more than appeals to authority and 60-year old unverified models to show otherwise.
If I am wrong about the carbon cycle, Ill be glad to admit it. The science is what drives me, not being right or how I feel about it.
————————
One needs to define a bottleneck. CO2 is depleted in the upper ocean because of biological production. The upper oceans ability to absorb CO2 has some limitations or biological production would go off the charts with more available CO2. That is the Revelle Factor.
One need only read the IPCC mainbody reports to realize that there is no scientific consensus on the Revelle Factor having any additional impact than seen in the Bomb pulse uptake where it took only a few washes of the atmosphere (7 year wash cycle) for nearly 90% of the C14 to exit the atmosphere.
So my conversation with Barry on the source of CO2, Barry wants to make biota a source when in fact what it is is a net sink.
More CO2 exits the atmosphere via plants than gets pushed back into the atmosphere by plants. Carbon14 becomes unavailable primarily because the ocean absorbs CO2 and it mostly gets taken up by the biota and when the plant dies only some of that carbon finds it way back into the atmosphere. The Revelle Factor plays into that and creates a baseline rate of uptake.
The fact that some woody land plants absorb it and when it dies it slowly decays accounts for some of the C14 from the bomb pulse still being detectable.
Carbon14 doesn’t just disappear because it gets absorbed by a plant. Thats why we have carbon14 dating.
Thus the known bottle neck is the rate of uptake seen in the bomb pulse. There isn’t a scientific consensus that the Revelle Factor will change the carbon uptake rate previously seen with the Carbon14 bomb pulse. Only the blabbermouths out there including a number of blabbermouth scientists think so and they have no science to back up their claims but these things rise to the top of science papers because of politics. they speculate about this and that but have nothing that would be considered real science.
If it weren’t for the Revelle factor the nuclear bomb pulse wouldn’t have hung around as long as it did. The brains behind the hysteria already know that. Thats why they switched from global warming to climate change figuring that they probably couldn’t keep the facts under the hat as they slowly made in roads on emissions.
So they want you to start worrying about mining fossil fuels and having that be in the ocean. . . .though there is no science just speculation about what more carbon will cause whereever it ends up.
Bottom line is Al Gore is the inventor of the sandpile theory which is a theory that if we keep building the sandpile too high there will be a landslide. . . .and Big Al wants to tell you that you shouldn’t build sandpiles at all. And when he made VP he greened (green in the other sense) the anti-progress industry (with Bill’s help). That pretty much sums up the science behind climate change.
“One needs to define a bottleneck. CO2 is depleted in the upper ocean because of biological production. The upper oceans ability to absorb CO2 has some limitations or biological production would go off the charts with more available CO2. That is the Revelle Factor”
Bill, Revelle Factor is pure chemistry, has nothing to do with bio production.
No one need pay attention to your ignorant blather about any off this.
” Thank you for providing a link ”
Sure. There is lots to find. Maybe you will get the idea that you can search yourself, too find all that you need to falsify the bottleneck.
Bill, The bottleneck Nate and I debate concerns the ocean. Mostly nothing to do with land biota as Nate wrote. I generally turn off anyone referring to blabbermouths without naming names and citing references that can be evaluated. Nate is a blabbermouth and an obfuscator, but sometimes he stumbles on interesting papers worth analyzing. The Bolin/Eriksson paper is exemplary.
Nate, I posted a spreadsheet showing the evidence that B&E’s bottleneck claim is falsified. Have at it.
https://www.drroyspencer.com/2022/05/uah-global-temperature-update-for-april-2022-0-26-deg-c/#comment-1278601
Nate says:
Bill, Revelle Factor is pure chemistry, has nothing to do with bio production.
No one need pay attention to your ignorant blather about any off this.
————————–
Stop just moronically replying to my posts. I didn’t say biological production modified or was part of the Revelle Factor.
What I said was The Revelle Factor allows for biological production to make the upper oceans to have a lower CO2 content than the deeper ocean where biological production is much lower (below the photic zone of the ocean).
Without the Revelle Factor the upper ocean would not be CO2 poor because of biological production. CO2 would be replaced in the upper ocean by the atmosphere as fast as the plants absorbed it.
The bomb pulse depletion rate is the rate that mostly represents the biological production sink rate (i.e. isn’t put back due to the annual respiration cycle). One should note that actually its a bit faster because France and China continued atmospheric tests after the ban.
Chic Bowdrie says:
Bill, The bottleneck Nate and I debate concerns the ocean. Mostly nothing to do with land biota as Nate wrote.
—————————————-
I didn’t say the Revelle Factor had anything to do with land biota.
I am talking about marine biota is able to deplete CO2 in the upper ocean because of the Revelle Factor.
The Revelle Factor slows CO2 uptake by the ocean even when the atmosphere is rich with CO2. Marine biota while having an estimated biomass much smaller than land biomass goes through more CO2 per year than the land biomass goes through.
thus the Revelle factor has no more impact on ocean sequestration of carbon than it had with the bomb pulse. The IPCC has included bomb pulse decay rates of the CO2 pulse within their range of estimates and is the only one with experimental evidence showing how fast stuff gets washed out of the atmosphere.
Bill wrote, “I am talking about marine biota is able to deplete CO2 in the upper ocean because of the Revelle Factor.”
As I wrote, and I think Nate agrees, the Revelle factor is a function of seawater carbonate chemistry, not marine biota. Marine biota may affect carbonate chemistry, but does not enter into the Revelle factor calculation. In fact, marine biota may be the reason that Revelle factors are wholly conceptual as opposed to factually evident from ocean data.
Because of my interest in getting to the “bottom” of this, I would appreciate any evidence you have that “the Revelle Factor slows CO2 uptake by the ocean” under any circumstances.
Chic Bowdrie says:
Bill wrote, I am talking about marine biota is able to deplete CO2 in the upper ocean because of the Revelle Factor.
As I wrote, and I think Nate agrees, the Revelle factor is a function of seawater carbonate chemistry, not marine biota.
Marine biota may affect carbonate chemistry, but does not enter into the Revelle factor calculation.
—————-
Agreed
—————-
===============
Chic Bowdrie says:
Because of my interest in getting to the bottom of this, I would appreciate any evidence you have that the Revelle Factor slows CO2 uptake by the ocean under any circumstances.
————————-
Seems to me it does. But does it matter? Chemical carbon sequestration is just a competing process.
The point of my post was that the CO2 sequestration was originally set at 2 billion tons of carbon (per year total) and almost all of it was assumed to be chemical rather than biological.
But that was all desktop theory. The kind typically found in Post Normal Science.
Here is an interesting article that says 2 billion tons of carbon (7.33 billion tons of CO2) is being transported to the deep ocean by a biological pump (not a chemical reaction fallout). Further that 640 billion tons of carbon (2.35 trillion tons of CO2) is sequestered long term and it is not known if these concentrations resulted from biological or nonbiological processes.
https://eos.org/features/dissolved-organic-matter-in-the-ocean-carbon-cycle
The bottom line here is I see no reason to believe that the Revelle Factor will cause ocean uptake of carbon dioxide to slow more than its original limitations. The chemicals needed have a cycle of their own setting the upper limit. One might conclude that the rate can’t increase, but I haven’t seen anything that says it will decrease.
Thus there is no argument I have seen that would suggest that future increases anthropogenic emissions would not quickly return to the present if emissions were reduced to the present as seen with the bomb pulse.
Further it is not known how the biological processes mentioned in the article have affected climate change but it is suggested that it has had a role.
Neither the science is present nor the need established to take action on climate change. However, on the other side of the equation is the fact that fossil fuels were a major contributor to our prosperity and the UN recognizes that by saying we NEED TO make exceptions for the 3rd world and developing nations to increase their emissions.
Finally the article notes the findings came out of a controversy triggered by a theory that didn’t pan out. So I would like to personally thank all the warmists on this board for helping mightily to keep controversy on the table!! Good healthy open debate finds it way into the political sphere to motivate curiosity, investigation, and the accumulation of knowledge.
Nate says:
EIA not EPA, dimwit.
Evidence that they lied?
No need.
Flat Earthers simply declare that all the pics from space are fake.
It works for them..and it works for you.
———————————–
Nate the evidence they provided inaccurate information is incontrovertible! The word lead isn’t in the 1970 Act!!!!!
But you pointing out it was another agency that said it, gives cover it wasn’t a lie as you suggested it must be if the word ‘lead’ isn’t even in the act.
Ignorance is the answer. If you ever audited a government agency you would know one agency has very little idea what another agency does or why they do it. The only agencies in government that would not be true of would be the various auditing agencies such as the Office of Inspector General and the GAO and I am certain you won’t find that quote you came up with coming from them.
“So my conversation with Barry on the source of CO2, Barry wants to make biota a source when in fact what it is is a net sink.”
Th annual turnover makes the biota the primary source of CO2 even if it is a net sink over the long term.
Your POV seems to rest on some time-scale you have not enunciated.
If CO2 had an isotopic tracer that identified the reservoir that CO2 came from, you would take a volume of atmosphere today, analyse it and find that the majority of CO2 molecules came from plants. That’s a straightforward fact.
You must be thinking of some other time scale when you posit that the source of CO2 in todays atmosphere is mostly volcanic, Bill.
Barry you just don’t understand the game with the figures.
It is really quite simple. Shapiro breaks it down into two sources volcanos and anthropogenic and here you are arguing that biota is a source.
Thats the game ignore anything that isn’t deeply sourced down in the earth and then only look at what its annual contribution has been to the bulk of CO2 in the atmosphere while ignoring volcanos have been contributing for billions of years and anthropogenic for 100 years.
Now you want to include ocean outgassing by marine biota releasing carbons into the ocean through the consumption of forage and direct rotting and molting of the forage and the predators. But this outgassing is regulated. By water and atmosphere temperatures. So Shapiro decided to selectively pick on volcanos as a source and limit that source to annual land volcanos spewing CO2 into the atmosphere.
So what do you think is going on in his head calling anthropogenic emissions as making up the bulk of CO2 in the atmosphere?
Its a very complicated question and if I play the game like Shapiro is playing it I will ask how much CO2 have volcano’s released in the entire lifetime of the planet. Or if that is unreasonable, how about the entire Holocene? And how about undersea volcanos which make up the bulk of volcanos in the world? Oh gee they say that CO2 is absorbed by the ocean so we don’t want to count that. . . . .sheesh!
As they say stupid is as stupid does!!! I am just dying to see the academic paper that waves its arms over all this!
Bill, I don’t know what gam YOU’RE playing. I’m quite familiar with the sources and sinks of CO2 and the time scales on which they operate.
It’s a simple fact that because of the fast turnover of land biota in the carbon cycle, that currently the majority of CO2 in the atmos came out of decaying plants.
That’s purely down to how fast plants turn over carbon.
It doesn’t matter a whit that global biota is a net sink when determining the primary source of current CO2. The biota eats ALL varieties of CO2, whether from plants, human activity or volcanoes. So it’s not preferentially removing just the CO2 it emits.
Volcanoes put out a miniscule amount per annum compared to the amount emitted (and absorbed) by plants each year.
That annual turnover also dwarfs the annual anthropogenic input.
These are not alarmist ramblings. When you ask what the origin of CO2 in the atmosphere is, you can start at the very beginning and say that all matter on our plant was born in stars (a pretty ho-hum cliche), or you can think of an individual molecule in our current atmosphere, and know that it is likeliest to have been pumped out by a plant, because other sources don’t emit CO2 at a higher rate per annum than global plant life.
If you want to posit that some other reservoir is the source for the current CO2 in the atmosphere, then you’re going to have to explain yourself.
So far you haven’t done that.
Are you claiming that each year volcanoes emit more CO2 than plant life, and that the majority of current molecules of CO2 in the atmos were mostly belched out of the earth?
Because that’s not true.
Or are you thinking that volcanoes were the source 4 billion years ago, and that whatever sinks and sources cam after owe their reservoir to volcanic activity?
I’m having to guess your meaning, Bill, because you’re not being clear.
It doesn’t help that you prefer to lace your post with jabs at perceived alarmists than clarify the actual point you’re trying to make.
And would you care to link to ‘Shapiro’, so that you help clarify what you’re referring to with that?
Barry says:
Bill, I dont know what gam YOURE playing. Im quite familiar with the sources and sinks of CO2 and the time scales on which they operate.
Its a simple fact that because of the fast turnover of land biota in the carbon cycle, that currently the majority of CO2 in the atmos came out of decaying plants.
————————-
Yes after these previously living plants absorbed the CO2 out of the atmosphere!
Thus living plants cannot be a source for the bulk of CO2 in the atmosphere. Instead plants are a sink because some of the CO2 absorbed from the atmosphere does not again see the atmosphere for a whole variety of time scales perhaps into the billions of years.
Thus one has to look deeper for the source of CO2 into the atmosphere.
————–
————–
==============
Barry says:
Thats purely down to how fast plants turn over carbon.
It doesnt matter a whit that global biota is a net sink when determining the primary source of current CO2. The biota eats ALL varieties of CO2, whether from plants, human activity or volcanoes. So its not preferentially removing just the CO2 it emits.
————————
True (besides whether it matters or not) it matters regarding to whether biota is a sink or a source. On every time scale its a sink.
————–
————–
==============
Barry says:
Volcanoes put out a miniscule amount per annum compared to the amount emitted (and absorbed) by plants each year.
That annual turnover also dwarfs the annual anthropogenic input.
——————–
True. We need to focus on that. Include land volcanos, add in undersea volcanos, add in the amount of CO2 that is emitted from the ocean via changing climate, etc. But Shapiro wants to focus only on current land volcano eruptions. He is building fake strawman to shoot down to impugn skeptics.
The science isn’t there yet regarding the rate of variability of carbon in the ocean, particularly the outgassing of it, instead focusing on largely irrelevant Revelle factors of how fast the surface ocean converts CO2 to inorganic carbon while the big dog remains near totally unknown.
Seems to me if there weren’t other agendas and we were really concerned about how humans might affect the climate we would be putting probably a majority of our carbon cycle research dollars and huge portions of research on mitigation into learning about that. But I suggest that those spending the money really aren’t all concerned about that but instead have much different agendas on their mind.
————–
————–
==============
Barry says:
When you ask what the origin of CO2 in the atmosphere is, you can start at the very beginning and say that all matter on our plant was born in stars (a pretty ho-hum cliche), or you can think of an individual molecule in our current atmosphere, and know that it is likeliest to have been pumped out by a plant, because other sources dont emit CO2 at a higher rate per annum than global plant life.
—————
Or I could erect a strawman and posit land volcanos vs anthropogenic and ignore everything else. . . .such as how the huge stores of carbon in the ocean varies its uptake and output over decades and millennia as we know occurs for example from ENSO and ocean oscillations.
Instead we choose to rely on shabby extrapolations of what little science we have about the history of CO2 in the atmosphere and how that has varied of the course of the earth on all time scales.
————–
————–
==============
Barry says:
Are you claiming that each year volcanoes emit more CO2 than plant life, and that the majority of current molecules of CO2 in the atmos were mostly belched out of the earth?
Because thats not true.
——————-
No I am a far level of sophistication regarding possibilities than the limited issues you are speaking of.
————–
————–
==============
Barry says:
And would you care to link to Shapiro, so that you help clarify what youre referring to with that?
——————–
Sure! https://www.drroyspencer.com/2022/05/uah-global-temperature-update-for-april-2022-0-26-deg-c/#comment-1267464
A shorter version would be:
Climate change alarmism is built on 2 myths:
1. CO2 is responsible for all the modern warming.
2. CO2 has increased in the atmosphere solely due to anthropogenic perturbation
there is enough climate science out there to declare both of those as established myths.
Shapiro comes in with an implication that it is myth that skeptics believe volcanoes are responsible for the bulk of the CO2 in the atmosphere. Volcanoes in one sense might be if you decide to limit your look to sometime after the earth was created and the present.
So lets say Shapiro doesn’t know what he was talking about and instead he meant to say what is responsible for increases in CO2 since it was first routinely monitored sometime in the 1950’s. Well its still a myth that skeptics believe that. No doubt one can find someone who believes that but hey people are convinced that UFOs are flying about our heads too.
So why imply skeptics believe that? Shapiros entire post and video is pure junk.
OK so what do we know? We know that humans are responsible for at least 16ppm of CO2 in the atmosphere. No reasonable question about that.
How much was natural we don’t know and are not devoting many resources to find out.
Is CO2 responsible for all the modern warming? Again we don’t know and are not devoting many resources to find out.
Why? Only one reason. . . .unspoken agendas that the public would like to know. If anybody wants to know that the public isn’t as dumb as some people want to believe its that fact that proves they are not.
Your link goes to no study by Shapiro, Bill. This was it.
https://www.drroyspencer.com/2022/05/uah-global-temperature-update-for-april-2022-0-26-deg-c/#comment-1267464
I’ve been slow to realize you’re not interested in delving the issue with me, but rather in pointing out Shapiro’s apparently lacklustre performance.
“So lets say Shapiro doesn’t know what he was talking about and instead he meant to say what is responsible for increases in CO2 since it was first routinely monitored sometime in the 1950’s. Well its still a myth that skeptics believe that.”
This is so garbled I can’t make out what you are trying to say. The whole paragraph lacks a subject.
It might be clearer if you say exactly what he meant to say. Maybe.
But also I’m losing interest. Someone was wrong, huh?
barry says:
It might be clearer if you say exactly what he meant to say. Maybe.
———————-
I’m not a psychoanalyst! I assume he said what he meant to say.
Volcanic CO2 output was roughly in equilibrium with natural carbon sinks, causing CO2 levels to remain approximately constant at 270-280 ppm for thousands of years. The human input has caused sources to become greater than sinks, leading to another 130 ppm being added.
Making a statement about sources without referring to sinks is always going to (intentionally) paint a false picture.
Antonin Qwerty says:
Volcanic CO2 output was roughly in equilibrium with natural carbon sinks, causing CO2 levels to remain approximately constant at 270-280 ppm for thousands of years. The human input has caused sources to become greater than sinks, leading to another 130 ppm being added.
——————–
Gee that probably explains our prosperity! Cool Dude! Goes to show those who take the initiative can really get good stuff done!
“If I have nothing useful to say, just hit them with nonsense”.
Is that what they teach you?
You don’t seriously believe that fossil fuels didn’t contribute greatly to our prosperity do you?
Is that what you believe I said? Oh dear!
If I did would I ask the question?
To troll, Bill.
Nope Willard you are trolling.
CO2 emissions have contributed hugely to our prosperity. The UN recognizes that by giving exemptions on emissions to third world and developing nations so they too can live better. But the elite worry if too many people live as well as they do. . . .ugh!. . . .then they would no longer be elite.
It is one of the most important inconsistencies in the entire UN project and you think its trolling. . . .ROTFLMAO!
Volcanoes belong to the carbon cycle. GRRRRROWTH belongs to the economic cycle. Trolling by playing squirrels belongs to your Climateball cycle.
Willard dons his tinfoil hat and starts directing traffic. Move along folks nothing to see here.
mark…”Yet more evidence from Dr. Roy that climate change is real”.
***
If you cut all the legs off a frog and it could no longer jump when it heard a loud sound, you’d claim the frog had gone deaf.
Those predictions of sub-zero anomalies on the 1981-2020 baseline are looking more and more doubtful for this La Nina cycle. And I think the -0.2 to -0.3 anomaly on the 1991-2020 baseline prediction (https://tinyurl.com/4zt6ffay) we saw in December failed by a wide margin.
It is sinusoidal at about 0.2C (approx). It made the step-change in 2013-2014. Something natural caused this step-change. La Nina isn’t a cause. It is a result.
What caused the step change?
Natural variation combined with reduction of aerosols.
What caused the LIA?
“The Long Island Association (LIA) has been active for nearly a century we were founded in 1926 and our work has resulted in positive change.”
RLH,
> What caused the LIA?
ICMYI, in continuation of our discussion of proxy reconstructions, some candidates for the severity of the LIA and its causes. Nothing terribly conclusive.
https://www.drroyspencer.com/2022/04/explaining-mauna-loa-co2-increases-with-anthropogenic-and-natural-influences/#comment-1267503
Mann 2008 does not show much.
https://imgur.com/a/V1AurO7
Is the Long Island Association quoted much in climate?
If you run a lot of paleo series together that do not agree one with another then you get the flat portion of Mann 2009, aka the Hockey stick.
Moberg 2005
https://imgur.com/a/EAAS5pl
Mette
https://imgur.com/a/nvgPVa1
Mann 2003
https://imgur.com/a/WSVvh6f
Loehle
https://imgur.com/a/XBPi8lg
Darrigo
https://imgur.com/a/Jcg8ksl
The global reconstructions that go past 1960 all tell the same general story. Warmer now, cooler before. The only difference regarding that generality is the level of uncertainty.
The proxy series shown above (and there are others) do not show such simple conclusions.
I hit the motherlode of millennial-scale temperature recons, 92 separate reconstructions (some papers give multiple timeseries). Data goes back to 2066 BCE but prior to 1 CE the quality doesn’t look so good, so those years aren’t included in the plot.
The data aren’t anomalized to the same baseline (some give absolute temperature, some give anomalies). It turns out that all timeseries have data over 1800 to 1950 so that’s what I used. Plot shows the ensemble mean and 1-sigma standard deviation.
The handle of the hockey stick is even flatter than Mann 2009b.
Plot: https://imgur.com/gallery/mCwj2GW
Data: https://www.ncei.noaa.gov/pub/data/paleo/reconstructions/pcn/pcn-v100.txt
rlh…”What caused the LIA?”
***
Our galaxy went through a worm hole. There’s worm dust in there, it blocked the Sun.
RLH,
Can you name which, if any of the reconstructions, do NOT show temps a couple of decades past 1960 being warmer than temps prior? I’d like to check the source/s.
Barry:
https://climatedatablog.files.wordpress.com/2022/05/shen.jpeg
Brandon: See Shen above. Where do your proxies match that series?
Plots: https://imgur.com/gallery/ZNSchmo
Data: https://www.ncei.noaa.gov/pub/data/paleo/reconstructions/pcn/pcn-v100.txt
barry,
It turns out that quite a few proxy series show declining temperatures after 1960, I was able to find 15 by manual inspection in the cited database. A lot of this is due to the fact that the instrumental record shows declining temperatures until the 70s-80s, and it’s not until the early 90s that no year went below the hot 40s.
As shown in the following plots, the 15 cool-running proxy studies are decidedly declining after 1960 in the mean. The other 28 studies in the database with records in the relevant period track nicely with the instrumental record, on average showing unabated warming after 1970.
Two studies were excluded for not having values over the period in question. Also note the database contains multiple reconstructions in any given study (there are 92 data series total). So as to not unduly weight studies with multiple recons, I took the average of each study first before combining the final ensemble, resulting in a total of 45 data series.
Richard,
> See Shen above. Where do your proxies match that series?
Added to my master chart:
https://imgur.com/gallery/jTles4j
Richard,
Also re: Shen; PDO is by definition a non-trending timeseries, so answering barry’s question with it is more than a bit disingenuous.
RLH,
https://climatedatablog.files.wordpress.com/2022/05/shen.jpeg
From Shen 2000?
https://www.ldeo.columbia.edu/~peter/Resources/Seminar/readings/Huang_boreholeTemp_Nature'00.pdf
I’ll quote it:
“Of the 616 borehole temperature profiles we analysed, 479 show a net warming over the past five centuries. The average of the cumulative temperature change over the five-century interval is a warming of about 1.0 K (Fig. 2). In the twentieth century alone, the average surface temperature of the continents has increased by about 0.5 K, and the twentieth century has been the warmest century of the past five. This ensemble average is consistent with that derived earlier from a smaller and geographically more restricted data set of 358 boreholes from eastern North America, central Europe, southern Africa, and Australia…”
This study corroborates the many others showing that old hockey stick shape. You can check the graphs in the paper linked.
Can you name which, if any of the reconstructions, do NOT show temps a couple of decades past 1960 being warmer than temps prior? I’d like to check the source/s.
Brandon,
It turns out that quite a few proxy series show declining temperatures after 1960, I was able to find 15 by manual inspection in the cited database. A lot of this is due to the fact that the instrumental record shows declining temperatures until the 70s-80s, and its not until the early 90s that no year went below the hot 40s.
I wasn’t clear. I know that some global temp reconstructions roughly match the 20th century instrumental record with the flat or slightly declining temps from 1940 to 1970s.
I was thinking in context of the multi-century view. Far as I’m aware pretty much all global and NH reconstructions confirm the last 20th century is the warmest period in the last 500/1000/2000 years.
This is a good page for a bunch of those studies (open hand – I’ve helped add some of the studies to the list).
https://agwobserver.wordpress.com/2009/11/17/papers-on-reconstructions-of-modern-temperatures/
There’s even a section on borehole reconstructions, including the one from Shen (and Huang and Pollack) above.
* the last 20th century
the LATE 20th century…
barry,
You were clear enough, it’s Richard not being specific about why the proxy record doesn’t lead to the same conclusion. I thought he was talking about the divergence issue for treering proxies since that’s the usual dead horse.
I’m not aware of any 2 kyr reconstruction which shows temperatures higher than today and absolutely agree with you on that.
Thanks for that blog post. I’m at the point in my data project where it becomes necessary to dig into some of these papers and that list helps decide whether I should keep or lose them.
This one particularly caught my eye:
This is the exact sort of analysis I’m trying to get Richard to do with the data I’m providing and/or that he already has.
Brandon,
The website I linked to is a great resource, if you’re not familiar with it.
https://agwobserver.wordpress.com/index/
It’s the list of AGW and associated categories under which are filed papers pertaining. Scroll down just a little you’ll see the section titled Temperature Indicators.
The various subsections are on temperature reconstructions arranged by proxy type: so there’s individual section on temp reconstructions by leaf stomata, boreholes, dendro etc. If you include various proxy types in your interest, you should check those papers out.
You can also refer relevant papers that aren’t already listed, in the comments section beneath each sub-topic. Ari should come by eventually and add them to the list.
What causes variation (waves) in nature? God.
How does God modulate the variation (waves) in nature?
Long term natural variability related to ocean oscillations caused the step changes, They can just as easily step down the way, we have not been around long enough to observe that.
What causes ocean oscillations?
stephen p anderson asks “What causes ocean oscillations?”
The data I linked to just below seems to indicate the ocean changes may be related to cloud changes. Of course, it could be the other way around.
https://www.drroyspencer.com/2022/05/uah-global-temperature-update-for-april-2022-0-26-deg-c/#comment-1269564
If it is the former, then your next question is likely, what causes the cloud changes? Changes in atmospheric circulations driven by ocean currents could be a possibility. Could be the sun.
What I wonder is since these changes may very well constitute a large portion of the climate changes we have seen, why isn’t this the most dominate area of climate research?
Maybe because it clouds the establishment’s case for AGW?
bdgwx asks “What caused the step change?”
A reduction in reflected solar energy.
https://www.mdpi.com/atmosphere/atmosphere-12-01297/article_deploy/html/images/atmosphere-12-01297-g003-550.jpg
Which just happen to correlate to the PDO going positive.
2013-10 -1.1277
2013-11 -0.5181
2013-12 -0.7854
2014-01 -0.0030
2014-02 0.0712
2014-03 0.8634
2014-04 0.9515
2014-05 1.7189
https://www.data.jma.go.jp/gmd/kaiyou/data/db/climate/pdo/pdo.txt
What caused the reduction in reflected solar energy?
bdgwx, please stop trolling.
The 2022 +0.26C April anomaly places it in the top 5 warmest Aprils in the satellite LT record. Is this unexpected, given that La Nina conditions have persisted since July/Aug/Sep 2021?
Depends on your viewpoint. For the sceptics this would be alarmingly high. For the consensus it would be as expected.
La Nina depresses global temperatures by about 0.3C.
In ENSO neutral conditions this month’s figure would be 0.26+0.3=0.56C.
That would not be the fifth highest April, it would be the fifth highest of all months since 1979.
If natural cycles line La Nina didn’t exist the world would be much warmer, according to you. But they do and it is not.
Three months ago, when the monthly anomaly was 0.0C I bet you that we would get a monthly value of 0.5C or larger by the end of 2022, partly because I expect us to tip over from Last Nina to El Nino at some point.
It is now April and we are at 0.26C, already halfway to my target.
So do you see next month as increasing or decreasing?
Pretty sure no model is forecasting an El Nino by year’s end.
Antonio Querty
As I said above, ENSO neutral would probably suffice.
RLH says:
May 2, 2022 at 4:32 PM
“So do you see next month as increasing or decreasing? ”
Unknown. That depends on short term variation.
An average increase of 0.03C/month would be enough to win my bet.
https://climatedatablog.files.wordpress.com/2022/04/uah_lt.jpg
says that 0.5C is unlikely.
EM, the ocean temperatures, which usually correlate well to UAH with a 5-6 month lag, are predicting lower temperatures for the next 3-4 months.
We haven’t had a full summer of La Nina conditions for awhile so it will be interesting to see where the UAH values go. I’m not sure the 5-6 month lag holds up as well in the NH summer.
Progress, RLH. Except for the ‘much’.
Now understand that ENSO is cyclic. What goes down must come up…soon enough.
https://www.cpc.ncep.noaa.gov/products/CFSv2/imagesInd3/nino34Mon.gif says at least next year.
You do know the difference between a prediction, of one model out of many, and actual data?
Predictions more than 6 months away are notoriously bad.
In any case the last two moderate La Ninas have still left us in the top 5 warmest first quarter of the year.
http://www.columbia.edu/~mhs119/Temperature/T_moreFigs/
And sooner or later, it will return to a warmer phase. And the global temps will then be, again, above the long term trend.
So will you then understand that ENSO, a short term cyclic phenomena, is not going to save us from AGW?
nail…”The 2022 +0.26C April anomaly places it in the top 5 warmest Aprils in the satellite LT record”.
***
By how much, 0.003C?
Have you compared the Aprils to the Aprils in the 1930s warm phase. Of course, UAH was not around then but you could still compare them to the surface record.
I should advise you that the 1930s temps have been fudged and obfuscated by alarmists. Maybe some of the originals are still around.
If you haven’t seen the original records yourself then why are you so sure they would show warmer temperatures?
Regards the April anomaly; at +0.26C, April 2022 is tied in 4th place with April 2020. The sixth warmest April is +0.21C in 2005. So April 2022 is +0.05C warmer than the 6th warmest April by a margin that exceeds John Christy’s estimated UAH LT error margin (+0.03C).
The top 3 warmest Aprils (1998, 2016, 2019) all occurred during El Nino conditions.
You dont get any medals for 4th place.
Bindidong,s “La Nina gone by April” forecast fail update
After Bindidong predicted La Nina gone by April , April is over and instead the La Nina dipped to the lowest point since it started, Bindidongs best Mega epic forecasting failure Yet.
https://i.postimg.cc/LsPtwpHD/1nino34.png
Eben is too much a coward to publicly admit that
– I admitted long time ago my mistake due to my trust in JMA’s ENSO predictions last year
AND, ABOVE ALL, THAT
– he was 100 % sure that UAH LT’s anomaly for this April would be way way lower than his own hope, but he will never admit that.
Eben, your are such a dumb cowardly ass.
Shaddap you clowass , you don’t get to call anybody on his montly prediction when you refuse to make one yourself.
https://coralreefwatch.noaa.gov/data/5km/v3.1/current/daily/gif/cur_coraltemp5km_ssta_large.gif
is SO warm.
See also:
https://oceanservice.noaa.gov/facts/coralwaters.jpg
Does that show sites or temperatures?
Pay no attention to Willtard’s trolling nonsense
Juxtapose the two graphs, Richard.
Willard: Why? Are you saying that the global sea surface temperatures come from just those sites? Idiot.
Why, Richard?
Because you picked a graph on Coral Reef Watch.
Compare the places where there is coral with the temperatures you pretend are SO luckwarm.
So what? Are you saying that it does not represent global sea surface temperatures?
No, dummy – I’m saying that only cranks like Eboy will pretend that your graph shows luckwarm waters.
So NOAA produces things that are not useful as they do not always show things are getting warmer.
Except that the graph indeed shows that things are getting warmer, Richard. I prefer:
https://www.cpc.ncep.noaa.gov/products/CFSv2/htmls/glbSSTe3Sea.html
And ones that aren’t.
https://www.cpc.ncep.noaa.gov/products/CFSv2/imagesInd3/nino34Mon.gif
Willard: P.S. Please note that 30N to 30S is 50% of the world’s surface.
So now Richard loves him some modulz.
Great success!
Animation go brrr –
https://psl.noaa.gov/map/clim/sst.anom.anim.html
I can do aminations too
https://coralreefwatch.noaa.gov/data/5km/v3.1/current/animation/gif/ssta_animation_30day_large.gif
Very good!
Now try to hold still:
https://www.epa.gov/sites/default/files/2021-04/sea-surface-temp_figure1_2021.png
You mean like this?
https://climatedatablog.files.wordpress.com/2022/04/pdo-1.jpeg
and
https://climatedatablog.files.wordpress.com/2022/05/shen.jpeg
No, rather like this:
https://www.epa.gov/climate-indicators/climate-change-indicators-sea-surface-temperature
RLH
Do you understand that the baseline for ENSO temperatures has been continually raised to match warming? A negative 1 ENSO anomaly in 2022 does not correspond to the same ocean temperature as a negative 1 ENSO anomaly in 1950.
The PDO (which is what ENSO is long term) has not changed.
Willard: So Global SST fell until 1910. What happened before 1880?
Why are you trying to bait me, Richard?
You already got your hands full with BG’s work.
RLH
You have just totally misrepresented the relationship between the PDO and ENSO.
The statement doesn’t even make sense.
Eben
I repeat, to get it clear: you never predicted anything.
All you did was to replicate NOAA’s ENSO forecasts.
Given the latest figures, who do you think was more accurate, NOAA or BOM?
I don’t remember asking you.
And as usual, in the context of your urging for intervention, your question is of no interest.
So you don’t want to admit that the BOM got it wrong in its assessment of the progress of La Nina.
Suddenly Bindidong doesn’t want to hear anything about it
https://www.drroyspencer.com/2021/12/uah-global-temperature-update-for-november-2021-0-08-deg-c/#comment-1098140
These are the current sea surface temperatures.
https://coralreefwatch.noaa.gov/data/5km/v3.1/current/daily/gif/cur_coraltemp5km_ssta_large.gif
Just as last year BOM got it right and NOAA got it terribly wrong.
They simply don’t have accurate WEATHER models – there is nothing else to read into it.
BOM and NOAA use different parts of the ocean to claim La Nina it seems. BOM is much more concerned with things around Aust/NZ. NOAA with that around the equator.
That climate models are inconsistent, one with another, is not a surprise to me.
You two can continue trolling me as long as you want.
What you can’t change is this:
https://i.postimg.cc/R07QLyBF/MEI-superposed-La-Ninas.png
Final point for me.
Now reduce that to 2 year (or longer) La Nina’s which is what everybody else is talking about.
Such as
https://www.climate.gov/media/14287
and
https://www.climate.gov/media/14393
But, as always, Blinny knows better than everybody else (even if he can’t understand what it is that people are talking about).
He is not the only one who doesn’t understand what you are talking about.
It is still not clear to me which side of the climate debate you are on.
On the one hand you seem to be saying temperatures are rising, and on the other hand you come up with utter nonsense.
Such as this “double-dip” La Nina being “unprecedented”, when there have in fact been seven double-dips and two triple-dips since 1950.
Or saying that the BOM is considering a different part of the ocean to NOAA when making ENSO projections. ENSO by definition occurs only in a narrow part of the tropical Pacific, and BOM refers to exactly the same ENSO regions as everyone else – 1.2, 3, 3.4 and 4.
And you feel the need to resort to childishly changing his name out of frustration at the fact that no one can understand you. Look to improving your own communication and research skills first before attacking people.
Antonin,
Richard is a cycle nut, like many other old coders before him. Pretends to be a luckwarmer, but without the usual formal chops. Likes Edmund Burke for Whig reasons.
Do NOT start him on medians, that will turn him into a Black Knight.
Is RLH the same person as “Richard”?
Yes, RLH stands for Richard Blay Linsley-Hood. The nephew of the guy who created the Class A amp.
And taught me quite about about analog filters. I learnt about DSP and digital filters all on my own much later.
“Such as this ‘double-dip’ La Nina being ‘unprecedented’, when there have in fact been seven double-dips and two triple-dips since 1950.”
I know there have been 9. See climate.gov as I reported elsewhere.
If you want to be picky it is unprecedented for this month of the year in a 2 year (or longer) La Nina.
https://imgur.com/a/or8Fmwx
AQ: You need to read things more carefully it seems.
BOM says that La Nina is declining, but the evidence says that it is not.
“”The 202122 La Nia event continues but is past its peak,” the Bureau stated”
https://www.cpc.ncep.noaa.gov/products/CFSv2/imagesInd3/nino34Mon.gif
Apparently he is a 73 year old gamer. I’ve never met a gamer with a sense of reality.
A bit older by now.
Antonin, Willard, please stop trolling.
The Monckton pause (longest = +0.26 C/decade trend) sits at 184 months starting in 2006/11.
Yikes. The system filtered out the middle portion of my post. Let’s see if rewording can get around the content filtering.
The Moncton pause (longest trend less than or equal to 0 C/decade) sits at 91 months starting in 2014/10.
The doubled warming (longest trend greater than or equal to +0.26 C/decade) is 184 starting in 2006/11.
SC25 progress update, April sunspots at 78 average
https://i.postimg.cc/66YNy7Zk/Clipboard07.jpg
Another update:
https://www.drroyspencer.com/2022/04/explaining-mauna-loa-co2-increases-with-anthropogenic-and-natural-influences/#comment-1267076
Yup. I was wrong. And your predictions for next month are?
Eboy will continue to troll Binny.
As usual Willard has nothing to say about climate matters.
As usual, Richard refuses to opine on Monckton’s “paws,” the topic of bdgwx’ comment.
The only effect of comparing the current solar cycle SC25 to its huge Solar Maximum predecessors in the XXeth century is to hide how it compares to its immediate predecessor SC24 (daily variant, the Canadians didn’t publish the monthlies for March and April yet):
https://drive.google.com/file/d/1x9jsQs8XkGkj4wT9FtrWaiy-LzIPbT3s/view
Source
ftp://ftp.seismo.nrcan.gc.ca/spaceweather/solar_flux/daily_flux_values/fluxtable.txt
As usual, Willard (and Monkton) thinks there are straight lines in nature.
The price paid for fitting noise.
And if there are longer cycles in play?
Predicting next month’s UAH LT anomaly is about predicting weather, not climate.
Longer cycles are all about climate, not weather.
barry is a Bindidong’s failed forecasting sidekick, he is next , I will make next Monday his turn
RLH
IPCC climate projections all assume that shorter term cycles are zeroed out, based on the knowledge that this will indeed happen over the longer term of their projections and that they are not predictable on these longer time scales.
You can base your arguments on mere definitions (or your versions of them) all you want, but your definitions don’t negate the longer term projections.
“IPCC climate projections all assume that shorter term cycles are zeroed out”
So how do they account for the current situation where we have a double dip La Nina? That will place an offset caused by short term fluctuations into the longer term.
So in this case at least short term becomes longer term.
Eben!
Sorry, what forecast did I make? You didn’t let me know last time I asked.
“Longer cycles are all about climate, not weather.”
Predicting next month’s UAH LT anomaly is about predicting weather, not climate.
RLH
My whole point was climate projections DO NOT account for one-off ENSO excursions. They can’t – it is not possible.
But they know that over many decades the sum total of ENSO excursions will be essentially zero.
AQ: These say there are long term fluctuations in the ENSO data
https://climatedatablog.files.wordpress.com/2022/04/pdo-1.jpeg
https://climatedatablog.files.wordpress.com/2022/05/shen.jpeg
https://climatedatablog.files.wordpress.com/2022/04/enso-3.4.jpeg
Likewise for the AMO
https://climatedatablog.files.wordpress.com/2022/04/amo.jpeg
And what do you get when you average those out over a century?
You think that a >60 years sigmoid will produce a straight line?
WTF does a sigmoid function have to do with anything here?
Are you trying to imagine some sort of cumulative distribution?
If so, why? We are AVERAGING, not summing.
A low pass filter gives a sigmoid function.
Gaussian, S-G or LOWESS. All the same thing.
Funny how your low pass filter is giving something approaching a sinusoidal function.
And a sigmoid is not a Gaussian – it is the INTEGRAL of a Gaussian.
If you see a sinusoid it is because that is what the data says is there.
Low pass filters give a -sigmoid function (gaussian in this case). If you plot that in log form (dB for instance) then it will go on to infinity instead of 0.
https://en.wikipedia.org/wiki/Sigmoid_function#/media/File:Logistic-curve.svg
https://en.wikipedia.org/wiki/Low-pass_filter#/media/File:Butterworth_response.svg
Gaussian would mean 20dB/decade on a log graph. i.e. First order Butterworth.
You have absolutely no idea what you are talking about.
Try plotting a low pass (say Butterworth) filter in linear (not log) space from ‘signal unchanged’ on the left to ‘signal completely removed’ on the right without creating an S shaped or sigmoid curve.
RLH wrote –
“Longer cycles are all about climate, not weather.
Semantics. Climate is the statistics of past weather. No predictive ability at all.
Even if one takes the longest view, that of the operation of the atmosphere since its creation (not ignoring the similarly chaotic movements of the lithosphere and aquasphere), even the statistics of the last four and a half billion years wont tell you whether it will rain tomorrow or not.
Relevance? Climate is the statistics of past weather. If you cant even predict tomorrows weather, then claiming you can predict even more distant weathers statistics in an unknowable future, makes you look delusional at best.
Guesses about the future are all we have. Sometimes we are right, sometimes wrong.
Making assumptions and hoping for the best (while preparing for the consequences if my assumptions prove to be wrong) has worked for me so far.
The future? Who knows.
The current double dip La Nina is now into unprecedented territory. Is that weather or climate?
Unprecedented-without previous existence.
It’s weather.
Unprecedented? Based on which index?
https://origin.cpc.ncep.noaa.gov/products/analysis_monitoring/ensostuff/ONI_v5.php
Double dips 1974 – 75, 2008 – 09, 2011 – 12.
You also get extended la Ninas that have lasted longer than the current double dip (eg 1998 – 2001).
Others indices determine ENSO events with different metrics, and they don’t match this one.
So when you say the double-dip is unprecedented without further information it seems like a rather forced conclusion.
Climate.gov
https://www.climate.gov/media/14287
https://www.climate.gov/media/14393
Don’t see anything unprecedented in there.
And when you add last months ENSO data?
https://imgur.com/a/wJPlC4V
Nope, still not unprecedented. You are overly excited by insignificant fluctuations.
Show more months as Bindy did.
So cimate.gov is wrong then. Blinny shows all La Nina’s. Climte.gov only shows those that are longer than 2 years.
https://imgur.com/a/or8Fmwx
“So cimate.gov is wrong then.”
No, just people saying it is ‘unprecedented’.
I don’t see anything unprecedented either. I looked at a couple of different indices and there are double dips of similar magnitude and duration, and even long la Ninas that went on longer than the period of the current double dip.
Did someone at Climate.gov actually say “unprecedented”? Couldn’t se any text like that in or around the graphics.
https://origin.cpc.ncep.noaa.gov/products/analysis_monitoring/ensostuff/ONI_v5.php
Nothing unprecedented here. There have also been lower values for la Nina in the past, as well as numerous double dips and long-duration events.
https://psl.noaa.gov/enso/mei/ (click on MEIv2 values)
Same story here for this indices.
I’m not seeing anything “unprecedented” RLH. Not even ‘rare’.
“Happened only a few times in the last 70 years.”
Would be more accurate – re double dips.
Nate makes a bold statement that the use of words like unprecedented is only allowed to be uttered by the guys on his side as he is on record to have never ever uttered such a rebuke against his team.
Very clearly right now ONI is in unprecedented territory of the ONI 72 year record keeping. No previous double dip ONI has been this low in May after the 2nd La Nina winter. But to Nate it is heresy to utter such words if you aren’t a card carrying member of the authoritarian class.
Stop trolling Bill
BTW Swenson/Mike Flynn, I forgot to congratulate you on finally turning the corner and attacking a fellow denier here.
Antonin, please stop trolling.
Literally nothing out of the ordinary is happening at all.
The current double dip La Nina is not ordinary. In fact it is unprecedented.
List of double dip La Ninas since 1950:
1954-55 & 1955-56
1970-71 & 1971-72
1983-84 & 1984-85
2007-08 & 2008-09
2010-11 & 2011-12
2016-17 & 2017-18 (though there is debate about whether the 1st one qualifies)
List of TRIPLE-dip La Ninas since 1950:
1973-74 & 1974-75 & 1975-76
1998-99 & 1999-00 & 2000-01
The strength of those in order were:
Weak-Moderate
Moderate-Weak
Weak-Weak
Strong-Weak
Strong-Moderate
Weak-Weak
Strong-Weak-Strong
Strong-Strong-Weak
And I forgot the current one:
Moderate-Moderate
The only thing unprecedented is the pair of moderates.
Climate.gov has a sequence of posts on just that.
https://www.climate.gov/media/14287
https://www.climate.gov/media/14393
Those charts show it is unprecedented.
There will be another one along soon/later this month and we will have to see what they say.
Look at the title of your link:
Evolution of ALL double-dip La Ninas.
ALL. The is one line for each double-dip La Nina.
Given that the black/purple line is sitting smack-bang in the middle of all graphs, please explain how this indicates anything “unprecedented”.
Average ONI since Jul 2021: -0.82
By comparison:
Jul 1954 – Jun 1956: -0.86
Jul 1973 – Jun 1976: -1.03 (3 years)
Jul 1998 – Jun 2000: -1.16
Jul 2010 – Jun 2012: -0.90
“please explain how this indicates anything ‘unprecedented'”
Try adding March’s data (and soon April’s) to that last chart.
https://www.cpc.ncep.noaa.gov/products/CFSv2/imagesInd3/nino34Mon.gif
Here I’ve approximated it for you
https://imgur.com/a/wJPlC4V
Yet there are still lower graphs. Do you actually understand what “unprecedented” means?
Tell me what is lower than
https://imgur.com/a/wJPlC4V
Can you seriously not see the lines below the purple line? They are right in front of your face.
Don’t tell me you are arguing based on the tiny bit of line that sticks out at the end.
The temperature effect is approximated by the area under (over) the graph.
Let me highlight the most recent data for you.
https://imgur.com/a/or8Fmwx
Unprecedented for this month of the year in a 2 year (or longer) La Nina, if you want to be picky.
A blast from Richard’s past:
https://www.drroyspencer.com/2021/06/biased-media-reporting-on-the-new-santer-et-al-study-regarding-satellite-tropospheric-temperature-trends/#comment-730590
In this case it is Unprecedented since Forever.
You are not that old, Richard.
Unprecedented since Forever = Unprecedented. Idiot.
RLH is hoping and dreaming of a new, unprecedented cooling trend. He latches onto any tiny scrap that feeds this dream.
Hahahaha – unprecedented for one month – hilarious!
So you are saying that the next few days will restore that line to above all the others?
Unprecedented means ‘not seen before’, one month or longer does not matter.
On that basis you would not be able to claim one day as the ‘hottest ever’ either.
Nate: I ama just reporting the facts. Inconvenient isn’t it?
– “We had 120 mil of rainfall on July 26. We’ve never had that much rainfall on July 26 before. Unprecedented!”
– “But the month of July has had average rainfall.”
– “July 26! Unprecedented!”
————————————————————
– “We had more cloud cover in February than any February before. Unprecedented!”
– “But cloud cover this Winter has been surpassed in 7 other Winters over the last 70 years. Looks like something that happens over Winter once every 10 years on average.”
– “February – Unprecedented! Something big is happening and you don’t want to admit it.”
————————————————————
– “We’re in a double-dip la Nina which is unprecedented!”
– “But we’ve had plenty of double-dip la Ninas, some of which have lasted longer and had lower values. We’ve even had la Ninas that lasted many months longer than the current double-dip and had lower values.”
– “But they didn’t have values this low in the last few days of February!”
————————————————————
Richard, stop being a nut.
barry, please stop trolling.
La Nina effect
https://youtu.be/iUYOJkGGFxc
Apparently you are not allowed to say that this is unusual.
Of course you are allowed to say it. And others are allowed to look at the data and say you’re crazy to say “unprecedented.”
https://www.drroyspencer.com/2022/05/uah-global-temperature-update-for-april-2022-0-26-deg-c/#comment-1274154
The first two months of this year marked the wettest for Sydney in the instrumental record. I live here. It was pretty dismal. People talked about it.
Did we say unprecedented? Nup. We’ve had wetter Summers, we’ve had wetter one-day events.
Did we connect it to climate change? Nup. We connected it to la Nina.
Does this mean this la Nina is unprecedented? Nup. The state did not achieve rainfall records – this was mostly coastal rain. The 2010-11 la Nina flooded 3/4 of Queensland, so as far as Australians are concerned, that was the la Nina with biggest impact to our country in recent times.
To be sure the rain was a bastard, caused flooding, ruined many roads. But it wasn’t hyped.
https://www.climate.gov/media/14522
barry, please stop trolling.
The T = ( J /σ )∕ ⁴ is a mistake !
Stefan-Boltzmann emission law doesnt work vice-versa !
The old convincement that the Stefan-Boltzmann emission law works vice-versa is based on assumption, that EM energy obeys the 1st Law of Thermodynamics (1LOT). That assumption was never verified, it was never been confirmed by experiment.
Lets see:
The Stefan-Boltzmann emission law states:
J = σ*Τ⁴ (W/m) EM energy flux (1)
The mathematical ability to obtain T, for a given J led to the misfortunate believe that the Stefan-Boltzmann emission law formula can be used vise-versa:
T = ( J /σ ) ∕ ⁴ (K) (2) as the surface (vise-versa) radiative emission temperature definition.
But the
T = ( J /σ ) ∕ ⁴ (K) (2) as the irradiated surface (vise-versa) radiative emission temperature definition is utterly unacceptable, because it has not a physical analogue in the real world.
That is why we should consider planet effective temperature
Te = [ (1-a) S /4σ ]∕ ⁴ (K)
as a mathematical abstraction, which doesn’t describe the real world processes.
https://www.cristos-vournas.com
You’re right, Christos. The relationship between EM intensity and temperature was derived from an experiment by Tyndall in which he heated a platinum filament electrically till it glowed. Based on the colours given off Stefan determined a relationship between EM intensity and temperature.
There is a good deal of controversy over Stefan’s relationship. It applies under certain conditions but the idea that any EM colour is equivalent to a certain temperature holds no water.
We can measure the temperature of a body using a thermometer and that tells us something about the state of the atoms in the body…their state of agitation, or relative heat level. There is no way to measure electromagnetic energy directly, we must first convert it to another form, usually heat, then measure the amount of heat produced.
That is EM is always expressed in terms of another form of energy. The 1st law does not apply to EM since it is neither heat nor work.
Using semiconductors, we can indicate the effect of the EM on the electrons in the semiconductor but only at certain frequencies, to which the semiconductor material responds.
Anyone who reverses the equation, must first specify the conversion form for converting EM to heat or electrical current. Furthermore, J = sigma.T^4 applies only in the range of temperatures from about 700C to 1500C related to the properties of the platinum filament.
If you try it with a tungsten filament, it won’t work in the same temperature range. There is a chart at the following link that shows an incandescent lamp’s colour spectrum in the range of 2700K – 3300K. That means the relationship may be T^4 but as you look at the colour temperatures of the other phenomena in the tabl it makes little sense.
https://www.prismtechgraphics.com/blog/science-of-colour-light/
For example, a blue sky indicates a colour temperature of 15,000K – 27,000K and we know the sky is not that hot.
The dumb part is that the colour is compared to an idealized blackbody that does not exist. If it did, the BB would be extremely hot but as we can see from the table, the colour blue from the sky, which is EM, has no relationship to temperature.
As far as climate theory is concerned, radiation from bodies like ice should be disregarded. In my opinion, so should radiation from the Earth’s surface. Its relationship to temperature is simply not there. Totally contrived.
Thank you, Gordon.
https://www.cristos-vournas.com
“For example, a blue sky indicates a colour temperature of 15,000K – 27,000K and we know the sky is not that hot.”
Gordon, our eyes see blue sky because of the refraction/reflection properties of the molecules in the sky. The S/B equation refers to emission. The sky does NOT emit as per S/B. The “blue photons” come from Sun.
In your opinion? The same opinion which stated that the moon’s phases are caused by occlusion by the earth?
WTH is ∕ ⁴ ??
Do you believe that the inverse of raising to the power of 4 is a “division by the 4th power”?
It is ^ (1/4)
Antonin, it is ^(1/4). I do not know why the (1) doesn’t show sometimes?
Thank you.
https://www.cristos-vournas.com
The T = ( J /σ )∕ ⁴ is a mistake !
Stefan-Boltzmann emission law doesnt work vice-versa !
The old convincement that the Stefan-Boltzmann emission law works vice-versa is based on assumption, that EM energy obeys the 1st Law of Thermodynamics (1LOT). That assumption was never verified, it was never been confirmed by experiment.
Lets see:
The Stefan-Boltzmann emission law states:
J = σ*Τ⁴ (W/m) EM energy flux (1)
The mathematical ability to obtain T, for a given J led to the misfortunate believe that the Stefan-Boltzmann emission law formula can be used vise-versa:
T = ( J /σ ) ∕ ⁴ (K) (2) as the surface (vise-versa) radiative emission temperature definition.
But the
T = ( J /σ ) ∕ ⁴ (K) (2) as the irradiated surface (vise-versa) radiative emission temperature definition is utterly unacceptable, because it has not a physical analogue in the real world.
That is why we should consider planet effective temperature
Te = [ (1-a) S /4σ ]∕ ⁴ (K)
as a mathematical abstraction, which doesn’t describe the real world processes.
https://www.cristos-vournas.com
Christos Vournas
Have you ever used an IR thermometer to get a temperature reading at a distance? The instrument receives IR to a sensor. Based upon the temperature change of the sensor based upon a reference a calculation is made using the Stefan-Boltzmann relationship of radiant energy to temperature (taking into account emissivity). You can experimentally verify that the Stefan-Boltzmann Law works in reverse by comparing the temperture reading you get on the IR thermometer with using a conventional thermometer on the same object to see how close they match (try it with water that has a reasonable high emissivity). That a glass of water an get a reading with an IR thermometer then use a conventional thermometer on the water and see how close they match.
I am astounded you come here claiming the 1st Law does not apply to EM and has not been experimentally verified. You are drifting deep into “Crackpot” territory. Your ideas are not very good and now you are getting much worse. Get off your ego trip and start reading real physics textbooks and science magazines. You are drifting into the Gary Novak zone of stupid ideas. Please end the drift.
CV, your problem with equations may be you’re trying to copy/paste. Certain symbols and punctuation do not copy/paste well, on this platform. If your equations get botched, don’t used copy/paste.
Many of the commenters here do not understand science. So if your equations are wrong, or you don’t make yourself clear, the braindead cult idiots find it easier to criticize you.
CV: If you want ‘exotic’ symbols try https://mothereff.in/html-entities before you paste. That will sort out most of your problems I suspect.
“that EM energy obeys the 1st Law of Thermodynamics (1LOT). That assumption was never verified, it was never been confirmed by experiment.”
Darn. Now 1LOT has been demoted from a Law of Physics to just a suggestion?
I guess perpetual motion machines are back on the table!
Someone needs to edit the Wiki
https://en.wikipedia.org/wiki/First_law_of_thermodynamics
RLH
Why? What is wrong with it?
Nothing. If 1LOT is correct. See above.
Which of course it is … in an isolated system.
I think it is fair to say that the Earth is an isolated system in this regard.
Oh really?? I think the sun will disagree with you. As will all the energy which escapes into space.
I rather suspect that energy in = energy out.
The earth is a closed system, not an isolated system.
https://psiberg.com/open-closed-and-isolated-systems-with-examples/
Closed systems allow energy to transfer across their boundaries, but not matter. Isolated systems permit neither.
Equilibrium has nothing to do with these definitions, which are purely about the mechanics.
Test
The planet effective temperature Te formula:
Te = [ (1-a) S /4σ ] / ⁴
Which results for Earth Te =255K
cannot be compared with the planet measured average surface temperature Tmean = 288K.
https://www.cristos-vournas.com
rlh…”If you run a lot of paleo series together that do not agree one with another then you get the flat portion of Mann 2009, aka the Hockey stick”.
***
According to McIntyre and McKitrick, if you run noise through the Mann et al hockey stick algorithm, you get the same hockey stick shape.
A paper which has been debunked by statisticians as showing an utter misunderstanding of PCA/
Correct!
McKitrick’s first ‘critique’ of MBH98 even was based on his assumption that the use of PCA would be incorrect.
That ‘critique’ disappeared later and was replaced by poor dendrochronology aspects.
Today, McKitrick has no longer anything to say against PCA – especially when used by e.g. Zharkova to ‘demonstrate’ the imminence of a GSM.
If you want what Ross has to say recently, try https://www.rossmckitrick.com/
Nothing of what he (visibly) wrote on his web site did change anything to what I wrote above.
Look at what McKitrick wrongly wrote against MBH98 concerning their allegedly incorrect use of the primary component analysis.
PCA uses SD and there is a lot of doubt if SD is useful on Bimodal data where 1.5*SD covers 100% of the data.
ant…”A paper which has been debunked by statisticians as showing an utter misunderstanding of PCA”
***
You are misinformed. The US government appointed the National Academy of Science and a statistics expert, Wegman, to investigate the hockey stick. Wegman agreed completely with the assessment of MacIntyre and McKitrick and went on to charge Working Group 9 of the IPCC review of nepotism.
They (WG9) were asked by IPCC poobah Susan Solomon, to investigate the hockey stick and they ignored her. Turns out they were all buddies of Mann and as Wegman claimed, they cited only their friends as sources of information.
One paper that presumed to support Mann et al, by Amman and Wahl, was a good joke. They were both related to Mann, Wahl being a geology student and Amman in divinity studies.
From Wegman…
“Where we have commonality, I believe our report and the [NAS] panel essentially agree. We believe that our discussion together with the discussion from the NRC report should take the centering issue off the table. [Manns] decentred methodology is simply incorrect mathematics . I am baffled by the claim that the incorrect method doesnt matter because the answer is correct anyway.
Method Wrong + Answer Correct = Bad Science”.
Worth repeating…
Method Wrong + Answer Correct = Bad Science.
https://climateaudit.org/2007/11/06/the-wegman-and-north-reports-for-newbies/
> Method Wrong + Answer Correct = Bad Science
C’mon, Gordo:
https://moyhu.blogspot.com/2011/06/effect-of-selection-in-wegman-report.html
Contrarians seldom look under the hood.
I have shown the disagreement in paleo series recently and on my website if you look. The facts are if you average them together, because they do not have any periods that show the same thing, the more you add, the more you get to a straight line.
Ammann
https://climatedatablog.files.wordpress.com/2022/05/ammann.jpeg
Biondi
https://climatedatablog.files.wordpress.com/2022/05/biondi.jpeg
Darrio 2001
https://climatedatablog.files.wordpress.com/2022/05/darrigo2001.jpeg
Darrio 2006
https://climatedatablog.files.wordpress.com/2022/05/darrigo2006.jpeg
Loehle
https://climatedatablog.files.wordpress.com/2022/05/loehle.jpeg
McDonald 2005
https://climatedatablog.files.wordpress.com/2022/05/macdonald2005.jpeg
Mann 2003
https://climatedatablog.files.wordpress.com/2022/05/mann-2003.jpeg
Mann 2008
https://climatedatablog.files.wordpress.com/2022/05/mann2008.jpeg
> if you average them together, because they do not have any periods that show the same thing, the more you add, the more you get to a straight line
Well, no, Richard; 45 proxy reconstructions (naively) aggregated together say that’s not the case at all:
https://imgur.com/GxxIRAQ
Now try that with the ones I showcased without grafting the instrument record on the end.
https://climateaudit.org/2021/11/02/the-decline-and-the-stick/
The Decline, the Stick and The Trick
This has nothing to do with what BG shows you, dummy:
“[The Auditor] provides fodder for skeptics.”
https://tinyurl.com/2p874yzb
Willard: Found any common characteristics in the proxy data I showed?
And how does the Auditor know this?
“Or that we know that it was warmer in the medieval period than at present.”
Even Loehle’s paper doesn’t support that contention.
Now in 2021 someone can get away with claiming the Medieval period was warmer than 2021, when all the reconstructions, even the skeptical ones don’t support that.
Greenland “The Medieval Warm Period was approximately 1 C warmer than present”
“In 1965 British climatologist Hubert Horace Lamb examined historical records of harvests and precipitation, along with early ice-core and tree-ring data, and concluded that the MWP was probably 12 C (1.83.6 F) warmer than early 20th-century conditions in Europe.”
In 1965 British climatologist Hubert Horace Lamb examined historical records of harvests and precipitation, along with early ice-core and tree-ring data, and concluded that the MWP was probably 1 to 2C (1.8 to 3.6F) warmer than early 20th-century conditions in Europe.
I referenced Loehle, which is a global reconstruction.
The Medieval Warm period may have been warmer then 1960 as Lamb argued in Europe, but we are discussing the globe.
Which is not just Greenland and Europe.
And when you say today in 2021, that’s what you mean, not today meaning 1960 when Lamb said it.
Speaking of Hubert’s recon:
Do you know how said that, Richard?
You have two choices.
Both are good.
bobdroege, Willard, please stop trolling.
Mette
https://climatedatablog.files.wordpress.com/2022/05/mette.jpeg
Moberg 2005
https://climatedatablog.files.wordpress.com/2022/05/moberg-2005.jpeg
Shen PDO
https://climatedatablog.files.wordpress.com/2022/05/shen.jpeg
Winkler
https://climatedatablog.files.wordpress.com/2022/05/winkler.jpeg
Sorry. Wrong place. Add to the above.
Blinny,
What can you tell us about Biden’s new Ministry of Truth?
He is not an uneducated Yank.
Most of the world isn’t.
nate…”[anon]that EM energy obeys the 1st Law of Thermodynamics (1LOT). That assumption was never verified, it was never been confirmed by experiment.
[Nate]Darn. Now 1LOT has been demoted from a Law of Physics to just a suggestion?
***
The 1st law is about heat and work, not generic energy. How it ever became related to conservation of all energy is a mystery.
Clausius was involved with the creation of the 1st law, he coined the term U for internal energy.
Classically, if we have an equation in the form x + y = U, then all terms must match. In the 1st law, we have heat measured in calories, work measured in watts, therefore U should match. It does not, and Clausius explained why back in the 19th century.
Heat and work are classed as being equivalent, not equal. Clausius pointed that out in great detail and made the point clear. It had only been a couple of decades before that the scientist Joule found the equivalence of heat and work. That’s why the 1st law can be expressed using watts to represent heat.
In his explanation of internal energy, Clausius explained that it has a heat component and a work component. The work component is represented by the vibration of atoms in a solid and the heat component supplies the energy to make the atoms vibrate. The degree of vibration is directly proportional to the heat content in the solid.
That’s what the 1st law describes, the relation of external heat and work to internal heat and work. It has nothing to do with electromagnetic energy, or any other kind of energy.
Thank you, Norman, for your respond.
“…by comparing the temperature reading you get on the IR thermometer with using a conventional thermometer on the same object to see how close they match…”
You describe the IR thermometer calibration process…
What IR thermometer does is to measure surface temperature depending on the surface’s IR radiation intensity…
Well, you do not use the Stefan-Boltzmann emission law in reverse here…
The Stefan-Boltzmann emission law states:
J = σ*Τ⁴ (W/m) EM energy flux (1)
Norman, in your example you refer to the by surface the IR EM energy emission intensity.
The reversed Stefan-Boltzmann law is about the incident on the surface EM flux’s J ability to warm the surface in the reversed way.
Thank you, Norman, for helping to clear it out.
https://www.cristos-vournas.com
CV, flux is W/m^2, not W/m. I wouldn’t have mentioned it, because I make typos as often as anyone, but you’ve done it twice. Again, be more careful as you’re just drawing flak from the braindead cult idiots who want to discredit anything contrary to their beliefs.
Also, the S/B equation can clearly be used “vice-versa”. One just have to understand how it applies.
The S/B equation, J = σT^4, applies at the surface of a body with emissivity = 1.
Knowing T, we can calculate J. Or, knowing J, we can calculate T. The equation works either way, at the emitting surface. What you are referring to is the “absorbing” surface. And, you’re correct, the equation is no longer valid, as incoming flux is not always absorbed and emitted.
Thank you, Clint.
La Nina effect
https://youtu.be/clN_BFLbJ5E
Don’t keep finding stories that say the world is not getting warmer.
Same bat channel, a few hours earlier:
https://www.youtube.com/watch?v=vTxuJbdb8Vo
And the effects of La Nina in the USA are what?
Same channel, two days ago:
California drought brings water restrictions to millions
https://www.youtube.com/watch?v=1lshNdTR51s
H/T Eboy.
So La Nina does what you observe to the USA. Quelle surprise.
Thanks for video. Good one.
The Supreme Court leak on abortion, and how to spot a hoax. Lots more.
https://www.youtube.com/watch?v=DIWbkFc90HQ
https://www.theguardian.com/us-news/live/2022/may/03/roe-v-wade-us-supreme-court-preliminary-vote-overturns-abortion-ruling-leaked-draft-livev-updates
“Chief Justice John Roberts said moments ago that the supreme courts marshal will investigate the source of the leak of the draft opinion on abortion, which is genuine”
For those who prefer to read texts:
https://www.politico.com/news/2022/05/02/supreme-court-abortion-draft-opinion-00029473
Blinny,
Do you think it was a heroic leftist or far-right conservative who leaked the document?
It’s confidential.Whether left or right or in middle, it was criminal. But someone stupid, which is quite possible whatever political view.
But not criminal to publish.
The document does not appear newsworthy, how it was leaked and who is
it was is newsworthy.
Protecting sources, this could be valid reason for public not knowing- compelling press to give up source, doesn’t seem to be an option.
Rather it needs to be investigated internally. Or the mistake is not with the press, rather it’s system that keeps stuff confidential, which need to be fixed, not the press for reporting it. Unless press engaged in illegal activity to get it. Or how was it leaked, is a question- justice system, hacked?? Someone being careless, or whatever.
I don’t know if leaking that document was criminal, only fireable. If they lie to FBI investigators that would be criminal. If they lawyer up, you’ve found the guilty party.
“I dont know if leaking that document was criminal, only fireable.”
I think if leaked a movie, it would be theft.
It’s going to cost tax dollars, investigating it.
So, stealing from me.
It’s criminal, whether one could prosecute it, is different issue.
“Do you think it was a heroic leftist or far-right conservative who leaked the document?”
I think that this is the question that the Republican party wants everyone to dwell on.
Presumably very few of them have anything to say about the cataclysmic upheaval to privacy and the impact on women and families across the US being touted in this leaked document. Or they just don’t want people to focus on these issues.
This proposal opens the way for states to ban abortions for teenage girls who are raped. 22 states already have abortion bans that would become law if R v Wade is overturned – and these laws have no exemption for rape victims.
You can bet your bottom dollar that any Republican senator with a 14 year-old who was made pregnant would pay to send their daughter to a state where abortion is legal. Not so lucky for the poorest, who are most affected by this proposition.
If this actually happens, and it looks like it will, it’s a vile regression towards the subjugation of women, where they will be told what to do with their bodies by the state.
If men were under threat of being told that they must carry a child inside them for 9 months with no choice in the matter, there would never have been a need for R v Wade and this disgusting state of affairs.
The Republican party of the US once had something to be proud of. It has become a turgid cesspool of BS, power hunger and populism with no ethical spine whatsoever, and is a cancer on the country.
gb…The Supreme Court leak on abortion, and how to spot a hoax”.
***
It became apparent SCOTUS was politically-biased back when Scalia sided with Bush over Gore (the Florida chads). At the time, I was peed-off but having learned more about what a horse’s ass Gore turned out to be, I realize Scalia probably saw all that long before we did, and did us a favour.
I cannot fathom how I managed to dupe myself into thinking the Democrats were a good party.
I tend to think Supreme Court is pretty good, comparatively.
In terms comparing legislative or executive.
But whole Federal and State justice system, sucks as bad of rest of the government- but courts usually suck. And I am not very interested in any effort to fix it. It’s hopeless- and it follows, rather than leads {as it should]. Or any change should with rest of government.
It seems supreme courts in any country do, ok. Or tend to better than rest of the country.
Florida Supreme Court should never have gotten involved. According to the Constitution, the only one who could have corrected or changed the outcome was the Florida State Legislature. And they had to do it by a specific date.
Vail Mountain completes longest season on record with snow to spare
https://www.vaildaily.com/news/vail-mountain-completes-longest-season-on-record-with-snow-to-spare/
Linked from: https://instapundit.com/
They stole Bindidong’s snow
No they didn’t, it’s visible here, at least for those having a brain
https://i.postimg.cc/28VnP1pP/Rutgers-Snow-Cover-NH-anoms-1979-2022.png
and thus are able to see that the NH snow cover is this year higher than usual (but not in most parts of the Alps: for that I unfortunately have no data available, he he).
La Nina is not an alarmist.
NASA says,
More than 90 percent of the warming that has happened on Earth over the past 50 years has occurred in the ocean.
How much more?
Lots.
CLIMATEGATE
Untangling Myth and Reality Ten Years Later
https://www.rossmckitrick.com/uploads/4/8/0/8/4808045/climategate.10yearsafter.pdf
“Myth #1: The Climategate scandal arose because ‘cherrypicked’ emails were taken ‘out of context’.
Myth #2: The Climategate correspondents were ‘exonerated’ following ‘thorough’ and impartial investigations.
Myth #3: Scientific studies subsequent to Climategate have ‘confirmed’ and ‘verified’ the original Mann hockey stick.
These are only the major myths from a veritable tsunami of disinformation from the academic community. The myths are untrue and, in this article, we will explain why.”
–George Monbiot as follows:
Pretending that this isn’t a real crisis isn’t going to make it go away. Nor is an attempt
to justify the emails with technicalities. We’ll be able to get past this only by grasping
reality, apologising where appropriate and demonstrating that it cannot happen again–
George sure got that wrong, pretending was the pathway- due to delusion and the existing news model.
I keep on wondering when delusion will slow down- I am almost as silly as George.
McKitrick’s work is always worth the read.
Like you would have a clue about PCA.
ant…”Like you would have a clue about PCA”.
***
Don’t need to know anything about it, my good buddies McIntyre and McKitrick have already proved Mann’s hockey stick was bs. In fact, the IPCC agreed, they reworked the original to show proxies from 1850 onward and re-instituted the Medieval Warm Period and the Little Ice Age. They added so many error bars to MBH98 that the graph is now called the spaghetti curve.
M&M demonstrated that adding noise to the MBH algorithm produced a hockey stick shape. I don’t know if Mann was even a good geologist.
Their who paper was based on a PCA analysis. If you don’t understand PCA then you don’t have the ability to analyse their paper for correctness.
“whole”
> Myth #3: Scientific studies subsequent to Climategate have confirmed and verified the original Mann hockey stick.
Perhaps the reason averaging together 36 reconstructions published after 1998 (excluding those by Mann himself) looks like the original Hokey Schtick is that MBH knew what the eff they were doing, Richard.
But as long as Loehle 2008 fondly reminds contrarians of Lamb 1960(ish), they are sure to adore it.
https://imgur.com/gallery/C4PKEH5
Perhaps merging the instrument record with proxy records is just plain wrong.
> Perhaps merging the instrument record with proxy records is just plain wrong.
ButSplicing is weak sauce, Richard. Especially given that that proxies and instruments overlap by necessity for calibration purposes, and that the data file shows the proxy and instrumental series separately since at least January 1999:
https://imgur.com/gallery/9aZWCed
At least two papers, Jacoby 1995 (not shown) and Briffa 1998 (published just before MBH98) both address, and show, the so-called “divergence problem” in a limited set of tree ring proxies which fail to track the warming trend in the instrumental record after 1961:
https://imgur.com/gallery/qWehSvw
The issue was also fully disclosed in both the 2001 and 2007 IPCC assessment reports.
c.f. the Auditor’s red noise trick in the data he sent to Wegman which Willard mentioned elsewhere.
The proxy records produce a flat line. The instrument record does not.
> The proxy records produce a flat line.
Most don’t, Richard. Try harder.
On their own they have wriggles which don’t correspond one with another. Average them all together and they produce a straight line.
Or the flat part of a hockey stick.
The blue curve is how Richard wants to see the world. The orange and magenta curves are how the world actually works:
https://i.imgur.com/oTILfim.png
The ensemble is composed of mette2021, loehle2008, CentralEngland, hantemirov2002. I selected these for the same reason luckwarmers like them; they all show huge temperature swings relative to how mean global temperature actually behaves.
All but loehle2008 swing so wildly because they are local, not global in scope. Mette, Barents Sea SST. Hantemirov, Yamal Peninsula (oh the irony). Central England derives from a localized ensemble of thermometer readings dating back to 1660 CE.
Loehle is composed of a couple handfuls of globally distributed proxies
cherryhand-picked by the Auditor, and oddly enough the result shows relatively higher centennial variability than virtually every other global or hemispheric reconstruction I can lay my grubby paws on.The snake oil being sold here is that if temperatures varied so wildly in the past sans human influence, it’s probably skyrocketing today due to the very same epicycles.
See also: https://climateball.wordpress.com/but-this-odd-place/
Brandon: So you claim that averaging proxies together does not produce a flat line, and then you show a hockey stick with a flat line.
Not big on irony are you.
Had5
https://imgur.com/a/92ods8T
And did you notice the behavior of the last 7 years is simply a continuation of the previous 50.
An upward quasi-linear trend with noise.
So did you also notice that there have been 2 peaks and 2 troughs in that data? Why would you assume that this pattern will not continue into the future?
Does CO2 remove all natural fluctuations?
Your definition of a flat line is nearly as curious as that of unprecedented double-dip La Ninas, Richard.
https://imgur.com/gallery/NrqDECN
The centennial-scale variability is similar over the entire Loehle 2008 record. The millennial-scale trends don’t agree so well … the ensemble *is* much “flatter” on longer timescales. That ought to tell you something.
The vast majority of proxy records reproduce 19th/20th century warming with high fidelity contrary to contrarian insistence that hidden declines dominate climate proxies.
Decadal and centennial scale variability between proxies and thermometers largely agree not only over their period of overlap but extending back in time. That also ought to tell you something.
> Why would you assume that this pattern will not continue into the future?
I can think of reasons why it wouldn’t, but that’s different from assuming it won’t. That said, to assume it will continue in the future would require identifying a driver with the periodicity you’re looking for. A good start would be finding the same cycle in all the proxy data you have stashed on your computer. I thought you were working on that.
> Does CO2 remove all natural fluctuations?
No, Richard. A thousand times no.
“So did you also notice that there have been 2 peaks and 2 troughs in that data? Why would you assume that this pattern will not continue into the future?”
So we are no longer interested in the last 7 y? Good.
I see a peak and two troughs, which are separated by ~ 60 y. The last trough was 1975.
The first trough seems associated with volcanoes. The second trough may be largely explained by mid-late 20th century peak in anthro aerosol pollution.
So no, I would not expect to see this pattern to continue, given the erratic nature of volcanic activity and the decrease in anthro pollution.
If the pattern was continuing into the future, we should have seen a peak in 1975 + 30 y = 2005, and since then we should have been headed downward to the next trough.
That does not appear to be happening.
Brandon: https://www.climate.gov/media/14522
“CLIMATEGATE
Untangling Myth and Reality Ten Years Later”
Stop getting your disinformation from denialist, blogs, RLH.
Stop thinking that the IPCC is always correct regardless of the facts.
This has nothing to do with the facts the IPCC deals with, dummy.
The IPCC still believes that the hockey stick is correct, it isn’t.
Which hockey stick, Richard, and what does it have to do with Ross’ crap?
Are you saying that the IPCC does not believe in the hockey stick?
I’m saying you can’t even follow your own squirrels, dummy.
And I say you are an idiot.
”
hockey stick is correct, it isnt.”
Evidence? Not blog posts, please.
In science, when a discovery has been reproduced, as the main features of the Hockey Stick has, many times, then it is likely correct.
Nate: So you accept that merging together of many proxy series produces the shaft of a hockey stick do you?
I accept that local proxies need to summed correctly to create a global reconstruction, which is what seems to be happening here.
Again, you use ‘hockey stick’ as if it is a dirty word– following the very much debunked claims of climate denial blogosphere.
But where is your evidence that it isnt an apt description of the many reconstructions that we now have?
None of the long term data measurements/indexes show the same flat aspects that the ‘hockey stick’ does. They all oscillate.
e.g.
https://climatedatablog.files.wordpress.com/2022/04/pdo-1.jpeg
https://climatedatablog.files.wordpress.com/2022/04/amo.jpeg
Not global. The rising part of stick removed!
Have to do better than that!
About time you showed your hand, Richard.
All the research in the world to look at and emails.
Myth 3 is incorrect.
Multiple millennial reconstructions of Northern Hemispheric and global temperature have corroborated MBH99 general conclusions that the late 20th century was warmer than any other period prior.
Some of the emails were certainly misunderstood or deliberately twisted by people with axes to grind. And while the vast majority showed ordinary comms and a desire to get to the truth of things, some showed the writers’ dismissiveness of opposing views and angry dsire to keep those views supressed – which never actually happened.
M&M views got into the IPCC, papers weren’t prevented from being published etc.
barry, please stop trolling.
“There is one major feature of Nerems Figure 4 that is not mentioned in the caption or the text of the paper. It is the most prominent feature of the graph and yet Nerem is silent on what it might be or what it means. He is even silent after I wrote him by email and politely asked about it. Can you pick it out?”
https://wattsupwiththat.com/2022/05/03/sea-level-rise-and-fall-slowing-down-to-speed-up/
I didn’t. I thought it would have been the rate of 1940 to 1960 rise in sea level.
Gbaikie
” The global tide gauge record is quantitatively problematic, but individual records can be shown as qualitative evidence for a lack of sea level rise acceleration. ”
This is the umpteenth time people like Kip Hansen try to destroy the work of scientists who did real work, as opposed to him, who is only a journalist and NEVER, NEVER did any work about sea level evaluation.
I have written several comments since 2019 at WUWT about sea level evaluation performed by qualified people, and comparing their results.
The latest one compared e.g. Dangendorf & alii, Grant Foster, Frederikse, NOAA’s tide gauge and satellite altimetry data, to which I added my own layman’s evaluation:
https://i.postimg.cc/Gm6jDDF0/PSMSL-Dang-Fred-Fos-NOAA-Bin-Alt-1900-2021.png
Does that not look a bit too similar for so different evaluations?
Here you see a comparison of successive trends found within all that data:
https://i.postimg.cc/QNpz7G4W/PSMSL-Dang-Fred-Fos-NOAA-Bin-5-yr-dist-consec-trends-1900-2015-1995-2015-end-fixed.png
It should be evident to any experienced observer that of there was no acceleration in the sea level data, all trend plots in the chart above would be flat lines.
*
The best you can do is to inform yourself by reading e.g.
https://drive.google.com/file/d/1-ilhh3ov20tfb03P5ZKDHTzZuJ9rD4P8/view
regarding kip and what he said,
regarding his graphs:
“This is widely accepted as shown below:
Middle one “seqment of moberg 2005 from Grinstead 2009”
What think of this middle graph, of sea level: 1200 to 2000 AD?
[I haven’t seen it before]
And what this quote:
“Scientists estimate that if it warms by about 4 to 5 degrees Celsius (7.2 to 9 degrees Fahrenheit), which is projected to happen by the end of the century if we dont act on climate change, then all the ice will eventually melt. Thats 230 feet of sea level rise.
What I think is if ocean were to warm by .5 C then one would get 4 to 5 C rise in global temperature, but not all ice will melt.
I think if given enough time the glaciers of Canadian island could all melt.
But don’t know if Antarctica would gain or lose glacial ice.
And Greenland likewise may gain or lose ice, but tend to think Greenland would lose much more ice then what we recorded that it has lost. But certainly, not all.
I tend to think ocean were warm by 1 C it could to have chance of this happenned. But would take centuries melt if Ocean were 1 C warmer. And ocean can not warm this fast, and basically not going to happen.
ORIGIN OF THE UNPRECEDENTED MEME
https://tinyurl.com/mr3ktnv5
Willard says that it is always getting warmer. Except when it is cooling. And that 7 years is not long enough to repress any bad effects that the warming has caused and is still causing.
Engineers call that the response time of the system.
In fairness, Richard’s response time is shorter than that.
Sure, that would be fine but no-one has ever found the delay mechanism that keeps things rising even though things are actually falling.
It’s obvious, after even only 7 years, that we are in another flat trend.
C’mon, Gordo.
Wanna bet?
Step change paws step change paws step change paws
Will history stop repeating itself?
What goes up will come down.
Is that a law of physics?
Newton thought so.
Do tell me when the rising nighttime and winter temperatures mean that nights will be warmer than daytime and winters warmer than summers. After all OLS upwards trends carry on for centuries don’t they?
Continue posting things that have nothing to do with what I posted.
bobdroege, please stop trolling.
I am pleased to see that the thought police have not yet succeeded in shutting down this site. Epistemology is the study of knowledge. There is nothing in that framework that says people should be protected from alternate views. It is the vigorous debate of alternate views that enforce what is more likely to be true and what is probably false.
Maybe you should move for a longer while to Russia, China or North Korea.
Then you will learn what a ‘thought police’ really is…
That is a good example of misinformation right there. Just because others have it worse does make it okay for the government and private companies to do it. Private companies can and do make their own rules, but when they enforce restrictions on ideas it is thought control. People in a free country have a right to be wrong in their ideas and then express themselves. The only legitimate counter is to post the correct information and let the reader decide.
No one can police thoughts, they can only police what is written or spoken. The Nazis got right into that circa 1933 in Germany, burning books and throwing people in concentration camps for offering opinions contrary to that of the state.
That same movement is afoot today and unless we speak up and stop it at the ballot box, while we still have a chance to vote, we are in big trouble.
Binny,
You have never actually lived in Russia, China, or North Korea, have you?
How do your form your opinions about those countries? Hopefully, not just by reading and accepting opinions of people who dislike the governments of those countries.
Maybe you can convince yourself that nobody in your country disagrees with the ruling government, or the laws they pass. That would sound completely mad, wouldn’t it? I suppose you think that people are entitled to express their opinion – and of course you will tell them what that opinion is!
I believe in unfettered free speech. I haven’t yet met anybody who agrees – I get an endless procession of people telling me why people should not be allowed to say this or that. Just look at the US, for example. There are words which certain people are not “allowed” to use in public, it seems. Oh dear, someone might take offence! What a catastrophe!
Allegations and accusations are enough to ruin lives, in some cases. Even if the allegations prove to be completely without foundation, the accuser just wanders off, looking for something else to feel “offended” about.
Possibly a world-wide phenomenon. Do the same rules apply in Russia, China, and North Korea?
If they do, I will just stay where I am, thank you. At least here, I have a fair idea of what I can and can’t say without some idiot falling about the place feeling “offended”, “insulted”, or “upset”. These same idiots don’t seem to be at all concerned that I might choose to feel “offended” etc. Outrage!
Funny old world.
Indeed – Darwin residents tend to have no filter.
A,
I don’t understand your comment, so it must be exceptionally offensive, disgusting, vile, and hateful.
To save me the effort, sue yourself, and send me the money.
[laughing]
Just a statement of fact, Mike.
You still live in Darwin, right?
Weepy Wee Willy,
A Q wrote –
“Indeed Darwin residents tend to have no filter.”
You wrote –
“Just a statement of fact, Mike.
You still live in Darwin, right?”
Maybe Mike can understand what a tendency for some to have no filter means, but I certainly don’t. Presumably, your second piece of rhetorical nonsense is based on some fantasy you believe. Why don’t you ask Mike, and who cares what you think?
Maybe someone thinks that your comments are offensive, hurtful, hateful, . . .
I don’t care what they think either. Why should I?
You are so disconnected from reality (and incompetent), that you can’t even figure out where I live.
Moron.
[laughs at delusional nitwit]
You’re still writing about yourself in the third person, silly sock puppet.
[still laughing at delusional idiot]
Swenson/Mike – You must enjoy the internet where you can pretend you know how to laugh.
[laughs at pretentious nitwit troll]
“Nitwit” … what are you … 80?
AQ,
Whining Willy is no doubt exceptionally grateful that you make even a peabrain like him appear intelligent by comparison with yourself
Maybe you should try being gratuitously offensive, or try some other pathetic attempt at diverting attention away from the fact that you are a stupid, as well as ignorant, nitwit.
How do I know you are a nitwit? Gee, let me think . . .
[still sniggering at nitwit troll]
“make it okay for the government and private companies to do it.”
“Thought control’
Here it has mostly been companies doing it, with exception of right wing efforts by certain state govts eg ‘Dont say Gay’ law., and ‘Dont discuss race’ laws.
I am not going to get trolled by that statement. I am going to assume you are more intelligent and well informed than your very dishonest statement implies. Nothing in your Adam Schiff-styled quotes is true.
It appears that for you, Tim, ‘thought control’, that agrees with your political views, is acceptable.
More trolling from someone who is most likely smart enough to know the correct answers. Across the board, political talking points usually make a person seem stupid.
“Private companies can and do make their own rules, but when they enforce restrictions on ideas it is thought control.”
WTF has this got to do with Roy’s blog?
barry, please stop trolling.
A demonstration that humanity’s contribution to the modest rise trend in average global temperature is NOT due to increasing carbon dioxide is at http://globalclimatedrivers2.blogspot.com
Thanks for all the work on your website. A lot of nice updates.
You have an interesting theory. I would add that oil refineries sometimes produce local cloud cover on cool and humid mornings due to the cooling tower output. From two examples I am familiar with, refineries evaporate about 1 gallon of water from their cooling towers for every 2 gallons of crude processed. A typical 200,000 barrel per day refinery will consume about 3,000 gallons per minute of cooling water.
Thought I’d repost this link to the climateaudit site on the hockey stick….
https://climateaudit.org/2007/11/06/the-wegman-and-north-reports-for-newbies/
From the Wegman report….
” The debate over Dr. Manns principal components methodology has been going on for nearly three years. When we got involved, there was no evidence that a single issue was resolved or even nearing resolution. Dr. Manns RealClimate.org website said that all of the Mr. McIntyre and Dr. McKitrick claims had been discredited. UCAR had issued a news release saying that all their claims were unfounded. Mr. McIntyre replied on the ClimateAudit.org website. The climate science community seemed unable to either refute McIntyres claims or accept them. The situation was ripe for a third-party review of the types that we and Dr. Norths NRC panel have done.
While the work of Michael Mann and colleagues presents what appears to be compelling evidence of global temperature change, the criticisms of McIntyre and McKitrick, as well as those of other authors mentioned are indeed valid.
Where we have commonality, I believe our report and the [NAS] panel essentially agree. We believe that our discussion together with the discussion from the NRC report should take the centering issue off the table. [Manns] decentred methodology is simply incorrect mathematics . I am baffled by the claim that the incorrect method doesnt matter because the answer is correct anyway.
Method Wrong + Answer Correct = Bad Science.
The papers of Mann et al. in themselves are written in a confusing manner, making it difficult for the reader to discern the actual methodology and what uncertainty is actually associated with these reconstructions.
It is not clear that Dr. Mann and his associates even realized that their methodology was faulty at the time of writing the [Mann] paper.
We found MBH98 and MBH99 to be somewhat obscure and incomplete and the criticisms of MM03/05a/05b to be valid and compelling.
Overall, our committee believes that Manns assessments that the decade of the 1990s was the hottest decade of the millennium and that 1998 was the hottest year of the millennium cannot be supported by his analysis.
[The] fact that their paper fit some policy agendas has greatly enhanced their papers visibility The hockey stick reconstruction of temperature graphic dramatically illustrated the global warming issue and was adopted by the IPCC and many governments as the poster graphic. The graphics prominence together with the fact that it is based on incorrect use of [principal components analysis] puts Dr. Mann and his co-authors in a difficult face-saving position.
We have been to Michael Manns University of Virginia website and downloaded the materials there. Unfortunately, we did not find adequate material to reproduce the MBH98 materials. We have been able to reproduce the results of McIntyre and McKitrick
Generally speaking, the paleoclimatology community has not recognized the validity of the [McIntyre and McKitrick] papers and has tended dismiss their results as being developed by biased amateurs. The paleoclimatology community seems to be tightly coupled as indicated by our social network analysis, has rallied around the [Mann] position, and has issued an extensive series of alternative assessments most of which appear to support the conclusions of MBH98/99 Our findings from this analysis suggest that authors in the area of paleoclimate studies are closely connected and thus independent studies may not be as independent as they might appear on the surface.
It is important to note the isolation of the paleoclimate community; even though they rely heavily on statistical methods they do not seem to be interacting with the statistical community. Additionally, we judge that the sharing of research materials, data and results was haphazardly and grudgingly done. In this case we judge that there was too much reliance on peer review, which was not necessarily independent.
Based on the literature we have reviewed, there is no overarching consensus on [Manns work]. As analyzed in our social network, there is a tightly knit group of individuals who passionately believe in their thesis. However, our perception is that this group has a self-reinforcing feedback mechanism and, moreover, the work has been sufficiently politicized that they can hardly reassess their public positions without losing credibility.
It is clear that many of the proxies are re-used in most of the papers. It is not surprising that the papers would obtain similar results and so cannot really claim to be independent verifications.
Especially when massive amounts of public monies and human lives are at stake, academic work should have a more intense level of scrutiny and review. It is especially the case that authors of policy-related documents like the IPCC report, Climate Change 2001: The Scientific Basis, should not be the same people as those that constructed the academic papers.”
Full report….
https://climateaudit.files.wordpress.com/2007/11/07142006_wegman_report.pdf
C’mon, Gordo.
You’re touting the work of a serial plagiarist:
https://statmodeling.stat.columbia.edu/2011/06/08/further_wegman/
In fact if you knew anything about this you’d realize that Ed did not really check the Auditor’s code. He had to get taken by the hand. And even then he did not see the Auditor’s trick.
You know the Auditor’s trick, right?
Wonky wee willy can’t seem to get it straight. Someone who quotes from a paper during an investigation is not committing plagiarism. The thing you should have noted is that Bradley did not complain about the assassination of his work, he complained only that he had been plagiarized. A red-herring retort that rates up there with the best.
Wegman addressed the complaint. He explained that he had cited Bradley earlier in his report and did not think a second mention warranted a citation. Personally, I don’t think he should have bothered citing Bradley in the first place since his work, along with Mann and Hughes was clearly bs.
I mean, come on, when Bradley whined about plagiarism, that revealed him as a small-minded twit.
Here are a few things you don’t get right, Gordo –
Plagiarism is about copying stuff without attribution.
Ed has been caught in worse than that: he “borrowed” material and distorted it.
Even worse than that, he tried to blame his assistants instead of owning the bad job.
And even worse than that, he was hired because he was supposed to be an expert on the matter.
Try to minimize this, asshat.
bs.
“Plagiarism is about copying stuff without attribution.”
Like this?
No, dummy.
Is Willard an idiot? Yes.
“Plagiarism is about copying stuff without attribution.”
Like this?
No. Wegman didn’t use quotes.
Idiot.
barry, please stop trolling.
https://climateaudit.org/2021/11/02/the-decline-and-the-stick/
“The Decline, the Stick and The Trick”
https://andthentheresphysics.wordpress.com/2014/09/29/the-ghost-of-present-climateball-tm/
“The Ghost of Present Climateball”
Willard with his usual ‘ad hom’ attack rather than depute the physics.
“Depute”? Who should he depute it to?
Autocorrect failure. Should’ve been dispute.
There’s no physics in the Auditor’s hit piece, dummy.
Is it a typo too?
There is no physics in your response.
“At face value, this looks to me like quite peculiar statistical methodology As to Manns methodology, I must confess that I am unable to understand it. But in any event, if Briffa observed the above effect, then (1) Mann should have observed the effect also and his failure to observe it would diminish the value of his study; (2) if Mann observed the effect, but failed to report it, then that would equally diminish the value of his study. Either way, Id be inclined to rely on Briffas evidence as to observations and to rely on neither series as a proxy reconstruction for the obvious reasons above”
So it’s not about physics, dummy.
Here’s what’s not about physics either:
https://neverendingaudit.tumblr.com/post/6494856989
Remember Yamal.
Do you have a url for the Yamal data?
I thought the statistics supported the physics. My bad.
Your jabs are getting weaker than Mike Flynn’s, old man.
Willard resorts to babbling to himself.
“You know the Auditors trick, right?”
There were at least three.
The data source trick
The mining the data trick
The scaling of the y-axis trick.
There may have been more.
But they kind of make Mike’s nature trick like like wee potatos.
Bob: So you are happy with grafting one data source onto another regardless.
Regardless?
Have you never heard of calibration?
For example, the satellite sea level data since 1993 has come from sensors on four satellites;Topex, Jason-1, Jason-2 and Jason -3.
https://sealevel.colorado.edu
Standard practice is to run each satellite in tandem with its successor for a while to calibrate the new satellite against the old.
Up the road from me is the DuPont nylon plant.
One of the engineers once described their reactor temperature data to me. They started out with a mixture of bimetallic strips, mercury and spirit thermometers read by a man with a clipboard and a ladder. They have passed through several generations of sensor and now use mostly thermocouples monitored by computer.
They are quite happy to calculate fatigue lives for the reactors using all the temperature data because each generation was calibrated against the ones before.
No nonsense about “grafting one data source onto another regardless.”
Sure and you can add Tmiddle data to Tmean data without any problems.
Of course you can just call them both ‘mean’ and have no problems. They are ‘the same’ after all aren’t they?
Dow Jones does it all the time, should they be indicted?
But then you didn’t address any of my concerns with what Mic and Mac did?
So you think that climate is like the stock exchange. Boy do you need some education.
rlh…”Bob: So you are happy with grafting one data source onto another regardless”.
***
Not just grafting one data source onto another, grafting real data onto proxy data because the latter is showing declining temperatures. That’s why Mann’s trick was called ‘hide the decline’. Phil Jones of Had.crut bragged in the Climategate emails about using the trick in his data.
Is there no end to the chicanery? Jones also bragged about blocking papers from skeptics at IPCC reviews.
C’mon, Gordo.
That’s called peer review, and the publication of the paper led to the resignation of the editor of one of the journal.
There’s no end to this chicanery because contrarians keep repeating the same talking points over and over again.
Look at you. More than ten years at Roy’s and you’re still a Sky Dragon Crank.
“Not just grafting one data source onto another, grafting real data onto proxy data”
They didn’t “graft” the data, they showed data from different sources on the same graph.
“the latter is showing declining temperatures.”
Not exactly, the Briffa reconstruction show mainly flat temperatures from the 1500s to the mid 20th century with some decline at the end.
This is what the “hide the decline” is all about, not declining temperatures, but
“The tree ring results may still suffer from lack of multicentury time scale variance.”
From one of those emails, where Mac hid the above using ellipses.
Sure you can compare that with what Mic and Mac did.
“So you think that climate is like the stock exchange. Boy do you need some education.”
Pretty stupid of you to think I think the climate is like the stock exchange, when I never said anything like that.
I was talking about graphing data.
You can make a spaghetti graph using stock market data, just like you can with climate data.
You can stop passing yourself off as an expert on statistics, it’s wearing thin.
Sure. Using ‘normal’ statistics on skewed, bimodal data is perfectly correct.
“Dow Jones does it all the time”
is not about a stock exchange.
“Dow Jones does it all the time
is not about a stock exchange.”
It’s a stock exchange index, is that something you are unaware of?
The point was that the Dow Jones changes over time as the 30 stocks that make up the index change.
Are you really ignorant or just didn’t get the part?
“Sure. Using normal statistics on skewed, bimodal data is perfectly correct.”
Yes, you use the data you have, not the data you don’t have but wish you had.
Speaking of the Dow:
https://www.dogsofthedow.com/
Not an endorsement nor advice. But if you are into this:
https://www.marketinout.com/investment/report.php?report=dobermans_of_the_dow
Survivor bias is a pain for back tests.
“Sure. Using ‘normal’ statistics on skewed, bimodal data is perfectly correct.”
The Central Limit Theorem says its just fine.
bobdroege, Willard, please stop trolling.
clint…”Gordon, our eyes see blue sky because of the refraction/reflection properties of the molecules in the sky. The S/B equation refers to emission. The sky does NOT emit as per S/B. The blue photons come from Sun”.
***
I get both of your points and it occurred to me at the time that my example was not very good. I was pretty tired and didn’t give a hoot.
I also realize that you specified a certain condition.
Back to your point, which is a good one. The blue in the sky has a source (the Sun) which has an extremely high temperature. You may be able to use S-B in reverse there since the Sun is essentially a black body. I think the point Christos is making is that S-B cannot be reversed for non-blackbody sources, like a planetary surface.
Let’s pick a better example. I am looking at my computer screen and it is giving off white light. It comes from mixing red, green and blue pixels in a certain ratio to produce white light. Those pixels are tiny LEDs set up as pixels.
If I take that white light and relate it to a black body that would produce such a colour, I’d be looking at an extremely hot temperature of 6500K to 10,500K. That’s not the case here, obviously.
If I point Norman’s IR detector at the white light it won’t even detect it. Norman doesn’t get it that the IR detector does not measure heat, it’s detector element responds to frequency and it is set up in a lab with real temperatures that would correspond to those frequencies. There is likely a generous fudge factor built in as well.
If I apply S-B to the white light produced by my computer screen, which is valid EM, I get nothing. The white light has all the frequencies of the visible spectrum and it is EM, but it cannot be applied to the S-B equation in reverse.
There is a delicious irony here. Norman’s IR detector will average the temperature of the laptop while ignoring any other EM. That’s not surprising technologically to me since I know that certain semiconductors will respond to a narrow bands of IR frequencies but to no other EM frequency.
There is simply no device that can measure EM across the full spectrum.
Switch from a white screen to a screen the colour of the blue sky. Same thing. The colours are produced by red, green and blue LEDs emitting in the right proportion to produce sky-blue light. That would likely mean turning off the red and green LEDs and desaturating the blue till it got to a lighter shade of blue.
Here we have EM that cannot be applied in reverse to the S-B equation. You like to use photons. The photons from the screen are indistinguishable from photons from any other sources.
I am not presenting myself as someone with expertise, I am merely asking questions. In a lab, how would they get a reference IR frequency for ice? Can’t see the IR, how do they measure it? Something would have to detect it, and I am sure certain semiconductors will detect it to a certain degree. Once detected, how do we relate those IR frequencies to S-B?
Can’t do it with the current S-B constant. Therefore, they must be fudging it somehow to make it fit the T^4 curve.
gordon, good points.
S/B does not apply to LEDs, or photons created unnaturally.
clint…basically, S-B only applies to black bodies or bodies whose temperatures are very hot like an electrically-heated filament that glows.
Gerlich and Tscheuschner argue that point well in their paper on falsification of the greenhouse effect.
Climate alarmists have argued that grey bodies exhibit the same response but G&T argue that is not true.
There’s nothing wrong with S/B. The problem is people don’t know how/where/when it applies.
For example, Earth can NOT be compared to an imaginary sphere.
That’s right, nothing wrong at all with the original analysis of Stefan of the Tyndall data. I have no doubt that a T^4 relationship exists. I am simply asking what it really means in an overall sense.
However, I know nothing about Stefan implying it works backwards. Or that it can be applied to two bodies of different temperatures, relating them somehow. The only thing I know for sure is that Stefan created the original equation based on EM from a heated element considered a near-blackbody.
As created by Stefan, the equation gives a proportionality between a body in a certain temperature range and the intensity of EM emitted at each temperature. The constant of proportionality applies within that temperature range. G&T argued it does not apply outside that temperature range. In fact, I saw an article once in which there was a T^5 relationship. Wish I could recall where I saw it.
My interpretation of G&T is that they tried to do too much in one paper. They tried to both teach physics and debunk the GHE nonsense. The paper ended up being over 100 pages, with references. The GHE nonsense could easily be debunked in less than 10 pages. By writing too much, and having to deal with translating into English, they left themselves open for unnecessary and unwarranted criticism.
For example, referring to the constant used in the S/B equation, they wrote: “The constant σ appearing in the T^4 law is not a universal constant of physics. It strongly
depends on the particular geometry of the problem considered.”
I’m guessing they meant something other than “geometry”, as geometry has nothing to do with the constant.
But their main points about the GHE nonsense are “right on”, such as:
+ “…the frequently mentioned difference of 33 °C is a meaningless number calculated wrongly…”
+ “…the formulas of cavity radiation are used inappropriately…”
+ “…the assumption of a radiative balance is unphysical…”
clint…”Im guessing they meant something other than geometry, as geometry has nothing to do with the constant”.
***
The native language of G&T is German and I have noticed they tend to use words in manners we might find odd. For example, they speak of glass houses rather than greenhouses. In that case, their usage of the words are better than ours.
Perhaps context might have been a better choice of words.
” photons created unnaturally. ”
The mind boggles!
Exactly Ent. Your mind gets boggled often.
That’s because you don’t understand any of this.
Gordon,
I’m reasonably certain that most scientists accepting “temperature” readings from non-contact IR thermometers don’t understand the complexities of the technology.
Modern IR thermometers can routinely have a spectral response of 1 micron – or less. Excellent, you might say, but what does the response curve look like? Do the same 3db points occur at each end? What’s the point?
How many people realise that the emissivity of steel changes with temperature? And composition? What about water – for example sea water between freezing an 35 C? When salinity varies?
What you are trying to measure, and why (and what sort of budget and time constraints you have), can make an enormous difference to what equipment you can usefully employ.
For weather (and hence climate) purposes, the liquid in glass thermometer is probably as good as anything – if you have the means of reading it regularly. It should show increasing temperatures with increasing population, urbanisation, industrialisation – and increased energy production and use generally.
No supercomputers needed.
swenson…”Im reasonably certain that most scientists accepting temperature readings from non-contact IR thermometers dont understand the complexities of the technology”.
***
That applies to some companies who produce the IR thermometers. The semiconductor technology used in IR hand scanners is very complex in itself and as you pointed out, the semiconductors only cover a certain range of IR frequencies with a drop off either side of the centre frequency.
I find it interesting that electrons in the semiconductors respond to EM in the way they do. Miraculous but highly selective little blighters.
“Modern IR thermometers can routinely have a spectral response of 1 micron or less. Excellent, you might say, but what does the response curve look like? Do the same 3db points occur at each end? Whats the point?”
With ignorant declarations like this, Im reasonably certain that Swenson doesnt understand the complexities of the technology and is just making up BS.
Nate,
Do you wish to dispute a matter presented as fact?
No?
Gee, why am I not surprised that a dimwit like you can’t even say what he is is disagreeing about?
Try disagreeing with the Earth having cooled to its present temperature. That should be pretty easy for a GHE believer, shouldn’t it?
Or maybe not.
Curves are often measured by how quickly they fall off to a 3 dB point, which is a half-power point. If you are measuring IR intensity versus frequency, a 3 dB point would be apt.
For example, in amplifier measurements, for frequency response (response curve), the signal intensity is plotted against the frequency in a range from 20 hz to 20Khz. The bandwidth of the curve is determined by plotting the 3 dB points on both slopes descending from the peak and drawing a line between them.
If you applied the same to a bandpass filter, you’d want to know how sharp its response might be. If it was centred at 1 Khz, how much of the frequencies either side of 1 Khz would it pass and how much would each be attenuated? It has been established in electronics that a line drawn between points on the curve where the response is 3 dB below the peak response is the bandwidth of the filter.
I am interpreting Swenson as wondering how many IR frequencies will be detected either side of 1 micron, which is a valid question. I think some get the impression that a handheld can detect all IR and it can’t.
The Fluke 572-2 infrared thermometer claims a measurement range of -30C to 900C (-22F to 1652F). But how are they measuring it? They are obviously not using S-B since it would need EM intensity and their instrument cannot measure EM intensity.
The fact that Fluke does not supply a frequency response chart as indicated by Swenson, is telling.
At the following link, Fluke tells us how they detect IR on a thermal imaging camera.
https://www.fluke.com/en-ca/learn/blog/thermal-imaging/how-infrared-cameras-work
“Each pixel in the sensor array reacts to the infrared energy focused on it and produces an electronic signal. The camera processor takes the signal from each pixel and applies a mathematical calculation to it to create a color map of the apparent temperature of the object”.
Note the reference to ‘apparent temperature’ and that each pixel converts IR to an electronic signal..
IR thermometers are not detecting individual IR frequencies, measurement is dependent on the frequency response of a semiconductor device used as the detector. I am guessing they set the semiconductors up in a lab and test their response to known heat sources and see what kind of electrical current is produced. Then they calibrate circuitry to measure relative temperatures.
In the explanation above, Fluke claims to apply the signal received from each pixel on a receiver to a ‘mathematical calculation’. In other words, they have a means of receiving a range of IR frequencies and separating them according to a set point. They don’t separate the IR frequencies received, they take the response of the pixel to the IR and work with the signal mathematically in bulk.
Here what the math probably involves, Fourier-transform infrared spectroscopy (FTIR)…
https://en.wikipedia.org/wiki/Fourier-transform_infrared_spectroscopy
There is no way they are applying S-B and as far as I am concerned there is no way S-B would work in the infrared range without adjusting the proportionality constant, or finding a different relationship.
ps. the post above was address to Nate.
Gordon Robertson
There are some IR thermometers that have two wave bands that are collected and analyzed to determine a temperature.
Others use a thermopile.
Here is one example and they definitely use Stefan-Boltzmann law in the calculation to get a temperature reading.
https://www.eetimes.com/measure-temperature-precisely-with-an-infrared-thermometer/
Also your link to (FTIR) has NOTHING at all to do with getting a temperature reading!! It is about getting an IR spectrum of some material to try and figure out what the material is from the IR spectrum. It is a Chemistry analysis tool.
Most the time it is quite clear you don’t know any real science and use some crackpot ideas you find on the internet. All garbage all the time. Too bad for you.
[rlh]I think it is fair to say that the Earth is an isolated system in this regard.
[Antonin Qwerty] says:
Oh really?? I think the sun will disagree with you. As will all the energy which escapes into space”.
***
There is a technicality here that must be observed. An isolated system refers to a thermodynamics system, and that applies to heat transfer, not energy transfer per se.
There is no heat or mass transferred into and/or out of the Earth. Heat is produced locally by conversion of solar EM to heat and is dissipated locally as heat is converted to EM.
Theoretically, an isolated system would have to be a closed container with insulated walls that prevented heat from entering or leaving the container.
On the other hand, Einstein would argue, based on E = mc^2, that EM entering and leaving the Earth transfers mass. I think Albert was full of it but I’ll leave that for another post.
I think you’re full of ‘it’.
Ken…”I think youre full of it”.
***
Yes, Ken, but you cannot explain why.
It is adequately addressed by our peers on this thread.
Ken…Still no explanation as to why you disagree and feel the need to fling ad homs and insults.
None of the peers have explained how heat gets transferred into and out of the Earth. Maybe you have an explanation.
Robertson read this and stop being so (expletive deleted) obtuse: https://ddears.com/2021/01/12/dr-happer-explains-effects-of-co2/
Isolated System: “a thermodynamic system enclosed by rigid immovable walls through which neither mass nor energy can pass”.
You are confused with a CLOSED system, which indeed allows energy to pass.
Does it even occur to you to CHECK before posting garbage?
Add that to your explanation of the moon’s phases.
ant…”Isolated System: a thermodynamic system enclosed by rigid immovable walls through which neither mass nor energy can pass.
You are confused with a CLOSED system, which indeed allows energy to pass.
Does it even occur to you to CHECK before posting garbage?”
***
Yet another idiotic reply.
WE ARE NOT TALKING ABOUT ENERGY PER SE, WE ARE TALKING ABOUT ***HEAT***!!!!! Heat is thermal energy and no other energy applies to an isolated system.
An isolated system is about HEAT.
There is no transfer of heat into or out of the Earth. Heat does not flow through space, either from the Sun to the Earth or from Earth to space. It must be converted from and to EM first, and EM has none of the properties of heat, and vice-versa.
I don’t need to check, I have studied thermodynamics as part of my engineering studies.
If the earth gain/loses energy then it gain/loses heat.
It makes no difference whether or not you define heat as something which flows, the net effect of energy gain or loss on heat content is the same.
AQ,
More semantics. Thermometers are used to measure “degrees of hotness”, no more, no less.
But even this is meaningless without further explanation. For example, the white sparks coming off a grinding wheel may exceed 1500 C, but can bounce off your skin without harm.
On the other hand, a couple of litres of boiling water can do you significant damage – even kill you!
As regards the Earth, it has cooled since it was created. Due to lost heat, lost energy, makes no difference, does it? CO2 adds no heat or energy to the Earth. None. Neither do the finest insulators known to man – just in case someone agrees with Raymond Pierrehumbert that ” . . . CO2 is just planetary insulation.”
No GHE. A myth which its believers cannot even describe.
The semantics came from Gordon. I’ll wait for his reply – at least he engages.
AQ,
And it is important that the semantics came from this one or that one because . . . ?
You may wait for whom you wish. It makes no difference to the fact that the GHE cannot even be satisfactorily described by its most ardent supporters.
Feel free to try. I’ll help you out – start off by saying “The GHE is a phenomenon which may be observed . . . “. How hard can It be?
Only joking. Too hard for an ignorant troll like you, obviously.
Go to bed angry, wake up angry .. it must be a sad, lonely life.
AQ,
Why do you go to bed angry and wake up angry? Do you suffer from a particular mental defect, or do you just enjoy the feeling?
Are you angry because you support a GHE that you can’t describe, or are you just sad and angry because your trolling efforts are not applauded?
Off you go now, work on your trolling skills. Remember that you are impotent and anonymous, and that nobody at all cares for your stupid opinions, and take it from there.
You don’t need to thank me.
ant…”If the earth gain/loses energy then it gain/loses heat.
It makes no difference whether or not you define heat as something which flows, the net effect of energy gain or loss on heat content is the same”.
***
Again, an isolated system is not about energy per se, it is a thermodynamic system hence is about heat and mass. Heat must escape the system and heat does not escape the Earth. First, it is converted to EM, and EM escapes the Earth, but EM is not heat and does not apply to an isolated system.
I have gone over this on other posts. There is a tendency today to lump all forms of energy into a generic energy. No one knows what energy is, it’s still a mystery. We can observe the effects of energy but we cannot explain what it is. The term kinetic energy is not a reference to a specific energy, it is a reference to any energy in motion.
Energy takes different forms. Electromagnetic energy has the form of an electrical wave perpendicular to a magnetic wave. It also has a frequency but no mass. Heat is dependent on mass, it is the kinetic energy of atoms, meaning essentially the energy of atoms in motion in a solid. Of course, you can apply that definition to gases and liquids as well providing you address the energy causing the motion, which is heat.
In order that heat leave the planet it must do so as mass, as atoms or molecules. Same if it enters the planet. The solar wind is composed of particles, electrons and protons, and as long as it moves as a cohesive plasma, it should have a temperature, hence it contains heat.
That’s not possible on Earth since air molecules lose heat as heated air rises. As the pressure drops with altitude, the temperature drops. Mass can escape to space but it likely has no temperature by that point since it has no pressure.
“There is no heat …. transferred into and/or out of the Earth”
Back to the ‘EMR is not heat’ argument I see. Idiot.
richard, I am puzzled as to why someone with a masters degree has to carry on like an adolescent hooligan. Do you suffer from Aspergers?
EM is not heat, Repeat till it sinks in. The two forms of energy have nothing in common. Heat is common to mass, EM has no mass.
Gordon Robertson
You should look up the physics definition of “heat” for yourself.
RLH is quite correct and using the proper definition.
What you claim “heat” is, is actually internal energy.
Heat is the amount of energy that is transferred when objects have different temperatures. EMR is heat energy when it flows from a hot object to a colder one and caused a temperature change.
Read for yourself.
https://www.thermal-engineering.org/what-is-heat-in-physics-heat-definition/
EMR is the way heat is transferred though a vacuum.
–NASA Administrator Bill Nelson appeared before a US Senate Appropriations subcommittee on Tuesday to discuss NASA’s budget request for the upcoming fiscal year. Then, quite unexpectedly, he dropped a bombshell.
After his opening remarks, Nelson was asked what, in his opinion, was the biggest threat to NASA’s goal of landing humans on the Moon by 2025. Nelson responded that the agency needed competition in its program to develop a Human Landing System. In other words, he wanted Congress to support NASA’s request for funding to develop a second lander alongside SpaceX’s Starship vehicle.–
That why I liked, Bill Nelson.
Someone who can drop bombshells.
Continuing:
–“I believe that that is the plan that can bring us all the value of competition,” Nelson said of fixed-price contracts. “You get it done with that competitive spirit. You get it done cheaper, and that allows us to move away from what has been a plague on us in the past, which is a cost-plus contract, and move to an existing contractual price.”–
https://arstechnica.com/science/2022/05/nasa-chief-says-cost-plus-contracts-are-a-plague-on-the-space-agency/
Anyhow, it gives me some hope, that might get to moon within 5 years.
But it’s basically: “Congress, let me do my job.”
–Ned Nikolov says:
May 3, 2022 at 3:56 pm
What Roy Spencer wrote in 2010 about the role of clouds is conceptually correct. However, he seems to have abandoned this line of thought recently. Roy has increasingly been pushing the false greenhouse theory and insisting that adding CO2 to the atmosphere via industrial emissions would measurably warm the planet.
We should be asking, why is he dismissing the evidence accumulated since 2010 that observed changes in absorbed solar radiation by Earth is sufficient to explain the entire recent climate change and that there is no evidence for the so-called CO2 radiative forcing?–
From comment section of:
https://tallbloke.wordpress.com/2022/05/02/ned-nikolov-karl-zeller-exact-calculations-of-climate-sensitivities-reveal-the-true-cause-of-recent-warming/#comments
I think at most rising CO2 level have caused most about .2 C but I would not say it has caused .2 C of warming.
As said before, Earth has naturally warmed and cooled, it seems the warming has recovering from cooler periods of Little Ice Age.
No one makes argument the past few thousands years of warming of centuries of cooling or warming were caused by changing CO2 levels.
Plus we had about 5000 years gradual cooling, again not considered to have been related to CO2 levels.
Having an average global surface air temperature of 15 C is a globally cold air temperature. It’s an average air temperature one would only have in an Icehouse global climate, which called the late
Cenozoic Ice Age. Which has happening for about 34 million, and most of 34 million year has had higher average temperature than 15 C.
Or 15 C global average temperature is a cold temperature for any Ice Age.
I wish it was warmer, but we don’t always get what you wish for.
Anyhow, Ned Nikolov nor Cargo cult explain why we in an Ice Age, nor when we could hope we will leave the Ice Age. But it seems more sensible people imagine it will not happen, within a million years.
Within another 10 million years, might be overly optimistic.
But what regard as interesting or vaguely important is if Ned or anyone could predict what Venus average temperature would be, if Venus was at 1 AU distance from the Sun.
> I think at most rising CO2 level have caused most about .2 C but I would not say it has caused .2 C of warming.
If you ever wonder why nobody responds to you, bg, that’d be a prfct illustration.
Is Willard, nobody?
“He’s a real nowhere man
Sitting in his nowhere land
Making all his nowhere plans for nobody
Doesn’t have a point of view
Knows not where he’s going to
Isn’t he a bit like you and me?”
Don’t lick our tick:
https://www.youtube.com/watch?v=_Rbg4gtSED0
Scott going to pick a panel- he might do it.
I listen to it later.
Don’t waste your time.
Scott needs sycophants, Chic.
Let gb be.
Chic
It was roughly a waste of time.
Fortunately, I always listen at double speed so
it only 1/2 as much of waste of time
{but it was over hour rather being less 50 mins}
Scott said there might be patriotic reason for leaking it.
I don’t have opinion of the whys or wherefore of it,
but for patriotic reasons seems to me to be rather warped
even for an Adams.
Besides being off topic here, there is nothing redeeming about killing ill-conceived and unwanted babies. Two wrongs don’t make a right.
Amnesty has a great pie chart about the reasons why women have abortions, Chic.
The first part, in yellow, is called “none of your business.”
The second part, in black, is called “none of your business, but in black.”
I can’t find it, but here are some facts:
https://www.amnesty.org/en/what-we-do/sexual-and-reproductive-rights/abortion-facts/
Not bothering to read your link, I can only offer my opinion in black and white. I hope you have not and never will procreate.
Your loss, Chic, for your edification is more your business that deciding if women can have abortions.
Gordon Robertson
You’ll find the supplementary information for Mann, Bradley Hughes 1998 here.
http://www.meteo.psu.edu/holocene/public_html/Mann/research/res_pages/MANNETAL98/mbh98.html
Sorry, Gordon.
I haven’t used this for years and hadn’t realised it was no longer active.
The supplementary material and a corrigendum are still available from Nature.
https://www.nature.com/articles/33859
The actual article is here
http://www.meteo.psu.edu/holocene/public_html/shared/articles/mbh98.pdf
The relevant chapter is here:
https://www.ipcc.ch/report/ar5/wg1/
Reading it might help Richard understand that science moved on since his younger days.
Some of us have actually read it and understand what perception bias is all about.
“There is evidence that although people believe they are making impartial judgements, in fact, they are influenced by perception biases unconsciously.”
Of course you haven’t RTFR, Richard.
Does this forum have rules about perception bias?
Why do you keep asking silly questions, dummy?
Whining Wee Willy,
You wrote –
“Why do you keep asking silly questions, dummy?”
Why do you keep asking such silly, not to say pointless, questions, moron?
If you are trying to look clever, it doesn’t seem to be working.
Carry on regardless.
Oh, Mike.
You clown.
Willard: Because they are the only ones that idiots lie you can answer.
*lie = like
I swear I just heard an old contrarian pretend he is not playing Climateball, Richard.
Would you know him by any chance?
Willard, please stop trolling.
This might be more relevant:
https://quantpalaeo.wordpress.com/2014/09/03/recipe-for-a-hiatus/
That should put Gordo’s “always worth the read” comment into perspective.
You’ll be telling me next that mean and standard deviation are completely relevant on skewed, bimodal data. By using normal distributions to support your arguments.
Next you’re going to believe that you’ll make me work for your squirrels, dummy.
So you accept that the statistics you use are not relevant to daily and yearly temperatures.
You’re too old to rope-a-dope, Richard.
Why are you bringing this on yourself?
Weary Wee Willy,
You wrote –
“Youre too old to rope-a-dope, Richard.
Why are you bringing this on yourself?”
Maybe you think that making pathetic incomprehensible attempts at trolling will endear you to fellow climate cranks.
Don’t forget, the approbation of morons is not normally highly regarded.
Hence I’m not looking for your approbation, Mike.
So Willard does accept that the statistics he uses are not relevant to daily and yearly temperatures.
Why are you starting a food fight in the blog you try to defend, Richard?
Why don’t you own up to the fact that you don’t want to apply the correct statistics to the data. You only want to use ‘normal’ statistics that don’t apply to skewed, bimodal data.
Look, dummy.
I told you at least ten times already that, as far as I’m concerned, you could show both statistics. In fact the more the merrier. But you’re confusing this position with two other ones I have –
First, you have *not* established that the median was the more “correct” estimator.
Second, in all your meandering you only established hat you have a very rudimentary grasp of these concepts.
But that’s secondary to the point I’m making right now, which is that you are poisoning your own damn well.
So not only you have little Climateball descriptive knowledge (Sierra Jim and Ross’ crap being the latest examples), you have no procedural knowledge of how to play Climateball properly.
Everybody can see this. The Internet is forever. Don’t you really think I care if you’re trying to provoke me or call me names?
No, it does not. Not at all. It helps me move carry my ball forward.
Were you doing your damn job properly, I would not be here.
Median is preferred over mean for skewed normal data. Fact.
Median is preferred over mean for bimodal, skewed data. Fact.
Neither mean nor median (nor standard deviation) is a ‘great’ representative statistic of bimodal data. Fact.
That is what statistic sources say.
You rattle on as though you can find anything that disputes those claims. You can’t.
All you have is your ClimateBall invention. As though that actually meant something. It doesn’t.
You don’t like Roy’s interpretation of climate and the reasons for it.
Why are you here?
I am here to teach you Climateball, Richard.
Count the number of *median* on that page:
https://en.m.wikipedia.org/wiki/Skew_normal_distribution
Willard, please stop trolling.
The Big 5 Natural Causes of Global Warming – part 1: Varying Atlantic Water Transport
https://www.youtube.com/watch?v=kQbSplM6o9Y
The Big 5 Natural Causes of Climate Change: part 2 Jet Streams and Extreme Weather
https://youtu.be/I4_DjeCsgWk
Part 3 to follow.
from https://perhapsallnatural.blogspot.com/
RLH,
The only cause of hotter thermometers – more heat.
No GHE.
Unless, of course, you believe that increasing the amount of CO2 between the Sun and a thermometer on the surface makes the thermometer hotter.
But that would be perfectly ridiculous, wouldn’t it?
Accept reality – you might even enjoy it.
Swenson: Idiot.
“A wavy jet stream generates its own weather.”
Does CO2 create a wavy jet stream. How?
“Some of the observed global warming since the end of the Little Ice Age is due to the ITCZs and jet stream’s northward migration from its much more southward location 200 years ago.”
Did CO2 cause this?
“the jet stream dove deep into the southern United States between February 12th-19th, in 2021. …. Global warming was unlikely to have had an effect as that cold snap resembled the cold snap of 1899”
So CO2 didn’t cause that.
“Just 4 months later around the 2021 summer solstice, a wavy jet stream created a heat wave over western north America, causing Lytton British Columbia to experience record-breaking heat from June 27th to 29th.”
That has been blamed on rising CO2. Magic both hot and cold caused by CO2.
“British Columbias previous heat record that happened in 1941 was also set in Lytton, giving the town the nick name of ‘Canadas hot spot'”
1941 is well before CO2 started rising.
“A recent 2022 peer reviewed study shows this region has been cooling for the past 30 years.”
So much for CO2.
“The majority of the warming since the mid-20th century is due to anthropogenic carbon dioxide. While the global average temperature has warmed with statistical significance, there are a few places that have bucked the trend for a few decades, and even one part of the Atlantic that has cooled over a hundred years. These are due to changing weather patterns that have almost certainly been brought on by global warming.”
So much for ABC.
barry, please stop trolling.
Like a Boss:
https://andthentheresphysics.wordpress.com/2016/10/18/like-a-boss/
How Gaia and coral reefs regulate ocean pH
Posted on October 13, 2016
So recent. Like most of Willard’s ‘information’.
There are idiots….and then there are idiots.
[RICHARD] So recent.
[ALSO RICHARD] What happened before 1880?
Willard keeps up to date as usual and apparently doesn’t think there was climate before 1880.
[RICHARD] So recent.
[ALSO RICHARD] “The Decline, the Stick and The Trick”
The IPCC keeps the stick up to date. Not me.
What was the year of MBH, dummy?
Wayward Wee Willy,
You wrote –
“What was the year of MBH, dummy?”
Who cares? Do you?
Keep up the trolling efforts. I suppose that’s the only way you think you can get attention. Have you tried sticking a needle in your eye and screaming in pain?
Or do people just not care – as usual?
Mike Flynn,
You ask –
“Who cares?”
The guy who said –
“So recent.”
You know how that is?
Of course not, silly sock puppet.
Once again you butt in an exchange without having read it!
Whacky Willard,
Who cares what you think, moron?
Are you powerful and important (apart from in your own imagination)?
Ill butt in where I like, and say what I wish, when I wish.
And there is nothing at all you can do about it, so you might as well get used to it and accept reality.
You really are a pretentious moron, arent you? Thats a rhetorical question, of course. You dont need to answer.
How is your Mike Flynn obsession going? Getting value, are you? I notice that paranoia is characterised by fear and anxiety. Why are you fearful or anxious about Mike Flynn? Or is it just unrequited love – maybe Mike Flynn is an avowed heterosexual, and doesnt return your unwanted advances.
You could always pretend you were joking, I suppose.
Mike, Mike,
You asked a silly question.
You got served.
Enjoy your afternoon.
How old are they Willard?
More Climateball, Richard?
Willard, please stop trolling.
Your link says everything anyone needs to know about your world view. I expected better.
And I expected you stop using a sock puppet, Fernando.
Willard the Wanker,
Pee in one hand, expect in the other – see which fills up first.
You obviously have a mental defect which leads you to think that someone, somewhere, cares what you “expect”.
Have you any evidence to the contrary? If you haven’t, just make some up. As usual.
Carry on trying to troll. You might even get good at it, if you try really, really, hard.
Mike,
Fernando said “I expected better.”
I said I expected him to drop the sock puppet.
What is that hard for you to understand?
Whacky Wee Willy,
As I said, pee in one hand, “expect” in the other – see which fills up first.
Why do you think anybody, anywhere, cares what you expect?
Why do you think I care whether you think I understand your pathetic attempts at trolling or not?
Who would care for the opinion of someone who persists in believing their fantasy is more real than reality? I had to laugh at your response to Mike Flynn briefly commenting here recently.
As I recollect, you claimed Mike Flynn was not really commenting, that it wasn’t Mike Flynn, that it wasn’t me either, but rather some devious character pretending to be Mike Flynn just to annoy you!
Delusional? An awesome demonstration of the ability of the paranoid individual to justify their delusional belief system, when facts indicate otherwise.
Keep at it. Maybe you can somebody to indicate support for your attempts to impose your reality on the world, but. I doubt it.
Mike Flynn,
TL;DR.
Willard, please stop trolling.
New research reports on satellite evidence that the water cycle is speeding up. This is one of the expected results from the warming of the planet because warmer temperatures cause water to evaporate faster.
https://www.nature.com/articles/s41598-022-10265-1
The water cycle is the process by which water first evaporates from the Earth, rises into the atmosphere to form clouds and then falls again as rain or snow. Climate models have predicted that the water cycle could intensify by as much as seven percent for every degree Celsius of global warming.
“upper-ocean salinity stratification studies were only initiated in recent years”
So of course, we know for a fact that any trends that we find are not just recent and have never occurred before in the record.
TM,
You wrote –
“Climate models have predicted that the water cycle could intensify by as much as seven percent for every degree Celsius of global warming.”
And on the other hand, the “models” might be completely ineffective at foretelling the future.
In light of the fact that the IPCC wrote that it is not possible to predict future climate states, why do you think that the IPCC conclusion is wrong? Or do you just think that your imaginary “water cycle” is “speeding up”?
The authors admit that they are just speculating – “However, there is still some controversy as to whether the salinity is changing at the same rate as the water cycle does, as the impact of the changes in EP fluxes, meltwater runoff, and ocean warming on the salinity is not completely understood.”
E-P fluxes? No wonder nobody completely understands, At least the authors realise that Argo data is often completely useless -” Moreover, far from the coast and the poles, the ocean currents drive the locations of the floats, and, thus, the locations of the Argo acquisitions. Over wide oceanic areas, as that comprised between 60S and 60N, the averaged salinity at the Argo locations in a 9-day window evolves with time and it is very different from the temporal evolution of the mean salinity in the entire region, . . . “.
Nobody of note reads these rubbish papers, anyway, so their impact is about the same as your accumulated opinions on the matter. Zero, I assume.
maguff…”New research reports on satellite evidence that the water cycle is speeding up. This is one of the expected results from the warming of the planet because warmer temperatures cause water to evaporate faster”.
***
I invite you over to Vancouver, Canada for a dip in the ocean. In fact, I’ll drive you over to the west coast of Vancouver island so you can dip in the Pacific. If you get past dipping up to your ankles and survive the chill that will envelope your brain, you might dive straight in. If your heart is good you might survive for a few minutes, maybe even ten, but I guarantee you’ll be blue in colour by the time you emerge.
And that’s in the summer.
Gordon Robertson
How much colder is the water at Vancouver as compared to Long Beach in Washington State? I was in that water about an hour. It was cold but the crashing waves were fun.
I went in and stayed in for 20 minutes but when I first stepped in the water it felt really cold and sent a chill to my head. It was uncomfortably cold just standing in it. It was raining that day, which helped pre cool the body.
The following article claims the coastal water temperature off Vancouver Island is 9.8C. They don’t distinguish between inland water and the Pacific Ocean side. I have found the ocean to be significantly colder.
https://seatemperature.info/vancouver-island-water-temperature.html
Gordon Robertson
It looks about the same water temperature in summer months (when I went).
https://www.surf-forecast.com/breaks/Long-Beach-Peninsula/seatemp
There’s this new invention, it’s called a wetsuit. You should try it.
Tyson, please stop trolling.
La nina effect – the movie
https://youtu.be/DKvomHafAEw
But the BOM says La Nina is fading so not a problem, right?
NOAA
“There are roughly equal odds of La Nina and ENSO-neutral during the Northern Hemisphere summer, with La Nina favored for the fall and early winter 2022-23.”
Also NOAA
“The CFS.v2 ensemble mean (black dashed line) predicts La Nina to continue through the end of the year.”
BoM
“Sea surface temperatures in the Pacific Ocean have warmed slightly over the last fortnight with the NINO3.4 and NINO3 indices both now being at neutral levels. The atmospheric signal of La Nina remains strong. Most model outlooks forecast a return to neutral El NinoSouthern Oscillation (ENSO) by early [S. Hem] winter.”
JMA
“In conclusion, the La Nina conditions are more likely to continue (60%) until the end of boreal spring than not to continue (40%), and transfer to ENSO-neutral in boreal summer (70%).
After series of epic forecasting failures Bindidongs sidekick barry is back at it
Both Eben and RLH are determined to incessantly troll people on hoped for events that they have not happened yet, may not happen, and in any case have no bearing on long-term term climate change.
Weird.
I’m “back at” quoting current forecasts from a variety of institutes that monitor ENSO, as I’ve done many times in response to people posting their personal view or selecting only from one source.
Somehow Eben thinks this is a bad thing!?
Who is the fuckwit now
https://www.drroyspencer.com/2021/06/biased-media-reporting-on-the-new-santer-et-al-study-regarding-satellite-tropospheric-temperature-trends/#comment-726374
You’ve linked to me saying I don’t care if we get la Nina or not, I just report what the experts say, a variety of opinion from various groups monitoring and forecasting ENSO.
You have a problem with me referring to a variety of expert opinion?
Are you annoyed that I don’t make ENSO forecasts?
Or did you get so badly stung when I called you a fuckwit that you’ve been gnawing over the slight for a year, you’ve bookmarked the insult, and you continue to lash out like a sullen 13 year-old
with nonsensical posts addressed to me?
Eben, you’re just confirming the epithet. Loosen your grip.
https://co2coalition.org/2022/03/03/attributing-global-warming-to-humans/
“Attributing global warming to humans”
“Gillett, et al. comment that: The assumption is usually made that a models TCR [transient climate response] is proportional to its GHG-induced warming trend over the historical period. GISS-E2-H especially appears to violate this assumption, but, to a lesser extent most of the models violate it, which concerns Gillett, and colleagues. The models predict about the same warming, but very different TCR values, suggesting something is not quite right in the models. They observe that since the desired result is a multi-model estimate of climate sensitivity, the models violation of the assumption should be investigated. Thus, they admit that the connection between GHGs and warming is explicitly assumed, but the model results are not consistent with the assumption. They dont say it, but it is also possible the models are not accurate.”
If you actually read Gillette the study purports a slightly lower TCR than the IPCC range. The IPCC range is of course garnered from many papers, which report both higher and lower values than the IPCC range.
Gillette apply a principal component analysis (PCA) in their study.
I’m not up to date with ‘skeptic’ lore. Is PCA ok or not?
barry, please stop trolling.
Willard bring up a topic, why doesn’t anyone predict what Venus temperature would be, at Earth distance from the Sun?
Also what I would regard as much easier to give an answer, if Mars was completely covered with H20 snow. would the Mars surface be warmer or colder? And a little bit or a lot.
It seems to me, CO2 might cause a little bit of warmer.
And it seems anyone not hawking for money tends to agree.
Even IPCC agrees [which is hawking for money].
And snow covered Mars could also be just a little bit of warming.
Oh, I forgot, I have new question.
What was average global air temperature for last 34 million years.
I say, it’s warmer than 15 C.
It seems everyone also agree, if knew anything about the Ice Age we been in. Or if paid any attention in elemental school. Or tended to watch PBS shows. {for non-US that is government funded TV station- which over run with Lefties.
Why do you say it’s warmer? The ice ages are longer than the interglacials, aren’t they?
Because glaciation or periods which not interglacial are a lot longer but coldest time of glaciation is not a long period.
For example look at graphs, here:
https://en.wikipedia.org/wiki/Geologic_temperature_record#Overall_view
While there, look temperature over last 34 million years.
40 million to 6 million is quite warm or 34 million to 6 million quite warm, and that is an icehouse global climate, also known as Ice Age or specifically called, The Late Cenozoic Ice Age.
https://en.wikipedia.org/wiki/Late_Cenozoic_Ice_Age
Or
“Throughout Earth’s climate history (Paleoclimate) its climate has fluctuated between two primary states: greenhouse and icehouse Earth. Both climate states last for millions of years and should not be confused with glacial and interglacial periods, which occur as alternate phases within an icehouse period and tend to last less than 1 million years. There are five known Icehouse periods in Earth’s climate history, which are known as the Huronian, Cryogenian, Andean-Saharan, Late Paleozoic, and Late Cenozoic glaciations.”
https://en.wikipedia.org/wiki/Greenhouse_and_icehouse_Earth
Or here graph of last 500,000 years:
https://a.atmos.washington.edu/academics/classes/2001Q1/211/Group_projects/group_D_F00/index.html
It wasn’t graph I wanted, but it shows a lot glaciation not a cold as 20,000 years ago. Or you peak cold and peak warm.
And one keep in mind, our Holocene was roughly 8000 years ago- when had Sahara Desert was mostly grasslands with lakes and rivers and forests and Arctic ocean was ice free in terms of polar sea ice.
Or in terms of holocene interglacial period, we have past our peak- all the high spikes in that 500,000 graph.
Also it’s only last 2 million years where Greenland ice sheet was permanent. Or before 2 million years, the Greenland ice sheet would melt or would only form in coldest parts of glaciation periods.
Or last 2 million years have coldest period period- as is said, as in indicated in ice cores and all other proxy temperatures records.
So I don’t a have number, but it’s obvious the average was more than 15 C. So ask the question. What was it.
One could ask what was average for first 10 million year of the 33.9 million year period, and next 10 million, and next 10 million, and finally last 3.9 million.
I would think in last 3.9 million the average was higher than 15 C,
but last 2 million was the coldest- that is agreed by everyone.
https://www.researchgate.net/publication/275280922_Phanerozoic_Global_Temperature_Curve
Pleistocene temperatures.
http://railsback.org/FQS/FQS800katoFutureTemps01.jpg
Holocene temperatures.
http://railsback.org/FQS/FQS22katoFutureTemps03.jpg
Oh look. Hockey sticks.
See, Richard?
*That* is Climateball.
Eman is actually Bill Nye The Science Guy.
— Entropic man says:
May 5, 2022 at 2:04 AM
https://www.researchgate.net/publication/275280922_Phanerozoic_Global_Temperature_Curve —
Curious cartoon, has Impact winter as coldest period
Wiki:
“An impact winter is a hypothesized period of prolonged cold weather due to the impact of a large asteroid or comet on the Earth’s surface.”
“Although the asteroids and comets that impact the Earth hit with many times the explosive force of a volcano, the mechanisms of an impact winter are similar to those that occur after a mega-volcanic eruption-induced volcanic winter. In this scenario massive amounts of debris injected into the atmosphere would block some of the sun’s radiation for an extended period of time and lower the mean global temperature by as much as 20 C after a year.”
…
“In a study conducted by Curt Covey et al., it was found that an asteroid about 10 km (6.2 mi) in diameter with the explosive force of about 108 MT could send upward of about 2.5×10^15 kg of 1 m sized aerosol particles into the atmosphere. ….
“After the first 20 days, the land temperature might drop quickly, by about 13 C. After about a year, the temperature could rebound by about 6 C, but by this time about one-third of the Northern Hemisphere might be covered in ice.”
So global air temperature, at this time, according to this cartoon was about 22 C.
If global air temperature was 22 C, what would the global ocean surface temperature be, and global land temperature be?
forgot to give the wiki link:
https://en.wikipedia.org/wiki/Impact_winter
According to cartoon this dinosaur impact was during a global greenhouse climate, which means that instead having cold ocean of 3.5 C, it had warm ocean, but since it only had average global air temperature of 22 C, the ocean wasn’t very warm, so let’s say it was 10 C [though maybe warmer]. And say surface ocean temperature in polar region averaged about 10 C.
And tropical ocean surface like ours which averages about 26 C and 60% of rest of ocean being 18 C {ours is presently about 11 C}:
40 = 26
60 = 18
1040 + 1080 = 2120 /100 = 21.2 C
So, need a warmer land to give 22C
Or a higher ocean surface average temperature than guess above.
Or less land area. If we had 10 C ocean our sea level would be much higher, could be 100 meters higher then our present level.
Oh, well say average land around 23 C.
Just for reference, Brazil is 26 C. 1/2 land about 24 C and other half averages about 22 C. And Antarctica in different location is about 20 C {3 C cooler than Hawaii]
Anyhow land cools by 13 C, or average land is 10 C. Which is our average land temperature. How much does the average ocean surface temperature of 21 C cool by?
Tropics ocean surface with 26 C might cool to 20 C, the 18 C if rest of ocean might cool to 10 C.
So it is cooler than us, but this coolest it gets, or only has few months of it, so the year average could warmer than we are.
And average global air temperature is measure over some say, 17 years. Or fairly small volcanic eruption such as one that started Little Ice Age could cause lower less than 1 year drop in global air temperature
Also regarding cartoon, it say pre industrial was 13.8 C.
Was this the average temperature of pre industrial- if so what was coldest 30 year period, or some century long average temperature.
And our latest century long average is around 14.5 C
Wiki, Last Glacial Maximum: “Ice sheets covered much of North America, Northern Europe, and Asia and profoundly affected Earth’s climate by causing drought, desertification, and a large drop in sea levels.[1] According to Clark et al., growth of ice sheets commenced 33,000 years ago and maximum coverage was between 26,500 years and 1920,000 years ago, when deglaciation commenced,,”
So less time than the Holocene, and cartoon says it was 12.4 C-
average or coldest, not clear.
> regarding cartoon
Here’s the cartoon to which I was referring:
https://neverendingaudit.tumblr.com/post/187831869869
There’s no numbers attached to it.
Willard, please stop trolling.
> Willard bring up a topic
How about gramer, gb.
“Even IPCC agrees” with wut?
Lacking a cogent reply, Willard resorts to ad homs and insults.
‘What are social media trolls? Theyre people who deliberately provoke others online. By saying inflammatory and offensive things. They live to make people upset and angry’.
That’s an example of plagiarism, Willard. I did not cite the source. Wegman did cite Bradley once and thought it sufficient. I agree, I would not even have bothered citing him.
C’mon, Gordo.
Quit trying to make me upset and angry.
It won’t work.
C’mon Willard,
Quit telling people what to do.
You know you are powerless to make anybody do anything.
[chortle]
Is this irony, silly sock puppet?
Willard, please stop trolling.
Woeful Wee Willy,
Surely you read the IPCC reports, and know, understand, and accept their contents?
So tell me, what does the IPCC not agree with?
It certainly agrees with the utter impossibility of forecasting future climate states.
It certainly agrees that climate is only the statistics of past weather.
The IPCC certainly seems to agree with me that it has produced nothing of use to anybody relating to future weather or climate.
Keep on trying to troll. Is “wut” just another of your attempts to appear clever, or are you really semi-literate?
Carry on.
Mike Flynn,
You ask –
“So tell me, what does the IPCC not agree with?”
You will need to ask gb about that one.
Only gb knows what he’s talking about.
Aw diddums!
Whacky Willard,
So you don’t even know what the IPCC agrees with?
Or don’t you like the reality that the IPCC supports me, is that it?
You idiot, trying to wriggle your way out of your pathetic attempt at trolling doesn’t exactly make you look clever.
Time for another attempt at diversion for you, I guess.
I find your pointless “Mike Flynn” obsession quite diverting – but maybe not in the sense you might think. I don’t know what Mike Flynn might think. I don’t blame him for not commenting. When he does, you refuse to believe it’s him – or me, for that matter!
Carry on.
Why do you keep playing dumb, silly sock puppet?
Because it’s easy for you?
Still, it makes you look silly.
C’mon Willard,
Can’t you wriggle any better than that, moron?
Your transparent attempts to avoid accepting reality are pathetic. What happened to the Mike Flynn diversion – nobody interested?
Keep trying to troll – maybe you can get good at it.
Carry on.
Mike Flynn, Mike Flynn everyone!
*The crowd throws roars and throws rotten tomatoes.*
Willard, please stop trolling.
Willard are worried, I do bad “gramer” on purpose- as kind of mocking behavior?
I assure you I spell and type badly, naturally- it’s not act to demean others.
Nah, gb. In your case, it’s more a schizoid disorder.
Willard, please stop trolling.
From Willard’s link at https://quantpalaeo.wordpress.com/2014/09/03/recipe-for-a-hiatus/ which he uses to snidely comment…”That should put Gordos always worth the read comment into perspective”.
I had commented that Ross McKitrick is always worth the read but in reference to McKitrick’s analysis of the hiatus, the author claims…
***
“Fake climate sceptics love the hiatus, the period since the strong El Nio in 1998 where global mean temperature has not increased according to their simplistic notions of global warming. The longer the hiatus, the more they can deny that climate change will be a problem this century. This gives an incentive for developing methods that report the longest possible hiatus, ideally without obviously cherry-picking the start date”.
***
I might point out to the imbecilic author, that the ‘fake climate skeptics’ at the IPCC announced the hiatus from 1998 – 2012. The hiatus was announced by the IPCC in AR5, circa 2013. That’s when NOAA rushed to fudge the SST retroactively to produce a trend where the IPCC had seen none. Ironically, till 2013, the NOAA series showed the hiatus as well.
Actually, it’s not a hiatus at all. There is no proof that the warming will continue and is not a phase in the natural variability continuum.
So, I repeat, Ross McKitrick is always worth the read. Ross tells it like it is, not obfuscation climate science like climate alarmists.
> the imbecilic author
C’mon, Gordo.
Richard Telford taught Craig Loehle.
Ross is a signatory of the Cornwall Alliance Evangelical Declaration, and a talking head of the Fraser Institute:
C’mon Willard,
What are you really trying to say?
Do you think anybody, anywhere, cares?
C’mon, Mike –
Which part of “Richard Telford taught Craig Loehle” you do not get?
Do you know why I mentioned these names?
No?
That’s what I thought.
Cmon Willard,
I dont know why you mention any names – Dick, Roy, Warnie, Mike, . . .
Maybe you are just a stupid troll trying to appear intelligent.
Of course you don’t, silly sock puppet.
Maybe you just butt in without reading anything.
Like you, you mean?
Not only I read the crap you promote, dummy, but I read it before you were playing Climateball.
I don’t play at climate or ClimateBall. You do. Idiot.
Of course you do, dummy.
Willard, please stop trolling.
norman…”You should look up the physics definition of heat for yourself.
RLH is quite correct and using the proper definition.
What you claim heat is, is actually internal energy”.
***
Clausius, an expert on heat, who derived the U for internal energy in the 1st law, created the 2nd law, and derived entropy as a mathematical measure for the 2nd law, defined heat as the kinetic energy of atoms.
He also explained, that internal energy, U, in the 1st law, is part heat and part mechanical energy expressed as work. He was referring to the vibration of atoms caused by heat as energy.
**********************
“Heat is the amount of energy that is transferred when objects have different temperatures. EMR is heat energy when it flows from a hot object to a colder one and caused a temperature change”.
***
What kind of energy is being transferred, Norman? Is it electromagnetic energy, electrical energy, mechanical energy, chemical, energy, or nuclear energy. Nope. it is thermal energy, aka heat.
So, you are claiming that heat is the amount of heat transferred when objects have different temperatures.
Modernists are confusing temperature, which is a measure of relative heat levels, with heat, which is a form of energy. They are confused by the statistical definition of temperature as the average kinetic energy in a gas. That’s bs. Heat is the average kinetic energy of a gas and temperature is a human invention to measure it.
Summary…temperature, as a human invention, is a measure of heat, and heat is energy.
note: EM is not heat energy. Heat and EM have nothing in common, they are entirely different forms of energy.
Gordon Robertson
You can live in your own world with your own definitions but that is not how “heat” is defined. And temperature IS NOT a human invention, the scale is the invention not the characteristic. That is why you can use different temperature scales (the human invention) but the temperature is a property of a substance. Even if you don’t have a human scale to measure it you can still tell the difference by touching the materials. Sorry you are wrong in your philosophical understanding of reality. What is human and what is not. Time is NOT a human invention, the scale we use (seconds, minutes, hours) is a human invention. Time (rate of change) would still exist regardless if anyone measured it or not.
You are so confused in your understanding of reality. You won’t accept the current definition of what heat is (and yes EM can be heat if there is a flow from hot to cold).
You can make the claim RLH is wrong with your concept of heat but he is not wrong with the standard accepted definition of the term. Heat is the amount of energy that is transferred from a hot object to a colder one until they reach the same temperature. Energy continues to transfer but no heat does.
Minor problem, Norman.
You wrote –
“Heat is the amount of energy that is transferred from a hot object to a colder one until they reach the same temperature. Energy continues to transfer but no heat does.”
All well and good, (even if somewhat nonsensical – two imaginary objects in an imaginary infinite space would merely continue to lose energy, as their temperature dropped to absolute zero), but how do you justify your assumption that “energy continues to transfer”?
I agree with Richard Feynman said “It doesn’t matter how beautiful your theory is, it doesn’t matter how smart you are. If it doesn’t agree with experiment, it’s wrong.”
So what experiment supports your speculation? I’m not disagreeing with you, I’m just curious as I can’t think of any experiment which you could perform which wouldn’t change the energy exchange, because you would have to upset any thermal equilibrium with the measuring instrumentation.
Imaginary experiments do not count, of course. You might care to read up on Heisenberg’s uncertainty principle, in relation to measurement or observation affecting the phenomenon under observation, before you respond.
Thanks.
Swenson
Are you seriously wanting an answer or are you trolling?
Norman,
I’m pretty sure you can’t devise an actual experiment, as I indicated.
The fact that you haven’t presented any has justified my assumption. If you don’t want to answer, I understand.
Rather like someone showing that reducing the amount of radiation reaching a thermometer results in the thermometer getting hotter!
Easy to claim, not so easy to demonstrate by experiment.
I couldn’t do it, and I don’t believe you can, either.
norman…”You can live in your own world with your own definitions but that is not how heat is defined”.
***
I offered the definition of a renowned expert and authority on heat, Clausius. I accept it because it makes eminent sense compared to modern definitions which are contradictory and plain silly.
As I explained to you, your definition suggests that heat is a transfer of itself. You are confusing heat with a generic energy that has no existence.
Gordon Robertson
I am not confusing anything. The current accepted definition of heat has been given to you. Words are arbitrary inventions by humans. What they represent are not. The word “water” is a human invention to allow communication of a substance the word refers to.
You are confused to think that you use of the word “heat” is for some reason better than the rigid use of the word in modern science.
It is not “my” definition of “heat”. It is the accepted definition of the word as used in science so that when used in physics papers the other scientists know what is being discussed.
Robertson Read this and stop being so (expletive deleted) obtuse: https://ddears.com/2021/01/12/dr-happer-explains-effects-of-co2/
If you want to participate in discussion about climate you must have a firm grasp on the material Happer is presenting.
ken…I am deliberating on EM because I have studied it in depth as the basis of electronic/electrical theory. I learned to be precise about its application and I expect precision from scientists talking about it.
I have nothing against Happer per se, I regard him as being a skeptic of catastrophic warming/climate change and that’s good enough for me. I just disagree with his manner of presenting the science. Normally, I would agree to disagree but you are pushing Happer so hard I feel compelled to respond to some of your authority figure’s claims. Again!!!
several points of disgreement…
1)”At the mean distance of Earth from the Sun, sunlight carries an energy flux of about 1,360 Watts per square meter (Wm-2). We are familiar with this flux, part of which warms us when we sunbathe at the beach on a cloud-free summer day”.
***
This statement is in error. We need to be precise, it’s not a generic energy flux, it’s an electromagnetic energy flux. Even at that, what is meant by flux. Newton used it initially as the derivative of an equation representing a quantity. That makes it the instantaneous change of a field or whatever at a particular time.
Just found this on wiki….
“If electromagnetic energy is not gained from or lost to other forms of energy within some region (e.g., mechanical energy, or heat), then electromagnetic energy is locally conserved within that region, yielding a continuity equation as a special case of Poynting’s theorem:
grad.S = -du.dt
where u is the energy density of the electromagnetic field. That’s what I have been trying to say, EM acts like potential energy unless it is being produced by matter or absorbed by it.
EM flux cannot be measured in w/m^2 since the watt is a definition of mechanical energy and is related to kinetic energy. In fact 746 watts = 1 horsepower, a rate of doing work. They use watts to measure heat because Joule discovered an equivalence between mechanical work, measured in joules and heat measured in calories. When you see heat defined in watts/m^2 it is a value equivalent to mechanical energy.
The reason Happer’s statement is wrong is because EM cannot contribute to any warming before it is absorbed by a mass. The watts/m^2 is a reference to the heat produced in a metre of surface area by the EM but the process of creating the heat involves electrons and their orbital properties in atoms, not the EM per se. The EM acts to excite the electron forcing it to a higher energy level. It is the change of kinetic energy that represents the heat.
EM is lost during the conversion and heat is produced as kinetic energy.
Claiming that solar EM has a heat of so many watts/m^2 is simply wrong. It can produce a different form of energy measured in w/m^2 but as a field, it does not have that property.
Therefore, it’s not the EM that heats your skin, it’s the conversion of EM to heat by electrons in atoms, by exciting electrons in your skin, that causes the heating.
***VERY important point****
Solar flux is absorbed because human skin is much cooler than the source. If the same human skin is exposed to the IR of ice, nothing happens because the IR is not absorbed. 2nd law. Therefore EM can contact mass and cause no heating, so what happens to its alleged w/m^2?
Small point re the EM, but unless it is clearly understood the error leads to larger mistakes later.
******************************
2)”The representative decrease of clear-sky thermal radiation to space from doubling carbon dioxide concentrations, 3 Wm-2, is an important number to remember”.
***
a)Happer is using the term ‘thermal radiation’, which is an oxymoron. It suggests a radiation of heat, which is impossible. Call it what it is, electromagnetic energy, a phenomenon made up of an electric field perpendicular to a magnetic field and having no mass. Without mass, as in a pure vacuum, there can be no heat.
b)Again, you cannot measure EM in watts or w/m^2. Happer is referencing heat. He is somehow referencing the rate of heat loss at the surface.
There is simply no way to measure the amounts he is referencing unless you have a means of equating the rate of heat loss to a trace gas. Seems Happer has bought into that mythical theory.
3)”The emission rate of thermal radiation by cloud tops or by land and ocean surfaces is proportional to T4, the fourth power of the absolute temperature T”.
***
That’s an assumption and it’s wrong. Gerlich and Tscheuschner, two expert in thermodynamics, give a good explanation why. Basically the constant of proportionality, sigma, is not a universal constant. It applies only to the original Tyndall experiment in which he electrically heated a platinum filament between about 600C and 1500C.
Stefan’s equation, the basis of S-B, would not have been possible had the colours produced in Tyndall’s filament not change with increasing temperature. He could never have gotten the relationship using invisible IR. In fact, in the day of Stefan, scientists believed heat could flow through the atmosphere as rays.
************************
“Quantitatively, one finds that for temperate latitudes, greenhouse gases decrease the radiation flux to space by a factor of about 0.70. Because of the 𝑇^4 law for thermal emission by black surfaces, one could get the same decrease of flux by removing all greenhouse gases….”
***
Not a shred of evidence to support this claim. The graphs he uses are pseudo-graphs in the sense they are not measured by real instruments. That is obvious since the CO2 spectrum is overlaid by the water vapour spectrum and there is no way to measure the effect of CO2 directly.
If you read on, Happer uses models and a reference to a Schwarzchild identity. Schwarschild was a looney who promoted Einstein relativity to the point of the ridiculous.
************
This is enough to get my point across, if indeed it gets across, which I doubt. Happer has obviously bought into the GHE/AGW theory but he is minimizing the catastrophic effects claimed. Other than that he’d make a good alarmist.
sorry…typo…
grad.S = -du.dt should be grad.S = -du/dt
Gordon Robertson
YOU: “Thats an assumption and its wrong. Gerlach and Tscheuschner, two expert in thermodynamics, give a good explanation why. Basically the constant of proportionality, sigma, is not a universal constant.”
What support do you have that either of these two are experts in thermodynamics. Gerlich is a teaches mathematical physics. Why does that make him an expert in thermodynamics? Are you just making things up to support your ideas or do you have a document that shows thermodynamics was his chosen field of study?
Also you say they have a good explanation that sigma is not a universal constant. They come up with a graph and do not explain much on how it was derived or what the units mean. Can you elaborate on this, I have not been able to grasp how they are proving the constant is not universal. They have units CGS on the Y-axis. What is that referring to? They give a couple equations that does not explain much. You are certain they proved sigma is not universal. I do not think it is clear enough to follow.
Norman
Robertson is a persistent liar who distorts everything until it fits his egomaniac narrative – regardless what he is ‘talk’ing about (lunar spin, time, relativity, Clausius, etc etc etc).
The most typical example of his manipulations is R.G. Wood, an eminent specialist in visible and near-visible light (UV and nearest IR), who suddenly became a century later an ’eminent specialist in IR’ – and even in CO2, look look !!
Wood did nothing else than to write a 1.5 (in words: ONE AND A HALF) page long report about his trial to contradict Arrhenius, published in 1909 in the The London, Edinburgh, and Dublin Philosophical Magazine and Journal of Science (under paywall).
Here is the text:
https://drive.google.com/file/d/1MeAr0BeiFDwoknith1mb-rzvnYsoDvpM/view
No one knows how it is possible to give any credit to such a short, private opinion, above all one ending with:
” I do not pretent [original 1909 text] to have gone very deeply into the matter, and publish this note merely to draw attention to the fact that trapped radiation appears to play but a very small part in the actual cases with which we are familiar. ”
If Arrhenius or one of his successors had ever written such a short, superficial ‘report’ about CO2’s effect, Robertson would have been the very first one to endlessly denigrate it.
*
Moreover, many people, among them Dr Roy Spencer and Stanford’s Computer Science Emeritus Vaughan Pratt (woefully discredited on this blog by the same Robertson) have shown that Wood was wrong.
The one and only person who presented results similar to Wood’s experiment was Nasif Nahle.
Whether or not Spencer or Pratt or anyone else did in turn contradict Nahle is not known to me.
Norman, since you’re into “support” this morning, did you ever fine any science support for your nonsense that:
1) Earth has a “real 255 K surface”, and
2) Two 315 W/m^2 fluxes can heat a surface to 325 K
Remember, you claimed that you ALWAYS support your claims.
Thanks.
Buzz off Clint; you have no clue.
Ken, you have NOTHING.
Until you can contribute some actual science, you’re just another worthless troll.
Perhaps if you don’t like the article for laymen, you’d prefer the original. Please check the maths for errors and let us know:
https://wvanwijngaarden.info.yorku.ca/files/2021/03/WPotency.pdf?x45936
Just because you don’t understand it doesn’t mean its wrong.
Interesting.
So, there is some hope of warming Earth.
ken…”Please check the maths for errors and let us know:”
***
The first error came near the beginning of the paper under section 3 – Line Intensities…
Note that the argument is purely mathematical with nothing to relate CO2 to warming. At that, they have gotten the math wrong, and the concept of a Bohr frequency as they use it is applied incorrectly. This mathematical argument presumes an absorp-tion of EM, which they do not state and that it is subject to the 2nd law.
They say, “Fig. 2 illustrates the greenhouse gas lines considered in this work. The Bohr frequency ful for a radiative transition from a lower level l of energy El to an upper level u of energy Eu of the same molecule is denoted by
ful = Eul/hc
where the energy of a resonant photon is Eul, h is Plancks constant and c is the speed of light”.
***Note that I have taken the liberty of writing the frequency, nu, with f so it will be accepted by WordPress formatting.
Bohr’s formula for an electronic transition, WITHIN AN ATOM…NOT A MOLECULE…is E = hf. Note that I have taken the liberty of writing the frequency, nu, with f.
There is no c involved for the simple reason that Bohr’s transitions take place without a time element. The electron during the transitions has no speed, based on c or anything else. It’s a quantum condition stipulated by Bohr to make sense of the electron orbital, so it won’t lose momentum.
I know you don’t want to hear this but it relegates Happer and his co-author to the hacker role. This error is an egregious error indicating they know nothing about Bohr or basic quantum theory created by Bohr for a single electron orbiting a nucleus (hydrogen).
Meantime, circa 1909, R. W. Wood, who was a world renowned expert on gases like CO2, and who was consulted by Bohr on sodium vapour, wrote a brief paper in which he claimed he could not see how atmospheric CO2 could affect atmospheric temperature.
https://web.archive.org/web/20160408103736/https://www.ilovemycarbondioxide.com/pdf/Note_on_the_Theory_of_the_Greenhouse.pdf
“Is it therefore necessary to pay attention to trapped radiation in deducing the temperature of a planet as affected by its atmosphere?
The solar rays penetrate the atmosphere, warm the ground which in turn warms the atmosphere by contact and by convection currents. The heat received is thus stored up in the atmosphere, remaining there on account of the very low radiating power of a gas. It seems to me very doubtful if the atmosphere is warmed to any great extent by absorbing the radiation from the ground, even under the most favourable condition”.
Hate to tell you Gordon, but Bohr’s work on the hydrogen atom has been extended to molecules with the discovery of molecular orbitals.
https://en.wikipedia.org/wiki/Molecular_orbital_theory#:~:text=Molecular%20orbital%20theory%20was%20developed,called%20the%20Hund%2DMulliken%20theory.
bobdroege, please stop trolling.
“If the same human skin is exposed to the IR of ice, nothing happens because the IR is not absorbed. “
So … if you are surrounded by walls at 30 C (a warm room) or 0 C (ice) or -78 C (dry ice) or -196 (liquid nitrogen temperature), are you truly claiming your bare skin would feel just as warm in all these settings. We can assume you are standing in air at 20 C in all cases.
I guarantee you will feel rather warm in the first case, and rather cold in the last. The net loss from your skin is about
* 40 W/m^2 in the warm room
* 200 W/m^2 in the ice room
* 400 W/m^2 in the dry ice room
The ONLY difference is the IR from the cooler surroundings. If “nothing happens”, then all of these would feel equally as warm.
Folkerts, tell us about how you can boil water with ice cubes.
That’s when it really gets funny.
tim…if your bare skin is in an ambient temperature of 20C and you are exposed to ice or dry ice, your skin will not warm. That’s what I am saying. If anything, it will cool.
— Tim Folkerts says:
May 5, 2022 at 11:17 AM
If the same human skin is exposed to the IR of ice, nothing happens because the IR is not absorbed.
So if you are surrounded by walls at 30 C (a warm room) or 0 C (ice) or -78 C (dry ice) or -196 (liquid nitrogen temperature), are you truly claiming your bare skin would feel just as warm in all these settings. We can assume you are standing in air at 20 C in all cases. —
This is correct.
A human body controls it’s temperature with evaporation heat loss- with human what matters is how dry the air is.
Using human is bad idea.
But a brick’s temperature will also controlled by the air temperature.
“Using human is bad idea.”
For those not aware of the intuitively obvious, your skin has a built-in thermometer. It signals your brain so that when you go into a cold room, you will want to put a coat on and when it is 40 C outside, you will want to strip down to your birthday suit.
“Specialized sensory receptors called thermoreceptors are responsible for temperature sensitivity. These thermoreceptors are located in the dermis of the skin. A cold environment results to lesser blood flow near the surface of the skin. Thus, the body feels colder. The opposite occurs when a person is in a hot environment or when a fever breaks.”
Clint says,
“Folkerts, tell us about how you can boil water with ice cubes.”
Except Folkerts has never said this. And has said no to thee idea.
Who, apart from Clint, has actually ever said this?
It’s just Clint, isn’t it?
barry, please stop trolling.
gbaikie says: A human body controls its temperature with evaporation heat loss- with human what matters is how dry the air is.”
A human body ATTEMPTS to control its temperature. I assure you that skin can and does cool below 37 C depending on external conditions.
And one of those external conditions is radiative heat loss/gain.
“But a bricks temperature will also controlled by the air temperature.”
No. It is controlled by ALL the factors related to heat loss/gain.
If the brick is in a bubble of 20 C air, but exposed to direct sunlight, it will get much warmer than 20 C. Similarly, if the brick is in a bubble of 20 C air inside a -30 C freezer, the brick will be cooler than 20C.
Gordon says: “If anything, it will cool.”
Yes!
Exposed to 20 C, the skin will be warm.
Exposed to 0 C, the skin will be cooler.
Exposed to -80 C, the skin will be cooler yet.
Or in reverse, if you start with -80 C all around, the skin will be cool. When you add the radiation from 0 C ice, ths skin warms up a bit. When you add the radiation from the 20 C room, the skin warms up even more. That is because radiation is absorbed by the skin, even when your skin is above 20 C and the sources of radiation are less than 20 C!
Tim, please stop trolling.
“Basically the constant of proportionality, sigma, is not a universal constant.”
Bullshit.
Sigma is proportional to Boltzmann’s constant to the fourth power and inversely proportional to the speed of light squared and Planck’s constant to the third power.
Thus, as of the 2019 definitions of the SI base units, it is known exactly.
bob d…you have been hanging out in the field with the sheep again, haven’t you? The S-B proportionality constant is based on the temperature range in which Tyndall’s experiment was based. That was 525C – 1200C.
Only an idiot would presume the T^4 derivation over that range would apply outside the range. Or, someone who spent far too much time in a field with sheep.
sorry…meant to include a link explaining how Stefan worked it out…
http://www.applet-magic.com/stefanlaw.htm
Gordon, you must be smoking crack again.
Look what I found in your source!
“Stefan’s conjecture happened to be correct and in 1884 Ludwig Boltzmann published a derivation of the fourth power law”
You understand the difference between theoretical evidence and experimental evidence?
Read this
https://en.wikipedia.org/wiki/Stefan%E2%80%93Boltzmann_law
Welcome the the 21st Century.
Gordon Robertson
YOU: “Only an idiot would presume the T^4 derivation over that range would apply outside the range. ”
More likely only and idiot would think that no further experiments and tests were done on the Stefan-Boltzmann relationship over the next 143 years since it was derived.
Gordon you really sound stupid when you gab on about things you know nothing about and pretend to be the expert. If you continue on this mindless path you might end up as dumb as the bot that goes by Clint R. You may lie a lot and believe any lie you find on the Internet but so far you do not see quite as stupid as Clint R. But you will be that dense soon if you keep believing your own nonsense without question. You might even start believing fluxes can’t add nor can energy be absorbed by a hotter object. You might even believe the Moon does not rotate and that Moon phases are caused by the Earth shadow. You might think Putin has justification to kill, maim, torture innocent civilians in pursuit of some non-existent NAZI’s that exist in Putin imagination.
Norman, no matter how severe your meltdown is, or how much you’re exposed as a phony, you always are thinking about me. That’s exactly how it should be.
If you ever settle down, did you find any science support for your nonsense that:
1) Earth has a “real 255 K surface”, and
2) Two 315 W/m^2 fluxes can heat a surface to 325 K
Remember, you claimed that you ALWAYS support your claims.
But you’re a phony that can’t cut it.
Clint R
A very stupid poster calling me a phony. A poster so stupid they cannot understand anything but have a bunch of idiot responses (like “meltdown”, “link you don’t understand”)
I have already addressed your points. You are so stupid you can’t understand the points and keep bringing them up like a braindead bot.
If you are a human act like one. Show a little sign of thinking ability and learning. You show nothing but seem to have an insult routine you use to annoy people and attempt to elicit responses. Weak AI programming. Highly repetitious.
As stated you are either a very stupid human or a weakly programmed bot (too repetitive). Ken said it best “Buzz off Clint; you have no clue.”
Norman, I’ve enjoyed your meltdowns. But now that you’ve proven yourself to be such a phony, they’re even more enjoyable.
Bob already told you of his policy not to chew his cabbage twice, Pup.
What are you doing in his subthread?
Willard, please stop trolling.
We have discovered the Planet Surface Rotational Warming Phenomenon.
The Planet Surface Rotational Warming Phenomenon states: Planets’ mean surface temperatures relate (everything else equals) as their (N*cp) products’ sixteenth root.
The discovery has explained the origin of the formerly observed the planets’ average surface temperatures comparison discrepancies.
Earth is warmer than Moon because Earth rotates faster than Moon and because Earths surface is covered with water.
What we do in our research is to compare the satellite measured planetary temperatures. We call it “The Planets’ Surface Temperatures Comparison Method”.
A faster rotating planet accumulates much more solar energy, than a slower rotating one.
https://www.cristos-vournas.com
Again ….
1) The general impact of rotation and heat capacity has long been known:
The faster the rotation, the more uniform the temperature.
The more uniform the temperature, the higher the average temperature.
The higher the heat capacity, the more uniform the temperature.
The more uniform the temperature, the higher the average temperature.
2) The “16th root” is an empirical result, with no theoretical basis. In particular:
* a non-rotating planet (N=0) would have a predicted temperature of 0 K
* a rapidly rotating would have unphysically high temperatures. For example a small asteroid with the same cp and a as earth but spinning 1 rev per second would be more than 2x as hot as earth. Well over 550 K (275 C; 550 F)
So you have a questionable fit to a well-known phenomenon.
Folkerts, got a valid reference for your 315 W/m^2 fluxes raising a surface to 325 K?
That’s like two ice cubes heating something to 125F. With enough ice, you could boil water.
” Earth is warmer than Moon because Earth rotates faster than Moon… ”
What? The Moon rotates? That can’t be, that’s heresy, that’s definitely the way to the stake.
Please, Binny.
How many times do you think I could have answered
“Please, Willard.”
to comments you made that I thought were irrelevant or superfluous?
Irrelevance and superfluity are the lesser of my concerns here, my dear Binny.
What will happen if your baiting works?
Willard, please stop trolling.
Binny STILL can’t understand the simple motion of Moon.
CV is talking about a lunar day as compared to an Earth day.
It’s not hard to follow, unless one is braindead.
” CV is talking about a lunar day as compared to an Earth day. ”
Yes he does!
But… Vournas write ‘rotates‘ and not ‘orbits’. Why?
Oh Noes!
A bit below you read the same heresy, but formulated even a bit more clearly!
” Earth is on average warmer than Moon not only because of the Earth having 29,53 times faster rotational spin. ”
Oh poor Vournas! Now, he is definitely ready for Inquisition…
I’m horrified.
Bindidon, please stop trolling.
Yes the stake, while listening to Chartmaster turned up to 11 I say.
… and looking at some nice pictures like this, hu?
https://c8.alamy.com/compde/c463c5/folter-unter-den-augen-der-inquisition-c463c5.jpg
bobdroege, Bindidon, please stop trolling.
… says a major troll of this blog.
Bindidon, please stop trolling.
binny…”But Vournas write rotates and not orbits. Why?”
***
Christos did not indicate what the Moon was rotating about. He certainly did not claim it was rotating about a local axis. Clint has it right, Christos is comparing lunar days to Earth days. The former is caused by the Moon performing curvilinear translation without local rotation while the Earth actually rotates on a local axis.
What else but lies should we expect from a guy who keeps sucking Putin’s cock, and invents Nazis in Ukraine but closes his eyes about Nazis in Germany, Hungary, the whole America (including Canada of course) ???
I repeat Vournas’ words:
” Earth is on average warmer than Moon not only because of the Earth having 29,53 times faster rotational SPIN. ”
You are not only a cowardly liar, you are also completely dense, Robertson.
Bindidon, please stop trolling.
It seems unimaginable, sitting here today, that this paper was met with a lot of skepticism more than sixty years ago.
TM, what do you believe is controversial about it?
Did you not understand the atmosphere has different temperatures, typically decreasing with altitude?
In other words, the author has disqualified CO2 as having no significance.
Thank you, Tim, for your respond.
“So you have a questionable fit to a well-known phenomenon.”
Let’s demonstrate the Planet Surface Rotational Warming Phenomenon on the:
Earth’s /Moon’s example
Earth is on average warmer 68C than Moon.
Earth and Moon are at the same distance from the sun. But Moon receives 28% more solar energy than Earth, because Moon’s average surface Albedo is significantly lower (Moons Albedo a =0,11 vs Earths Albedo a =0,306).
Yet Earth is on average warmer 68C than Moon.
The average surface temperature difference of 68C can be explained only by the Planet Surface Rotational Warming Phenomenon.
The 4th root powers twice is an observed the Rotational Warming (N*cp) in sixteenth root power phenomenon when planet mean surface temperatures comparison ratios with the coefficients is compared.
Please visit the page Earth/Mars 288K/210K
The entire thread there is devoted to the planets mean surface temperatures comparison. And every time for the compared planets the (N*cp) in sixteenth root is necessarily present.
I would like your opinion on that.
Link:
https://www.cristos-vournas.com/445868922
N = 1 rotation /per day, is Earths sidereal rotation spin
cp.earth = 1 cal/gr*oC, it is because Earth has a vast ocean. Generally speaking almost the whole Earths surface is wet.
Earth is on average warmer than Moon not only because of the Earth having 29,53 times faster rotational spin.
Earth also has a five (5) times higher average surface specific heat (for Earth cp.earth = 1 cal/gr*oC, it is because Earth has a vast ocean; and for Moon cp.moon = 0,19cal/gr*oC its soil is a dry regolith).
Earth is warmer than Moon not because of Earth’s very thin atmosphere trace greenhouse gasses content. Earth is warmer because its surface has 155,42 times higher the (N*cp) product than Moons surface.
Earth(N*cp) /Moon(N*cp) = (29,53/1)*(1/0,19) = 155,42
If Moon had Earth’s albedo (a=0,306), Moon’s mean surface temperature would have been 210K.
As we know, Earth’s mean surface temperature is 288K (15C). Earth is warmer because its surface has 155,42 times higher the (N*cp) product than Moons surface.
Let’s compare the Earth’s and Moon’s (for equal average Albedo) the mean surface temperatures:
Tmean.earth /Tmean.moon = 288K /210K = 1,3714
and the Earth’s and Moon’s (N*cp) products sixteenth root:
[ Earth(N*cp) /Moon(N*cp) ]^1/16 = (155,42)^1/16 = 1,3709
The results (1,3714) and (1,3709) are almost identical!
It is a demonstration of the Planet Surface Rotational Warming Phenomenon:
Planets’ mean surface temperatures relate (everything else equals) as their (N*cp) products’ sixteenth root.
https://www.cristos-vournas.com
I have made my proxy ensemble plotting tool available on Goggle Sheets at the following link (v0.9.0):
https://docs.google.com/spreadsheets/d/16EG0SuYIhGMOtA-b6IW8-iWMnSFG7asEhavjQaOAw90/edit?usp=sharing
You will need a Google account to create a copy that you can edit yourself.
Alternatively you can download an .xlxs or .ods file and open it locally with the spreadsheet app of your choice, with or without a Google account. This breaks the plots on my computer (I’m running Ubuntu Linux and neither Gnumeric nor Libre Office Calc translate the charts properly.) Genuwine Microshaft Windoze products may yield better results, for my edification let me know if that is the case.
If there is sufficient interest I will share future versions containing additional features, data and better documentation. I will also happily take requests for same.
Have fun!
Biondi PDO 1999
https://climatedatablog.files.wordpress.com/2022/05/biondi.jpeg
NOAA PDO Current
https://climatedatablog.files.wordpress.com/2022/04/pdo-1.jpeg
Shen PDO
https://climatedatablog.files.wordpress.com/2022/05/shen.jpeg
You tell me which looks more ‘correct’ and why.
You want details of other, checkout https://climatedatablog.wordpress.com/
I forgot
MacDonald PDO 2005
https://climatedatablog.files.wordpress.com/2022/05/macdonald2005.jpeg
Richard,
All of these except ERSST PDO are already included as well as most/all the others you mention further up in comments. (I have what you call Biondi 1999 as 2001 as that’s how the citation reads in the data file.) Look under the Indices tab. Let me know if I missed any and I’ll be happy to add them to the next release.
Alternatively you can add them yourself to the Indices tab. Simply copy an entire existing column and fill it with the new data. (Adding temperature data is a little more involved as you need to copy formulae and data in two separate tabs, positioned in the exact same columns, but it’s not too difficult.)
Richard,
https://imgur.com/gallery/NI5sngS
Shen 2006 has the best correlation to instrumental data and to my 45-member temperature ensemble so it would be my pick.
Mine too.
I have Biondi as
https://imgur.com/a/Qzxe60W
Biondi, F., A. Gershunov, and D.R. Cayan, 2001,
North Pacific decadal climate variability since AD 1661,
Journal of Climate, Volume 14, Number 1, January 2001.
I should note that the majority of your series are Northern Hemisphere or PDO related yet you mostly compare then to global data. Though to be fair, you also include NH only instrument data as well as global so this treatment overall has a NH bias.
Have you found any correspondence (other than Shen) between your other PDO series and instrument or NOAA data?
Shen 2006 on my website
https://climatedatablog.files.wordpress.com/2022/05/shen.jpeg
Biondi on my website
https://climatedatablog.files.wordpress.com/2022/05/biondi.jpeg
NOAA PDO on my website
https://climatedatablog.files.wordpress.com/2022/04/pdo-1.jpeg
RLH
Is that not a bit brazen to compare your trivial schoolboy plots with the immense work done by Brandon R. Gates?
You have an explanation why a ‘trivial’ 15 year low pass shows up cycles that his PDO plots of proxies don’t?
Remember, that is any cycle of 15 years or greater as that is what low pass filters show.
I chose PDO because that is available in both proxy and current forms.
I have most of the other on my site too. None of them show any cycles in the proxy series that other temperature series that overlap them do. Why is that?
RLH
Try to replicate and to criticize Gates’ job, instead of hand waving with your trivial low pass stuff.
You do NOTHING else than downloading data and posting uploads of charts containing nothing else than that data together with your low pass filters.
Stop claiming what you guess is wrong in Gates’ work, and start proving it’s wrong by doing OWN work!
*
You just need to download his xlsx file and to produce your own view of all what Gates has shown.
And THEN we will see what you really were able to do.
So low pass is trivial is it? Strange how it shows up things that people wish to bury.
Like the fact that adding together proxy series produces a hockey stick that fails to replicate what other temperature series clearly show.
You do nothing other than downloading data and posting uploads of excel charts of them.
“You just need to download his xlsx file and to produce your own view of all what Gates has shown.”
Would I replicate what he has done? Simply adding together proxy series, as he has done, is the wrong way to go. All it will do is cover up any cyclicity in those series and produce a straight line. Just as he has done.
It doesn’t match with contemporary non proxy series but who cares about verification if a hockey stick is the result?
Oh noes, Richard is not playing Climateball again!
Richard,
I make no representation that taking the simple unweighted mean of a bunch of proxies is a “correct” method with any “scientific” validity or purpose. This project started as a what would happen if venture. I personally gained some interesting information: big error bars but a composite that does indeed look like Mannian recons.
I think that should tell you something about the fidelity of Mann’s work to reality, but I recognize the rules of this game preclude you from doing so.
“I make no representation that taking the simple unweighted mean of a bunch of proxies is a ‘correct’ method with any ‘scientific’ validity or purpose”
I am not surprised. Leaving in the weather and annual noise like Mann just means that it becomes overwhelming in the final result and just, as I have said before, creates a hockey stick.
Simple low pass filtering (you can use LOWESS if you prefer) removes the noise and leaves the signal exposed. I chose 15 years as the corner frequency for 2 main reasons.
1. There is a sweet spot in the frequency band where little energy is present.
2. It is far enough away from 30 years (often used as a reference period) to not suppress anything of interest there.
I chose gaussian and S-G as the best low pass filters around with minimal side effects that there are in engineering. LOWESS is the realm of statistics but essentially does the same thing.
What it does expose is the fact that there is no commonality between the proxy series you have chosen which should tell you something. They don’t even match the accepted temperature series in their overlap portions.
This is about understanding what is deficient in the previous work, not championing something else just for the sake of it.
Willard: Only you thinks that ‘ClimateBall’ is relevant to anything.
Your charades are silly, Richard. Your posturing is also silly. You might be able to know how to drown a signal in some cycle nuttery stuff, but for everything else you are no better than most contrarians here. So get off your high horse.
Welcome to Climateball!
Willard: How you get a low pass to ‘drown out’ a long term signal is not explained. Ever. Idiot.
Have you worked out yet how many of the quoted proxy series are PDO and how many are NH only?
Richard says that a filter does not filter.
Willard does not understand how low pass filters work.
Mind you. Willard probably thinks that LOWESS is ok because it is ‘stats’.
Richard believes that no climate scientists ever used low-pass filters:
https://citeseerx.ist.psu.edu/viewdoc/download?doi=10.1.1.173.2002&rep=rep1&type=pdf
So its OK for Mann (40 year low pass) but not OK for me (15 low pass)?
Willard is an idiot for sure.
P.S. I use S-G of the same corner frequencies to overcome most boundary conditions, as is common elsewhere in engineering. Pity that Mann did not apparently study that discipline.
Richard believes that to smooth data is to reveal its secrets.
And the secret of all the secrets, according to him, is cycles all the way down.
It’s all sinusoidal, so it’s beautiful, it’s true, it’s real.
Science like the good ol’ days, when what was above was like Saul Below.
I believe that what is left after low pass filters should correspond one with another if the data in 2 series is coincidental or is caused by the same overall drivers. That is what happens in the real world. It is called verification.
Willard does not understand that pure cycles have nothing to do with it. The combination of all cycles below a given frequency is like a fingerprint. It is either there, in which case the series show the same characteristics, or it isn’t, in which case they don’t.
Ever wondered why RSS and UAH show the same patterns after treatment with a 7 year low pass or GISS and Had5 show the same patterns after a 5 year low pass? Coincidence? Give me a break.
….after a 15 year low pass….
https://imgur.com/a/kBWkgNf
for all 4
Has Richard ever wondered that comments that start with “Has X ever wondered” might not be the best way to convince anyone but himself that he’s not playing Climateball?
So why is it that what I said is true?
Why is Playing Questions Richard’s main Climateball strategy?
Connoisseurs might appreciate the beauty of asking a rhetorical question while begging another one!
Why is it that Willard is an idiot?
“[W]e employ a Matlab routine which uses a 10 point Butterworth lowpass filter of specified cutoff (half-power) frequency f0 for time series smoothing.”
Others use a gaussian or S-G function which achieves the same thing.
Why does Richard fail to admit that scientists are not as dumb as he pretends they are?
Because he’s playing Climateball, that’s why!
Why is Willard as dumb as he is? Because he is an idiot.
Amazing job. Thank you for that!
Maybe you’ll have some time for a description.
You should publish the link such that it is free for modification, otherwise Google Docs probably will send you automatically emails from interested people – with their real address! And not with a virtual address hiding them.
I experienced that last year in Google Drive, as I forgot to make a png file visible for everybody: I really obtained an email from a commenter who tried to open the link I posted!
For Linux users, I think the best is to use Chrome instead of Firefox.
You don’t do irony do you? Yet another hockey stick that does not show cycles that other temperature series do (even GISS).
https://imgur.com/a/rMC9Nhs
And Had5
https://imgur.com/a/92ods8T
> Yet another hockey stick that does not show cycles that other temperature series do (even GISS).
We’ll do this one again, Richard, except cleaner and more zoomed in since you didn’t seem to get the memo previously:
https://imgur.com/gallery/832sUn3
Coefficient of determination (R^2) = 0.66, and Pearson’s correlation coefficient = 0.81, which ain’t too shabby. Just eyeballing it, your low pass filters would also probably give good agreement. You should try it *and post them in the same plot* so we can actually compare them.
See above. If the proxy series don’t match one with another, what is the point of adding them together?
Why don’t you remove 1/3 of the proxy series randomly until they do or do not match the temperature series and see what you are left with. You will need to do multiple runs to do that of course.
That way you will find those proxy series that best agree with other non proxy series.
Richard,
https://imgur.com/gallery/JoYmEWK
The data: https://tinyurl.com/yp6rhmtm
I am mostly interested in proxies which can be matched to instrument data during their period of overlap. When treated with a low pass filter, say 15 years, they should all show the same broad characteristics regardless if they are proxies or instrument based.
Those that do not are to be considered rejected or reasons given as to why they differ.
Richard,
> I am mostly interested in proxies which can be matched to instrument data during their period of overlap.
You have the data, I suggest you do your own rankings if you don’t like mine.
The blog keeps eating my longer comments so I have prepared a note which includes various plots inline with the text.
https://tinyurl.com/3y9pmayk
Can you match your proxies to these?
https://imgur.com/a/kBWkgNf
P.S. Instrument data does not occur before the 1800s.
“I suggest you do your own rankings if you dont like mine.”
OK. Anything that does not match to Had5 and/or GISS in their overlap period is out.
That means that most of your PDO proxies are out. See my website for details.
That also means that a lot of your other proxies are out too. See my website for details.
Note differences between RSS/UAH and Had5/GISS over the peaks in their datasets.
Look in particular at the peaks at 1998-1999, 2016-2017, 2020-2021 on both sets. Why are there significant differences in values between those peaks between satellite and ground?
It would seem that Had5/GISS has a higher trend than RSS/UAH over that period.
RSS and UAH have a differential between 2002-2008, mainly down to the satellites chosen by each as Roy has mentioned before.
https://www.woodfortrees.org/plot/uah6/to:2002/plot/rss/to:2002/offset:-0.22/plot/uah6/from:2008/plot/rss/from:2008/offset:-0.45/plot/uah6/from:2002/to:2008.1
Richard,
The blog doesn’t like something in my response to you and is again eating my replies. Go to my open notebook on this thread and jump to Jump to “Update 5/6/2022 6:15 PM” for the relevant images and comments:
https://tinyurl.com/3y9pmayk
Brandon: Try this as a response from some of my earliest work on just this subject.
https://climatedatablog.wordpress.com/2014/02/19/first-post/
This has 2 figures that are worth consideration in this respect Fig8 and Fig9.
https://imgur.com/a/UgGr7Cj
These are the individual plots of the series mentioned in them. Note how your ‘ensemble mean’ turns Fig9 into a hockey stick. Just as I claimed.
As you will appreciate this was done in 2014, so the data is only up to then.
Are you prepared to plot your series without the ensemble mean to verify my data? From 1800 onwards of course.
Richard,
I want to respond to this comment upthread down here:
> Leaving in the weather and annual noise like Mann just means that it becomes overwhelming in the final result and just, as I have said before, creates a hockey stick.
Except that isn’t happening, nor would I expect it to, in the type of averaging I’m doing. Rather it’s the exact opposite of what you claim. The high frequency noise is cancelling out leaving behind longer period signal.
Now, it may very well be that Mann’s methods of doing reconstructions in the first place suppresses long-term signal that it should not, and indeed there is debate in literature about just that. Notably, he and Anders Moberg have disagreements about each others’ methods and results but the reasons aren’t down to taking unweighted means of a bunch of different proxy series as I am doing.
“> Can you match your proxies to these?
There aren’t enough studies overlapping the satellite series to make it worth my time doing.”
See above.
“> Anything that does not match to Had5 and/or GISS in their overlap period is out.
You need to define with quantification “does not match” — no two different observational records will match exactly *by definition*. All such choices ultimately contain some arbitrary subjectivity but that doesn’t obviate the need to be specific about your own choices and requirements.”
Broad agreement with a 15 year low pass of the data in the series. As shown above.
“> That means that most of your PDO proxies are out.
I wish you would stop conflating PDO with mean global temperature, they are decidedly NOT the same thing.”
That is rather rich, given that at least 5 of your own proxies are PDO based.
“I have done as you asked for HAD5 and GISTEMP. For each instrumental record I selected the 17 proxy series with the lowest RMSE over their entire period of overlap. (This differs from what I did last time as my scoring also included RMSE to the proxy ensemble mean.)”
Now do the individual plots as I requested. Not the ensemble mean.
https://climatedatablog.wordpress.com/2014/02/19/first-post/
This has 2 figures that are worth consideration in this respect Fig8 and Fig9.
https://imgur.com/a/UgGr7Cj
These are the individual plots of the series mentioned in them. Note how your ensemble mean turns Fig9 into a hockey stick. Just as I claimed.
“The blog doesnt like something in my response to you”
Use Had5 rather than what you tried.
Richard,
https://imgur.com/gallery/TeFa8Og
I don’t have Anderson 2013 so I gave you Moberg 2005 instead. 30 year moving averages applied to all series except HAD5 and Loehle, which is smooth enough already.
Yes I know an SMA is a terrible low-pass filter but I don’t have time right now to reinstall R and do a proper job of it.
Now I’ve more than done your homework assignments. May I pretty please see some power density plots for your favorite proxy series vs. instrumental? Thanks.
So replicate my Fig9 as I asked then as best you can.
I chose a gaussian and S-G for a reason. They do the job very well with little to no added distortions.
Restrict your plot to 1800 onwards as it does. Plot away. It will be the same as I got (series included aside).
A quick paint.net job gives me
https://imgur.com/a/UEi60lN
Yours will be the same.
A one to one comparison. Broadly the same.
https://imgur.com/a/N42Jub8
Brandon: Got any reasons why 3 out of the 4 proxy series fail to follow the rise of Had5?
Brandon,
This blog rejects words containing the letters d and c when adjacent to each other in that order. Specifically, anytime you refer to Had*crut without the asterisk.
Brandon comes up with a new term. Hide the fail to incline in 3 out of 4 of his proxy series.
Seen here in red.
https://imgur.com/a/8vap58I
Richard,
> Got any reasons why 3 out of the 4 proxy series fail to follow the rise of Had5?
Yep. Smoothing artifacts from the 30-year simple moving average at the tail end of those proxies. Removing that low-pass filter removes those artifacts and thus the seeming discrepancies go away.
https://imgur.com/gallery/LMA3w1l
Low pass filters reduce the length of a data series, not increase them.
Any ‘artifacts’ from a 30 year low pass can be reduced by using a 15 year low pass as I do.
An SMA reduces the length of a data series if the output is at the center by length/2 or the output is shifted by the length/2 if the output is at one end. Which is it?
Binny, thanks for the compliments, I appreciate them. I deliberately give only myself modification privileges because I want any interested users to get the file in “pristine” working condition as of time of release. Also, with open modification if multiple users are in the document at the same time the edit collisions can create quite a mess.
You’re right that a description document telling what the tool’s intent and capabilities are as well as instructions not already in the cell notes would be good. I think one page would suffice. I’ll try to get to that in the next few days.
Yes, Chrome gives the best performance. It works in Firefox just fine but for this much data it becomes noticeably draggy compared to Chrome.
I do like to use Firefox for its built-in screenshot functionality. It’s the only way I’ve found to generate high resolution plots — the download .png feature native to Google Sheets outputs very low-resolution plots with the layout all screwed up. But what do you want for free?
binny…”Is that not a bit brazen to compare your trivial schoolboy plots with the immense work done by Brandon R. Gates?”
***
This is why I call you an idiot. You seem to have a penchant for data presented by rank amateurs over the likes of UAH.
I’d trust anything by Richard regarding statistics over any propaganda put our by you or Gates.
Robertson
” Id trust anything by Richard regarding statistics… ”
Of course you do!
But… you trust him only because he perfectly shares your trivial views about climate affairs.
If, using the same trivial statistic tools, he would show warming, you would endlessly discredit him.
*
Similarly, you trust UAH ONLY because its data matches your trivial expectations.
If UAH had not decided to switch from rev 5.6 to rev 6.0, it would be currently at 0.18 C / decade instead of 0.13, and you would endlessly discredit this team.
This is why I’m very happy that you call me an idiot, Robertson: you are such a desperately simple-minded boaster.
binny…”But you trust him only because he perfectly shares your trivial views about climate affairs”.
***
Not just that, I took a year’s course on engineering probability and statistics and what he claims strikes me as being true. I don’t recall a lot of the theory because the course load was immense and students like me had to pick and choose which subjects to focus on.
Although Richard and I take shots at each other, from my end, it’s more tongue in cheek than anything. I wish you’d lighten up a bit so we could laugh over the bs.
As it stands, I get a kick out of your attacks on me. Learned a long time ago that ego is a burden and not something worth defending. Not only that, what one is defending is an imaginary construct.
Richard may be a contrarian, Gordo, but you are a Sky Dragon Crank.
Also, there is such thing as a year-long curriculum in engineering, probability, and statistics.
Think.
Willard, please stop trolling.
Robertson
Stop talking about all your alleged ‘a years course on engineering probability and statistics’.
You never learned anything you claim about: that is all your vita invention.
No engineer would write permanent nonsense like you do.
No engineer would ever speak about ‘faked Excel graphs based on fudged data’: s/he would prove the graphs wrong by posting more correct alternatives.
You are so incredibly inexperienced that you aren’t even able to produce the simplest Excel chart.
Only journalists, bad teachers and similar people are like you, Robertson.
Bindidon, please stop trolling.
Gordon Robertson 5/4 at 6:19 PM
“I invite you over to Vancouver, Canada for a dip in the ocean. In fact, I’ll drive you over to the west coast of Vancouver island so you can dip in the Pacific. If you get past dipping up to your ankles and survive the chill that will envelope your brain, you might dive straight in. If your heart is good you might survive for a few minutes, maybe even ten, but I guarantee you’ll be blue in colour by the time you emerge.
And that’s in the summer.
This ones for you GR; you dont get out much, do you?
https://youtu.be/x8SGB3R-T7c
Try this one
https://www.youtube.com/watch?v=WNmY_EAoXnU
bobdroege
That swim was pretty amazing!
Duh!!! Did you not notice the surfers are wearing wet suits?
I think Gordo is part Russian. I wouldn’t challenge him to swim in cold water.
stephen…never mind my level of of sanity, have you never heard of the US swimmer Lynn Cox. She swam from Alaska to Russia across the Bering Sea, and swam in Antarctic waters that were around 0C.
She’s a better man than me.
https://en.wikipedia.org/wiki/Lynne_Cox
Water temperature on west coast Vancouver Island is ~10C all year.
Survival time is about an hour (depending on your size and blubber), less if you don’t have a life jacket.
ken…I was egging maguff on a bit. I stayed in the Pacific over half an hour without a wet suit. It was raining that day off Long Beach and when I surfaced, the rain felt warm on my head. I was making the point that the ocean is still damned cold in places.
I was trying to learn how to surf, rather unsuccessfully. There were good waves of at least 10 feet and a smarter person would have remained ashore. Never did get much of a ride but I sure spent a lot of time under each wave as I fell down the face. Scared the crap out of me on the first one, not realizing I’d be down there so long as the wave passed over, then seeing the board shoot out of the water near me as it surfaced. Could have been knocked out.
I went to a place that is colder that where I live.
How is this possible when global warming?
barry, please stop trolling.
Terraforming: why the Moon is a better target than Mars
The first world that humans should inhabit beyond the Earth is the Moon, not Mars. Here’s why terraforming our lunar neighbor is so appealing.
https://bigthink.com/starts-with-a-bang/terraforming-moon-mars/
Linked from: https://instapundit.com/
Let’s look up definition of terraforming, wiki:
Terraforming or terraformation (literally, “Earth-shaping”) is the hypothetical process of deliberately modifying the atmosphere, temperature, surface topography or ecology of a planet, moon, or other body to be similar to the environment of Earth to make it habitable by Earth-like life.
The concept of terraforming developed from both science fiction and actual science. Carl Sagan, an astronomer, proposed the planetary engineering of Venus in 1961, which is considered one of the first accounts of the concept.”
I didn’t know Carl Sagan proposed terraforming Venus.
“Sagan proposed injecting photosynthetic bacteria into the Venus atmosphere, which would convert the carbon dioxide into reduced carbon in organic form, thus reducing the carbon dioxide from the atmosphere.”
…
“Here’s the fatal flaw: In 1961, I thought the atmospheric pressure at the surface of Venus was a few bars … We now know it to be 90 bars, so if the scheme worked, the result would be a surface buried in hundreds of meters of fine graphite, and an atmosphere made of 65 bars of almost pure molecular oxygen. Whether we would first implode under the atmospheric pressure or spontaneously burst into flames in all that oxygen is open to question. However, long before so much oxygen could build up, the graphite would spontaneously burn back into CO2, short-circuiting the process.”
https://en.wikipedia.org/wiki/Terraforming_of_Venus
Lunar Soil has the Potential to Generate Oxygen and Fuel
2 hours ago
Charles Rotter
Peer-Reviewed Publication
CELL PRESS
“Soil on the moon contains active compounds that can convert carbon dioxide into oxygen and fuels, scientists in China report May 5 in the journal Joule. They are now exploring whether lunar resources can be used to facilitate human exploration on the moon or beyond.”
https://wattsupwiththat.com/2022/05/05/lunar-soil-has-the-potential-to-generate-oxygen-and-fuel/
It seems weird and different.
I give it whirl of why Moon isn’t better for settlements.
With teleoperation people don’t have to live on the Moon.
Or most people working on the Moon, could be living on Earth.
The first place to explore, should be the Moon and second place to explore should be Mars, though one could instead explore one or both of Mars moons, before exploring Mars surface.
In terms of exploring the Moon, it seems only place of interest is the lunar polar regions, and question is just one, where in lunar polar regions is there mineable lunar water.
What could do with the Moon if there isn’t mineable water?
Ship earth water to Earth/Moon L-1/L-2
Can you ship Earth water to L-1 and sell it for $500 per kg?
Generally launch cost to just low Earth orbit is around $2000 per kg
and that cost would be higher to reach L-1, Falcon-9 does as much 22,800 kg to LEO
And Falcon heavy does 63,800 kg to LEO
22,800 x $500 = 11.4 million and 63,800 x $500 = 31.9 million dollar
so, can’t even do such price to LEO.
Starship does about 100,000 kg to LEO, times $500 = 50 million
Crazy Musk says cost will be 2 million per launch, so “in theory” one do it to LEO, but Earth/Moon L-1 requires about 3.9 km/sec of more delta-v. And refueled Starship can do 6.9 km/sec of delta-v.
And fulled fueled Starship takes 1200 tons of fuel.
So, somewhat close, but need Musk magic.
Musk claims he can put 100 ton on lunar surface with fully fuel Starship, so could sell Earth water on the Moon for $1000 per kg.
But Starship isn’t coming back [unless refueled] or one say isn’t much use putting a Starship on lunar surface {a starship is make to re-entry atmosphere] so could replace starship with something not designed to re-entry an atmosphere. Or Starship’s raptor engines and attached to tank with water in it. Starship mass is 120 ton, engine and tank could be 100,000 kg tank with 12 tons of engines.
And say you want tanks, and would pay $500 per kg for tanks brought
to Moon: 100,000 times $500 = $50 million.
You could same with L-1, but from L-1 you could return the Starship to Earth for re-use.
So if buy the “starship” on lunar surface for $50 million and pay 50 million for water. Or say buy starship for $50 million and get water for free at L-1- or say 25 million for water.
But compare to say $1000 per kg for water at lunar surface and $500 kg in L-1, which better.
My view has “always been”, is if sell mined lunar water for $500 per kg, lunar water is mineable, but at same time I claim lunar water is worth more in lunar low orbit, and worth more at L-1.
which better.
But also part of this, the the company that can do this has more value than water sold, because future worth of a lunar mining company. So question does company that buys Earth water and make rocket fuel and sells it, some kind future value also.
It seems a station which make rocket fuel from water, is sort of in space hotel business. Which kind of related to people wanting some place to stay. And I said people don’t need to live on the Moon.
And Mars would more connected to needing/requiring people staying.
Anyhow in L-1 don’t dust, have more solar energy, and cheaper to ship solar panels from Earth.
But tend to a hotel business might do better in Venus orbit and related to people going to Mars.
But it could start in L-1, and move it to Venus.
norman…”You are confused to think that you use of the word heat is for some reason better than the rigid use of the word in modern science.
It is not my definition of heat. It is the accepted definition of the word as used in science so that when used in physics papers the other scientists know what is being discussed”.
***
Physicist David Bohm…and I think Feynman said something similar…claimed that an equation that does not describe the physical reality is garbage. I claim the same about heat, if the definition does not fit the reality, then it is garbage.
Your definition does not fit the reality, nor does any definition that claims heat is not energy but a measure of or a transfer of a generic energy. Such a definition is plain silly. Using the word energy as a generic term when the specific energy in question needs to be stated is ingenuous. Not only that, it leads to a gross misunderstanding of the physical reality.
Alarmists use the word energy in a generic sense to get around the 2nd law. They are fully aware that heat can never be transferred, by its own means, from a colder atmosphere to a warmer surface but they try to get around it by inventing a ‘balance of energy’. If that mysterious energy is positive, then the 2nd law is claimed to be satisfied, even though heat is being transferred cold to hot.
Hogwash, claimed G&T. They pointed out, quite rightly, that the 2nd law applies only to heat, therefore any balance of energy must apply to heat only. Alarmists like Eli Rabbett fail to get that, they think they can sum heat with EM to get a balance of energy.
When G&T pointed out to Rabbett (Halpern et al) that heat can only be transferred hot to cold, by its own means, Eli astoundingly claimed that would mean two bodies of different temperature would have one body not radiating. Duh!!! No, Eli, it means the hotter body does not absorb the EM radiated by the cooler body.
Why are so many scientists with Ph.Ds in physics so ill-informed about quantum theory? Ken’s authority figure, Happer, is just as bad. He could not write the Bohr equation for electron transition correctly. He included the speed of light which has no business in the quantum atmosphere of an atom.
You have described heat as a transfer of energy but you have not described the energy being transferred. If heat is to be used to describe a transfer of energy then that energy can only be thermal energy, aka heat.
That is blatantly obvious, yet modernists continue to spew the propaganda, that heat is a transfer of heat, or a measure of heat. Is it not obvious to you that the energy you claimed is being transferred or measured is heat?
Clausius was correct, heat is the kinetic energy of atoms. Temperature is a measure of relative heat levels and entropy is a measure (of sorts) of heat transfer. I say, ‘of sorts’ because entropy can only be zero or positive, Still, Clausius devised it to measure relative levels of heat transfer. It has nothing to do with measuring disorder, disorder being a byproduct of an irreversible process, for which entropy must be positive.
The positive stipulation is there because heat cannot be transferred cold to hot by its own means. Entropy was invented by Clausius and defined as the sum of infinitesimal changes of heat over a process at a given temperature. If more heat is transferred by different irreversible processes then they can be more positive, but never negative.
Gordon Robertson
Once again it is NOT my definition of heat. An no not all forms of energy transfer are considered heat.
In the link it clearly states the type of energy transfer that constitutes heat. Conduction and radiant energy. Those forms of energy transfer are what are explained as heat transfer.
Please read the article attached.
https://www.thermal-engineering.org/what-is-heat-in-physics-heat-definition/
You do make unsupported claims “No, Eli, it means the hotter body does not absorb the EM radiated by the cooler body.”
This can be easily experimentally verified to be a wrong conclusion.
I don’t have a vacuum assembly or I could show you. But it would not matter if I did, you do not believe experimental evidence at all. Roy Spencer has already done experiments proving you are wrong as has E. Swanson (who had a vacuum assembly and pump).
Here is where Roy experimentally demonstrates you wrong. G&T can make any claims they want, they have no experimental evidence. When it comes to science and truth I will always side with the evidence.
Roy proves you wrong. Like I stated no experimental evidence alters your wrong thinking. I guess your ego is too big to admit being wrong.
https://www.drroyspencer.com/2016/08/experiment-results-show-a-cool-object-can-make-a-warm-object-warmer-still/
Gordon Robertson
In the Roy Spencer link you have numerous comments I saw. Roy Spencer answered them for you. You should go back an read what he told you back then. You still say the same wrong things without hesitation. It is not as if an attempt to correct your errors has not been attempted.
As I stated you do not seem as stupid arrogant as the bot who goes by Clint R. But you truly seem to have zero learning ability. You just repeat the same flawed points over and over and cling to a couple fringe writers and repeat their flawed ideas. Over an over without change. If you were the genius you claim you are, you should auto-correct your flawed thinking, or at least think about what people tell you.
Norman, I see you still can’t support your bogus claims.
If you really want to understand Spencer’s experiment you and Ball4 keep linking to, I will be happy to explain it to you. But, you will have to agree to 90 days without commenting here.
Not that again, Pup.
Really?
Clint R
Buzz off dumb one. Your opinions are noted and they are quite stupid. You need to stop commenting. Your opinions are really stupid and expose how dumb you are.
Norman, there’s really no reason to get mad at me. Your incompetence is your own fault. I just expose it.
Thanks for noticing.
“When G&T pointed out to Rabbett (Halpern et al) that heat can only be transferred hot to cold, by its own means, Eli astoundingly claimed that would mean two bodies of different temperature would have one body not radiating. Duh!!! No, Eli, it means the hotter body does not absorb the EM radiated by the cooler body. ”
But also a less hot body absorbs less heat from a hotter body as compared to, if less hot was much cooler
But the Sun is very hot and Earth is cold.
If Earth was 1/2 as hot as sun, Earth would absorb less energy from the Sun.
Or the inner surface furnace wall which is hot, doesn’t lose a much heat [acts as insulation] though one tends to think of as heat gradient or the heat gradient [thickness of brick] is the insulation.
G&T share Gordon Robertson’s delusion that photons emitted by a cooler object cannot be absorbed by a warmer object.
This turns out not to be the case.
Once again, in simple words.
Two adjacent objects at different temperatures.
The warmer object emits photons towards the cooler object, which it absorbs. These carry x Joules.
The cooler object emits photons towards the warmer object, which it absorbs. These carry y joules.
The net amount of energy transferred from the warmer object to the cooler object is x-y Joules.
The correct formulation of 1LOT is not
“Heat cannot flow from a cooler object to a warmer object by its own means.”
The correct formulation is
“There cannot be a NET flow of heat from a cooler to a warmer object by its own means.”
That’s all wrong, Ent.
Photon absorp.tion is based on wavelength compatiblity. That means photon absorp.tion is affected by temperature.
And, you’re confusing 1LoT with 2LoT.
You don’t understand any of this.
Clint R
Does it make you happy to expose your ignorance? You again have no clue. If an object can emit a photon it will also be able to absorb it.
The reality is you do not understand any physics at all. You are a blowhard troll.
Entropic man physics is correct. Yours not so much (not that it is physics or science at all, it is just your own opinions).
Norman, I enjoy your meltdowns. But now that you’ve proven yourself to be such a phony, they’re even more enjoyable.
Norman,
Eman says you’re not allowed to make ad hominem attacks in his name.
Clint R
“Photon absorp.tion is based on wavelength compatiblity. ”
Thermal radiation is emitted and absorbed across a number of wavelengths forming a normal distribution(?) plot of intensity versus wavelength.
Under terrestrial conditions this is centred in the IR and wavelength compatibility is not a problem.
“youre confusing 1LoT with 2LoT. ”
Yes, I do that a lot. 🙂
This is another example of how the cult works together to pervert science.
Ent makes a long comment, trying to support “cold” warming “hot”. He knows so little about science that he confused the First and Second Laws of Thermodynamics. I corrected him, and then Norman jumps into with his ad homs to me, and support for Ent.
Then Ent returns, totally oblivious to my comment.
That’s how they keep their cult going.
Clint R
Perhaps you missed my reply. Just in case, here it is again.
Entropic man says:
May 6, 2022 at 9:57 AM
Clint R
Photon absorp.tion is based on wavelength compatiblity.
Thermal radiation is emitted and absorbed across a number of wavelengths forming a normal distribution(?) plot of intensity versus wavelength.
Under terrestrial conditions this is centred in the IR and wavelength compatibility is not a problem.
youre confusing 1LoT with 2LoT.
Yes, I do that a lot.
Ent, that’s called “doing the same thing over again, hoping for different results”, aka “doubling down on stupidity”.
Well done.
“Photon absorp.tion is based on wavelength compatiblity. That means photon absorp.tion is affected by temperature.”
Not much for typical grey bodies like ocean or land.
Clint is confusing the strong T dependence of the Planck emission spectrum with emissivity which has weak T dependence.
And as Norman noted, emissivity matches abs*orb*tivity, by Kirchhoffs law.
So the notion that warm grey bodies cannot abs*orb radiation emitted by cooler grey bodies is unsupported by the facts, and absurd.
Now Clint will have no sensible response but will have insults.
Nate, that’s just the same nonsense Ent was peddling.
You can’t get over “Photon absorp.tion is based on wavelength compatiblity. That means photon absorp.tion is affected by temperature.”
Do you have NO real-life experiences? Have you ever been around a campfire? Do coals glow when they’re hot?
I can’t teach reality to people that have never left their basements. And, that’s NOT an insult, it’s reality.
Clint R
I was right both times. If I was in error you should be able to produce evidence to show it. But you have nothing.
“Do you have NO real-life experiences? Have you ever been around a campfire? Do coals glow when theyre hot?”
Yes,
Indeed the BB emission spectrum shifts and brightens with increasing temperature.
The ability of a material to emit or abs.orb that radiation (emissivity) does NOT. It is not affected much at all by its temperature!
Thus you are confirming exactly what I said:
“Clint is confusing the strong T dependence of the Planck EMISSION spectrum with emissivity which has weak T dependence.”
“I cant teach reality to people” that actually understand physics and reality’ is what you are saying.
Ent was WRONG both times but now just claims he was right!
That’s why he can’t learn. He can’t face reality. To him, passenger jets fly backwards, so that becomes his reality.
And Nate admits that the absorp.tion spectrum changes with temperature, but he doesn’t understand that means the photons absorbed change. He doesn’t realize the spectrum is caused by photons!
You just can’t make this stuff up….
“And Nate admits that the absorp.tion spectrum changes with temperature, but he doesnt understand that means the photons absorbed change.”
Nope, not what I said, liar-troll.
A cast iron plate will abs.orb 10 micron photons just as well when it is hot or cold.
If you think it wont, show us data, or evidence of any kind. I won’t hold my breath.
Heat is excitement, the cold can’t excite. {what is already more excited than the cold}.
The basic problem is you have understand what surface is warmed.
On Earth the primary surface which is warmed is the ocean surface.
On Venus what is warmed up at the level of it’s thick clouds.
Oh, the Earth ocean isn’t warmed at skin surface of ocean rather it’s top couple meter of surface waters, but warmest water tends to end up at the skin surface, and this warms the entire of Earth by convective heat process [which is evaporated heat loss]. Venus atmosphere higher atmosphere also has elements which do have evaporate heat loss, also.
But most say the acid clouds of Venus have warming effect- the cult calls something increases average air temperature as a “greenhouse gas” which is rather mixed up as ocean liquid surface heats the atmosphere and it’s liquid rather than gas, but what is evaporated is a gas.
Anyhow Venus being heated occurs in upper atmosphere and Earth surface heat is largely done at sea level.
One could say what controls atmosphere temperature of Earth is the ocean temperature, and likewise say what controls Venus atmosphere is it’s rocky surface temperature.
The Venus rocky surface is not heated directly from Sunlight, but sunlight reaches rocky surface it doesn’t warm it.
And the rocky surface of Venus is mostly dim or no sunlight. What can heat the rocky surface is the internal heat generated within the planet, but this probably is not a lot energy involved, and where heating from the Sun occurs is in the cooler upper atmosphere where the sunlight is far more intense.
Anyways, with Earth climate one needs to determine what warms and cools the entire ocean.
Or more than 90% of Earth recent warming [last 50 years which ocean has somewhat measured] is warming the entire ocean.
Our ocean is cold, average of about 3.5 C. Since ocean is cold and has cold for millions of years, Earth has been in Ice Age for millions of years.
And what cools the ocean is cold denser ocean water falling.
The Ocean can warm with denser warmer salty water falling. The ocean can also be warmed by mechanically mixing of warmer and cooler water.
And the geothermal heat of ocean floor can warm the ocean.
So a part of our Ice Age is due the Antarctica continent being at south pole and it’s location mixes colder ocean water.
So we in what called icehouse global climate, in greenhouse global climate one has more mixing warm water with entire ocean. What do that could be shallow warm salty ocean seas. Or plate tectonic or roughly geological processes would cause this.
Eman,
The GHE is 33K?
Stephen,
Last time I checked the average OLR emitted from the Earth to space was 240W. Plug that into the Stefan-Boltzman equation and you get a brightness temperature of 255K.
Measure surface temperature directly and you get a global average of 288K.
In my view the 33K difference is due to the greenhouse effect and its secondary effects.
If you have a credible coherent, consistent and consilient alternative hypothesis, please present it and show your working so that I can check it for myself.
“Last time I checked the average OLR emitted from the Earth to space was 240W.”
Ent, OLR does NOT have units of “W”.
And, there is no way you can check “the average OLR emitted from the Earth”.
You don’t understand ANY of this.
Your hypothesis would need to explain why Earth’s surface is emitting 390W/m^2 according to the SB equation, but only 240W/m^2 escapes to space.
You need to explain where the remaining 150W/m^2 goes, what it warms and what mechanism is involved.
Clint R
You are very good at spotting my sloppy use of units, but completely useless at falsifying my science. I suggest that you remain silent until you have something useful to contribute.
That “240 W/m^2” is associated with the bogus “real 255 K surface”. Neither is reality. The calculations are for an imaginary sphere. There is NO relation to Earth.
You don’t understand any of this. You just make stuff up to fit your cult beliefs — like your nonsense about passenger jets flying backwards.
You’re just another braindead cult idiot posing as an anonymous troll.
entropic…”In my view the 33K difference is due to the greenhouse effect and its secondary effects…”
***
Either that or the two are not related. It is coincidental that an incorrect calculation based on S-B is 33 C lower than a measured average. If the S-B calculation is wrong then the comparison is a moot point.
Also, remember that the S-B calculation is done without oceans, only Earth as a dry rock.
Entropic and Norman….quote from Entropic…
“The correct formulation is
There cannot be a NET flow of heat from a cooler to a warmer object by its own means.”
***
Read Clausius on it, he invented the 2nd law. He says nothing about ‘NET’. There is a reason for that, Clausius developed the law based on the PVT (pressure-volume-temperature) relationships in a heat engine. They are irreversible and do not apply in both directions.
About 50 years later, Bohr provided another good reason. He theorized, based on Planck’s quanta, that electrons could exist only in discrete energy states around an atomic nucleus. He was led to that insight when a colleague reminded him of hydrogen atomic spectra, wherein hydrogen absorbs and emits only at discrete frequencies. There is no continuum of frequencies in the spectra, they are so discrete they are called lines.
He wondered why, then it came to him. The lines were being caused by the sole electron in the hydrogen atom jumping back and forth between excited orbital states. When an electron in the ground state (non-excited) receives a quantum of EM that can excite it, the electron jumps to a higher energy state. When it jumps back to ground state, it emits a quantum of EM that corresponds exactly to the electrons frequency of rotation in the higher orbital and the potential energy difference between orbital states.
If the higher energy state is Eh and the lower energy state is El then (Eh – El) = E = hf.
That’s your relationship and it applies to both emitted EM and absorbed EM. If that relationship is not met, or exceeded, the electron simply wont react to it. Therefore incoming EM must have a specific intensity, E, and frequency, f. If that EM is from a cooler body it cannot provide the required E or f, therefore it is ignored.
Now think about what you are both claiming. If EM energy is going both ways, how does the electron respond to both? I know Norman thinks electron transitions only apply in certain instances, but that is wacko. What else is there in an atom or a molecule that can process EM? Nothing in atomic nucleii can process it and the only other particle is the electron.
Not just that, EM has an electric field and a magnetic field. What else in an atom has an electric field and a magnetic field? The electron. A proton may have an electric field but it has no magnetic field and it cannot jump back and forth between orbital states. Therefore E = hf does not apply to protons, neutrons, or any other sub-atomic particle.
There you have it, nothing else in an atom or a molecule can absorb or radiate EM. As I have claimed multiple times, a molecule is just a fancy name for two or more atomic nucleii bonded by electrons. So, even though it can vibrate and rotate, the molecules absorp.tion and emission is caused by electrons.
It is electron bonds that vibrate and rotate.
Quantum theory destroys the argument of both of you. Bodies of different temperatures cannot exchange heat. The heat can be transferred only from the hotter body to the colder body, whether by conduction, convection, or radiation. Clausius even states that re radiation, that it must obey the 2nd law and that’s his law, with no NET transfer.
“And, there is no way you can check ‘the average OLR emitted from the Earth’.”
False. OLR regularly checked by satellite measurements, like from CERES. And simple math is used to find the average emitted from the Earth.
Clint’s tactics are always the same.
Deny observable facts. Toss ad-hom grenades.
Nobody buys this nonsense.
Nate doesn’t understand that flux decreases with distance. Because Earth’s surface is believed to average about 390 W/m^2, some place in space will then measure 240 W/m^2. But Earth is emitting 390 W/m^2, NOT 240 W/m^2.
If their imaginary sphere were the size of Earth, and emitting 390 W/m^2, the flux would be 240 W/m^2 at an altitude of about 1000 miles.
They don’t understand any of this.
Clint: Please distinguish between spherical and infinite planar fields of radiation/fluxes. One is 1/d^2. The other is linear.
Very close to the surface of a spherical body, such as in the atmosphere on Earth, we are much more in the second than the first.
“Earth as a dry rock.”
Yes, maybe also painted dry rock.
The Moon is worse than any painted dry rock.
God is far more devious than any painter.
“Nate doesnt understand that flux decreases with distance. Because Earths surface is believed to average about 390 W/m^2, some place in space will then measure 240 W/m^2. But Earth is emitting 390 W/m^2, NOT 240 W/m^2.”
And nobody doing the satellite measurements understands this, nor knows how to do the simple math required?
Tee hee hee.
gb…”Or the inner surface furnace wall which is hot, doesnt lose a much heat [acts as insulation] though one tends to think of as heat gradient or the heat gradient [thickness of brick] is the insulation”.
***
If you had a real furnace with walls made of bricks, each brick would have a heat gradient. The inside would be very hot, the outside not as hot, and each atomic space in between would exhibit a temperature gradient from the hot inner brick toward the cooler outer brick.
There is no such heat gradient between the Sun and Earth. There is no heat between them to create such a gradient. The heat exists only at the Sun and only at the Earth, the only two solid bodies involved. In other words, the Sun is the source of the heat, which is the kinetic energy of hydrogen atom mainly, and some of it gets converted to EM, which has no heat.
Over the 93 million miles the EM travels, it has no heat. When it reaches Earth, a cooler mass, that EM is absorbed and converted locally to heat, however, the heat is a product of the increased kinetic energy of electrons in whatever they are found.
It’s the same thing as pushing a large boulder off a 100 foot cliff. All the way to the ground, the boulder has no additional heat, but when it strikes the ground, heat is created through a transfer of the boulder’s kinetic energy to heat. The impact affects the electrons in the ground mass and excites them to a higher level of KE, which is heat.
“some of it gets converted to EM, which has no heat”
EM is the way that heat gets transferred between bodies in a vacuum.
“There is no such heat gradient between the Sun and Earth. ”
Right just vast distance in which same heat/energy is spread over a greater area of sphere.
Or if focus to make sunlight into smaller area, it same intensity as near the sun.
If Sun was chemical fire, chemical fires have much lower heat/energy, and it same size as Sun, it’s sunlight would be very dim, and it can
only be magnified to the temperature of this relatively cool chemical fire.
Of course stars are not chemical fires. And Stars are rather complicated.
Norman says:
G&T can make any claims they want, they have no experimental evidence. When it comes to science and truth I will always side with the evidence.
——————————-
This just shows how inculcated you are. G&T’s claim was there is no evidence to show the greenhouse effect works as advertised.
In the English translation of the their paper’s title it is suggested that G&T was attempting to prove that the GHE didn’t exist. I am unfamiliar with their native language so I will not comment on if it was an accurate translation or not.
Of course they weren’t! Science isn’t equipped for proving non-existence. The non-existence of God for example.
And that fact can be shown in their rather complete work of demonstrating that no known physics can explain the multi-layered greenhouse effect and even challenged the advocates of the effect to offer up a valid blueprint of the effect which could be examined via the laws of physics.
Of course this has never been done. So the attempted shift of the burden of proof is the only defense the GHE has. Though I can recognize that if you properly cut through the apple and oranges argument there is a climate effect, but perhaps not regarding mean global near surface temperatures.
Warm water from the western Pacific during La Nia needs a great deal of solar energy to move eastward as the current carries it toward Antarctica.
https://upload.wikimedia.org/wikipedia/commons/thumb/6/68/LaNina.png/669px-LaNina.png
https://coralreefwatch.noaa.gov/data/5km/v3.1/current/animation/gif/ssta_animation_30day_large.gif
The stratospheric polar vortex to the south is strong.
https://i.ibb.co/pngy19S/S-daily-extent-hires.png
Hey, Ren, how’s it going?
Hi Gordon, I am starting the garden season.
Dr Spencer does it again! A great demonstration of the old adage “if you can’t explain it simply you don’t understand it well enough.”
Your comment here perfectly summarizes progress made over the last 60 years in atmospheric profile inversion techniques of satellite temperature sounding (imho).
It is also a fitting testament to the interconnected web of science: inversion techniques developed in Geophysics for the study of subsurface data were adapted to atmospheric studies.
T.y.
The totality of our so-called knowledge or beliefs, from the most casual matters of geography and history to the profoundest laws of atomic physics or even of pure mathematics and logic, is a man-made fabric which impinges on experience only along the edges. Or, to change the figure, total science is like a field of force whose boundary conditions are experience. A conflict with experience at the periphery occasions readjustments in the interior of the field. Truth values have to be redistributed over some of our statements. Re-evaluation of some statements entails re-evaluation of others, because of their logical interconnections – the logical laws being in turn simply certain further statements of the system, certain further elements of the field. Having re-evaluated one statement we must re-evaluate some others, whether they be statements logically connected with the first or whether they be the statements of logical connections themselves. But the total field is so undetermined by its boundary conditions, experience, that there is much latitude of choice as to what statements to re-evaluate in the light of any single contrary experience. No particular experiences are linked with any particular statements in the interior of the field, except indirectly through considerations of equilibrium affecting the field as a whole.
Epistemology
Science is a multiply connected web. If you make any statement about the real world you had better, from the beginning, be consistent and logical. It is possible without experiment or observation to rule out a scientific theory simply because it is inconsistent.
True enough, Tyson, but consider how, according to teh Van, nothing is set in stone, including the Laws of Logic.
Which means there’s still hope for Gordo!
TM,
You wrote –
“It is possible without experiment or observation to rule out a scientific theory simply because it is inconsistent.”
Garbage. Try and name such a scientific theory. Fantasy “theories”, such as Willard’s Greenhouse Theory, Greenhouse Effect Theory, Insulation Effect Theory, and Insulation Theory, do not count.
So go on – rule out a valid scientific theory, based on observation, simply because it is inconsistent.
Poser.
> rule out a valid scientific theory, based on observation, simply because it is inconsistent.
Valididity goes hand in hand with consistency, Mike:
https://sites.oxy.edu/traiger/logic/primer/chapter6/consistency-and-completeness.html
Wee Willy Wanker,
So, you cant name a scientific theory which can be ruled out (whatever that means) simply because it is inconsistent, either?
As I thought. Your sense of self importance with nothing at all to back it up except endless attempts to get people to accept that you are so clever that reality is unimportant, just indicates how detached from reality you are.
Ill repeat the words of Richard Feynman – “It doesn’t matter how beautiful your theory is, it doesn’t matter how smart you are. If it doesn’t agree with experiment, it’s wrong.
Ill add – logic and intuition are completely valueless if they disagree with experiment.
I know you dont like having Feynman tossed in your face again and again, but what you like or dislike is irrelevant to me or reality.
Keep rejecting reality, and convince yourself that you are powerful, wise, and respected – have you any facts to support your fantasy?
I thought so. Carry on.
Mike, Mike,
For each theory I give you, you stop commenting for a month.
Deal?
Wayward Wee Willy,
Another “deal”? You really do have an exaggerated sense of your own self-importance, don’t you?
I suppose you believe that continuously calling me Mike Mike or Mike Flynn Mike Flynn will make onlookers think you are intelligent, rather than laughing at your pointless silliness.
What is your point?
As to theory, your fantasies are not theories. There is no Greenhouse Theory, nor Greenhouse Effect Theory, nor any of the other nonsensical “Theories” you mention.
Why are you seemingly so frightened of comments? Are you feeling insecure? Who cares about comments from me, or Mike Flynn, for that matter? I have abundant self-esteem, so feel free to comment as copiously and witlessly as you choose. Do you think anybody values your opinion sufficiently to care whether you comment or not? I certainly don’t!
Got any more pointless “deals” or “offers”?
Moron.
“So go on rule out a valid scientific theory, based on observation, simply because it is inconsistent”
My point exactly. Thx!
TM,
You can’t actually name one scientific theory that you can rule out because you think it is inconsistent with something you can’t actually describe, can you?
Keep wriggling.
Fool.
Thanks again for consistently making my point.
Mike, Mike,
If you do not put any skin in the little game you have been playing at Roys for more than a decade, why would I play?
As you yourself say, you have an inflated sense of importance!
Cheers.
Willard,
You dribbled –
“Mike, Mike,
If you do not put any skin in the little game you have been playing at Roys for more than a decade, why would I play?
As you yourself say, you have an inflated sense of importance!
Cheers.”
Why?
Mike,
You write –
“Willard,
You dribbled
Mike, Mike,
If you do not put any skin in the little game you have been playing at Roys for more than a decade, why would I play?
As you yourself say, you have an inflated sense of importance!
Cheers.
Why?”
Why?
Tyson, Willard, please stop trolling.
Anyone heard about Summit Camp shutting down?
There’s no activity up there, and their instruments haven’t worked for over a month. There’s nothing happening with the SMB.
Maybe they all went home due to the extreme boredom?
It’s easier to model the physical reality from the comfort of a chair in front of a computer. Besides, it’s easier to fudge the data in a model to show warming that isn’t there.
Tim Folkerts says:
May 5, 2022 at 10:03 AM
“Again .
1) The general impact of rotation and heat capacity has long been known:
The faster the rotation, the more uniform the temperature.
The more uniform the temperature, the higher the average temperature.
The higher the heat capacity, the more uniform the temperature.
The more uniform the temperature, the higher the average temperature.
2) The 16th root is an empirical result, with no theoretical basis. In particular:
* a non-rotating planet (N=0) would have a predicted temperature of 0 K
* a rapidly rotating would have unphysically high temperatures. For example a small asteroid with the same cp and a as earth but spinning 1 rev per second would be more than 2x as hot as earth. Well over 550 K (275 C; 550 F)
So you have a questionable fit to a well-known phenomenon.”
But the fit is perfect!
https://www.cristos-vournas.com
Venus rocky surface [or roughly all of it’s mass] is slowest rotating known body in the universe and it’s average distance from the Sun is
108.21 million km or .723 AU
If Venus were to continue this rotational speed but be at Earth distance or 1 AU, what temperature would it be?
Thank you, gbaikie, for your respond.
“If Venus were to continue this rotational speed but be at Earth distance or 1 AU, what temperature would it be?”
Venus has mean surface temperature (measured)
Tmean =735K.
If we assume everything else is the same (Albedo, Φ, speed of Venusian winds, atmosphere density and atmosphere gases content) we should use the distance from the sun reverse square law…
The temperature of Venus will be then
Tmean =625K
For more detailed, please visit the page in my site:
“Venus’ Tmean 735 K”
https://www.cristos-vournas.com
Currently, Venus has 1 atm at about 50,000 meter elevation.
And Venus air at around 70 C.
At what elevation would 1 atm of pressure and what temperature would it be at 1 atm if Venus was at Earth distance?
Or, I agree that Venus has runaway effect.
Are you taking that in account somehow?
Or do you think that Venus doesn’t have runaway effect?
Or Venus has slow rotation, but upper atmosphere [around 1 atm]
rotates every 4 to 5 days.
I think at Earth distance it would be effectively a slower rotation than 4 to 5 days.
And that one aspect of runaway effect- hotter it is faster the atmosphere rotates. And if cooler, it’s much slower
“Or, I agree that Venus has runaway effect.
Are you taking that in account somehow?
Or do you think that Venus doesnt have runaway effect?”
Yes, there is a strong greenhouse runaway effect on Venus.
> “At what elevation would 1 atm. of pressure and what temperature would it be at 1 atm. if Venus was at Earth distance?”
I cannot estimate the elevation of 1 atm. at Earth distance. If everything else equals, the temperature at 1 atm. at Earth distance would be the same – at around 70 C.
Yes, I am taking the runaway effect in account. For more detailed, please visit the page in my site:
Venus Tmean 735 K
https://www.cristos-vournas.com
Correction:
Instead of “the temperature at 1 atm. at Earth distance would be the same at around 70 C.”
It should be:
the temperature at 1 atm. at Earth distance (everything else equals) would be around 292K or 19 C.
https://www.cristos-vournas.com
“I cannot estimate the elevation of 1 atm. at Earth distance. If everything else equals, the temperature at 1 atm. at Earth distance would be the same at around 70 C.”
As very rough guess, I would the 50 km elevation would 12 km lower based upon your temperature.**
Or cooler average/zero elevation air would be denser, or having more atmospheric mass at lower elevation.
At Venus distance at 1 atm you should twice as much as Earth surface at 1 atm or around 2000 watts or more vs 1120 watts sunlight when sun at zenith. Or fry pan at Venus distance is too hot to fry eggs, whereas on earth people try to cook eggs on the sidewalk- but not hot enough. Or heat surface to 70 C is barely possible but never get air at 70 C. Anyhow I would tend to think about 30 C {or less]
Or it would take a long time to cool Venus, if it “pop into earth distance”, but if at 1 atm of spaceship in sunlight, everything should cool down pretty fast. Not as sudden as solar ellipse, but say within a hour or so. Hours to cool, but months/years to sink.
And seems wind speed which at Venus is around 100 m/s [232 mph] and blinked to Earth distance would slow down before sinking.
**
https://www.engineeringtoolbox.com/air-temperature-pressure-density-d_771.html
That chart is earth air, 68.95 atm and 37.8 C vs 148.9 C
per cubic meter: 78.49 kg vs 57.83 kg
Oh, missed correction of 19 C.
That is probably closer than my 30 C
On Earth the CO2 is dissolved in oceanic waters. That is why there is not a runaway greenhouse effect on Earth surface.
The closer to sun Venus couldn’t have liquid water. The water vapor vanished in space, since it is a lighter gas.
As a result on Venus the entire CO2 is in atmosphere – thus the very strong runaway greenhouse effect.
https://www.cristos-vournas.com
gbaikie,
if you are interested, I have the gaseous planets at 1 bar level the satellite measured temperatures comparison in relation to the gaseous planets’ rotational spins.
Gaseous planets have similar atmospheric gases content. The more close the content is the better the satellite measured temperatures relate in accordance to the Rotational Warming Phenomenon.
Link:
https://www.cristos-vournas.com/445559910
“On Earth the CO2 is dissolved in oceanic waters. That is why there is not a runaway greenhouse effect on Earth surface.”
Earth’s ocean is cold, but Earth’s ocean has been a lot warmer.
Our cold ocean still makes Earth warm.
A significant aspect of why Earth has ocean is because Earth has plate tectonic activity. But Earth has cold ocean due to plate tectonic activity. Earth’s landscape/geological has constantly been changing over 100 million year chunks of time.
We don’t know much about Earth- and far less about Venus.
There is a lot of Oxygen in our solar system. 40% of mass of Lunar surface is oxygen. Same goes for Mars. Same goes for Earth’s rocky surface. Venus has vast amount oxygen which is CO2.
There a lot water in our solar system- the universe has a lot hydrogen- H2O abundant because their a lot of H and a lot of O. And there is fair amount of carbon in this universe.
I tend to think Venus was once a gas giant- and it shrunk. Or Venus once had Methane. And there are oceans of methane in our solar system, CH4.
We know little about formation of our solar system. We need to explore the Moon- and have more telescopes and watch solar systems form.
Earlier, Entropic Man wrote –
“Your hypothesis would need to explain why Earths surface is emitting 390W/m^2 according to the SB equation, but only 240W/m^2 escapes to space.”
Nonsense. Nobody knows what the Earth’s surface is emitting, SB equation or no. Nobody can or has measured the temperature of the surface, nor has anybody ever measured the continuously varying emissive properties of the surface.
The fact that the whole of the surface has cooled over the last four and a half billion years or so, and around half does so each winter, not to say every night, appears not to have penetrated his fantasy.
How does his description of the mythical GHE explain reality?
He probably can’t even describe the GHE. No wonder.
An interesting little paper:
http://webspace.pugetsound.edu/facultypages/jcevans/Pictet's%20experiment.pdf
The bit about how experiments led to interpretations we might find a little weird nowadays is worth mentioning. Goes on to show that Sky Dragon Cranks had more successful predecessors.
Wee Willy Willard talks about Sky Dragon Cranks, non-existent theories, Climateball and other products of his fantasies.
One of the signs of paranoia can be an inflated sense of ones own importance. More pronounced in cases of delusional psychosis – for example Michael Mann claiming to be a Nobel Laureate.
Wee Willys obsession with Mike Flynn, apparently based on nothing more than a strange fixation, is just another reason to think that Wee Willy may be barking mad, and quite irrational in his thinking.
Wee Willy, presenting a paper which points out that “cold rays dont actually exist, and that hotter bodies do not absorb heat from colder ones, just reinforces the irrational nature of his actions!
If Wee Willy imagines he is a poster child for GHE true believers, well and good. GHE true believers may not be flocking to his banner though. It is interesting to note how much support he gets here.
I have no doubt he will continue trolling, to the general amusement of people who are not barking mad like Wee Willy and others.
[MIKE FLYNN] non-existent theories
[ALSO MIKE FLYNN, QUOTING THE SKY DRAGON CRANK BOOK] “This is the world’s first and only full volume refutation of the greenhouse gas theory”
Strange Willard,
I don’t believe Mike Flynn ever quoted the words you put in his mouth, but who knows?
In your fantasy, Sky Dragon Crank Book Greenhouse Gas Theory exists!
Not in reality as far as I know, but of course your imaginary paranoid conversations with yourself may convince you otherwise.
You are obviously deranged!
Carry on.
Have you noticed how an inconsistency is hard to dodge, silly sock puppet?
Do continue to play dumb.
Willard, please stop trolling.
Interesting. Didnt read the interpretations, but the experiment works and makes sense in terms of radiant heat transfer.
The interpretations are only interesting insofar as they show how hard it is to come up with an explanation of something you see for the first time. For philosophers of science, they are gold. Hasok Chang has a very cool paper on this:
doi:10.1007/S00016-002-8362-8
I rediscovered it because a Sky Dragon Crank is arguing on Reddit that Pictets experiment disproves Tyndall gases.
I kid you not.
In fairness, arguing might be a tad too strong, as they only handwave to a paper:
https://www.researchgate.net/publication/338611709_Trapping_Radiant_Cold_Via_Mirrors
You got to hand it to cranks – they are *way* more imaginative than luckwarmers such as Richard!
Willard = idiot.
Compare and contrast:
[SKY DRAGON CRANK] Look, the atmosphere works like this:
https://character-stats-and-profiles.fandom.com/wiki/Breath_Attack
[RICHARD] Brandon comes up with a new term. “Hide the fail to incline”
Even Richard got to admit that the first line of argument is more imaginative!
Even Willard has to admit he is an idiot.
And so Richard admits that he’s PSTing, like Kiddo did.
No Climateball there. Nuh-uh.
Willard continues on with being self obsessed with ClimateBall that no-one else is interested in. At all.
Richard continue his mind probe while dissing Climateball, the concept that is meant to encompass routine behaviors like mind probing and dissing.
Willard never produces any facts or graphs or observations but instead is convinced that ClimateBall is the most important or only thing in climate.
On one hand he says that low pass filters are bad or useless, but then says that Mann using them is perfectly correct.
> On one hand he says that low pass filters are bad or useless
Did I?
Here, dummy:
https://archive.ipcc.ch/publications_and_data/ar4/wg1/en/ch3sappendix-3-a.html
No wonder you keep misrepresenting people!
You have on many occasion said that my use of low pass filters was bad or useless.
S-G is much more powerful in dealing with end effects with lots of support and research in industry. LOWESS is the statistics alternative. Why is it that ‘climate’ is unable to use what others have already researched and instead comes up with its own ‘roll your own’ solutions?
On matters of filters I only said two things, Richard –
They filter.
You are not their King, in fact you are using them to find the lowest limits justified disingenuousness can buy.
I have no idea why you believe I say things I cannot support. Contrarians can afford that. Not ninjas.
I use low pass filters to uncover similarities in series and to remove things that are less than 15 years long (and in some cases 12 months) to make things clearer. Why would you object to that?
“Why would you object to that?”
I object when you ask us to pay attention to noise on time scales much much shorter than 15 years, as if it is significant. Then tell us all that needs to be filtered out as if it is insignificant.
Meant to post this down here, something went wrong. If it appears elsewhere, sorry about that.
Entropic and Norman….quote from Entropic…
“The correct formulation is
There cannot be a NET flow of heat from a cooler to a warmer object by its own means.”
***
Read Clausius on it, he invented the 2nd law. He says nothing about ‘NET’. There is a reason for that, Clausius developed the law based on the PVT (pressure-volume-temperature) relationships in a heat engine. They are irreversible and do not apply in both directions.
About 50 years later, Bohr provided another good reason. He theorized, based on Planck’s quanta, that electrons could exist only in discrete energy states around an atomic nucleus. He was led to that insight when a colleague reminded him of hydrogen atomic spectra, wherein hydrogen absorbs and emits only at discrete frequencies. There is no continuum of frequencies in the spectra, they are so discrete they are called lines.
He wondered why, then it came to him. The lines were being caused by the sole electron in the hydrogen atom jumping back and forth between excited orbital states. When an electron in the ground state (non-excited) receives a quantum of EM that can excite it, the electron jumps to a higher energy state. When it jumps back to ground state, it emits a quantum of EM that corresponds exactly to the electrons frequency of rotation in the higher orbital and the potential energy difference between orbital states.
If the higher energy state is Eh and the lower energy state is El then (Eh – El) = E = hf.
That’s your relationship and it applies to both emitted EM and absorbed EM. If that relationship is not met, or exceeded, the electron simply wont react to it. Therefore incoming EM must have a specific intensity, E, and frequency, f. If that EM is from a cooler body it cannot provide the required E or f, therefore it is ignored.
Now think about what you are both claiming. If EM energy is going both ways, how does the electron respond to both? I know Norman thinks electron transitions only apply in certain instances, but that is wacko. What else is there in an atom or a molecule that can process EM? Nothing in atomic nucleii can process it and the only other particle is the electron.
Not just that, EM has an electric field and a magnetic field. What else in an atom has an electric field and a magnetic field? The electron. A proton may have an electric field but it has no magnetic field and it cannot jump back and forth between orbital states. Therefore E = hf does not apply to protons, neutrons, or any other sub-atomic particle.
There you have it, nothing else in an atom or a molecule can absorb or radiate EM. As I have claimed multiple times, a molecule is just a fancy name for two or more atomic nucleii bonded by electrons. So, even though it can vibrate and rotate, the molecules absorp.tion and emission is caused by electrons.
It is electron bonds that vibrate and rotate.
Quantum theory destroys the argument of both of you. Bodies of different temperatures cannot exchange heat. The heat can be transferred only from the hotter body to the colder body, whether by conduction, convection, or radiation. Clausius even states that re radiation, that it must obey the 2nd law and that’s his law, with no NET transfer.
The temperatures that Hydrogen can achieve is not solely bounded by the electron orbits around it.
A Hydrogen molecule can achieve all temperatures from absolute 0 to plasma.
Gordon,
” When it jumps back to ground state, it emits a quantum of EM that corresponds exactly to the electrons frequency of rotation in the higher orbital and the potential energy difference between orbital states.”
So which is it?
The electron’s frequency of rotation in the higher orbital?
Or the potential energy difference between the orbital states?
It’s a rhetorical question, it’s actually neither.
Look up your Bohr model again.
“Clausius developed the law based on the PVT (pressure-volume-temperature) relationships in a heat engine. They are irreversible and do not apply in both directions. ”
Then why do you think it applies to reversible processes such as the exchange of radiation between objects?
Gordon Robertson
YOU: “I know Norman thinks electron transitions only apply in certain instances, but that is wacko. What else is there in an atom or a molecule that can process EM? Nothing in atomic nucleii can process it and the only other particle is the electron.”
I have explained this to you many times and given you countless links on the topic to learn about it.
The atomic nucleus has a positive charge. An electromagnetic wave is generated when a charge field changes. A proton accelerating will produce EMR.
http://labman.phys.utk.edu/phys222core/modules/m6/production_of_em_waves.html
The reason that N2 NS O2 do not generate IR is because there is no dipolar element to the molecule. No oscillating charges. In a polar molecule you have oscillating charges so you will produce EMR at certain frequencies corresponding directly to the nature of the oscillation.
Since you are an engineer and have taken advanced math why not show us what electron transition in an atom is small enough in energy to produce mid-range IR? Calculate it out, what electron jumps are causing this radiant energy?
Even your expert Linus Pauling clearly explained molecular vibrations. I do not know why you are not able to understand an oscillating electric field in a polar molecule generating an EM wave.
wonky willie wanker is still confused about Sky Dragons. Slaying the Sky Dragon is the title of a book that talks about slaying the sky dragon of AGW theory.
Proof…an intro for the book….
“Even before publication Slaying the Sky Dragon was destined to be the benchmark for future generations of climate researchers. This is the world’s first and only full volume refutation of the greenhouse gas theory of man-made global warming”.
https://www.chapters.indigo.ca/en-ca/books/slaying-the-sky-dragon-death/9780956722133-item.html
Ironically, the book is still available but the site has been censored, likely by the same neo-Nazis holding out in the steel factory at Mariupol.
https://thegrayzone.com/2022/03/18/bombing-mariupol-theater-ukrainian-azov-nato-intervention/
https://consortiumnews.com/2022/03/06/robert-parry-when-us-house-saw-ukraines-neo-nazis/
> This is the world’s first and only full volume refutation of the greenhouse gas theory
A refutation of a theory Mike Flynn claims does not exist, no less.
The confusion is all our most feisty sock puppet – Sky Dragon Cranks pretend they slayed the Greenhouse Theory when they did no such thing.
Aw diddums!
Whacky Wee Willy,
There is no Greenhouse Theory, Greenhouse Effect Theory, or Greenhouse Gas Theory. These are all figments of your paranoid fantasies.
Likewise, Sky Dragon Cranks are another figment of your twisted fantasy, just like Climateball (whatever that is supposed to be), and your pointless fixation on Mike Flynn (whoever that is).
Keep inventing nonsense. I am interested in seeing just how far you go, as you are unlikely to realise how deranged your utterances are!
> There is no Greenhouse Theory, Greenhouse Effect Theory, or Greenhouse Gas Theory.
So you say, Mike.
Yet here’s what you quoted:
You can’t refute something that does not exist. See? That’s consistency!
Cheers.
Wonky Willard,
As you say, Mike can’t refute something that doesn’t exist!
Are you trying to claim that Gordon Robertson is also really Mike Flynn?
Gordon Robertson made the quote, but you keep insisting it was Mike Flynn!
How many people do you claim Mike Flynn is pretending to be, and why? You really are a paranoid dimwit, aren’t you?
It’s hard to follow who you accuse of being whom – and why. Being obscure and cryptic just reinforces the picture of you being an insecure and ineffective troll, and blaming your difficulties on Mike Flynn.
Any time I get bored watching reruns of Abbot and Costello for the 1,376th time, I tune in to Willard. His material is better.
Mike,
If you cannot refute something that does not exist, how come Sky Dragon Cranks refute it in their magnum opus? As a Sky Dragon Crank yourself, that ought to raise some consistency issues. Not that you ever showed any care for consistency, mind you.
Have you ever opened what should be your Bible? I am sure you could find in it what you kept asking for a decade on this blog!
Long live and prosper.
Wanking Wee Willy,
You wrote –
“Mike,
If you cannot refute something that does not exist, how come Sky Dragon Cranks refute it in their magnum opus?”
Why should Mike respond to something addressed to me? Are you quite delusional and devoid of common courtesy? If you choose to use incomprehensible nonsense like “Sky Dragon Cranks” and “their magnum opus”, you must expect to be regarded as some sort of strange lunatic, terrified of non-existent phantoms!
As to myself, there is no Greenhouse Theory, nor any Greenhouse Effect Theory, if that is what you are trying to imply in your usual obscure fashion. If you claim imaginary people are “refuting” imaginary “Theories”, why would you imagine that I would be interested at all?
Maybe you have an inflated sense of your own importance, and are obsessed with the thought that Mike Flynn is pursuing you by pretending to be others! Paranoia, but of course the sufferer believes their fantasy world is reality.
Tell me, what benefit do you think you get by insisting that Mike Flynn is myself or Gordon Robertson?
[chortle]
Mike Flynn,
The book you just quoted and cited.
With “Sky Dragon” in its title.
Written by cranks like you.
Having slain nothing.
The only book they wrote.
That book.
Sky Dragon Crank magnum opus.
Hope this helps you being less silly, silly sock puppet.
Willard you dimwit.
If you believe I am Gordon Robertson (who mentioned a book called Slaying the Sky Dragon”), as well as myself and Mike Flynn, you are definitely off with the fairies!
I don’t believe I have ever referred to that book. As to Mike Flynn, I cannot say.
I certainly didn’t write that book, and I have never read it. Presumably you disagree with its content, but you won’t achieve much complaining to me.
Do the authors describe a Greenhouse Theory? Is it the same as the one you claim to have?
Maybe you should let the authors know that their non-existent Greenhouse Theory is inferior to your non-existent Greenhouse Theory, and you could refute away at each other as much as you like!
Nothing to do with me (or Mike Flynn, I guess).
You really are an oddball, with your imaginary theories, games, offers, deals, and all the rest.
Keep trying.
Mike Flynn,
You ask –
“Why should Mike respond to something addressed to me?”
Because you’re Mike Flynn, silly sock puppet.
Willard, please stop trolling.
Solar wind
speed: 545.4 km/sec
density: 4.77 protons/cm3
Sunspot number: 64
Thermosphere Climate Index
today: 14.55×10^10 W Neutral
Oulu Neutron Counts
Percentages of the Space Age average:
today: +5.8% High
Not doing much for Solar Max
In terms space GCR bad time to go to Mars,
continues- and I am guessing it will continue for next week,
But maybe I will pick up in couple weeks.
Sunspot number: 66
today: 14.5110^10 W Neutral
today: +6.5% High
Still bad time to go to Mars
Maybe better in couple weeks
Solar wind
speed: 292.4 km/sec
density: 11.17 protons/cm3
[[X-CLASS SOLAR FLARE: Earth-orbiting satellites have just detected an X1.5-class solar flare (May 10th @ 1355 UT). The source is “mixed-up” sunspot AR3006, described below. Radiation from the flare ionized the top of Earth’s atmosphere, causing a shortwave radio blackout over the Atlantic Ocean.]]
Sunspot number: 71
[looks to me like number going go lower, within day or two.]
Thermosphere Climate Index
today: 14.48×10^10 W Neutral
Oulu Neutron Counts
Percentages of the Space Age average:
today: +5.5% High
48-hr change: -0.9%
Solar wind
speed: 296.7 km/sec
density: 12.86 protons/cm3
[X-CLASS SOLAR FLARE: “Mixed-up” sunspot AR3006 exploded on May 10th (1355 UT), producing an intense X1.5-class solar flare. NASA’s Solar Dynamics Observatory recorded the extreme ultraviolet flash:]]
What does extreme ultraviolet flash do “climate/weather wise?
Sunspot number: 62
{only went to 62- I thought it would be lower. but anyhow, seems to me pause/dip in the solar max}
Thermosphere Climate Index
today: 14.32×10^10 W Neutral
Oulu Neutron Counts
Percentages of the Space Age average:
today: +6.2% High
48-hr change: +0.3%
Continues to seem to me to be poor time to be traveling to Mars, of course doesn’t matter in terms going to the Moon, and who knows when we going to Moon, let alone, Mars.
Solar wind
speed: 324.3 km/sec
density: 8.68 protons/cm3
[THE FIRST SUNQUAKE OF SOLAR CYCLE 25
I wonder how big wave are }
Sunspot number: 120
Thermosphere Climate Index
today: 14.10×10^10 W Neutral
Oulu Neutron Counts
Percentages of the Space Age average:
today: +6.3% High
48-hr change: -0.3%
Getting back up there
norman…”More likely only and idiot would think that no further experiments and tests were done on the Stefan-Boltzmann relationship over the next 143 years since it was derived”.
***
If you know of any tests that confirm that a grey body like the Earth’s surface, with an average temperature of 15C, meets the S-B equation requirements could you link to them?
With regard to the evil Putin, he claims to be hunting Nazis who are harming Russians, in the Donbas region. He has one of that group surrounded in Mariupol, the Azov battalion, and it looks like lights out for them since they won’t surrender.
Why do you suppose they won’t surrender, Norman? Could it be they have been torturing Ukrainian citizen’s in Mariupol, killing them, shooting captured Russian soldiers in the legs, and holding Ukrainians hostage in the steel mill? Could it be they have blown up buildings, claiming they were full of children, then blaming it on Russian bombs?
Here’s evidence for you, Normie.
https://thegrayzone.com/2022/03/18/bombing-mariupol-theater-ukrainian-azov-nato-intervention/
Gordon Robertson
I investigated the source of your “evidence”. The website Grayzone was founded by Max Blumenthal who contributes to both Sputnik and RT. I would not consider this site to be a valid unbiased reporting site. This is a pro=Russian website and anti-west. Probably gets money from Russia directly to run this blog.
https://en.wikipedia.org/wiki/Max_Blumenthal
As for the S-B experiments I have already linked you them. It does not matter with you. You reject it any way so why do you ask for it?
http://www.jbgilmer.com/LabManual/LabReportsManualAppJEx4.pdf
https://stuff.lanowen.com/Physics/Labs/Phys%20260L/P260L-Experiment%204%20-%20S13.pdf
These are just a few that exist on the web. I am sure you could go to a library and find them in science journals. College students do experiments in classes to verify the Stefan-Boltzmann Law. If you want to believe crackpots like Gary Novak (who of course does zero experiments on anything, he does offer his opinions on everything).
Gordon the difference between types like Clint R and Gary Novak and scientists it that scientists have evidence for their ideas. Like Roy Spencer’s experiment I linked you to or the ones in this post. Gary Novak and Clint R are arrogant opinionated people who just babble about things they do not understand.
Case of point, above Clint R tries to pretend he has found something no scientist thought about, the Inverse Square Law for measuring OLR from the Earth system. I did show his error and stupid opinion. It did not matter he posts it again. I do not think there is a human behind that poster. I think it is a bot, shows zero sign of human intellect and very repetitive just like a bot would be.
Norman, I see you’re still obsessed with me. I’m flattered.
Your false accusations and bogus claims only prove that you have NOTHING. Most enjoyable, please continue.
https://youtu.be/XTfnldWBi00
TM, Houston will be hot and humid from May through October.
Now you can find something useful to do with your time.
And this is different from a typical La Nina how?
Can It always be abnormally hot and humid?
Hot in some areas at some times. Cold/wet in others. Do you disagree?
I believe that “abnormally hot and humid” means it’s abnormally hot and humid, Richard.
What about you?
Do you agree that La Nina causes both hot/dry and cold/wet areas to appear in the USA?
When confronted with a very simple observation, i.e. that “abnormally hot and humid” means abnormally hot and humid, Richard returns to a Climateball fan favorite – leading questions.
Willard agrees that La Nina causes both hot/dry and cold/wet areas to appear in the USA.
Richard agrees that he’s playing Climateball when he’s writing comments that start with “X agrees.”
Willard thinks that ClimateBall is more important than everything else. To him it might be. To everybody else, not at all.
Richard thinks that mind probing is not Climateball but part of the scientific process and rational argumentation.
Willard is just an idiot.
Whickering Willard,
“Richard thinks that mind probing is not Climateball but part of the scientific process and rational argumentation.”
Mind probing? Climateball?
Added mind reading to your list of your imaginary powers, have you?
Try throwing in a few facts, if you can figure out what a fact is.
Mike Flynn,
Mind probing:
https://starwars.fandom.com/wiki/Mind_probe_(Force_power)
Climateball:
https://climateball.net
Do continue to play dumb, and please, very please, do ask me what “playing dumb” means!
Whacky Wee Willy,
You drooled –
“Do continue to play dumb, and please, very please, do ask me what “playing dumb” means!”
You cloth-eared fool, obviously your paranoid inflated sense of your own self importance has infected your brain.
“Please, very please” is the sort of English expression more suited to a very small child, someone afflicted with a learning disability or someone like you.
In any case, justifying your silliness with one link apparently referring to a fantasy, and another link to what is clearly a fantasy, demonstrates to onlookers the state of your mind. Deranged.
Carry on.
Thank you, Mike.
I will.
My pleasure. You don’t need to thank me.
I have a duty to help those less fortunate than myself. I seek no reward.
Carry on.
Thank you, Mike.
You don’t need to thank Mike, either, but I realise you can’t overcome your OCD.
Carry on.
Thanks again, Mike.
Willard, please stop trolling.
Brandon comes up with a new term. ‘Hide the fail to incline’ in 3 out of 4 of his proxy series.
Seen here in red.
https://imgur.com/a/8vap58I
Richard comes up with a new Climateball move – putting words into his the mouth of those who put him to work!
So what is your explanation for that observation? Oh, I forgot, you don’t do explanations.
You are surely not saying that that observation is not there.
P.S. There are pictures attached to those words.
Richard is certainly not rejecting the idea that arguing by double negatives is part of a well-rounded Climateball kit.
Willard being an idiot is definitely part of CimateBall that he created.
*ClimateBall
Richard discovered the secret square:
https://climateball.net/but-climateball
There’s no secret that escapes him.
Willard is definitely an idiot.
He has no explanation of why proxies do not follow Had5 either.
Richard will just peddle his current pet topic in every subthread, as if anybody but him and RG followed that discussion.
Peddling is an important Climateball trick:
https://andthentheresphysics.wordpress.com/2017/06/16/peddling/
In my Manual, there will be a character called The Peddler.
Willard will but in and yet never actually address anything. Other than his very own ClimateBall of course.
*butt
When you’ll stop I will, dummy.
For now I’m making sure you understand that everybody can see that your Pure Scientist act is mere posturing.
Welcome to Climateball!
And I, in turn, will make sure that everybody knows that you are an idiot.
And that just adding proxies together does not quite work as people expect. Especially when referencing things against instrument records.
If you think that saying “idiot” amounts to show that I am one, dummy, then I think it’s safe to say that you’re not very good at Climateball.
But do continue to pretend you know more and better ways to process time series than scientists while displaying total ignorance of basic formal concepts.
https://climatedatablog.wordpress.com/2014/02/19/first-post/
see Fig9.
Was that as long ago as 2014? Apparently.
Willard doesn’t like verification. Especially if it doesn’t show what he expects.
Richard’s first post was based on work by GregG, whom had to rework his stuff because Vaughan stepped in. But then Richard might not even have noticed I commented on that thread at Judy’s at that time.
We really need better contrarians.
Willard: So it turns out that Mann used low pass filters but for some reason didn’t use S-G which is well known in industry instead of trying to ‘improve’ his own Butterworth version.
AFAIK he didn’t give a reason for using 40 years as a corner frequency but I have valid reasons for choosing 15 years as I have mentioned before.
Willard doesnt like verification.
Here is Richard:
https://climatedatablog.wordpress.com/2014/02/19/first-post/
Here is Vaughan:
https://judithcurry.com/2013/11/22/data-corruption-by-running-mean-smoothers/#comment-417213
I’ll let Richard find out who’s the elephant in this exchange.
Willard fails to mention that I always used VPs figures for my CTRMs. The use of S-G came later when I found out the numbers that meant that it matched the gaussian CTRM.
> And that just adding proxies together does not quite work as people expect. Especially when referencing things against instrument records.
Why do 38 non-global proxy series do so well against the instrumental record, Richard?
https://i.imgur.com/evIzu7N.png
(The high variability beginning in the late-90s is due to the number of ensemble member falling from 38 to below ten.)
“Why do 38 non-global proxy series do so well against the instrumental record”
They do not match very well if you plot them individually. They do not match very well if the add them all together against the instrument record either.
https://i.imgur.com/aIMDF9Z.png
In fact GISS and Had do not match very well between 1900 and 1980 for that matter.
https://i.imgur.com/KXMDx0B.png
> They do not match very well if you plot them individually. They do not match very well if the add them all together against the instrument record either.
> https://i.imgur.com/aIMDF9Z.png
That same plot you’ve been showing doesn’t address my question.
*This* is what you should be looking at: a 34-member ensemble of *local* proxies in good agreement with HAD5:
https://imgur.com/gallery/nQlBSWY
> In fact GISS and Had do not match very well
Caught pulling a fast one, Richard changes the subject.
My whole point is that ensembles are a very bad way of doing things. What it does is reduce to nothing the differences between individual proxies.
I’m not changing the subject. I am informing people that GISS and Had do not agree well, one with another, over quite a large chunk of their record. Are you saying that the maths is wrong or just inconvenient?
> Caught pulling a fast one, Richard changes the subject.
Richard is a natural at Climateball.
I did not change the subject. I observed that Had and GISS do not agree. one with the other, over a large range of the times they both cover.
Willard: Do you also believe that adding a low pass filter, say a simple running mean, reduces or increases the length of the data record?
Here’s what I believe, Richard:
1. In your post, you epilogue on the sad state of the understanding of signal processing techniques in climate science while promoting Greg’s work.
2. What you call Vaughan’s “input” was a bit more than valuable, as Greg basically stole his filter from him.
3. According to Vaughan, Greg has very a rudimentary idea of what he’s doing, in fact Greg fails to get that “The triple running mean also approximates gaussian,” as Pekka succinctly put it in a comment.
4. That means your epilogue is beyond ridiculous.
Wee Willy Wanker,
You really believe that anybody cares about your delusional belief that anyone willingly indulges your Climateball fantasy, do you?
About as delusional as Mike Mann claiming a Nobel prize!
How are you going with your imaginary Greenhouse Theory? It seems like you could incorporate it into your imaginary Climateball (whatever that is), or your Sky Dragon Cranks (whoever they are) fantasy.
Oh, and have you decided who else Mike Flynn is pretending to be, in addition to me and Gordon Robertson? Warnie, Pup, Troglodyte?
Time for you to thrust your hand into your trousers again, and vigorously massage whatever lies within. That will take your mind off whatever is bothering you – if only briefly.
Dimwit.
Mike Flynn,
My “here’s what I believe” was in response to Richard’s sentence that starts with “do you believe.”
You really are not very good at this.
Try again!
So Willard doesn’t (or doesn’t want to) know the answer. Just posts other stuff instead.
So Richard deflects from his own deflection.
He’s that good a Climateball player!
Weepy Wee Willy,
You dribbled –
“You really are not very good at this.”
And I am supposed to value your opinion because . . . ?
Try learning how to troll properly, moron.
Thrusting your other into your trousers won’t help. It will overload your brain, affect your balance, you will fall off your chair, and quite possibly break something you don’t want broken.
Actually, go for it. If you do yourself an injury, don’t expect sympathy. You did it to yourself.
Carry on.
Mike Flynn, Maniacal Flair.
Willard,
Reduced to idiocy, now?
Just continuously repeating the name Mike Flynn doesnt seem to be achieving much, does it?
Maybe your paranoia tells you that repeatedly naming the thing you fear will lessen its power over you!
Here, I’ll help – Mike Flynn, Mike Flynn . . . .
Feel free to repeat as many times as you wish. It won’t help, you know. I realise your OCD overtones won’t let you stop. Oh well.
Carry on.
Don’t you ever get tired of writing the same comment every day, Mike?
I hope you don’t.
For I never miss a chance to skip it!
Play dumb again.
C’mon Silly Willy,
Writing cryptic nonsense like “Don’t you ever get tired of writing the same comment every day, Mike” just makes you look like the ineffective incompetent troll that you are.
Is your OCD making your fantasy repeat itself?
Accept reality, moron.
When is playing dumb turning into gaslighting, Mike?
Same pitch. Find another one.