Explaining Mauna Loa CO2 Increases with Anthropogenic and Natural Influences

April 9th, 2022 by Roy W. Spencer, Ph. D.

SUMMARY

The proper way of looking for causal relationships between time series data (e.g. between atmospheric CO2 and temperature) is discussed. While statistical analysis alone is unlikely to provide “proof” of causation, use of the ‘master equation’ is shown to avoid common pitfalls. Correlation analysis of natural and anthropogenic forcings with year-on-year changes in Mauna Loa CO2 suggest a role for increasing global temperature at least partially explaining observed changes in CO2, but purely statistical analysis cannot tie down the magnitude. One statistically-based model using anthropogenic and natural forcings suggests ~15% of the rise in CO2 being due to natural factors, with an excellent match between model and observations for the COVID-19 related downturn in global economic activity in 2020.

Introduction

The record of atmospheric CO2 concentration at Mauna Loa, Hawaii since 1959 is the longest continuous record we have of actual (not inferred) atmospheric CO2 concentrations. I’ve visited the laboratory where the measurements are taken and received a tour of the facility and explanation of their procedures.

The geographic location is quite good for getting a yearly estimate of global CO2 concentrations because it is largely removed from local anthropogenic sources, and at a high enough altitude that substantial mixing during air mass transport has occurred, smoothing out sudden changes due to, say, transport downwind of the large emissions sources in China. The measurements are nearly continuous and procedures have been developed to exclude data which is considered to be influenced by local anthropogenic or volcanic processes.

Most researchers consider the steady rise in Mauna Loa CO2 since 1959 to be entirely due to anthropogenic greenhouse gas emissions, mostly from the burning of fossil fuels. I won’t go into the evidence for an anthropogenic origin here (e.g. the decrease in atmospheric oxygen, and changes in atmospheric carbon isotopes over time). Instead, I will address evidence for some portion of the CO2 increase being natural in origin. I will be using empirical data analysis for this. The results will not be definitive; I’m mostly trying to show how difficult it is to determine cause-and-effect from the available statistical data analysis alone.

Inferring Causation from the “Master Equation”

Many processes in physics can be addressed with some form of the “master equation“, which is a simple differential equation with the time derivative of one (dependent) variable being related to some combination of other (independent) variables that are believed to cause changes in the dependent variable. This equation form is widely used to describe the time rate of change of many physical processes, such as is done in weather forecast models and climate models.

In the case of the Mauna Loa CO2 data, Fig. 1 shows the difference between the raw data (Fig. 1a) and the more physically-relevant year-to-year changes in CO2 (Fig. 1b).
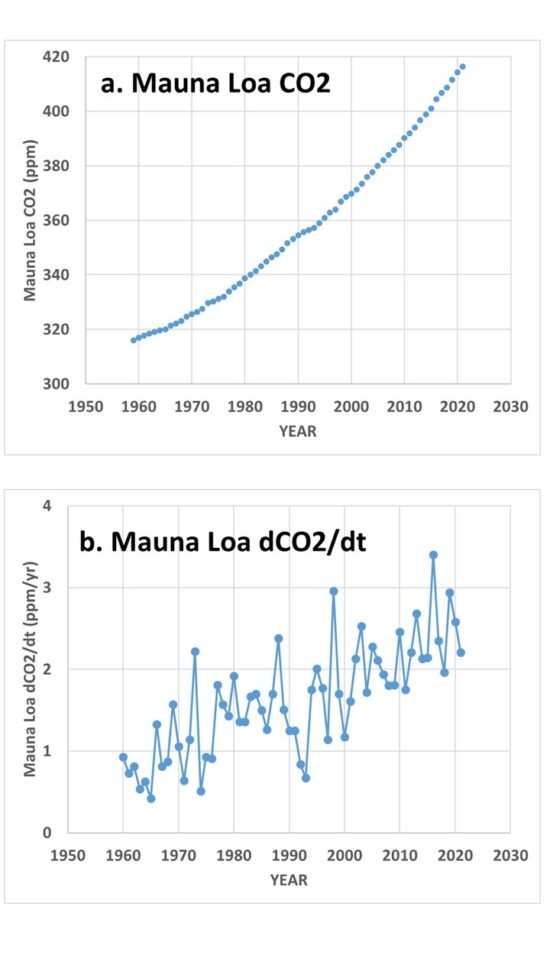
Fig. 1. Mauna Loa CO2 data, 1959-2021, show as (a) yearly average values, and (b) year-on year changes in those values (dCO2/dt).

If one believes that year-to-year changes in atmospheric CO2 are only due to anthropogenic inputs, then we can write:

dCO2/dt ~ Anthro(t),

which simply means that the year-to-year changes in CO2 (dCO2/dt, Fig. 1b) are a function of (due to) yearly anthropogenic emissions over time (Anthro(t)). In this case, year-on-year changes in Mauna Loa CO2 should be highly correlated with yearly estimates of anthropogenic emissions. The actual relationship, however, is clearly not that simple, as seen in Fig. 2, where the anthropogenic emissions curve is much smoother than the Mauna Loa data.
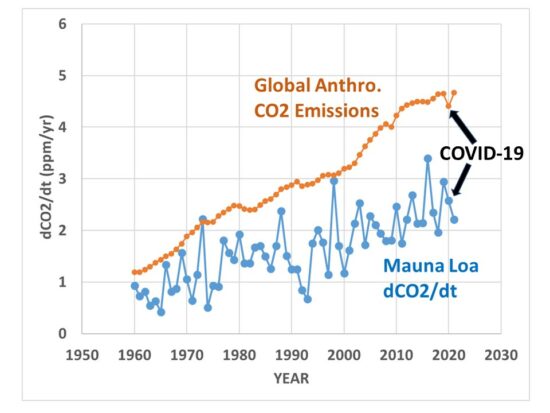
Fig. 2. Mauna Loa year-on-year observed changes in CO2 versus estimate of global anthropogenic emissions.

Therefore, there are clearly natural processes at work in addition to the anthropogenic source. Also note those natural fluctuations are much bigger than the ~6% reduction in emissions between 2019 and 2020 due to the COVID-19 economic slowdown, a point that was emphasized in a recent study that claimed satellite CO2 observations combined with a global model of CO2 transports was able to identify the small reduction in CO2 emissions.

So, if you think there are also natural causes of year-to-year changes in CO2, you could write,

dCO2/dt ~ Anthro(t) + Natural(t),

which would approximate what carbon cycle modelers use, since it is known that El Nino and La Nina (as well as other natural modes of climate variability) also impact yearly changes in CO2 concentrations.

Or, if you think year-on-year changes are due to only sea surface temperature, you can write,

dCO2/dt ~ SST(i),

and you can then correlate year-on-year changes in CO2 to a dataset of yearly average SST.

Or, if you think causation is in the opposite direction, with changes in CO2 causing year-on-year changes in SST, you can write,

dSST/dt ~ CO2(t),

in which case you can correlate the year-on-year changes in SST with CO2 concentrations.

In addition to the master equation having a basis in physical processes, it avoids the problem of linear trends in two datasets being mistakenly attributed to a cause-and-effect relationship. Any time series of data that has just a linear trend is perfectly correlated with every other time series having just a linear trend, and yet that perfect correlation tells us nothing about causation.

But when we use the time derivative of the data, it is only the fluctuations from a linear trend that are correlated with another variable, giving some hope of inferring causation. If you question that statement, imagine that Mauna Loa CO2 has been rising at exactly 2 ppm per year, every year (instead of the variations seen in Fig. 1b). This would produce a linear trend, with no deviations from that trend. But in that case the year-on-year changes are all 2 ppm/year, and since there is no variation in those data, they cannot be correlated with anything, because there is no variance to be explained. Thus, using the master equation we avoid inferring cause-and-effect from linear trends in datasets.

Now, this data manipulation doesn’t guarantee we can infer causation, because with a limited set of data (63 years in the case of Mauna Loa CO2 data), you can expect to get some non-zero correlation even when no causal relationship exists. Using the ‘master equation’ just puts us a step closer to inferring causation.

Correlation of dCO2/dt with Various Potential Forcings

Lag correlations of the dCO2/dt data in Fig. 1b with estimates of global anthropogenic CO2 emissions, and with a variety of natural climate indicies, are shown in Fig. 3.
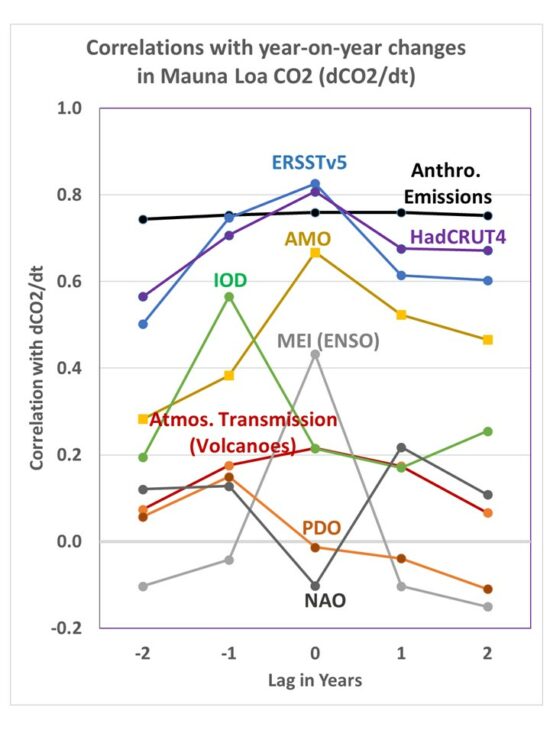
Fig. 3. Lag correlations of Mauna Loa dCO2/dt with various other datasets: Global anthropogenic emissions, tropical sea surface temperature (ERSST), global average surface temperature (HadCRUT4), the Atlantic Multi-decadal Oscillation (AMO), the Indian Ocean Dipole (IOD), the Multivariate ENSO Index (MEI), Mauna Loa atmospheric transmission (mostly major volcanoes),the Pacific Decadal Oscillation (PDO), and the North Atlantic Oscillation (NAO).

The first thing we notice is that the highest correlation is achieved with the surface temperature datasets, (tropical SST or global land+ocean HadCRUT4). This suggests at least some role for increasing surface temperatures causing increasing CO2, especially since if I turn the causation around (correlate dSST/dt with CO2), I get a very low correlation, 0.05.

Next we see that the yearly estimates of global anthropogenic CO2 emissions is also highly correlated with dCO2/dt. You might wonder, if the IPCC is correct and all of the CO2 increase has been due to anthropogenic emissions, why doesn’t it have the highest correlation? The answer could be as simple as noise in the data, especially considering the emissions estimates from China (the largest emitter) are quite uncertain.

The role of major volcanic eruptions in the Mauna Loa CO2 record is of considerable interest. When the atmospheric transmission of sunlight is reduced from a major volcanic eruption (El Chichon in 1983, and especially Pinatubo in 1991), the effect on atmospheric CO2 is to reduce the rate of rise. This is believed to be the result of scattered, diffuse sky radiation penetrating deeper into vegetation canopies and causing enhanced photosynthesis and thus a reduction in atmospheric CO2.

Regression Models of Mauna Loa CO2

At this point we can choose whatever forcing terms in Fig. 3 we want, and do a linear regression against dCO2/dt to get a statistical model of the Mauna Loa CO2 record.

For example, if I use only the anthropogenic term, the regression model is:

dCO2/dt = 0.491*Anthro(t) + 0.181,

with 57.8% explained variance.

Let’s look at what those regression terms mean. On average, the yearly increase in Mauna Loa CO2 equals 49.1% of total global emissions (in ppm/yr) plus a regression constant of 0.181 ppm/yr. If the model was perfect (only global anthropogenic emissions cause the CO2 rise, and we know those yearly emissions exactly, and Mauna Loa CO2 is a perfect estimate of global CO2), the regression constant of 0.181 would be 0.00. Instead, the anthro emissions estimates do not perfectly capture the rise in atmospheric CO2, and so a 0.181 ppm/yr “fudge factor” is in effect included each year by the regression to account for the imperfections in the model. It isn’t known how much of the model ‘imperfection’ is due to missing source terms (e.g. El Nino and La Nina or SST) versus noise in the data.

By using additional terms in the regression, we can get a better fit to the Mauna Loa data. For example, I chose a regression model that includes four terms, instead of one: Anthro, MEI, IOD, and Mauna Loa atmospheric transmission. In that case I can improve the regression model explained variance from 57.8% to 82.3%. The result is shown in Fig. 4.
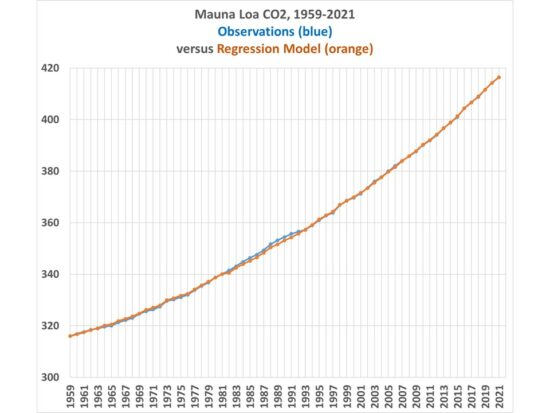
Fig. 4. Yearly Mauna Loa CO2 observations versus a 4-term regression model based upon anthropogenic and natural forcing terms.

In this case, the only substantial deviations of the model from observations is due to the El Chichon and Pinatubo volcanoes, since the Pinatubo event caused a much larger reduction in atmospheric CO2 than did El Chichon, despite the volcanoes producing very similar reductions in solar transmission measurements at Mauna Loa.

In this case, the role of anthropogenic emissions is reduced by 15% from the anthro-only regression model. This suggests (but does not prove) a limited role for natural factors contributing to increasing CO2 concentrations.

The model match to observations during the COVID-19 year of 2020 is very close, with only a 0.02 ppm difference between model and observations, compared to the 0.24 ppm estimated reduction in total anthropogenic emissions from 2019 to 2020.

Conclusions

The Mauna Loa CO2 data need to be converted to year-to-year changes before being empirically compared to other variables to ferret out possible causal mechanisms. This in effect uses the ‘master equation’ (a time differential equation) which is the basis of many physically-based treatments of physical systems. It, in effect, removes the linear trend in the dependent variable from the correlation analysis, and trends by themselves have no utility in determining cause-versus-effect from purely statistical analyses.

When the CO2 data are analyzed in this way, the greatest correlations are found with global (or tropical) surface temperature changes and estimated yearly anthropogenic emissions. Curiously, reversing the direction of causation between surface temperature and CO2 (yearly changes in SST [dSST/dt] being caused by increasing CO2) yields a very low correlation.

Using a regression model that has one anthropogenic source term and three natural forcing terms, a high level of agreement between model and observations is found, including during the COVID-19 year of 2020 when global CO2 emissions were reduced by about 6%.


2,285 Responses to “Explaining Mauna Loa CO2 Increases with Anthropogenic and Natural Influences”

Toggle Trackbacks

  1. CO2isLife says:

    I didn’t see ocean temperature as a causative factor. Henry’s Law pretty much dictates atmospheric CO2. Warm the oceans and you degas CO2. The oceans exchange many x man’s production of CO2 on an annual basis, and a small change in Ocean degasing can easily overwhelm anything man produces. Has anyone bothered to measure the change in atmospheric CO2 due to the warming of the oceans?

    • stephen p anderson says:

      This is good. I’ve wondered what is causing the change in surface temperature. Is it Solar activity or some cycle, or what?

    • From what I’ve read, Henry’s Law combined with an average ocean mixed layer temperature increase of 1 deg. C, would lead to an equilibrium increase in atmospheric CO2 of only around 10 ppm, not the 100 ppm that has been observed.

      • CO2isLife says:

        Dr. Spencer, how about working backwards on this one.

        1) How much CO2 has been added to the atmosphere over the last 60 years?

        2) What is the volume of the Epipelagic Zone of the Ocean (Top 200 meters)(Layer that is impacted by incoming visible radiation)

        3) Temperature change required of the Epipelagic Zone to release the CO2 listed in #1 above.

        4) How much has the Epipelagic Zone temperature increased over the past 60 years.

        I’m showing that ocean temperatures have increased by about 0.76 C since 1959 when the CO2 measurements started.
        https://cdn.statcdn.com/Infographic/images/normal/19418.jpeg

        Ocean temperatures and CO2 also look pretty highly correlated over that time period, both showing a relatively constant and smooth increase.

          • BrittanyFloyd says:

            Helllo

          • BrittanyFloyd says:

            I actually have received $30,700 in no extra than 30 days via running part-time via a laptop. Just once I had misplaced my final job, (dro-20) I changed into so perturbed however happily I received this easy on-line provide now doing this I am equipped to get thousand of greenbacks from the consolation of my home. All of you may actually do that profession and advantage extra cash on-line traveling following site.
            .
            >>>>>>>>>>

          • BrittanyFloyd says:

            I actually have received $30,700 in no extra than 30 days via running part-time via a laptop. Just once I had misplaced my final job, (dro-30) I changed into so perturbed however happily I received this easy on-line provide now doing this I am equipped to get thousand of greenbacks from the consolation of my home. All of you may actually do that profession and advantage extra cash on-line traveling following site.
            .
            >>>>>>>>>> https://dollarscash12.blogspot.com/

      • DMacKenzie says:

        One must add in the complication that it isnt just 1 degree of mixed layer temp, but for example the warm Gulf Stream being able to absorb (by Henrys law) much more CO2 as it moves North and cools by by 25C before sinking into the abyss with its high CO2 load, which must appear somewhere about a millennium later.integrated over all the worldwide ocean currents.

      • Perfecto says:

        Maybe the relationship of Henry’s Law to ocean CO2 exchange is not so well understood? The amount of exchange depends on surface area. Waves with whitecap foam and droplet sprays add huge unknowns.
        After all, human lungs are said to have the surface area of a tennis court. Foamy waves have similar morphology.

        • Perfecto says:

          What is the air/water interface area of the World’s shorelines? https://youtu.be/vPhg6sc1Mk4

        • Perfecto says:

          Why wouldn’t this order-of-magnitude for O2 apply to CO2? Perhaps 10 ppm is really 100 ppm.
          “We demonstrate that two-thirds of the annual oxygen uptake occurs over only 40 days in winter and is associated with a bubble-mediated component of airsea gas transfer linked to episodic high winds, strong cooling and deep convective mixing. By neglecting the bubble-mediated flux component, global models may underestimate oxygen and atmospheric potential oxygen uptake in regions of convective deep-water formation by up to an order of magnitude. ” https://www.nature.com/articles/s41561-020-0532-2

      • Bart says:

        It’s a transport problem, not a static pool. There is a continuous flow into and out of the surface system. Any imbalance leads to a trend.

        The rate of change still shows the rate of change of atmospheric CO2 tracking temperature anomaly.

        https://woodfortrees.org/plot/esrl-co2/mean:12/from:1979/derivative/plot/uah6/scale:0.18/offset:0.171

      • Dixon says:

        Bit late to this – you would expect some (how much?) CO2 to be involved in primary production by phytoplankton. So the release of CO2 from just Henry’s Law and atmospheric levels is too simplistic. I guess the carbon cycle modellers try and factor that in.

        One of the problems with this analysis might be that SST could be a very poor proxy for ocean temperatures because it comes from a tiny thin skin of top ocean and would be significantly biased hot on still clear sky days.

    • Fritz Kraut says:

      CO2isLife says:
      ..”Warm the oceans and you degas CO2.”
      ___________________________________
      Thats not what Henry`s Law says.
      It may happen, but not necessarily.
      It depends on partial pressure in atmosphere, and in ocean.
      Actually oceans still absorb CO2 and dont yet degas.

    • Glaciation cycles are estimated to be about a 5-10C variation in average global temperature.

      That drives about a 100 ppmv change in atmospheric CO2 level that takes thousands of years.

      But weve measured a 100 ppmv increase in atmospheric CO2 level since 1958:

      For global warming to cause such a large increase in CO2 level would obviously require MORE than than the 5-10C global temperature change (Earth has when going from glacial maximum to peak interglacial warmth.

      Has the Earth warmed by more than 5-10C since 1958?

      Of course not.
      much more CO2 in the atmosphere than there should be based on Henrys Law and the current average temperature of the ocean surface.

      The extra CO2 is the result of centuries of accumulation of man made CO2 emissions.

      The temperature dependence of Henrys Law decreases effective CO2 solubility in water by about 3% per 1C of surface water warming

      A 50% increase in atmospheric CO2 partial pressure increases effective CO2 solubility in water by 50%.

      Which one has the greater effect, +50% or -3%?

      Ocean temperature (and salinity) is stable (at about 4C) below the thermocline. There is not enough dissolved CO2 above the main (80% of delta T) thermocline for Henrys Law, and about delta +1C at the surface, to explain the Keeling CO2 Curve. The oceans average about 4000 meters depth. That entire column is CO2 saturated. Only about 750/4000, or the top 20%, is subject to any Henrys law argument.

      Much CO2 is exchanged between the different reservoirs, but that doesnt influence the total amount of CO2 in the atmosphere.

      • Chic Bowdrie says:

        Richard,

        In line with the premise or question raised by the top post, how much, if any, additional CO2 other than from fossil fuel emissions could be contributing to the increase in atmospheric CO2?

        • Humans burning fossil fuels put much more CO2 into the troposphere than the measured increase of CO2. Therefore nature must be absorbing a large portion of the added man made CO2. Why would it matter to guess all the details of natural sources adding and deleting CO2 if the net number is strongly negative?

          • Chic Bowdrie says:

            You have a point. But.

            The claim that humans are responsible for all of the increase in CO2 is useful to the AGW propagandists for scaring the shyt out of people. Combine that with CO2 causes all the global warming and, wait for it…

            …you are paying twice as much for gas.

          • Nate says:

            Yes, all facts are not equally true. If one turns out to be supportive of AGW, we need to do our best to make i

          • Nate says:

            ..do our best to discredit it.

          • Humans adding 50% more CO2 to the troposphere should impede Earth’s ability to cool itself. Amount unknown. That does not mean all, or even most, of the last +1 degree C. warming was caused by CO2. … But even if all that warming WAS cause by CO2, it has been good news for the past 47 years, and it makes no sense to want to stop the trend.

            CO2 is greening the planet which can then feed more people.

            Global Warming since 1975 most affecting higher colder latitudes of the Northern Hemisphere, mainly during the xix coldest months of the years, and mainly at night. Why would anyone consider that to be bad news? We love our milder winters with less snow here in Michigan.

            “Climate change” is UNRELATED to past ACTUAL changes of the climate.

            To smarmy leftists, “Climate change” means PREDICTIONS of rapid, dangerous global warming, at a rate 2x to 3x faster than ACTUAL global warming in the cherry-picked 1975 to 2020 period.

            I say “cherry picked” because CO2 emissions did not begin in 1975. By 1975 there were already about 25 years of significant CO2 emissions with no global warming at all,

            In fact. there had been significant global cooling from 1940 to 1975, reported by NCAR, before the government bureaucrat science fraud “adjusted” it away.

          • Nate says:

            RG still not admitting he mistook F for C.

    • GuyW says:

      The sources of CO2 are easily identified. The OCO-2 satellite data shows the CO2 in the atmosphere. NASA don’t publish a global, 12 month view of this, but it has been calculated from the data and published (search for OCO-2 global map from Eric Swenson). The major sources of CO2 are the rain forests, the North Atlantic and the tundra of Canada and Russia. This last one is usually missed and isn’t part of the IPCC carbon cycle. Humans are less than 4% due to the equilibrium the atmosphere must be in based on a 4 year residence time.

  2. dk_ says:

    Thanks Dr. Spencer. You (with very few others) always provide clear explanations.

    Mauna Loa has come up a lot for me recently. I found this article (with a lot of others) about a mont ago https://www.climateclock.no/2022/01/17/the-mauna-loa-co2-signature/

    Is Harald Yndestad totally off the wall proposing a long-cycle tidal effect on atmospheric CO2?

    • The period of record it too short to talk seriously about lunar periodicities in the data. There will be all kinds of spurious correlations you could find with other data on such short time scales. The only possible connection I could think of is the lunar tidal forcing of deep-ocean mixing over bottom topography, and even that I don’t see how there would be a cause and effect relationship to atmospheric CO2.

      • Mark Fife says:

        Dr. Spencer, as a degreed mathematician who has completed detailed analyses of the Mauna Loa record, I can assure you CO2 growth rates follow temperature and ENSO variations and do not follow human emissions at all. I would love the opportunity to show you the correct way to analyze the data.

        The Mauna Loa record just recorded the 1st drop in CO2 levels for the month of March ever since records began in 1958. One factor which has contributed to this is ENSO temperatures are well below the 1950-2022 average, while NINO 1+2 is has entered a positive rate of change. The latter indicates a slowdown in the upwelling of CO2 rich cold water from deep ocean currents.

        I have uploaded a quick look at some of the data here: https://drive.google.com/file/d/1so2f899SVmQavkHuiz8YNYT69TRfYOZy/view?usp=sharing

        • Bart says:

          You are on the right track. The key point here is that it is a transport process. Static calculations of oceanic outgassing do not apply.

          The correlation of CO2 rate of change with temperature anomaly is astounding.

          https://woodfortrees.org/plot/esrl-co2/mean:12/from:1979/derivative/plot/uah6/scale:0.18/offset:0.171

          • Mark Fife says:

            The current CO2 level represents the cumulative sum of all increases and decreases from the past. This tells you the best model to use for analysis is an autoregressive model. Dr. Spencer is correct to look at the growth rate of CO2, that is simply the first difference of CO2 levels. However, that does not make the time series stationary. It is really necessary to difference the data a second time. This of course is the change in the rate of change. Acceleration, in other words.

            However, to get a fully realized analysis you really need to get down to monthly averages as the interannual variation has a decided seasonality.

            Another point here is if you difference the major temperature series such as that from NASA GISS over the time frame of the Mauna Loa record you will find the first difference is sufficient to render them stationary. But it takes a 2nd differencing to make CO2 levels stationary.

            This tells you the major temperature series and CO2 levels are not cointegrated. Which means they do not follow each other. As such, anyone purporting to show temperature follows CO2 is showing a spurious relationship.

            Climate science appears to be decades out of date when it comes to data science.

          • Nate says:

            The purported relationship is between these two:

            https://tinyurl.com/yzmj6tax

            T and Logarithm of Co2, and other GHG.

          • Mark Fife says:

            By the way, the UAH time series is also best modeled using an autoregressive model. Using a simple linear regression against time as a model does not do an adequate job as a quick examination of the residuals shows there isn’t a linear relationship there. The residuals are autocorrelated and they are not normally distributed.

            The plot at the link below shows changes in temperature are negatively correlated to anomalies from the prior month. This means the time series is mean reverting. In other words, it has a tendency to decrease when above average and increase when below average. It can be adequately described as a stationary AR(1) process. The negative coefficient indicates this and it is statistically significant.

            It gives the appearance of a trend, but the average increase is statistically equal to zero. It should be viewed as a series of events which result in temporary deviations from the long term average. Large volcanic eruptions which eject aerosols into the stratosphere cause stratospheric warming and cooling in the lower troposphere. El Nino events result in warming while La Nina events result in cooling.

            However, the expected value for Delta T, that is how much the temperature anomaly will increase or decrease next month remains zero.

            https://drive.google.com/file/d/1OVB0RN5KJOslekHCUsrhytRBM_QSINLG/view?usp=sharing

          • Chic Bowdrie says:

            Nate has to take the log of underivatized CO2 data and use three scale factors to obfuscate an almost perfect fingerprint correlation showing the experimentally observed temperature influence on CO2.

            He has no experimental data to support the hypothetical AGW meme his bogus graph suggests. Another failed attempt to challenge anyone who dares oppose his religion.

          • Chic Bowdrie says:

            Bart,

            Please explain, “Static calculations of oceanic outgassing do not apply.”

          • Bart says:

            Chic – It means the oceans are not a static, shallow pond which rapidly equilibrates with the atmosphere according to Henry’s Law. CO2 laden waters take centuries to downwell to the depths and reemerge to release their ancient cargo.

            The flows upward and downward never stop. Any temperature induced imbalance therefore produces a sustained increase or decrease which shows up as an integrated quantity. This is why it is the rate of change of CO2 that tracks temperature anomaly.

          • Nate says:

            “Any temperature induced imbalance therefore produces a sustained increase or decrease which shows up as an integrated quantity.”

            Except it is yet another speculation that has no data to support it. No identified mechanism. No quantitative prediction that it makes. It is not a real theory, just a hand-wave.

            And the only data available for a previous period of temperature change is from the MWP to the LIA, supposedly a 0.5 C drop, shows a sustained 7 ppm drop in CO2.

            https://cdiac.ess-dive.lbl.gov/trends/co2/graphics/lawdome.gif

            Not consistent with the changes over the last century.

          • Chic Bowdrie says:

            “Not consistent with the changes over the last century.”

            That’s because in your mind only FF emissions contribute to the 100+ ppm increase in CO2 since the LIA. But if temperature only ever contributes 10 ppm/C to the change in a steady increase in CO2 from other sources not in play before the LIA, the data is reasonably consistent. 7 ppm/0.5 C = 14 ppm/C.

          • Nate says:

            “But if temperature only ever contributes 10 ppm/C to the change in a steady increase in CO2 from other sources not in play before the LIA, the data is reasonably consistent. 7 ppm/0.5 C = 14 ppm/C.”

            Yep. I agree. Bart cannot explain the CO2 rise of last century with T change.

          • dirends says:

            Thank you blogger for sharing, I love your blog and learned a lot from it.https://www.driends.com/

        • … ” as a degreed mathematician who has completed detailed analyses of the Mauna Loa record, I can assure you CO2 growth rates follow temperature and ENSO variations and do not follow human emissions at all”

          You have identified yourself as a degreed mathematician who is clueless about the basics of climate science.

          Humans are emitting over 30 gigatons of CO2 into the air every year ( data from fossil fuel usage data )

          CO2 levels in the air are increasing by only around 20 gigatons per year. ( data from Mauna Loa CO2 measurements )

          Where are those missing 10+ gigatons of CO2 going?

          There is only one possible explanation: nature is absorbing that CO2 out of the air. Nature is taking more CO2 OUT of the air than it is putting INTO the air.

        • Dixon says:

          I looked at your analysis and saw that CO2 dropped significantly after Pinatubo. Why?
          I’m curious because we’ve been having remarkably orange sunsets here in the Southern hemisphere, with a red afterglow up to one hour after official sunset. I can only think this is due to sulphate aerosol in the stratosphere from the Tongan eruption early this year.
          Is there an interaction between sulphate and CO2 in the stratosphere? Or some other mechanism?
          Is that same mechanism now at play and responsible for the March drop in CO2?

  3. Mark B says:

    I would interpret this result differently.

    The mass balance argument, that the annual anthropogenic emissions are larger than the net atmospheric change indicates that the rise is anthropogenic. That is, the orange line in figure 2 is above the blue line (excepting 1973) which is to say that the natural sinks and emissions are a net sink.

    What Dr Spencer has shown here is that the net natural flux is more variable than anthropogenic emissions and that the natural flux is well correlated with ocean surface temperatures and similar metrics.

    What hasn’t been shown, again with the exception of 1973, is that nature is anything but a net absorber of CO2 over the past 50 years.

    I don’t think that result is surprising to anyone who pays attention to such things, nor does it contradict any mainstream thesis.

    • Tim S says:

      I agree. The only real question is what is happening to the excess, and whether there is some human induced method such as tree planing that could affect that relationship? Approximately half of the anthropogenic CO2 is accounted for in the atmosphere by calculation so that is rather convincing.

    • Tim S says:

      That should read tree “planting”. Some say there is evidence that a significant amount of greening of the earth is taking place already.

  4. Nate says:

    Nice work.

    “Curiously, reversing the direction of causation between surface temperature and CO2 (yearly changes in SST [dSST/dt] being caused by increasing CO2) yields a very low correlation.”

    Would a small, short term, variation in CO2, even be theoretically predicted to cause a noticeable change in SST?

    Seems unlikely given the slow response of the ocean (high heat capacity), and the small fractional change in GHE forcing.

    • stephen p anderson says:

      >Would a small, short term, variation in CO2, even be theoretically predicted to cause a noticeable change in SST?

      No, especially if CO2 follows temperature.

      • Willard says:

        Commenting should follow reading the post, tho.

      • Entropic man says:

        What evidence do you have that 21st century CO2 is following temperature?

        Surely if you were correct the Mauna Low curve should have flattened during the sceptics’ proposed 1998-2011 and 2016-2022 pauses

        • stephen p anderson says:

          If you look at the history on long times scales it is a many decades lag.

          • stephen p anderson says:

            Also, Salby presents it in his lectures. Seasonally, it is 90 degrees out of phase. The integral of sine is cosine shifted almost 90 degrees out of phase.

          • Entropic man says:

            Which brings us back to the same old problems.

            1) You claim that CO2 follows many decades behind temperature, indeed I’ve seen sceptics claiming an 800 year lag. Why are we not seeing CO2 reducing due to the lagged effect of the LIA?

            2) If CO2 is not causing the rise in temperature, what is causing it? The sceptics arm wave about natural variation, cycles or the recovery from the LIA. Nobody has described a proper cause and effect relationship between the current warming and any natural variable. Nothing which can be described mathematically and modelled. You’ve been at this since the 1970s. The sceptics should have something paradigm changing by now.

          • stephen p anderson says:

            So you’re debating there hasn’t been a lag effect with temperature and CO2?

          • Clint R says:

            Ent, remember that you are anti-science. As such, you oppose reality, truth and honesty. You favor nonsense.

            You’re a braindead cult idiot operating as an anonymous troll.

          • Entropic man says:

            “So youre debating there hasnt been a lag effect with temperature and CO2? ”

            I’m saying that times have changed.

            We have moved from a natural glacial cycle in which CO2 lags temperature to an artificial situation in which temperature lags CO2.

          • Clint R says:

            Ent, there you go again. Making stuff up to fit your false beliefs. That’s how you came up with your nonsense about passenger jets flying backwards!

            That ain’t science.

          • stephen p anderson says:

            The laws of physics have to change to make AGW work.

          • Entropic man says:

            “The laws of physics have to change to make AGW work. ”

            The current CO2 AGW paradigm works well for most of those in the trade. . Anything specific you unhappy with?

            We already discussed the runaway positive feedback problem. Feedbacks follow logistic curves, not exponential ones.

          • Willard says:

            The laws of Climateball would have to change to make troglodytes work.

          • Nate says:

            “If you look at the history on long times scales it is a many decades lag.”

            The lag is very tiny for response to ENSO. Why should be many decades long for anything else?

          • Entropic man says:

            Nate

            I once calculated expected temperatures against time since 1880 using the CO2 forcing equation and plotted them onto a printout of the GISS global temperature anomaly graph.

            The observed graph lagged the expected one by 20 years. I interpreted this delay in warming to the time needed for the deep ocean heat sink to reach equilibrium.

            ENSO is a mixed layer phenomenon, not involving the deep ocean.Perhaps this is why it takes much less time for the effect to show.

          • Clint R says:

            The current CO2 AGW paradigm works well for most of those in the cult.

            I fixed it for you, Ent.

        • Entropic man says:

          Stephen

          CO2 AGW does not violate Henry’s Law, the Clausius-Clapyron relationship, the lapse rate, radiative physics, quantum physics, 1LOT, 2LOT or any other laws of physics.

          Those who would have you believe in such violations are misleading you.

          • Clint R says:

            Wrong again, Ent. You can NOT boil water with ice cubes, nor can you heat Earth with CO2. And passenger jets don’t fly backwards.

            You have no respect for science, reality, truth, or honesty.

            You’re a braindead cult idiot, operating as an anonymous troll.

          • Willard says:

            Not the ice cubes again, Pup:

            My previous post explaining a simple experiment to demonstrate that a cool object can make a warm object warmer still led me to give the experiment a try.

            The purpose is to demonstrate that, energetically, the atmosphere’s greenhouse effect can make the surface of the Earth warmer than if the greenhouse effect didn’t exist even though the atmosphere is colder than the Earth’s surface. There is no violation of the 2nd Law of Thermodynamics, which states that the net flow of heat must be from higher to lower temperature, which does not preclude cooler object from emitting IR radiation in the direction of warmer objects.

            https://www.drroyspencer.com/2016/08/experiment-results-show-a-cool-object-can-make-a-warm-object-warmer-still/

            In this house, we obey the Laws of thermodynamics, and please stop trolling.

          • Clint R says:

            Worthless Willard, did you find a link you can’t understand?

            I’ll explain it to you, if you’ll agree to not comment here on this blog for 90 days.

          • Ken says:

            Maxwell’s demon strikes again.

            Clint is going to have to reinvent the Carnot cycle to explain how heat pumps work.

          • stephen p anderson says:

            Eman, no one’s misleading me. I studied quantum mechanics, thermodynamics, physics, calculus, chemistry, etc. I made A’s in all those subjects. I can think for myself.

          • Entropic man says:

            Stephen

            “Eman, no ones misleading me. I studied quantum mechanics, thermodynamics, physics, calculus, chemistry, etc. I made As in all those subjects. I can think for myself. ”

            We can all think for ourselves. The amazing thing is how scientists can start from the same data and come to such wildly divergent end points.

            I come into the climate arena from biology.

            Once biology was flower collecting and anatomy.

            Nowadays it is the application of quantum mechanics, thermodynamics, physics, calculus, chemistry, etc to living organisms and their environments.It makes us very good at integrating processes from different fields into complex interacting systems such as climate.

            As a result I watch increasing CO2, decreasing OLR, increasing back radiation, spread in the 15 micrometres band, cooling stratosphere, increasing water vapour, increasing ocean heat content,decreasing ice extent, changing rainfall patterns, shifting Hadley cell boundaries, changes in Rossby waves, decreasing oxygen content, decreasing atmospheric 13C, decreasing ocean PH and all the other variables we study.

            I can understand how they interact to produce equilibrium states and how changes such as increasing CO2 can push the climate system towards a new equilibrium.

            That’s what I miss in your posts. You are unhappy about various aspects of AGW, but, like many sceptics, you don’t seem to have an integrated world view of your own.

          • Clint R says:

            Ent, the valid observations you mentioned are the result of a warming climate due to natural variability. You don’t believe that, but beliefs ain’t science, and you ain’t no scientist.

            You do NOT “understand how they interact to produce equilibrium states and how changes such as increasing CO2 can push the climate system towards a new equilibrium.” Again. that’s your beliefs.

            You can’t separate your cult beliefs from reality. That’s why you claim passenger jets fly backwards. You’re willing to pervert reality to fit your cult beliefs.

            You’re a braindead cult idiot operating as an anonymous troll.

          • stephen p anderson says:

            You’re a funny man, Eman. You claim people like Murry Salby, Ed Berry, Hermann Harde,et. al. are misleading me. Murry Salby, the author of “Physics of the Atmosphere and Climate” is misleading me. Why would he do that? Salby was a great guy and all his research was sound on fluorocarbons but as soon as his research into AGW didn’t support the mantra he suddenly became a kook. Ed Berry, author of several dozen papers on atmospheric physics was a great guy but as soon as his research didn’t support the mantra, he’s a kook. Get the theme here? Who’s being led astray?

          • Entropic man says:

            ” Get the theme here? ”

            Yes. They all moved from their normal research into dubious debunking of climate science, prompted by support channelled through front organisations such as the Heartland Institute.

            When they moved from doing science for its own sake to doing science to support an agenda they lost their credibility.

          • Entropic Man, please stop trolling.

  5. Ireneusz Palmowski says:

    What’s going on with the temperature in North America?
    https://i.ibb.co/X2vn88Y/gfs-T2m-us-37.png
    And in Europe?
    Forecast for April 18, 2022.

  6. Ireneusz Palmowski says:

    And how does Arctic ice respond to CO2?
    https://i.ibb.co/yfZvd9t/N-daily-extent-hires.png

  7. Entropic man says:

    Dr Spencer

    Do you consider the 15% natural contribution to increasing CO2 to be independent of human activity, such as volcanic activity?

    Do you think it could be positive feedbacks such as the contribution from thawing and decaying permafrost?

    Do you have any other sources in mind?

  8. Nick Stokes says:

    “This suggests at least some role for increasing surface temperatures causing increasing CO2, especially since if I turn the causation around (correlate dSST/dt with CO2), I get a very low correlation, 0.05.”

    That is surprising – I’d be interested to know how the numbers are calculated. The formula for correlation coefficient, as given by Wiki, is

    https://s3-us-west-1.amazonaws.com/www.moyhu.org/2022/03/correl.png

    There is no directionality; it doesn’t matter whether you call one or the other variable x.

    • Nick Stokes says:

      I see that the second correlation is between different variables, with SST being differentiated rather than CO2. Since SST is a lot noisier than CO2, you’d expect lower correlation regardless. But there is no real rationale for CO2 ppm being correlated with dSST/dt.

    • Bindidon says:

      Thanks for the explanation.

  9. Clyde Spencer says:

    Roy, you said,”I wont go into the evidence for an anthropogenic origin here (e.g. the decrease in atmospheric oxygen, and changes in atmospheric carbon isotopes over time).”

    I think that the increasing production of CO2 and CH4 in the Arctic would go a long ways in explaining a decrease in oxygen as the microbes in the ground increasingly oxidize the long-buried organic material, and methane oxidizes in the atmosphere.

    Also, I’d put a lot more stock in the carbon isotope argument if a more rigorous analysis were to be done incorporating the isotopic fractionation as CO2 passes into and out of the oceans. What happened to all the CO2 that was entrained in the glaciers when they melted off 11,000 years ago?

  10. CAD says:

    Soils are living ecosystems, packed full of biodigesters such as microbes, fungi, and lichens. Soils have evolved along with wildlife at the surface, and so any disruption to plant and animal species has a direct impact on soil organics. Dry grasses and leaf matter at the surface will never biodegrade without the help of the ecosystem mammals, birds, amphibians, insects, microbes, fungi, lichens, and bacteria. Instead, dry matter organics collect and oxidize on the surface by slow chemical breakdown. This, as opposed to the rapid biological breakdown of biodigesters. The carbon cycle disrupted. No amount of vegetation will sink carbon if does not property biodegrade. The faster the nutrient cycling, the deeper and richer the soils become. Stable soil organics from rapid biological excretion once reached depths of several feet in northern mid-latitudes. This process has slowed to a crawl.

  11. Ireneusz Palmowski says:

    What does the CO2 level near the surface tell us? It is mainly marine algae at the surface of the oceans that absorb CO2 and produce oxygen. Above the surface of the cold oceans (currently in the north) CO2 levels are high.
    https://earth.nullschool.net/#2022/04/09/1500Z/chem/surface/level/overlay=co2sc/patterson

  12. CO2isLife says:

    Problems I see with every climate model:
    1) To model something, you need a data set to model. There isn’t a viable global temperature dataset that is useful for modeling. Just look at all the different variations in temperature based upon location.
    https://climatedatablog.wordpress.com/

    2) CO2 is a constant at any moment in time, evenly blanketing the earth. Because CO2 is a constant, it can’t cause regional differentials. An exogenous factor must be the cause. Has anyone bother to models these factors?

    3) CO2 increases at a relatively constant rate, yet temperature is highly volatile, and inconsistent based upon region. Clearly exogenous factors are responsible for the sizable residual. Has someone bothered to model these exogenous factors?

    4) The quantum mechanics of the CO2 molecule are constant and don’t vari based upon location or source of origin. Natural and Anthropogenic CO2 have the exact same physical properties.

    5) There is a data set for Antarctica. It shows no warming with an increase in CO2 by 25 to 30%. Can anyone explain why a 25 to 30% increase in CO2 didn’t cause warming at that location? Antarctica is a natural control for all the exogenous variables that are causing the residual for other locations. That is basis modeling 101, yet I haven’t seen anyone approaching this problem from that angle. Simple use natural controls to isolate the impact of one factor on another. That is exactly how ever other scientific experiment is run. Why does Climate Science ignore the scientific method and widely accepted scientific practices?

    • Bindidon says:

      ” There is a data set for Antarctica. It shows no warming with an increase in CO2 by 25 to 30%. Can anyone explain why a 25 to 30% increase in CO2 didnt cause warming at that location? ”

      You have been explained that years ago, and still ignore it.

      That is DENIAL 101.

      Like Northeast Siberia during the winter, Antarctica is all the year long so cold that CO2 shows there its inverse behavior. It cools Antarctica.

      You still deny that, since years. You are such an anti-scientific person.

      • CO2isLife says:

        “Like Northeast Siberia during the winter, Antarctica is all the year long so cold that CO2 shows there its inverse behavior. It cools Antarctica.”

        I asked for a credible explanation, not nonsense. The quantum mechanics of the CO2 molecule do not differ based upon location. If that is actually your honest answer, it is a complete joke.

        • bobdroege says:

          But CO2 emits based on temperature, so not a complete joke, that would be your understanding of the science.

        • Brandon R. Gates says:

          > The quantum mechanics of the CO2 molecule do not differ based upon location.

          No, but lapse rates do:

          In general, for a negative GHE to occur temperature must increase with height, driving the maximum saturation value above the surface emission; a condition satisfied over the Antarctic Plateau by warmer stratospheric temperatures relative to the surface and by the surface-based temperature inversion. However, this is a necessary but insufficient condition, as the optical depth determines how efficiently the upward flux moves toward saturation, and a negative temperature gradient above the inversion can cause the upward flux magnitude to decrease below the surface emission. Overall, the entire vertical temperature and optical depth profiles below the TOA determine the magnitude and sign of the GHE. Over the Antarctic Plateau the strong surface-based temperature inversion, persistent for most of the year,21 and the scarcity of free tropospheric water vapor above the inversion, are the primary factors that cause the negative GHE.

          https://www.nature.com/articles/s41612-018-0031-y

        • Bindidon says:

          ” I asked for a credible explanation, not nonsense. The quantum mechanics of the CO2 molecule do not differ based upon location. ”

          I forgot to look at your laughable reaction.

          I repeat: it is NOT simply a matter of quantum mechanics.

          The effect of CO2 depends on the surface temperature below it.

          You are either incompetent, or stubborn, or dishonest, or all three in one.

    • Bindidon says:

      And, btw:

      ” There is a data set for Antarctica. It shows no warming… ”

      That is more than denial, CO2. It is a lie.

      Because even UAH shows for Antarctica a positive trend of 0.1 C / decade for the land part.

      • CO2isLife says:

        “Because even UAH shows for Antarctica a positive trend of 0.1 C / decade for the land part.”

        That is pure nonsense. There is absolutely no material credible uptrend in this data set. None.
        https://climatedatablog.files.wordpress.com/2022/03/uah-south-pole.jpeg

        • barry says:

          Sure there is. It’s the red line, which is Antarctica. Quite clearly temperatures are generally cooler in the first half of the record than the latter half.

          Here’s a simple linear regression of the Antarctic temperature, same data used in the chart above.

          https://i.imgur.com/VQUwFHv.png

          The p-statistic is 0.02, the trend is greater than the uncertainty. Looks like a statistically significant result.

      • stephen p anderson says:

        That doesn’t make sense Blinny. Anarctica would be one of the only places where the surface is sometimes cooler than tropospheric CO2.

        • stephen p anderson says:

          Of course, it ain’t going to warm it very much.

        • Bindidon says:

          If you were competent enough to compare ABSOLUTE tropospheric and surface temperatures, you wouldn’t write such a statement.

          In Verkhoyansk, Oymyakon and a few other places in Northeastern Siberia, surface temperatures are, during the winter, a lot colder than the lower troposphere 4 km above.

          And so it is in the Antarctic. Look at Vostok’s surface temperature.

  13. Ireneusz Palmowski says:

    Exceptional drop in CO2 in March 2022.
    https://woodfortrees.org/graph/esrl-co2/derivative/from:2018

  14. Ireneusz Palmowski says:

    Isn’t the influence of El Nio and la Nia evident?
    https://woodfortrees.org/plot/esrl-co2/derivative/from:2015

  15. CO2isLife says:

    Climate Science is nothing more than Eugenics 2.0:

    Gates outlined plans to use vaccines to reduce the rate of global population growth and lower carbon emissions.
    https://youtu.be/oWxsEAmh85Q

  16. Ireneusz Palmowski says:

    Strong temperature drop across the western US.
    https://i.ibb.co/m61PVcF/gfs-T2m-us-13.png

    • Bindidon says:

      You? A climatologist? For sure!

      But… in the same sense as ‘astrologist’ wrt ‘Astronomer’.

    • Bindidon says:

      ” In a May, 2006 interview with the Ottawa Citizens editorial staff, Tim Ball said:

      ” CFCs were never a problem. […] its only because the sun is changing. ”

      Cela nous dit tout, n’est-ce pas?

  17. Willard says:

    Time flies:

    Ball and the organizations he is affiliated with have repeatedly made the claim that he is the “first Canadian PhD in climatology.” Ball himself claimed he was one of the first climatology PhD’s in the world.”

    Many have pointed out that there have been numerous PhD’s in the field prior to Ball.

    Ball was a former professor of geography at the University of Winnipeg from 1988 to 1996. The University of Winnipeg never had an office of Climatology. His degree was in historical geography and not climatology.

    […]

    In 2011, [MikeM] had filed a defamation claim in a British Columbia court against the Frontier Center for Public Policy (FCPP) and Tim Ball, after Ball had suggested in an interview that [MikeM] should be imprisoned.

    In June 2019, FCPP issued an apology to [MikeM] for what it described as “certain untrue and disparaging accusations which impugned the character of [MikeM].”

    https://www.desmog.com/tim-ball/

    • Swenson says:

      Willard,

      The MikeM you refer to would be the fraud, faker, scofflaw and deadbeat Michel Mann, would it?

      Are you too embarrassed to use Michael Mann’s full name?

      Have you located the mythical Insulation Effect Theory yet? What about the Greenhouse Theory?

      Moron.

    • Carbon500 says:

      Willard: you say ‘Ball was a former professor of geography at the University of Winnipeg from 1988 to 1996. The University of Winnipeg never had an office of Climatology. His degree was in historical geography and not climatology.’
      My immediate thought was – ‘Which degree? A first degree or a higher degree – perhaps masters or doctorate?’
      A first degree doesn’t necessarily evidence a later change in direction. My first degree for example was in Human Biology,a broad course of study which awakened an interest in physiological biochemistry and molecular biology, the latter becoming the area of research for my PhD, taking in aspects of virology and bacteriology.
      I took a look at Tim Ball’s website – it states:
      ‘With a doctorate in climatology from the University of London, Queen Mary College, England, Dr. Balls comprehensive background in the field includes a strong focus on the reconstruction of past climates and the impact of climate change on human history and the human condition.’

      • Willard says:

        > you say

        I did not, Carbon. It’s called a quote.

        If you want to know more about the lawsuit that Timbits dropped on the matter:

        Dan Johnson, a professor of environmental science at the University of Lethbridge, countered his claim on April 23, 2006, in a letter to the Herald stating that when Ball received his PhD in 1983, “Canada already had PhDs in climatology,” and that Ball had only been a professor for eight years, rather than 28 as he had claimed. Johnson, however, counted only Ball’s years as a full professor. In the letter, Johnson also wrote that Ball “did not show any evidence of research regarding climate and atmosphere,” which Ball later admitted.

        In response, Ball filed a lawsuit against Johnson. Johnson’s statement of defence was provided by the Calgary Herald. In the ensuing court case, Ball acknowledged that he had only been a tenured professor for eight years, and that his doctorate was not in climatology but rather in the broader discipline of geography, and subsequently withdrew the lawsuit on June 8, 2007.

        https://en.wikipedia.org/wiki/Tim_Ball

        Our most Canadian Sky Dragon Crank has a better track record behind contrarian megaphones than in the court. Or the Climateball field, for that matter.

        • Carbon500 says:

          Willard: Given your comments, I suppose that it would be of interest to have sight of Tim Ball’s claimed doctorate in climatology from the University of London. However, I have to confess that I have no interest in the lawsuits that fly around – life’s to short to follow the minutia of who claimed what; I have more enjoyable ways to spend my time!

  18. Bindidon says:

    ren

    You asked

    ” Whats going on with the temperature in North America?
    https://i.ibb.co/X2vn88Y/gfs-T2m-us-37.png

    And in Europe?

    Forecast for April 18, 2022 ”

    Something like this?

    https://www.wetterzentrale.de/maps/GFSP30EU18_210_2.png

    What do you think?

  19. CO2isLife says:

    The 800lb Gorillas in the Climate Science Living Room:

    Assumptions: CO2 evenly blankets the globe with an equal concentration in a cross-sectional data set, and increases evenly across the globe in any time series. In other words, the impact of CO2 on warming is a constant in a cross-sectional data set, and shows a log decay in a time series.

    If we can all agree on those undeniable facts, then here are the problems I see for modeling the climate using the existing data sets. The source of the data is found here:
    https://climatedatablog.wordpress.com/

    1) Unless someone can explain why a 25 to 30% increase in CO2 didn’t cause any warming in Antarctica, then you will never be able to create a credible model that uses CO2 as the causative factor. Antarctica proves it isn’t.

    2) Every region of the earth has identical CO2 yet totally different temperature trends.

    3) CO2 can’t cause the PDO and other oscillations, and those oscillations existed long before the industrial age.

    4) Note how the upper layers of the atmosphere don’t show warming. Why? CO2 is constant but H2O isn’t.

    5) Why is the Equitorial region more stable? Same CO2 more constant H2O.

    6) How can you combine all those different trending data sets and claim you can create one that represents the globe, and then try to tie its change to CO2, which is basically a constant. HOw are they weighted in the data set? Are they equally weighted? If yes, why? If they have weights assigned to the ability to isolate the impact of CO2 on temperature then all you need is Antactica.

    7) The residuals show serial correlation. That can’t be due to CO2.

    8) There is no annual rate of increase for temperature, yet there is for CO2. This is clear evidence that small changes in the orbit around the sun causes variation, not CO2.

    9) Lower strat, what happened in 1995? Did the industrial age end? Did CO2 stop increasing? Clearly something other than CO2 is causing huge changes to the temperature.

    • stephen p anderson says:

      Describing the two step-changes in temperature as huge is a little dramatic, isn’t it?

      • CO2isLife says:

        I was referring to the Lower Strat and the dramatic change in trend and behavior. Care to explain what changed in CO2 in 1995 to cause such a change in temperature?

  20. gbaikie says:

    Sunspot number: 13
    Thermosphere Climate Index
    today: 12.26×10^10 W Neutral
    Oulu Neutron Counts
    Percentages of the Space Age average:
    today: +7.3% High
    48-hr change: +0.7%
    https://www.spaceweather.com/

    It seems it might go spotless

    25 seems like 24

    • gbaikie says:

      Sunspot number: 24
      Thermosphere Climate Index
      today: 12.25×10^10 W Neutral
      Oulu Neutron Counts
      Percentages of the Space Age average:
      today: +7.4% High
      48-hr change: -0.0%
      https://www.spaceweather.com/

      {It didn’t go spotless, yet}

      • gbaikie says:

        Sunspot number: 37
        Thermosphere Climate Index
        today: 12.13×10¹⁰ W Neutral
        Oulu Neutron Counts
        Percentages of the Space Age average:
        today: +7.3% High

        If like 24, will rebound a lot in week or so.

        • gbaikie says:

          Sunspot number: 79
          Thermosphere Climate Index
          today: 12.74×10^10 W Neutral
          Oulu Neutron Counts
          Percentages of the Space Age average:
          today: +7.2% High

          So, I was wondering when neutron counts would lower in this
          solar max.
          But finally, I decided to look for long terms record of it:
          Cosmic Rays are Nearing a Space Age Maximum
          October 3, 2019 / Dr.Tony Phillips
          https://spaceweatherarchive.com/2019/10/03/cosmic-rays-are-nearing-a-space-age-maximum/

          So eyeballing it, about 1/2 time is below 3%
          “Researchers at the Sodankyla Geophysical Observatory have been monitoring cosmic rays since 1964.”
          So, search 1964:
          https://www.linkedin.com/pulse/space-age-record-cosmic-rays-broken-beginning-2020-jamal-shrair
          From 1964 the average is significant different, quite bit is below -5% and about 1/2 below 0 and guess about 20% 3% or higher.
          So, guess looking for 0 [or less] and they won’t be much of it in Solar Max 25. 7% or more is simply bad, and 3 to 5% not as bad.
          And what you call “safe” or good is in 6 months not peaking for much time above 0.
          If apply my make up rule:
          1966 thru 1972 was all safe. 1979 thru 1986, safe.
          1989 thru 1993, safe. 2000 thru 2006, safe
          Then, not safe, but in terms not as bad, 2011 to 2016.
          Bad since, and all can look for, is not as bad.

          • gbaikie says:

            A paper on it, older: First published: 06 September 2013
            https://agupubs.onlinelibrary.wiley.com/doi/10.1002/jgra.50544

            Highlights:
            “With our correction, all stations considered display new highs at the recent solar minimum, approximately 3% above the previous record high. These increases are shown to be consistent with spacecraft observations.”

            “From records of 15 neutron monitors, we conclude that neutron count rates on Earth’s surface reached a new Space Age record in 2009. To reach a consistent picture of the neutron monitor records, we found it necessary to detrend individual neutron monitor rates for long-term changes in instrument response amounting to typically 2% over the period 1964 to 2009. Although 2% may seem small in absolute terms, it is significant in terms of neutron monitor count rates, some of which vary by almost 30% over the course of the solar modulation cycle. Currently, we do not understand the source of the long-term changes in instrument response.”

            I was wondering whether is was instruments- I know doing a lot more of it in last decades or so. But probably as good as global air temperature:)

          • gbaikie says:

            Through most of the instrument record, the inverted Oulu neutron count used to track the F10.7 flux* closely. There was a regime change in 2006 and now the Oulu neutron count is consistently higher relative to 10.7 flux. The recent data suggests that the gap is widening, which means more neutrons are reaching the lower atmosphere where they can initiate cloud droplet formation, which in turn will reflect more sunlight and cool the planet. More neutrons would be in response to a weaker interplanetary magnetic field, so what is that showing?”
            https://saltbushclub.com/2022/02/03/solar-update/

            hmm.

          • gbaikie says:

            March 22 2022
            “1. Introduction
            The flux of galactic cosmic rays (GCRs) outside the heliosphere is generally assumed to be constant at the time scales shorter than a hundred thousand years. At the same time, the flux measured near/at Earth varies at different time scales, reflecting the process of the heliospheric modulation of GCRs. ”
            cc.oulu.fi/~usoskin/personal/Kold_vert_2022.pdf
            From: http://cc.oulu.fi/~usoskin/
            From: https://cosmicrays.oulu.fi/group.html

            Hmm. You can assume it’s constant, but it isn’t, but no one can figure it out, so, one can assume long time frame being constant.
            Or it’s practical to do so. Anyways:
            “Soon after establishing the NM network, it was found that the GCR intensity lags behind the solar variability (Forbush, 1958; Dorman and Dorman, 1967; Mavromichalaki and Petropoulos, 1984) and that the lag varies from one cycle to another (Nagashima and Morishita, 1979). A detailed study of the lag between GCR and SSN for four solar cycles (1953 1995) was first performed by Usoskin et al. (1998) and updated for five cycles (1951 2000) by Usoskin et al. (2001), using the standard cross-correlation and a sophisticated 2D cycle-projection analysis. It was shown that the time lag varies significantly, depicting a 22-year pattern (Hale et al., 1919) so that it is longer (10 20 months) for nega-
            tive (A−) and shorter (several months or even formally negative) for positive (A+) polarity cycles.”

            The delay makes sense.
            But paper goes on and on.
            I am going to assume, more work needs to done, regarding this delay.

          • gbaikie says:

            didn’t post, make short:
            cc.oulu.fi/~usoskin/personal/Kold_vert_2022.pdf

          • gbaikie says:

            Sunspot number: 101
            What is the sunspot number?
            Updated 23 Apr 2022

            Oulu Neutron Counts
            Percentages of the Space Age average:
            today: +5.8% High
            48-hr change: -1.4%

            {it seems it is getting somewhere}

  21. Ireneusz Palmowski says:

    The temperature of the Peruvian Current is falling again. La Nina will not cease.
    https://www.tropicaltidbits.com/analysis/ocean/nino12.png

  22. Guy says:

    Only 4% of the CO2 in the atmosphere can be man made. The IPCC Corbon Cycle shows that only 4% of the CO2 put into the atmosphere is for human sources. 800Gt of carbon are in the atmosphere and 200Gt are removed every year. Residence time is therefore 4 years. The equivalence principle dictates that CO2 is in proportion to the contributions, so only 4% of the CO2 in the atmosphere is from humans, or about 18ppm. The Bern Model was made up to try and make CO2 stay in the atmosphere for 300 years, but that defies the defintion of Residence Time for an atmospheric gas. See Dr Ed Berry’s proof and supporting evidence using C13/C14 decay curves.

    • Nate says:

      “Residence time is therefore 4 years.”

      This is not in agreement with observations. The measured residence time of carbon in gthe atmosphere tracked with the C14 from atmospheric nuclear bomb tests, is at least 16 y.

      In addition, the ‘residence time’ is simply the time for individual C atoms to be replaced by others. It is not equal to the time for an increased CO2 concentration to decay.

      • Chic Bowdrie says:

        Nate, you have no data or models to back up what you wrote. You only regurgitate the propaganda you read from your AGW collaborators.

        If your version of residence time is correct, what yearly total emissions would you predict actually occur? That is, FF plus everything else?

      • Nate says:

        This is a good demo of the denier two-step.

        1. Require no real data to support the contrarian view. Dont have it? Just invent it!

        https://www.drroyspencer.com/2022/04/explaining-mauna-loa-co2-increases-with-anthropogenic-and-natural-influences/#comment-1242135

        2. Constantly demand data from others, even if youve seen it many times. Then pretend it doesnt matter!

        https://cdiac.ess-dive.lbl.gov/epubs/ndp/ndp057a/ndp057a.html

        Berry himself produced the 16 y e-time fit to the Bomb curve.

        But Salby tried to fudge it.

        https://quantpalaeo.wordpress.com/2015/04/29/dissembling-with-graphs-murry-salby-edition/

        • Chic Bowdrie says:

          Nate wrote, “This is not in agreement with observations” referring to Guy’s statement that atmospheric CO2 residence time is 4 years.

          Then I asked “If your version of residence time is correct, what yearly total emissions would you predict actually occur? That is, FF plus everything else?”

          Obviously I am referring to 12CO2, but Nate obfuscates by throwing up 28 year old data telling us what 14CO2 and 13CO2 concentrations were back then and which support data published many times indicating a 16 year residence time for 14CO2.

          So, Nate, I repeat. What is the residence time of 12CO2, if not 4 years, and please quote the yearly emissions and absorp.tion rate required to support your analysis based on the observations of CO2 being in the low 400 ppm currently?

        • Nate says:

          Are you arguing that a 5% mass increase of a co2 molecule causes a 4 x reduction in uptake?

          Where is data or evidence that the residence time of C14 should be 4x larger than C12? What is the physics behind that?

          Yet another flimsy excuse.

          Why is the increase in C14 in the ocean near surface staying flat for decades? You are ignoring the Revelle factor again.

        • Nate says:

          “So, Nate, I repeat. What is the residence time of 12CO2, if not 4 years, and please quote the yearly emissions”

          This question is premised on the oversimplified 1 box carbon cycle that Berry first proposed. Now modified to include several boxes.

          Get with the program. The atmosphere, land and ocean mixed layer are comparable in size reservoirs. The exchange and mixing between these is fast, could well be 4 years.

          But the bottleneck is from these three to the deep ocean, due to the Revelle Factor.

          This has been a known property of the carbon cycle for 60 y.

          • Chic Bowdrie says:

            “Are you arguing that a 5% mass increase of a co2 molecule causes a 4 x reduction in uptake?”

            No. Stop obfuscating and get with the program.

            “Where is data or evidence that the residence time of C14 should be 4x larger than C12? What is the physics behind that?”

            I cannot say for sure yet. You can weigh in anytime on that.

            “Why is the increase in C14 in the ocean near surface staying flat for decades?”

            I wasn’t aware that increases stay flat. Restate the question or provide support for your claim.

            “This question is premised….”

            Wrong. Don’t presume to know where my question comes from. Every competent scientist should know that 280/80 and 410/85 indicates a CO2 retention time (e-time, turnover time, etc.) of 3.5 to 4.8 years, which 4 years could well be between. Glad to see you are finally coming around to appreciate reality.

            Until we see your data and model, the Revelle factor is just another way to obfuscate.

          • Nate says:

            “Wrong. Dont presume to know where my question comes from. Every competent scientist should know that 280/80 and 410/85 indicates a CO2 retention time (e-time, turnover time, etc.) of 3.5 to 4.8 years, which 4 years could well be between. Glad to see you are finally coming around to appreciate reality.”

            OK I won’t presume. Then explain what model you are using to arrive at this e-time?

            “Until we see your data and model, the Revelle factor is just another way to obfuscate.”

            Not my data or model. The data and model has been around and been tested for 60 y since Revelle figured it out, and followers confirmed it.

            This paper was the first to satisfactorily explain why the fraction of emissions retained in the atmosphere is high.

            https://geosci.uchicago.edu/~archer/warming_papers/bolin.1958.carbon_uptake.pdf

            And they were able to accurately predict the rise in atmospheric CO2 over the next 60 y.

            Is that another coincidence?

          • Chic Bowdrie says:

            “Then explain what model you are using to arrive at this e-time?”

            The model comes from delC/dt = ksCs -kaCa which I explained in my comment to Dr. Spencer. The spreadsheet version is Cn = In + (1 – kaC(n-1)) where In is the sum of all CO2 sources. At equilibrium Cn = C(n-1) and 1/ka years = Cn/In. If it looks like Dr. Berry’s model, it’s because he derived it from the same master equation calculus used by Bolin-Eriksson.

            Notice that it is the same formula as Bolin-Eriksson’s for atmosphere to mixed-layer exchange. Their estimate for ka is 5 years. Pretty darn close to mine, Drs. Berry and Salby, and many others. I decided not to challenge your undocumented assertion that “they were able to accurately predict the rise in atmospheric CO2 over the next 60 y.” I’ll leave that for you to substantiate. Nevertheless, it doesn’t refute my contention of additional CO2 sources supplementing FF emissions.

            Furthermore, including a modification based on the Revelle factor will complement my model by justifying a time dependency on the ka term.

          • Nate says:

            “Notice that it is the same formula as Bolin-Erikssons for atmosphere to mixed-layer exchange. Their estimate for ka is 5 years. Pretty darn close to mine, Drs. Berry and Salby, and many others. ”

            Yes, more or less.

            And that is what I said.

            “The atmosphere, land and ocean mixed layer are comparable in size reservoirs. The exchange and mixing between these is fast, could well be 4 years.”

            So sounds like we agree on that.

            But not this: “Nevertheless, it doesnt refute my contention of additional CO2 sources supplementing FF emissions.”

            Because:

            “But the bottleneck is from these three to the deep ocean, due to the Revelle Factor.”

            Which is what is addressed in the paper. And the main reason why they were able to correctly predict the subsequent rise.

            And remember this effect has had 60 y to be tested.

            Read and tell me what theyve done wrong.

          • Chic Bowdrie says:

            “Read and tell me what theyve done wrong.”

            Reading is not necessary, because I don’t have any reason to suspect their math is wrong. What you need to do is to apply their equations and see if the data refute my hypothesis that non-fossil fuel emissions have not remained constant since the pre-industrial age.

          • Nate says:

            “Reading is not necessary, because I dont have any reason to suspect their math is wrong.”

            Oh. Then what of this?

            “Until we see your data and model, the Revelle factor is just another way to obfuscate.”

            Are you now accepting that Revelle factor matters? That there is a bottleneck?

            Or if not, you need point out the flaws in the paper. Good luck.

          • Chic Bowdrie says:

            I already explained why I don’t need to find flaws in the paper. It only encourages me to strengthen my model by compensating for the amount of non-fossil fuel emissions due to a Revelle factor. I’m already doing that.

            OTOH, you have to run the numbers using the Bolin-Eriksson formulas and actual data to prove my hypothesis wrong.

          • Nate says:

            “OTOH, you have to run the numbers using the Bolin-Eriksson formulas and actual data to prove my hypothesis wrong.”

            Weve had this carbon cycle paradigm for 60 y. Lots of obsetvations and refinements since.

            You want to overturn the paradigm. To do so you need to show there is a problem with it. You need to show new data that doesnt fit it. Show why your model fits the data (actual data) better.

          • Chic Bowdrie says:

            “You want to overturn the paradigm.”

            The truth is you don’t want the paradigm overturned. I just want the 60-year paradigm verified. Remind me where you provided evidence (actual data) that is was.

          • Nate says:

            You dont seem to understand how science works. You made extraordinary claims that the standard carbon cycle understanding is wrong. You have to back up with SOMETHING. Some new data or evidence. And it should be extraordinary to merit anyones attention.

            You havent. So noone need waste their time proving it wrong. Anymore then they should waste time proving Flat Earthers are wrong.

          • Bill Hunter says:

            Actually Nate it is you that doesn’t understand how science works.

            You actually think that how science works is some political pooh-bah cherry picking what scientists they want to believe, reversing the burden of proof of the scientific method and redefining it as a political fiat that will remain true until disproven. They even have a name for that type of politics. . . .Post Normal Science. Normal science it certainly is not so it is aptly named.

      • Bill Hunter says:

        Nate babbles on about stuff he remembers hardly anything about or doesn’t want to remember.

        So he goes as usual into full obfuscation mode babbling like an 80 year old with Alzheimer’s disease.

        What Nate doesn’t want is an answer to this question as it will expose the IPCC summary work for the fraud that it is.

        But 4 years is definitely within the range.

        • Nate says:

          Bill is trolling me?

          • Bill Hunter says:

            No Nate I am not trolling you. I am just pointing out that you won’t honestly explain what you know because you would prefer to not admit to what you know as that would clear up a lot of climate science obfuscation. thats just a fact, not a troll.

        • Chic Bowdrie says:

          Bill,

          Nate is obsessed with challenging anything that contradicts his AGW beliefs. By itself, there is no harm in that. Everyone is entitled to an opinion and a religion.

          The problem is the way he seasons his arguments with false premises, misrepresentations, strawmen, and appeals to authority. That is why I call him the King of Obfuscation.

          • Bill Hunter says:

            King of Obfuscation is right on the mark.

            Nate is well aware of the rapid decay of C14 in the atmosphere but he won’t own up to it because it definitely shines a light on the ‘doom and gloom’ the IPCC summary political report attempts to focus on using highly uncertain speculation.

            So while he wants to be a epigone to his daddy he has to cover up the ridiculous assumptions of his daddy at the same time. . . .thus the obfuscation.

            Indeed the mean decay rate is actually somewhat understated because other factors can play into modifying it as the uptake of CO2 can be accelerated by the greening of the planet and thus degreening the planet could decelerate the decay rate. But most estimates of the actual CO2 mean decay rate vary between 4 and 10 years. . . .both numbers Nate does not want to discuss since the IPCC summary cherry pegs it around 100 years.

        • Nate says:

          “with false premises, misrepresentations, strawmen, and appeals to authority”

          Can’t win on the facts? Just toss generic ad-hom grenades.

          Troll Handbook: Chapter 4.

  23. Entropic man says:

    Guy

    Wrong mental model. You can’t consider the atmosphere in isolation. CO2 circulates freely between three reservoirs; biomass, atmosphere and ocean surface layer(I’ve ignored the deep ocean for simplicity).

    The ocean surface layer contains about 670 gigatons, the atmosphere 720Gt and the biosphere 2000Gt giving a total circulating carbon of 3390Gt.

    500Gt of that has been added by human activity, 14% of the total.

    Human CO2 has been added to the atmosphere and about 25% has transferred to each of the other reservoirs.

    That leaves 250Gt out of 720Gt in the atmosphere, 35%.

    125Gt out of 670Gt in the ocean, 18%.

    125Gt out of 2000Gt in the biosphere, 6%

    13C?

    The biosphere carbon is mostly 12C.

    The human addition to atmosphere and ocean is 375Gt out of 1390Gt or 27%.

    You should see a similar decrease in 13C. It dropped from -6.5 o/oo to -8 o/oo, a decrease of 1.5/6.5 = 23%.

    • Richard S Courtney says:

      Entropic Man,

      Anything can be suggested by ignoring everything of greatest importance.

      Almost all the CO2 circulating in the climate cycle is in the deep ocean, but you say,
      “Ive ignored the deep ocean for simplicity”.

      Then you say,
      “500Gt of that has been added by human activity, 14% of the total.”

      Well, no.
      You have not included the content of the deep ocean in your “total”. In other words, you have not included the contents of by far the largest “reservoir”, and you have ignored the transfer rates between the ocean surface layer and the deep ocean.

      Your resulting percentages provide a demonstration of your preconceptions and your prejudices, but they indicate nothing else.

      Richard

      • stephen p anderson says:

        Richard,

        Eman’s math is obfuscation math. The only thing important to Eman is advancing the agenda. The agenda is that man is doing terrible things to the climate through his use of fossil fuels and must be stopped. He and his sycophants are the Masterminds who must be obeyed. The reason Eman wants to ignore “deep ocean” is that IPCC stuck a bunch of human carbon there with no explanation trying to make their obfuscation math work.

        • Entropic man says:

          Stephen

          Ad argumentum, not ad hominem,please.

          Show me calculations, show me data, show me that I’m wrong.

          If you choose to insult me instead I can only infer that you can’t falsify my science.

          • stephen p anderson says:

            Eman,
            I’ve asked you numerous times to explain where the “deep ocean” carbon came from in the IPCC’s human carbon cycle. No response from you. Their carbon cycle doesn’t work. It is obfuscation math, like you.

          • stephen p anderson says:

            I’ve asked you numerous times to explain where Berry’s third paper is wrong. You threw a bunch of crap at it but no math or science. No serious mental challenge. You went over to Berry’s board and all you gave him were ad hominem attacks. You’re a hypocrite.

          • stephen p anderson says:

            He was nice to you. He could have insulted your idiocy. He finally blocked you because all you did was insult him and you offered nothing scientific. You appeared a kook. He will spend time with someone who actually understands science.

          • Entropic man says:

            And there you go insulting me again. Still no falsification.

          • stephen p anderson says:

            Falsification of what? I’m not spending any time on your gibberish math. There’s nothing concrete to falsify. Berry tried to help you, and you insulted him. You’re all over the place. We show you, Chic shows you, and you keep repeating the propaganda. Go back to the bogs where you might have some competency.

          • Entropic man says:

            “We show you, Chic shows you, ”

            You’re not giving me what I need. I need data. I need your formulae. I need enough information to independently follow your reasoning.

            You won’t convince me by quoting existing sceptic memes. You will convince me by providing a paradigm that I can show myself is a better paradigm than the one I’m using.

          • Entropic Man, please stop trolling.

      • Entropic man says:

        I left out the deep ocean because of the slow turnover time across the thermocline.

        Turnover between the ocean and the atmosphere is 90Gt/yr in each direction.

        Turnover between the surface layer and the deep ocean is less than 10Gt/year. Over the century in question this can be ignored for a back of the envelope calculation.

        preconceptions and prejudices

        If I were defending a thesis I could and would document every number and every process. Since this is just a bit of fun on a chatsite we’re matching my preconceptions and prejudices against Guys and yours.

        Perhaps you could try my challenge.

        “I watch increasing CO2, decreasing OLR, increasing back radiation, spread in the 15 micrometres band, cooling stratosphere, increasing water vapour, increasing ocean heat content,decreasing ice extent, changing rainfall patterns, shifting Hadley cell boundaries, changes in Rossby waves, decreasing oxygen content, decreasing atmospheric 13C, decreasing ocean PH, biome boundaries moving to higher latitudes and altitudes, and all the other variables we study.”

        Put forward a coherent, consistent and consilient alternative hypothesis to CO2 AGW which includes and explains all the above.

        • stephen p anderson says:

          All of that can be explained by natural temperature variation.

          • Entropic man says:

            “All of that can be explained by natural temperature variation. ”

            Be much more specific.

            What is forcing the variations?

            How big are the energy imbalances involved?

            How big a temperature change do you expect for a given change in energy?

            Can you link changes in surface temperatures to changes such as solar input, albedo or energy budgets?

            Physics, please, not armwaving.

          • Clint R says:

            Ent, you’re such a hoot!

            Where’s the physics behind your nonsense that passenger jets fly backwards?

          • Willard says:

            I want a pony, Pup.

            Give it to me.

          • Willard, please stop trolling.

        • Richard S Courtney says:

          Entropic Man,

          You say to me,
          “If I were defending a thesis I could and would document every number and every process. Since this is just a bit of fun on a chatsite were matching my preconceptions and prejudices against Guys and yours.”

          HOW DARE YOU! Apologise!
          1.
          You presented a thesis and I explained that your thesis was plain wrong.
          2.
          I stated the truth that the errors of your thesis demonstrate your preconceptions and prejudices.
          3.
          I wrote nothing which could be interpreted to be preconceptions and prejudices (except for possible motivation of a prejudice against deliberate stupidity).
          4.
          This thread is about possible anthropogenic contribution to recent rise in atmospheric CO2 concentration: it is NOT about AGW, but you demand,
          “Put forward a coherent, consistent and consilient alternative hypothesis to CO2 AGW which includes and explains all the above.”

          Your off-topic demand is so trivial that I will answer.

          The AGW hypothesis explains nothing because recent rise in global temperature is similar to the rises to the Minoan Warm Period, to the Roman Warm Period, and to the medieval Warm Period. Parsimony dictates that whatever caused the previous warm periods is causing the Present Warm Period.
          If the AGW hypothesis is true then you need to explain
          (a) the cause or causes of all the previous warm periods
          and, importantly,
          (b) why those cause or causes are not responsible for the Present Warm Period.

          I await your apology.

          Richard

          • Entropic man says:

            You don’t get an apology.

            You did not demonstrate that I was wrong. You mentioned what, in the context of my reply to Guy, was a minor ingredient in the CO2 exchange. To show that I was wrong you would have to repeat the calculation including the deep ocean and show that the rate of exchange with the deep ocean has enough to significantly change my calculation. You did not.

            Put forward a coherent, consistent and consilient alternative hypothesis to CO2 AGW which includes and explains all the above.

            Your off-topic demand is so trivial that I will answer. ”

            These threads cover a lot of ground around the specific topic. As I do with Steven I will infer that your refusal to provide an alternative hypothesis is because you cannot.

            “The AGW hypothesis explains nothing because recent rise in global temperature is similar to the rises to the Minoan Warm Period, to the Roman Warm Period, and to the medieval Warm Period.”

            http://railsback.org/FQS/FQS22katoFutureTemps03.jpg

            Certainly doesn’t look it. I can’t find the Minoan or Roman Warm periods at all and the Mediaeval Warm Period shows as a flattening in a 5000 year cooling trend.

            If the same thing that caused the MiWP, the RWP and the MWP was causing the present warming we would be seeing a flat or cooling trend. Instead we are warming rapidly and passed them some time ago.

            “Parsimony dictates that whatever caused the previous warm periods is causing the Present Warm Period.”

            You may have noticed that the previous periods you mentioned took place in low-tech agrarian societies with a global population below 1 billion.

            The Present warm period takes place as 8 billion people operate a global industrial civilization. They are not comparable.

            Explainations?

            The Holocene Optimum ended 5000 years ago as we moved off the Milankovich sweet spot and we began cooling towards the next glacial period. The Industrial Revolution tipped us into rapid warming as we began significant albedo changes and the release of GHGs into the atmosphere.

          • Richard S Courtney says:

            Entorpic Man,

            I DID explain that your thesis is plain wrong when I pointed out you have omitted the contents of by far the largest CO2 reservoir in your calculations of percentages of total CO2 in reservoirs.

            You attempt to excuse your outrageous mistake by claiming,
            “Turnover between the surface layer and the deep ocean is less than 10Gt/year.”
            Really?!! “Less than 10Gt/year” globally?!! You know that HOW?

            On the basis of that error, ignorance and assertion, and from behind your coward’s shield of anonymity, you accuse me of being as biased as you and of not providing serious information to readers of this thread because you say you don’t provide serious information! You really are a piece of work.

            I still await your apology.

            Richard

            Richard

          • Willard says:

            > Parsimony dictates that whatever caused the previous warm periods is causing the Present Warm Period.

            Parsimony is not an explanation, RC.

            Neither is arm waving with whatever caused.

          • Willard, please stop trolling.

      • Willard says:

        > Almost all the CO2 circulating in the climate cycle is in the deep ocean

        Citation needed, RC.

        • Entropic man says:

          Richard’s actually right that the deep ocean contains 38,400 Gt, about 90% of the total circulating carbon. Unfortunately that is for a very limited value of “circulating”.

          What Mr Courtney does not take into account is that the atmosphere exchanges about 90Gt with the ocean surface layer and 125Gt with the biosphere, but exchange between the ocean surface layer and the deep ocean is only 10Gt. Over the decade-century timescales under discussion this is too small to be significant. In the short term the deep ocean is effectively isolated from the rest of the climate system.

          https://simple.m.wikipedia.org/wiki/Carbon_cycle#

          • Willard says:

            > Unfortunately that is for a very limited value of “circulating”.

            You should have let RC fall into that trap, EM.

            Easier to let your Climateball opponent give you the point himself.

          • Entropic man says:

            “Easier to let your Climateball opponent give you the point himself. ”

            You overestimate him.

          • Willard says:

            Me and RC already met at Judy’s, EM.

            Now that he knows I’m here, he might not be back for a while.

          • Swenson says:

            Willard the Inscrutable idiot wrote –

            “Me and RC already met at Judys, EM.

            Now that he knows Im here, he might not be back for a while.”

            Enough said.

          • Willard says:

            Words of wisdom, Mike.

            Words of wisdom.

          • Entropic man says:

            I remember him from Tallbloke’s.

          • Willard, Entropic Man, please stop trolling.

          • Richard S Courtney says:

            To All,

            The ridiculous Entropic Man says about me to the other anonymous troll,
            “I remember him from Tallblokes.”

            Those who want to read Entropic Man’s whingeing at my repeatedly wiping the floor with him at “Tallbloke’s” can do it here.
            https://tallbloke.wordpress.com/2012/10/19/richard-courtney-empirical-assessment-of-the-warming-effect-of-co2/

            Enjoy the laughs.

            Richard

          • Richard S Courtney says:

            Entropic Man,

            Repeating an untrue assertion does not make it true.

            I wrote to you,
            “I DID explain that your thesis is plain wrong when I pointed out you have omitted the contents of by far the largest CO2 reservoir in your calculations of percentages of total CO2 in reservoirs.

            You attempt to excuse your outrageous mistake by claiming,
            Turnover between the surface layer and the deep ocean is less than 10Gt/year.
            Really?!! Less than 10Gt/year globally?!! You know that HOW?

            YOU DID NOT ANSWER THAT. Instead, your next post in the thread says,
            “What Mr Courtney does not take into account is that the atmosphere exchanges about 90Gt with the ocean surface layer and 125Gt with the biosphere, but exchange between the ocean surface layer and the deep ocean is only 10Gt.”

            I DID TAKE IT INTO ACCOUNT BY ASKING HOW YOU – OR ANYBODY ELSE – COULD POSSIBLY KNOW WHAT YOU ASSERT.

            So, that is a second apology I await from you for your disgraceful behaviour in this thread.

            Richard

            PS !0 Gt is a nice round number. Why did you choose it?

          • Willard says:

            Glad you intend to stay, RC.

            The names Willard, BTW, so get your insults right.

            Oh, and you dont get to ask for evidence while at the same time pretending you refuted anything.

            Be seeing you.

          • Richard S Courtney says:

            Troll posting as Willard,
            Above I have repeatedly refuted the nonsense posted by the troll posting as Entropic Man. Indeed, my pointing out that his excuse for his egregious error is based on his assertion of a datum which he cannot justify because nobody knows – and nobody knows how – to discover. So yes, I do get to ask for evidence when a pair of trolls operate in concert to poison the thread with disinformation.
            Richard

          • Richard S Courtney says:

            ADDENDUM
            Troll posting as Willard,
            I did not suggest I would not stay, you did.
            So that is another falsehood from you (the total is rising)
            Richard

          • Willard says:

            Old coal industry representative posting as an asshat,

            10 GT is smol compared to 215 GT, and in context insignificant.

            Please, do continue your lawyerly mode.

          • Willard, please stop trolling.

    • Clint R says:

      A lot of food for plants, to be food for cows, to feed people.

  24. Mark B says:

    On the broader topic of CO2 growth, following from a discussion on the CO2 impact of Covid related economic slowdowns, I generated the graphics below that may be of interest to the community.

    These are generated from weekly CO2 observations, differenced from the previous year. This nominally removes the annual signal and gives a year-over-year atmospheric growth with weekly resolution.

    Mauna Loa observatory data: co2GrowthRateMlo.png

    Mauna Loa, Samoa, and South Pole observatory data: co2GrowthRateSpoSmoMlo.png

  25. ftop_t says:

    “The measurements are nearly continuous and procedures have been developed to exclude data which is considered to be influenced by local anthropogenic or volcanic processes.”

    Ahhhh!! The hallmark of climate science is the development of procedures to exclude data.

    Massive eruptions at Kilauea for four months in 2018, but nary a spike in the record. Is that natural event “excluded” from the Mauna Loa data set?

  26. Dr Roys Emergency Moderation Team says:

    Very off-topic, sorry:

    https://youtu.be/xbbAJwnJmiM

  27. TYSON MCGUFFIN says:

    Roy W. Spencer, Ph. D. April 9th says: “The proper way of looking for causal relationships between time series data (e.g. between atmospheric CO2 and temperature) is discussed.”

    Please see Heather Graven’s NOVEMBER 2016 article for a more in-depth treatment of the subject. Here is Figure 1 of that article which presents a less filtered version of your own Figures 1 & 2.

    • Gordon Robertson says:

      It all falls on its face if no correlation can be found between atmospheric CO2 and warming. The only evidence claimed by the mother of all alarmists, the IPCC, is that 19th century scientists inferred that.

  28. gbaikie says:

    Differences between the Moon’s near and far sides linked to colossal ancient impact
    https://phys.org/news/2022-04-differences-moon-sides-linked-colossal.html
    linked from: https://instapundit.com/

    “Now, researchers have a new explanation for the two-faced Moonone that relates to a giant impact billions of years ago near the Moon’s south pole.”

    “The nearside is home to a compositional anomaly known as the Procellarum KREEP terrane (PKT)a concentration of potassium (K), rare earth elements (REE), phosphorus (P), along with heat-producing elements like thorium. KREEP seems to be concentrated in and around Oceanus Procellarum, the largest of the nearside volcanic plains, but is sparse elsewhere on the Moon.”

  29. Francisco says:

    Looking at the rest of the peaks and valleys throughout the derivative, I’d argue that the current ‘dip’ attributed to COVID is but a coincidence. Else, the rest of the more significant peaks and valleys would require similar correlations and there are none (unless you cherry pick)

  30. Clint R says:

    A good point by Richard S. Courtney (upthread) needs to be emphasized:

    The AGW hypothesis explains nothing because recent rise in global temperature is similar to the rises to the Minoan Warm Period, to the Roman Warm Period, and to the medieval Warm Period. Parsimony dictates that whatever caused the previous warm periods is causing the Present Warm Period.

    • gbaikie says:

      AGW hypothesis explains nothing about the Holocene interglacial period, nor any of past glaciation or interglacial periods.
      The AGW hypothesis has no author. It has fathers and maybe a mother- it’s a cargo cult.

      • Entropic man says:

        Why would you expect it to? The glacial cycle is driven by orbital changes.

        • gbaikie says:

          Glacial cycles are related to orbital changes- or no one argues there is no correlation.
          There is also correlation with CO2 levels, but that correlation would suggest low CO2 levels cause massive warming. Or the highest CO2 are followed by global cooling.
          I don’t think high CO2 levels cause cooling, rather I think a doubling of CO2 level cause some increase in global surface air temperature or has unmeasurable amount of global warming.
          And I also don’t think CO2 causes cooling in the Antarctica.
          Or Roy seems to think CO2 can cause cooling, and I don’t.

          So, I think polar sea ice adds insulation in regards to ocean temperature. Though polar sea ice, prevents ocean from warming land areas, and thereby it lower global average air temperature.
          And the average temperature of ocean [which is about 3.5 C] control global climate.
          And I have a prediction related to this, the ocean temperature was about 4 C, about 8000 years ago.
          And statement of fact, the ocean average temperature was about 4 C or warmer in past peak interglacial periods.

          • gbaikie says:

            Also snow has warming effect.
            And if Mars was covered by 100 meter of snow, Mars would be warmer.

            Question, if entire surface of Mars was covered with 100 meter depth of snow {bright white snow, btw], what would Mars average surface temperature, be?
            {I would guess some might imagine, it “should be” much colder}

            And the other climate question I ask, what would Venus surface air temperature be, if Venus was at 1 AU distance [Earth distance] from the Sun?

            I am not interested in global climate, I am only only interested in can any theories of global climate, predict other planet’s temperatures.

          • Willard says:

            > snow has warming effect

            Aren’t you supposed to be Sky Dragon Crank curious, gb?

          • gbaikie says:

            “Arent you supposed to be Sky Dragon Crank curious, gb?”

            Is that related to cities in the skies of Venus?

            I think cities in the sky would be better on Venus than sky cities on
            Earth. But I think L-1 of Venus is more exciting.

          • Willard says:

            No, go.

            It is related to denying GHGs the physical properties you just implied for ice.

          • gbaikie says:

            “It is related to denying GHGs the physical properties you just implied for ice.”

            The ice would be related to what is called polar amplification.

            Over 70% of Earth surface is ocean and being most of the surface, the ocean surface temperature controls global surface air temperature.
            The average ocean surface temperature is about 17 C.
            17 C and 15 C are a cold temperature and average global land surface air temperature is about 10 C.

            It said that for last 34 million years, Earth has been in icehouse global climate which is having a cold ocean. The average temperature of ocean is about 3.5 C. An ocean with average temperature of 5 C is a cold ocean and in last couple million years the ocean has been colder than 5 C.
            The significance of cold ocean is related to polar amplification.
            Or the cold ocean has little to do with the tropical ocean area.
            One could say 1/2 of world is not effected much by the temperature of our cold ocean, but the surface ocean temperature of the other half the world is “controlled” by average temperature of the entire ocean.
            In past times of Earth, it’s had what is called a greenhouse global climate which has less cold ocean- like say, an average of 10 C.

            But issue is how silly the “greenhouse effect theory” is.
            It’s appears to me to be wrong and useless.
            It’s about the atmosphere, and Earth climate is about the ocean.

            I am curious what the cargo cultist do with idea that more 90% of global warming is the warming of the entire ocean. Ie:
            “Covering more than 70% of Earth’s surface, our global ocean has a very high heat capacity. It has absorbed 90% of the warming that has occurred in recent decades due to increasing greenhouse gases, and the top few meters of the ocean store as much heat as Earth’s entire atmosphere.”
            https://climate.nasa.gov/vital-signs/ocean-heat/
            Or this “lost heat” going into the ocean or the dog ate my homework.
            The part “top few meters of the ocean store as much heat as Earth’s entire atmosphere”
            And entire ocean having thousand times more heat than the atmosphere- 1 C increase of average ocean = heat of 1000 C of atmosphere.
            Is there unimaginable terror of a ocean which is 5 C?

            It’s my opinion that if the average temperature of the ocean was 4 C, there a good chance the Sahara desert would become mostly grassland. 5 C ocean is roughly impossible, but it seems in would cause large increase of global water vapor, but we would still be in an icehouse global climate. Or 34 million year ago, the ocean was warmer than 5 C.

          • Willard says:

            Polar amplification might be harder to achieve without the properties you deny for GHGs.

            What makes ice so special, besides what Vanilla said?

          • gbaikie says:

            — Willard says:
            April 13, 2022 at 10:46 AM

            Polar amplification might be harder to achieve without the properties you deny for GHGs.–

            It seems you think lukewarmer = deny
            wiki:
            lukewarmer (plural lukewarmers)

            One who believes that climate change is due to human activity but who does not think it is a serious problem.

            But one say I gone from 2-3 C per doubling, to a lot less.
            But my concern is short term. What will happen within 100 years.
            Or difference with me and other lukewarmers is they may not impose a time limit, like I do. But I always been thinking of it in terms of century or less. So my personal opinion has lowered.
            Also:
            https://achemistinlangley.net/2015/05/06/on-a-broader-definition-of-a-lukewarmer/

            But anyhow, my view is everyone has become a lukewarmer.
            And I am interested in views of anyone who isn’t- can’t find anyone.

            Of course another aspect, is doubt we will double CO2.
            And not because of anything governments have doing- I think governments are in best light, ineffective at lower CO2 levels, would argue they cause more CO2 emission rather then any reduction.
            The opposition to nuclear power- is easy case for this argument.
            The opposition to fracking and natural gas use, another.
            But host of things government has done which cause higher CO2 emission and absolutely “nothing” to actually reduce it.
            But there are far worst things which government have done, other than increase CO2 emissions.

          • Willard says:

            Three things, gb –

            First, it’s luckwarmer:

            http://rabett.blogspot.com/2015/02/luckwarmers.html

            Second, there are many things one can deny besides GHGs:

            https://contrarianmatrix.wordpress.com/

            Third, you don’t get to be a luckwarmer writing that kind of things:

            Where would it block [which can only mean absorb- as there is only a very small amount of CO2 in Earths atmosphere.

            https://www.drroyspencer.com/2022/04/uah-global-temperature-update-for-march-2022-0-15-deg-c/#comment-1242141

          • gbaikie says:

            — Willard says:
            April 13, 2022 at 2:35 PM

            Three things, gb

            First, its luckwarmer:–

            Well, not too long ago, Earth had the lowest level of CO2 ever measured and very cold temperatures, then sea level raised more than 100 meters, global temperature increased a lot, and Sahara Desert became mostly grassland.

            One could say, it was lucky-
            or the stars were aligned.

          • Willard says:

            In the long run, the universe got lucky.

          • Willard, please stop trolling.

    • Norman says:

      Clint R

      Where those warm periods global or regional? If regional ocean current changes could be responsible.

      https://www.earth.columbia.edu/articles/view/3266

      • Ken says:

        A lot of the proxy data wildly conflicts, so its hard to be certain, but the data where it correlates (sediments and tree rings NH SH and ice cores Greenland and Antarctic) seems to point to global periods of warming.

      • Richard S Courtney says:

        Norman,
        If “regional ocean current changes” move heat such as to change regional temperatures then they induce change to global temperature. I explain how and why as follows.
        Heat is radiated in proportion to the fourth power of the absolute temperature (T^4) of the radiating surface. Temperatures vary around the planet (e.g. with latitude).
        The Earth is heated by the Sun and loses that heat back to space by radiation. Any difference in the Earth’s receipt and loss of heat (i.e. the Earth’s radiative balance) causes global temperature to change until radiative balance is reestablished.
        So, if regional ocean currents move heat to change spatial temperature distributions then that causes the Earth to have a radiative balance which induces global temperature change until radiative balance is restored.
        NEVER FORGET THE POWER OF A FOURTH POWER RULE.
        Richard

        PS Please don’t mention this to Entropic Man: it risks giving him apoplexy because he is convinced there is no mechanism for natural global temperature change. However, several people (including Richard Lindzen and me) have independently calculated that regional ocean current variations do provide global temperature variations of the observed magnitudes.

    • Willard says:

      Right on, Pup:

      The Russian Invasion explains nothing because the Black Death also killed Europeans.

    • Entropic man says:

      During the earlier warm periods the climate happened to a few hundred million agrarian farmers.

      Now an industrial civilization of 8 billion people is happening to the climate.

  31. Gordon Robertson says:

    Syun Akasofu, a pioneer famed for his pioneering studies of the solar wind, claimed the IPCC erred by not including warming from the Little Ice Age into its anthropogenic claims.

    If the planet did cool 1C to 2C during the 400+ years of the LIA from 1300 – 1850, the cooling oceans would have absorbed more CO2. If CO2 has risen as much as claimed in the atmosphere due to a 1C warming over 170 years, why would the amount of CO2 in the atmosphere not increase with the re-warming from the LIA?

    I think the IPCC claimed an atmospheric concentration of 270 ppm in the pre-Industrial era. That was smack-dab in the middle of the 2nd cooling period of the LIA. Therefore, the base they are using would have been a naturally-induced minimum caused by global cooling due to the LIA.

    On top of that, the 270 ppm base itself was based on ice core proxies from Antarctic ice. Jaworowski claimed there are several errors induced during the process of extracting the ice cores.

    http://www.ferdinand-engelbeen.be/klimaat/jaworowski.html

    • Entropic man says:

      “re-warming from the LIA? ”

      But why did it cool and why is it rewarming? Without a mechanism and proper numbers for the energy imbalance your case is very weak.

    • Gordon Robertson says:

      entropic…you missed the idiotic mistake I made, posting a link to an equally idiotic alarmist on Jaworowski.

      Why it cooled and why it is re-warming since LIA is not the point. There is enough proxy data and written records to prove it did, and globally.

      http://www.warwickhughes.com/icecore/

      • Entropic man says:

        http://railsback.org/FQS/FQS22katoFutureTemps03.jpg

        When I look at the data I see a 5000 year natural cooling trend followed by a rapid artificial warming trend.

        I don’t see a Minoan Warm Period, a Roman Warm Period of a Little Ice Age. I suppose the flat spot around 1000AD might be the Mediaeval Warm Period.

        My explaination? We slipped off the Milankovich cycle sweet spot 5000 years ago and started slow cooling towards the next glacial period. Then the Industrial Revolution triggered rapid warming.

        • stephen p anderson says:

          Without a mechanism? Are you serious? I thought you are a biologist? Name me anything in nature that doesn’t vary.

          • stephen p anderson says:

            If we can’t explain how nature varies climate and temperature, we must accept your explanation, no matter how preposterous?

          • stephen p anderson says:

            Since you seem to have an explanation for everything, why don’t you explain why we’re here?

          • Entropic man says:

            Why we’re here?

            Personally my answer would be “Why not?

            I support the Weak Anthropic Principle, that the universe has properties that happen to allow us to exist.

            Most of the eejits here believe in the Strong Anthropic Principle that the Great Flying Spaghetti Monster or some other supernatural being created a universe designed for humanity.

            https://journalofcosmology.com/anthropic100.html

          • Willard says:

            I think Troglodyte is asking why we’re at Roy’s, EM.

          • Swenson says:

            Weepy Wee Willy,

            You wrote –

            “I think Troglodyte is asking why were at Roys, EM.”

            Still delusional, and convinced someone is interested in your bizarre fantasies.

            You still can’t actually name one person who cares what you “think”, can you?

            Or one person that cares whether you call me Mike Flynn or Santa Claus.

            In the meantime –

            carry on.

          • Willard says:

            I can name you, Mike.

            Embrace it.

          • Willard, please stop trolling.

        • Richard S Courtney says:

          Entropic Man,

          Please try to be consistent in your presentation of illogical arguments.

          On April 12 at 1.57 AM you posted,
          “re-warming from the LIA?

          But why did it cool and why is it rewarming? Without a mechanism and proper numbers for the energy imbalance your case is very weak.”

          That is worse than illogical. It is daft because the fact of the LIA is documented around the world and no “mechanism” nor “energy imbalance” data are required to provide “a case” for it having happened: crop yields alone provide “a case”. Similarly, I do not need to know a “mechanism” nor have “energy imbalance” data to know with absolute certainty that it was warmer here today than yesterday because going outside yesterday needed a coat but shirt sleeves were all that was required today.

          Then, on April !2 at 3.50 AM you posted,
          “When I look at the data I see a 5000 year natural cooling trend followed by a rapid artificial warming trend.

          I dont see a Minoan Warm Period, a Roman Warm Period of a Little Ice Age. I suppose the flat spot around 1000AD might be the Mediaeval Warm Period.”

          That, too, is illogical because you have chosen to ignore all the data which does indicate e.g. the Mediaeval Warm Period (even Michael Mann’s data shows it).

          So both your arguments are illogical but I write to point out that they are inconsistent.
          (1) At 1.57 AM you argued there was no Little Ice Age (LIA) because there was “no mechanism” for it
          and
          (2) only 2 hours later you claimed the data you chose to look at indicates there was no LIA

          If there was no LIA then there would not be a “mechanism”, but if there were an LIA then ignorance of a “mechanism” should be a spur to research.

          So, which is it?
          (a) History and archaeology both indicate the LIA was a global phenomenon so the “mechanism” of the LIA warrants research
          or
          (b) History and archaeology are both wrong in their indications of the LIA so your mention of a “mechanism” was meaningless twaddle.

          And in attempt to stop you replying with more meaningless twaddle, I add that the lack of a “mechanism” could have been used to bolster your silly claim that the LIA did not exist but you provided it as your primary argument.

          Richard

          • stephen p anderson says:

            He’s a retired school teacher who sits at home in Wales, advancing his utopian agenda. The only thing that matters is the agenda.

          • Entropic man says:

            Hello, Richard.

            Glad to clarify my position. I don’t think there was a Little Ice Age, just a continuation of the 5000 year cooling trend you can see below.

            http://railsback.org/FQS/FQS22katoFutureTemps03.jpg

            There are people here who do believe in a LIA. Are you a believer? If so, I invite you to tell me what evidence you have that the LIA is a separate event, what mechanism caused it and why it ended.

            Personally I don’t believe that you can supply scientific evidence for its existence and cannot provide a testable explanation for your delusion.

            Stephen

            I include you in this. Pretend to be a scientist and give me a numerical analysis showing the existence of the LIA and explaining the mechanisms involved.

          • Nate says:

            When did the LIA start and end?

            Has it still not ended?

            Why did its ‘recovery’ accelerate in the late 20th century?

            Why is the temperature much higher now than before the LIA?

            It has no identified mechanism. It is not testable or falsifiable.

            It is not a theory, it is a catch-all excuse.

            .

          • Richard S Courtney says:

            Entropic Man,
            In attempt to deflect attention from your inconsistency, you demand of me,
            “There are people here who do believe in a LIA. Are you a believer? If so, I invite you to tell me what evidence you have that the LIA is a separate event, what mechanism caused it and why it ended.”
            My religion is none of your business and is not relevant to this thread.
            You proclaim your belief in anthropogenic (i.e. human caused) global warming (AGW) so that religion is pertinent here.
            I do not “believe” in the LIA, I accept the evidence from history, geology, and archaeology that the LIA happened around the world.
            So, instead of pretending I am a heretic to your beliefs, perhaps you would explain to readers why you asserted a ridiculous value for CO2 exchange between deep ocean and ocean surface layer. I have repeatedly asked you (above) why you provided that assertion in this thread as an attempt to excuse your egregious error which I pointed out.
            Richard

          • gbaikie says:

            — Nate says:
            April 12, 2022 at 3:23 PM

            When did the LIA start and end?

            Has it still not ended? —

            I think it ended.
            People, long dead, used to agree it ended in round number of
            1850 AD
            But we try something different and say it was when the average global surface air was about 14.5 C.
            Though we don’t really know what is, now.

            But we say presently, it’s about 15 C. But we been saying this for many decades.

            And lately often talk about 1.5 C above prior industrial period [which is also vague. Some have said LIA was cold as 13.5 C, but they don’t give an exact date, but imagine it’s prior to industrial period.
            Some say the kick off of LIA was a large volcanic eruption, which is actually given precise time of about 1257 AD.
            And it seems 1257 AD would count as prior to industrial period.

          • Entropic man says:

            Certainly.

            I calculated that human emissions made up 27% of the CO2 in the atmosphere and ocean mixed layer. This would dilute the 13C by about the same amount. The observed dilution is 23%, in reasonable agreement

            If the human emissions had spread widely into the deep ocean would be spreading into a reservoir ten times as large. The dilution of 13C would be ten times less, about 2%.

            The observed dilution of 13C,23%, is much closer to the 27% expected if human emissions are not mixing into the deep ocean than to the 2% expected If complete mixing occurred.

            Thus I can infer that only a small proportion of human emissions are mixing into the deep pcean.

          • Willard says:

            > If there was no LIA then there would not be a “mechanism”, but if there were an LIA then ignorance of a “mechanism” should be a spur to research.

            The most beautiful if-by-whisky I have ever seen. Yet it takes a second to find:

            The new study, funded by the National Science Foundation and the Icelandic Science Foundation, suggests that the onset of the Little Ice Age was caused by an unusual, 50-year-long episode of four massive tropical volcanic eruptions. Climate models used in the new study showed that the persistence of cold summers following the eruptions is best explained by a sea ice-ocean feedback system originating in the North Atlantic Ocean.

            “Our simulations showed that the volcanic eruptions may have had a profound cooling effect, says NCAR scientist Bette Otto-Bliesner, a co-author of the study. The eruptions could have triggered a chain reaction, affecting sea ice and ocean currents in a way that lowered temperatures for centuries.”

            The researchers set the solar radiation at a constant level in the climate models, and Miller said the Little Ice Age likely would have occurred without decreased summer solar radiation at the time. Estimates of the suns variability over time are getting smaller, its now thought by some scientists to have varied little more in the last millennia than during a standard 11-year solar cycle, he said.

            https://instaar.colorado.edu/research/projects/cause-and-onset-of-little-ice-age/

            Let’s hope modulz NEVER FORGET ABOUT THE FOURTH POWER LAW!

          • Willard, please stop trolling.

      • Ferdinand Engelbeen says:

        Gordon Robertson, thank you for calling me an “idiotic alarmist”… Maybe idiotic, but certainly not an alarmist…

        All the objections of Jaworowski against the measurements of CO2 in ice cores of 1992 were already rejected by the work of Etheridge ea. in 1996 on three ice cores at Law Dome.
        https://agupubs.onlinelibrary.wiley.com/doi/10.1029/95JD03410

        Jaworowski didn’t do any work on CO2 in ice cores, only work on radio isotopes in ice, which behave completely different.
        Further he made several fundamental mistakes, e.g. by looking at the column of the ice age instead of the average gas age in the findings of Neftel to accuse Neftel of cheating to connect the CO2 levels in the ice core with the Mauna Loa data.
        When I did confront him with that error in personal correspondence, he reacted that there are frequent melt layer in the ice, so that there is no difference between ice age and gas age.
        That was clear nonsense, as Neftel detected one (!) melt layer at 70 m depth and corrected the gas age accordingly.

        Even so, Jaworowski repeated his false claims in the early 2000’s.
        Completely untrustworthy…

    • Chic Bowdrie says:

      Gordon,

      “…why would the amount of CO2 in the atmosphere not increase with the re-warming from the LIA?”

      It is a good question. One explanation might be that the absorbing process from atmosphere to ocean is much slower than the reverse out-gassing process. Therefore, given sufficient time at the coldest LIA temperatures, CO2 levels may have dropped below the ice core 270-280 ppm level.

      There is a good rationale for this given here: https://homeclimateanalysis.blogspot.com/2016/01/carbon-cycle-effect-of-temperature.html

      • Willard says:

        For once you found something interesting, Chic. But then your hypothesis that works upside down. The slowlier heat transfers, the longer it stays where it is. Which means you might have found the refutation to Gordos idea.

        A simpler hypothesis is that temperatures do not significantly drive CO2.

        • Chic Bowdrie says:

          I hate engaging in another of your pissing contests, but the Hashemi link is about absorbing and emitting CO2 from sea water, not heat transfers.

          Help yourself to refuting the data, papers, and presentations that show temperature drives CO2. And don’t forget the statistics invoked by writing temperatures do not “significantly” drive CO2.

    • Ferdinand Engelbeen says:

      The influence of temperature on CO2 levels in equilibrium with seawater, change with 12-16 ppmv/K per Henry’s law, that is all.

      The drop of 7 ppmv between MWP and LIA are clearly visible in the high resolution DSS ice core of Mauna Loa. Thus if the MWP was at least as warm as the current period, only 7 ppmv of the increase is natural. Or according to the change in solubility at maximum 13 ppmv for 0.8 K warming. The rest is man-made…

  32. Ireneusz Palmowski says:

    “There is the potential for this storm to bring record snowfall for the month of April to cities such as Bismarck and Grand Forks, North Dakota. A record-setting, late-season snowstorm in 1966 unloaded up to 2 feet of snow to these areas, and similar totals are expected from this week’s storm, making it likely this will rank as “one of the worst storms in recent history,” AccuWeather Senior Meteorologist Adam Douty said.”
    https://i.ibb.co/Yby28JC/gfs-o3mr-250-NA-f036.png

  33. Ireneusz Palmowski says:

    Winter temperatures in the western and northern US.
    A major snowstorm in North Dakota and Montana.
    https://i.ibb.co/h7R8Hhq/Screenshot-1.png

  34. Len Flint says:

    Very interesting read, but it looks at CO2 variance with various factors. I do not come at this from a pure physics perspective but from 25 years of continued analysis of the records and the increasing divergence between global temperature reality and IPCC near-mono CO2 factor models.
    This work does not, however, attempt links between multiple factors and the Holy Grail of temperatures/ECS. While recognising no single factor can hope to explain the temperature swings we see (as much as 0.5C from year to year in the UAH and other records) they cannot be linked to a single CO2 variable, as that has been largely constant or slowly increasing over the 40+ years of UAH-supported records.
    However, there is a remarkable match between the global average temperatute swings over the period 2005 to the present between temperatures and PDO (of which ENSO is a higher frequency sub-set). So after finding this, I went to google and find many interesting papers that attempt to match temperature excursions with multri-variant impacts, including the solar and PDO/AMO variations. They are interesting reading, especailly as we enter a 20+ year cycle where solar activity (cycles 25 and 26) are expected to decline and some suggest PDO will be entering a quieter phase. Of course, some may question cuase vs. effect (or the chicken/egg debate for we amateur physicists!)
    Are these trends at least partially the cuase of the now 7 year statistical pause/decline in global tempertures? Sadly, my advancing years may mean Ill never find out!

    • Ireneusz Palmowski says:

      I think we’ll find out soon enough. The troposphere in winter in high latitudes only reaches to about 6 km. Therefore, changes in the stratosphere due to a decrease in solar activity will affect winter temperatures in high and mid latitudes very quickly.
      https://www.iup.uni-bremen.de/gome/solar/mgii_composite_2.png
      https://cosmicrays.oulu.fi/webform/monitor.gif

    • Gordon Robertson says:

      len…”there is a remarkable match between the global average temperatute swings over the period 2005 to the present between temperatures and PDO (of which ENSO is a higher frequency sub-set)”.

      ***

      Look up Tsonis et al for the study they did analyzing ocean oscillations over a century. The conclusion, at least by Tsonis, was global warming occurred when the oscillations were in phase and cooling when they were out of phase.

      The PDO was not officially discovered till the 1990s. I doubt if much has been learned about its long-term effects as of yet.

      Tsonis questioned whether we should be spending so much time and effort studying anthropogenic causes while ignoring those natural causes.

  35. gbaikie says:

    Older news:

    Woolly Mammoths’ Taste For Flowers May Have Been Their Undoing
    February 6, 2014
    https://www.npr.org/sections/thesalt/2014/02/05/272094425/woolly-mammoths-taste-for-flowers-may-have-been-their-undoing

    [I was wondering what they ate. I agree it wasn’t grass.
    In terms of extinction, I tend to think, they grew big, lack
    predators and became stupid- kind of like humans. Humans could killed
    them, but given enough time, any kind change could wiped them out.]

  36. Gordon Robertson says:

    entropic…” http://railsback.org/FQS/FQS22katoFutureTemps03.jpg

    When I look at the data I see a 5000 year natural cooling trend followed by a rapid artificial warming trend.

    I dont see a Minoan Warm Period, a Roman Warm Period of a Little Ice Age. I suppose the flat spot around 1000AD might be the Mediaeval Warm Period”.

    ***

    For cripes sake, the LIA and MWP are noted right on the graph THAT YOU SUPPLIED.

    You can see the graph nose dive from the MWP at 0C down to -4.0 C at the peak of the LIA. Then some idiot has drawn a purple line over the data. The idiots have also compared proxy data with modern instrumental data then spliced the modern data onto the proxy data.

    Only an idiotic alarmist would dream of doing anything that stupid while expanding the temperature scale to exaggerate warming as if it means something.

    • Entropic man says:

      ” For cripes sake, the LIA and MWP are noted right on the graph THAT YOU SUPPLIED.”

      The graph labels where some people think the MWP and LIA were. Labels on a graph are not proof of their existence, especially when the graph itself provides very little supporting evidence.

      I can’t find anything to support your claim that the LIA went down to -4C.

      The only approach to -4C is during the last glacial period 22,000 years ago.

  37. Chic Bowdrie says:

    Dr. Spencer,

    Your regression model clearly indicates there is more to increasing CO2 than from fossil fuel emissions. However, only the volcanic and fossil fuel contributions are direct estimates of CO2 emissions. I consider EMI and IOD indirect contributions based on temperature influencing oceans outgassing CO2. Back in March 2020, I modified your earlier model correlating FF emissions with Mauna Loa data by including a hypothetical growth in non-FF emissions using a single, and constant, rate coefficient for the absorp.tion of atmospheric CO2 into the ocean and land sinks. I have modified that model further by including a physically-derived temperature out-gassing effect and one more factor for the remainder of all possible sources of atmospheric CO2.

    Prior to the industrial age, the amount of carbon dioxide in the atmosphere was assumed to be relatively constant at around 280 ppm. The master equation for that situation would be delC/dt = ks*Cs – ka*Ca, meaning the change in CO2 equals the rate of emission from CO2 sinks minus the absorp.tion of CO2 from the atmosphere. Global warming shifts the equilibrium toward increasing CO2, meaning ks has to be a function of temperature. Also, the equation had to be modified to account for additional CO2 sources caused by industrialization.

    I used a temperature factor derived from first principles by Kevin Hashemi (http://homeclimateanalysis.blogspot.com/). The factor increments (either adds or subtracts) the previous year’s total CO2 by 2.8% per degree change in temperature. The other factor contributing to atmospheric CO2 comes in part from the growth in population, because the decomposition and burning of past vegetation probably increases exponential as well. The magnitude of that concentration was simply the best fit to the Mauna Loa data. Although the fit is not perfect, only the remainder factor was manipulated to get a best fit. I can improve it by adding data for some remaining known but unaccounted for CO2 contributions, such as volcanic emissions, as they become available. It is also likely that the absorp.tion coefficient is not constant and could be a function of time, which would also allow improvement to the fit.

    The spreadsheet algorithm is Cn = Fn + Tn + Pn – kaC(n-1) where Fn, Tn, and Pn are the fossil fuel, temperature, and population etc. contributions. The data is plotted here: https://www.dropbox.com/s/2z8umpnymz1l5r9/FF%2BTemp%2BPop%20grow%20CO2.png?dl=0

    • stephen p anderson says:

      Chic,

      I know your post was to Dr. Spencer, but what are EMI and IOD?

      • Chic Bowdrie says:

        Should be MEI, the ENSO index. IOD is one of the regression factors Dr. S is using, Indian Ocean Dipole.

        I was late posting and he doesn’t usually response this late after posting. I’m happy for constructive comments from anyone.

    • Chic Bowdrie says:

      The algorithm should be Cn = Fn + Tn + Pn (1 kaC(n-1)) with ka around 0.28. Pn in 1850 starts at 80 ppm/year and increases to 112 in 2021 or 20 to 23.5 times current FF emissions.

  38. Gordon Robertson says:

    entropic…[GR]re-warming from the LIA?

    But why did it cool and why is it rewarming? Without a mechanism and proper numbers for the energy imbalance your case is very weak”.

    ***

    It seems obvious solar input varied during the period of the LIA. Some have claimed there was volcanic activity involved at certain times.

    You seem to be happy with the major ice ages, what caused those?

    It’s possible that the fusion reactions in the Sun are not constant and vary over a period, maybe regularly or irregularly. It might have been the case that our entire solar system was flying through a huge collection of dust, or gas, that blocked solar energy.

    Who knows? All we know is proxy data and written records record that something cooled the planet between 1300 and 1850 AD. There is proof in the way glaciers expanded, sometimes enormously.

    https://web.archive.org/web/20100706151525/http://ircamera.as.arizona.edu/NatSci102/text/extlittleice.htm

  39. Gordon Robertson says:

    christos from Wikipedia article…”From 1859 onwards, he [Tyndall] showed that the effect was due to a very small proportion of the atmosphere, with the main gases having no effect, and was largely due to water vapor, though small percentages of hydrocarbons and carbon dioxide had a significant effect.

    ***

    In 1909, R. W. Wood, an expert on gases like CO2, offered his opinion that CO2 could not cause such warming. He offered that the main gases mentioned in the quote above like nitrogen and oxygen could cause the warming by absorbing heat from the surface, which rises, but cannot dissipate the heat due to their inability to radiate it away.

    Of course, the heat will dissipate naturally as the gases rise to a level where they thin out as the pressure drops. As the pressure drops, the temperature will drop naturally as well. Also, the rising gases can spread laterally by convection and mingle with cooler air aloft.

    • Gordon Robertson says:

      btw…Tyndall thought warming would be a good thing. The year 1859 was near the end of the Little Ice Age and temperatures would still be a lot cooler. He would likely have thought the warming we have received to date would be ideal.

      • stephen p anderson says:

        Gordo,
        The sociopaths at Wikipedia have edited the Tyndall content for the last several years, hoping everyone has forgotten what was written before. Tyndall had written that CO2 and other trace gases had little effect.

        • stephen p anderson says:

          Editable internet content isn’t worth squat.

        • Mark B says:

          As a rule Wikipedia requires source referencing and keeps a comprehensive record of all previous versions and edits. Is there a particular revision that illustrates your assertions (Tyndall though “warming would be a good thing” (edited out by sociopaths) and “CO2 and other trace gases had little effect”)?

          https://en.wikipedia.org/w/index.php?title=John_Tyndall&action=history

        • Norman says:

          stephen p anderson

          Again I appeal to you to return to your scientific mind and get away from the nefarious lies of the right-wing conspiracy theorists who you believe (without any evidence, they just make claims and gullible right-wing people believe everything they say).

          I looked up what Tyndall actually wrote on the topic and your right-wing liars fed you crap. They lie all the time to gain power over the mind. Reject this and return to you science mind. Demand evidence, proof, facts.

          https://babel.hathitrust.org/cgi/pt?id=hvd.hxdhu8&view=1up&seq=42

          Start at page 33 of John Tyndall book “On Radiation”.

          Gordon Robertson loves to lie and deceive. Are you going to follow this course as well? I hope not. Gordon is no a science minded person. He is a conspiracy theorist. These types do not need evidence at all. They just believe any conspiracy regardless of content.

          • Willard says:

            Good find, Norman.

            Note that Gordo pretends to be a leftist. Think Old Left. The conservative kind. A bit like teh Courtney.

          • stephen p anderson says:

            Norman,

            This is what used to be quoted in Wiki. I used to use it all the time. I’ll look at your link over the next few days, but again, Tyndall wrote a lot on the subject. I’ll see what he says in this lecture. Tyndall still isn’t the be-all to end-all. Propagandists like to use Tyndall like they use Marx. Tyndall was a smart man, but he got a lot of stuff wrong. Have you read much of the “crazy” shit he used to say?

          • Gordon Robertson says:

            norman…you are a serious comedian. That particular work of Tyndall is nonsense. He says ‘probably’ a ten foot column of air could absorb 10 to 15% of the heat radiated from the surface.

            Tyndall is guessing. His original work in the lab was good but this is him hypothesizing about a system (the atmosphere) he clearly does not understand. In his day, there was no understanding of EM emissions and what drove them.

          • Gordon Robertson says:

            norman…”Gordon Robertson loves to lie and deceive”.

            ***

            Of the two of us, who has studied engineering at university? Who has followed a career in a field based in physics?

            Not you.

          • Willard says:

            C’mon, Gordo.

            Twas many, many years ago. A few courses. Mostly for electric stuff.

            I bet you worked as an electrician. Which is fine, really.

            If you want to go with credentials, I’ve been trained to read. You obviously haven’t.

          • Norman says:

            Gordon Robertson

            I am not convinced you studied any actual engineering but even if you did, all that information is lost to you now as you only subscribe to conspiracy theories and accept them as fact with no evidence.

            On Tyndall. I pulled up the information not to convince you about the GHE, it was to demonstrate that the claim Tyndall said trace gases had no effect was false.

            Scientists now have large amounts of data (actual measured values that you choose not to accept) that demonstrates the GHE.

            You say you took engineering but you can’t understand the Inverse Square Law. You think Earth surface IR emission reduces considerably in just a few feet because you can move your hand away from a oven burner. This is not the thoughts of someone who studied college physics. It is someone who really does not know much science and pretends.

            Gravity of Earth also follows the Inverse Square Law like IR emission. Does gravity force go away in a couple feet above the surface? If you jump do you just keep moving upward because gravity has gone weak in a few feet. No Gordon you never studied physics. You get all your science knowledge from Conspiracy blogs.

      • Nate says:

        “Tyndall had written that CO2 and other trace gases had little effect.”

        Fake made up ‘facts’ are not worth squat, Stephen.

        Show us the quote, from a legit source.

  40. gbaikie says:

    Maars on Mars

    Maar
    “A maar is a broad, low-relief volcanic crater caused by a phreatomagmatic eruption (an explosion which occurs when groundwater comes into contact with hot lava or magma). A maar characteristically fills with water to form a relatively shallow crater lake which may also be called a maar. The name comes from a Moselle Franconian dialect word used for the circular lakes of the Daun area of Germany.”
    https://en.wikipedia.org/wiki/Maar

    I was wondering what youngest craters on Mars, were.
    Didn’t see answers, but people looking for Maars on Mars.
    How many Maars are on Mars?
    Couldn’t get any idea.

    “Late last year, researchers at NASA used a machine-learning algorithm to discover fresh Martian craters for the first time. The AI discovered dozens of them hiding in image data from the Mars Reconnaissance Orbiter and revealed a promising new way to study planets throughout our solar system. From a science perspective, thats exciting because its increasing our knowledge of those features, says Kiri Wagstaff, a computer scientist at NASAs Jet Propulsion Laboratory and one of the leaders of the research team. The data was there all the time, its just that we hadnt seen it ourselves.
    https://www.wired.com/story/nasa-is-training-an-ai-to-detect-fresh-craters-on-mars/

    Still want to know about fresh craters, but also about maars on Mars.
    Since Mars is pretty dead volcanologically speaking, one could imagine there not many Maars on Mars.
    But if found some, it could give some clues about mining water on Mars.

    • gbaikie says:

      Maars on Mars would indicate Mars’ ground water.
      We don’t know if or the amount of Mars ground water.
      But might not immediately indicate the depth of any ground
      water.
      I think there could be a lot Mars ground water, but unlike Earth, it could be at great depths. Mars has no plate tectonic activity and our active volcanic activity/plate tectonic keeps ground near surface [though some imagine lots of water also be at great depths on Earth].
      Or Mars has thick crust as compared to Earth’s thin crust- at in theory.
      In terms Mars water minning, ground water as shallow as 1000 meters or less would be relevant. And also what kind of water. But quantity more significant than quality of water.

  41. Ireneusz Palmowski says:

    High SOI will drive typhoons in the western Pacific.
    https://www.longpaddock.qld.gov.au/soi/

  42. gbaikie says:

    “An “ice-free” Arctic Ocean, sometimes referred to as a “Blue Ocean Event”, is often defined as “having less than 1 million square kilometers of sea ice”, because it is very difficult to melt the thick ice around the Canadian Arctic Archipelago”
    https://en.wikipedia.org/wiki/Arctic_sea_ice_decline

    So, ice-free means 1 million or less square km of polar sea ice and lowest recorded in modern times is: 2012 AD 3.39 million square km.

    So, I was going to ask when we going to get ice-free arctic polar sea ice, but now going to change it to when are we get to 1 million square km or less of polar sea ice.
    Again with Wiki:
    “The IPCC Sixth Assessment Report (2021) stated that Arctic sea ice area will likely drop below 1 million km2 in at least some Septembers before 2050.”
    And:
    Many scientists have attempted to estimate when the Arctic will be “ice-free”, among them Peter Wadhams who in 2014 predicted that by 2020 “summer sea ice [will] disappear,” Wadhams and several others have noted that climate model predictions have been overly conservative regarding sea ice decline.”

    Does anyone now think the IPCC Sixth Assessment Report is overly conservative?

    And now, I am wondering about this “very difficult to melt the thick ice around the Canadian Arctic Archipelago”.
    How old is it?
    Without looking {though I have no idea whether anyone bothered to determine how old it is} how old do you imagine that ice is?

    • gbaikie says:

      My impatience may ruin the question:
      “Abstract

      The bowhead whale (Balaena mysticetus) is a planktivore of the baleen group of whales adapted to live in the loose edges of the north polar sea ice. Its annual migrations roughly track the advance and retreat of the floe edge.

      Using this criterion, postglacial time is divided into four intervals: (1) 10.5-8.5 ka B.P. – A large bowhead population extended in the summer all the way to retreating glacier margins and ultimately from the Beaufort Sea to Baffin Bay; meltwater-driven outflows probably cleared the inter-island channels of sea ice; this interval terminated when the present interglacial circulation pattern was established; (2) 8.5-5 ka B.P. – Bowheads were excluded from most of the archipelago because the channels failed to clear of sea ice; summer sea-ice conditions for most of this time were more severe than during historical times; (3) 5-3 ka B.P. – Bowheads reoccupied the central channels of the Arctic Islands, and their range extended beyond historical limits; and (4) 3-0 ka B.P. – Sea ice excluded whales from the central channels, as it does today.

      A reconciliation of the two data sets may indicate the following general summer climatic conditions: 10-8 ka B.P. – warm summers with maximum postglacial warmth; 8-5 ka B.P. – cool, dry summers; 5-3 ka B.P. – cool, wet summers; 3-0 ka B.P. – cold, dry summers.”
      https://jmss.org/index.php/arctic/article/view/64255

      • gbaikie says:

        It goes on and on:
        But at least they warn you:
        “The extreme difficulties of navigating the ice-plagued waters of this remote area and the harsh polar climate have inhibited study of its marine cryosphere. Scientific knowledge is superficial and incomplete.”

        And: “However, it may vary appreciably with change in climate. Paleoclimatic data suggest that ice (and marine mammals) moved more freely through the Canadian Arctic Archipelago at some times during the Holocene than at present.”
        https://agupubs.onlinelibrary.wiley.com/doi/full/10.1029/2001JC001102

        [If I were to make it short, it seems the amount freshwater doesn’t make it easier. If I was interested, I might read most of it]

        Something else:
        “Though much attention has been focused in recent years on the melting of ice from Greenland and Antarctica, nearly half of the ice volume currently being lost to the ocean is actually coming from other mountain glaciers and ice caps. Ice loss from a group of islands in northern Canada accounts for much of that volume.

        In a study published in April 2011 in the journal Nature, a team of researchers led by Alex Gardner of the University of Michigan found that land ice in both the northern and southern Canadian Arctic Archipelago has declined sharply. The maps above show ice loss from surface melting for the northern portion of the archipelago from 20042006 (left) and 20072009 (right). Blue indicates ice gain, and red indicates ice loss.

        In the six years studied, the Canadian Arctic Archipelago lost an average of approximately 61 gigatons of ice per year. ”
        https://earthobservatory.nasa.gov/images/50726/ice-loss-in-the-canadian-arctic-archipelago

  43. We have discovered the Planet Surface Rotational Warming Phenomenon.

    The Planet Surface Rotational Warming Phenomenon states: Planets’ mean surface temperatures relate (everything else equals) as their (N*cp) products’ sixteenth root.

    The discovery has explained the origin of the formerly observed the planets’ average surface temperatures comparison discrepancies.

    Earth is warmer than Moon because Earth rotates faster than Moon and because Earths surface is covered with water.

    What we do in our research is to compare the satellite measured planetary temperatures. We call it “The Planets’ Surface Temperatures Comparison Method“.

    A faster rotating planet accumulates much more solar energy, than a slower rotating one.

    https://www.cristos-vournas.com

  44. Chic Bowdrie says:

    As usual, you obfuscate by not acknowledging the at least 20:1 non-fossil fuel emissions competing for absorp.tion by the sinks. My estimate gives FF emissions at most 8% of the rise.

    Unless you want to continue to claim that only half of FF emissions remain after all of the non-fossil fuel emissions are absorbed.

    • Nate says:

      So you accuse Roy of obfuscation now?

      Show us evidence (not invented data) that that the net annual non-fossil emissions are 20 x FF emissions.

      • Chic Bowdrie says:

        My misplaced comment due to the absorp.tion posting issue was directed at you, not Dr. Spencer who was “trying to show how difficult it is to determine cause-and-effect from the available statistical data analysis alone.” His analysis used a regression model which does not include physical process components such as emission and absorp.tion rate constants. Even so his analysis shows “the role of anthropogenic emissions is reduced by 15% from the anthro-only regression model.” That is, 35%, not the simplistic 50% from your man-behind-the-curtain brainwashing.

        By including physical absorp.tion rate constant and a physically meaningful contribution due to the effect of temperature, My physically meaningful model shows that fossil fuels and out-gassing CO2 sources contribute less than 10% to the total CO2 emissions. Until you or someone else has a better analysis proving me wrong, I rest my case.

        • Entropic man says:

          Are you Ed Berry?

          He had a model which pumped large amounts of CO2 into the atmosphere from the deep ocean into the atmosphere against the concentration gradient by an unspecified mechanism and at zero energy cost. Not even LOT compliant!

          Your model sounds equally plausible. Have you published it?

          • Chic Bowdrie says:

            Thanks for the compliment. I doubt I will ever publish my model because it is too similar to the others who have published along the same line of thinking which is that FF emissions are sinked as a fraction of the total CO2 in the atmosphere. Since the “natural” emissions (I like to say non-FF emissions) are twenty times more than FF emissions, only a small fraction of the atmosphere retains the FF emissions.

            What might be unique and publishable is data indicating non-fossil fuels are increasing due to population growth. Stay tuned.

      • Nate says:

        “My physically meaningful model shows that fossil fuels and out-gassing CO2 sources contribute less than 10% to the total CO2 emissions”

        A ‘model’ that presumes the existence of a massive undetected net flow of natural co2 into the atmosphere from an unidentified source by an unidentified mechanism is not physically meaningful.

        It does not ‘show’ anything, other than how to delude oneself.

    • Entropic man says:

      The key word, as Nate mentions is “net”.

      95% of GROSS CO2 emissions come from respiration by the biosphere. Since the same amount of CO2 is absorbed by photosynthesis the NET emission is zero.

      This is the difference between human emissions and natural emissions. Natural emissions are removed from the atmosphere as fast as they are emitted. Human emissions accumulate.

      • stephen p anderson says:

        Horse poop. That violates the principle of equivalence. Do you understand the equivalence principle? Absorp.tion is a function of atmospheric concentration. Atmospheric concentration increases until it reaches a new balance level. But if fossil fuel emissions are only 5% of total emissions, it appears Chic is being conservative with his 8% figure.

      • Chic Bowdrie says:

        E man,

        Maybe you live in a rest home and cannot appreciate how much plowing, trimming, mowing, burning, and other non-fossil fuel sources that contribute to the roughly 95%. No matter. Fact is you have not kept tabs on photosynthesis or out-gassing and therefore you are not in a position to challenge my hypothesis that population growth contributing less than one percent more CO2 each year explains perfectly the 2.5 ppm average yearly CO2 increase.

        What you wrote would be relevant if you knew for a fact that natural emissions have not increased one iota since human flourishing began.

        • Willard says:

          > What you wrote would be relevant if you knew for a fact that natural emissions have not increased one iota since human flourishing began.

          That argument would have some scientific validity if appealing to ignorance had any currency.

        • Entropic man says:

          Chic Bowdrie

          All the processes you describe return CO2 to the atmosphere by respiration of decomposers. The plant material decomposing was built by photosynthesis using CO2 removed from the atmosphere earlier in the year.

          Over a year the biosphere takes up 125Gt of carbon by photosynthesis and releases 125Gt by respiration. They cancel out, so the net contribution of the biosphere to increasing CO2 is normally zero.

          Indeed the biosphere is currently acting to slow the increase in atmospheric CO2 by taking up 25% of human emissions.

          Please research carbon cycles. At present you are armchair quarterbacking with no knowledge of biology or carbon cycles.

          • Willard says:

            All that is well and good, EM, but have you considered unicorn farts?

            Like tree lobsters, I bet you cannot prove they do not exist.

            Until then, you established NOTHING.

          • Entropic man says:

            My granddaughter has a large collection of unicorns.

            I’ll test their output and let you know.

          • Chic Bowdrie says:

            The chemical reactions for photosynthesis and respiration are balanced. But do you have any data to support your claim that they “cancel out” on a global yearly basis?

          • Willard says:

            Please keep me updated, EM.

            Did you notice how Chic requests for hard evidence in one comment while in the next gestures toward the infinity he does not know?

            Usually these postures fall under different roles. As you may well know, Climateball is a balancing act.

          • Entropic man says:

            Chic Bowdrie

            “The chemical reactions for photosynthesis and respiration are balanced. But do you have any data to support your claim that they cancel out on a global yearly basis? ”

            Yes.

            Look at the Keeling Curve.

            https://keelingcurve.ucsd.edu

            The curve shows two patterns.

            There is a long term trend, an increase in concentration of about 2ppm/year Which is new CO2 entering the system.

            There is also an annual cycle. You see a minimum in October. The concentration then increases by 10ppm to a peak in March and then decreases again.

            The cycle follows the Northern Hemisphere growing season.

            This is because the majority of Earth’s biomass is on land in the Northern Hemisphere.

            From March to October there is globally more photosynthesis than respiration and there is a net decrease in CO2 of 10 ppm. From October to March there is more respiration than photosynthesis and a net increase in CO2 concentration of 10 ppm.

            Since the cycle returns to its original value each year any contribution to increasing CO2 will be small.

            Both sceptics and NASA agree that the planet is greening, ie that the amount of biomass is increasing and the biosphere is a net absorber of CO2 from the atmosphere. Do the numbers and the biosphere is absorbing the equivalent of 1 ppm/year.

          • Chic Bowdrie says:

            My model does the numbers. I don’t see any data or models from you.

            “Since the cycle returns to its original value each year any contribution to increasing CO2 will be small.”

            You are simply describing reality. There is a net increase each year which you and others can claim is totally from fossil fuel emissions. But is an empty assertion unless you can prove no increase in contributions from non-FF emissions.

            My model indicates there is a problem explaining the Mauna Loa data without a revision in your all anthro AGW position.

          • Entropic man says:

            Chic Bowdrie

            Let’s go through the options.

            Where is the extra CO2 coming from?

            It’s not the biosphere, which is a net absorber of of 1ppm equivalent CO2.

            It’s not the ocean mixed layer. In accordance with Henry’s Henry’s Law the increasing partial pressure gradient is causing the ocean to take up CO2 from the atmosphere faster than increasing temperature is reducing its solubility. That’s a net uptake of 1ppm equivalent.

            It’s not the deep ocean either. Ocean pH is decreasing. As a chemist you’ll note that the bicarbonate/carbonate equilibrium is moving towards bicarbonate as dissolved CO2 increases and pH drops.

            It’s not volcanoes. Total volcanic emissions are about 0.04ppm equivalent/year.

            Silicate weathering and sedimentation are net absorbers of CO2 and absorb about 0.4ppm equivalent.

            We know from business records that fossil fuel use and cement production are releasing 4ppm/year equivalent into the atmosphere.

            All of the above data is in the literature of you care to check; measured, calculated, peer reviewed, published and replicated.

            In summary, 4ppm equivalent enters the atmosphere from human activity each year. 1ppm equivalent is absorbed from the atmosphere by the biosphere and another 1ppm by the ocean mixed layer. That gives a net increase of 2ppm/year.

            I’m interested. How does your model make 4ppm equivalent of human CO2 emissions vanish while creating 4ppm emissions from nowhere?

          • Chic Bowdrie says:

            “Its not the biosphere, which is a net absorber of of 1ppm equivalent CO2.”

            Without a model or some justification, that assertion is meaningless.

            “All of the above data is in the literature of you care to check; measured, calculated, peer reviewed, published and replicated.”

            Another meaningless assertion. What data have you seen that refutes my hypothesis?

            “How does your model make 4ppm equivalent of human CO2 emissions vanish while creating 4ppm emissions from nowhere?”

            You are obviously not paying attention. I am proposing an incremental increase in non-FF emissions in addition to the known FF emissions where using a physical-chemically relevant absorp.tion rate allows an excellent fit to the Mauna Loa data. I published the spreadsheet formula on this post. Make sure you understand it before making any more nonsensical replies.

          • Entropic man says:

            Chic Bowdrie

            I predate spreadsheets. You’ll have to use words.

            Are you describing positive feedbacks?

          • Entropic man says:

            This is the carbon cycle I’m familiar with, in this case compiled from the literature by NASA.

            https://commons.m.wikimedia.org/wiki/File:Carbon_cycle-cute_diagram.jpeg#mw-jump-to-license

            What evidence do you have that it is wrong?

          • Entropic man says:

            Willard

            I collected unicorn farts from the room where my granddaughter was playing with her unicorns.

            They show the same absorb.tion spectrum as the GHG methane and would therefore be expected to influence the climate. One caveat; I cannot guarantee that the farts came from the unicorns and not the wee girl.

          • Willard says:

            > I cannot guarantee that the farts came from the unicorns and not the wee girl.

            Therefore it’s meaningless.

            Look at the silly monkey!

          • Chic Bowdrie says:

            The master equation says the change in variable with respect to time equals the sum of the inputs and outputs to the variable, in this case CO2 in the atmosphere. My spreadsheet equation accumulates CO2 in air from an arbitrary time 0 (1850) and assumes the initial CO2 to be 280 ppm. Each new/next line of the spreadsheet adds the published FF emission, a temperature contribution, and an additional factor totaling about 80+ ppm emissions for that year to the previous year’s total and then subtracts a fraction of the previous year’s total to get the new total CO2 in air for that new year. This is a commonly used numerical integration technique that simulates the integration of the theoretical master equation. The fraction removed is based on the 80ppm/280ppm approximate fraction that has to be added and removed each year for the CO2 to have remained constant prior to the industrial revolution.

            An engineer would have to explain if this has anything to do with feedbacks. I think not. The FF emissions are just what they are. My temperature factor just adds or subtracts a fraction of the new CO2 based on the magnitude of that year’s temperature change. The final input was a multiplier proportional to the population each year that made the best fit to the Mauna Loa data. I could have improved the fit by tweaking the multiplier to change with time. The fact that I didn’t have to do that is what surprised me and struck me as novel. That is, the growth in CO2 is largely proportional to population growth over a 170 year span.

            There is nothing wrong with your carbon cycle cartoon other than being outdated and disagreeing somewhat with the IPCC version. You have 121 + 92 GtC exchanging between air and sinks annually and only 5.5 GtC/year FF emissions. The IPCC figures are more like 160 total exchange and 10 GtC FF emissions, IIRC.

          • stephen p anderson says:

            Chic uses something simple like Conservation of Mass as the basis for his model. Eman and his sycophants use obfuscation, chaos, and red herrings as the basis for their model. As Einstein said, if you can’t explain it to a six-year-old, you don’t understand it yourself. Eman, you can’t explain it to a six-year-old.

          • Willard says:

            Here’s my model of Chic’s model, Troglodyte:

            https://xkcd.com/793/

            The only difference is that neither you nor Chic are physicists.

          • Entropic man says:

            “There is nothing wrong with your carbon cycle cartoon other than being outdated and disagreeing somewhat with the IPCC version.”

            Different dates. As you say, the NASA diagram is about 20 years old. The AR6 version is from about 2020. Together they show the effect of 20 years warming and 20 years of accelerating CO2 emissions on the carbon cycle.

          • Willard, Entropic Man, please stop trolling.

        • Nate says:

          As Roy correctly noted above, the outgassing from the ocean due to T rise would be limited to about 10 ppm.

          This confirmed by ice core data showing 7 ppm drop from MWP to LIA.

          I suppose Chip will have to argue that he is obfuscating.

          So that leaves what source/mechanism to get the massive new input of natural carbon required?

          This is sheer fantasy. No data. No evidence. No physics.

          But yet they have BELIEF in the cause. Apparently thats good enough.

          • Chic Bowdrie says:

            Unlike you, Dr. Spencer uses data and models to push back the frontiers of CO2 science. My attribution calculation might need to be revised, but I have used data and realistic physics leading to evidence, albeit inconclusive, that CO2 growth comes from more than fossil fuels.

            No it is not good enough and, unlike you and your AGW belief, I’m working on falsifying a hypothesis.

          • Willard says:

            > I’m working on falsifying a hypothesis.

            Evidence that you’re working would already be great, Chic.

          • Bill Hunter says:

            Nate says:

            As Roy correctly noted above, the outgassing from the ocean due to T rise would be limited to about 10 ppm.

            This confirmed by ice core data showing 7 ppm drop from MWP to LIA.
            ———————————
            Didn’t Al Gore and Michael Mann say there was no global temperature change between the LIA and MWP Nate? What are you saying it is now?

            And how do you know that ground truths Roy’s comment? After all he didn’t say where he read that.

          • Willard says:

            Glad you ask that leading question, Bill:

            A new study puts together the evidence on a global scale for the first time. Based on this, the authors say that the supposed warm and cold epochs may represent, more than anything, regional variations that can be explained by random variability. Published in the leading journal Nature this week, the study analyzes paleoclimate data from across the world, using multiple statistical methods and many sources: tree rings, glacial ice cores, corals, lake sediments. It does not suggest that the periods of high or low temperatures observed during the named epochs did not exist in certain places; rather that they did not exist everywhere at the same time, and thus probably were not caused by some kind of planetary driver.

            That said, the study does find one very coherent period: an unprecedented warm one extending over 98 percent of the globe, starting in the 20th century. This is almost certainly caused by us.

            https://news.climate.columbia.edu/2019/07/24/climate-epochs-that-werent/

            The Serengeti strategy is harder when one can find tons of sources that corroborate our contrarians’ favorite scapegoats.

          • Bill Hunter says:

            Willard says:

            Glad you ask that leading question, Bill:

            The Serengeti strategy is harder when one can find tons of sources that corroborate our contrarians favorite scapegoats.
            ——————————-

            You are hilarious Willard. I said there was no evidence that Nate’s source wasn’t also Roy’s source. . . .Therefore, it is primary violation of the rules of science to suggest that Nate’s source corroborates Roy and his source.

            I know they make exceptions for climate science on this stuff where one scientist extrapolates as a suggestion the potential of a physical relationship and the second scientist then does a study on the premise the first source’s suggestion was corroborated science.

            In fact that probably comprises over 97% of climate science papers I would estimate.

          • Willard says:

            Your question started with “Didn’t Al Gore and Michael Mann,” Bill.

            You really seem to have a problem following your own train of thoughts.

          • Bill Hunter says:

            Willard seemed appropriate to start out with Al Gore and Michael Mann since folks here are still bringing up Pratt and the models still estimate 3C warming don’t you think? The spinners on this blog simply can’t learn! Good thing you aren’t a spinner Willard.

          • Willard says:

            Your squirrels are usually more elegant than that, Bill.

          • Willard, please stop trolling.

  45. gbaikie says:

    “NASA’s Hubble Space Telescope has determined the size of the largest icy comet nucleus ever seen by astronomers. The estimated diameter is approximately 80 miles across, making it larger than the state of Rhode Island. ”
    https://www.spacedaily.com/reports/Hubble_confirms_largest_comet_nucleus_ever_seen_999.html
    Linked from: https://www.spacedaily.com/

    [80 miles = 128.7 km in diameter
    +100 km diameter impactor is world changing]
    “The behemoth comet, C/2014 UN271 (Bernardinelli-Bernstein) is barreling this way at 22,000 miles per hour from the edge of the solar system. But not to worry. It will never get closer than 1 billion miles away from the Sun, which is slightly farther than the distance of the planet Saturn. And that won’t be until the year 2031.” 22,000 mph = 9.8 km/sec

    ” The comet has been falling toward the Sun for well over 1 million years. It is coming from the hypothesized nesting ground of trillions of comets, called the Oort Cloud. The diffuse cloud is thought to have an inner edge at 2,000 to 5,000 times the distance between the Sun and the Earth. Its outer edge might extend at least a quarter of the way out to the distance of the nearest stars to our Sun, the Alpha Centauri system.

    The Oort Cloud’s comets didn’t actually form so far from the Sun; instead, they were tossed out of the solar system billions of years ago by a gravitational “pinball game” among the massive outer planets, when the orbits of Jupiter and Saturn were still evolving. The far-flung comets only travel back toward the Sun and planets if their distant orbits are disturbed by the gravitational tug of a passing star – like shaking apples out of a tree.”

    Any know “star” passing by us within last million years?
    https://en.wikipedia.org/wiki/List_of_nearest_stars_and_brown_dwarfs#Distant_future_and_past_encounters
    Gliese 710 closest approach to our Sun: 0.166 lightyears and about
    1.286 million years ago.

    • Entropic man says:

      It takes well over 1 million years for a comet to travel into the inner system from the Oort cloud and Gliese 710 passed through the Oort cloud 1.3 million years ago.

      I trust our development of comet deflection technology is well under way.

      • gbaikie says:

        We have nuclear bombs, we just need to deploy them quick enough. At far enough distance, a slight change in velocity of it’s trajectory would cause a miss.
        We are practicing this with DART:
        “5 months ago
        NASAs Double Asteroid Redirection Test (DART), the worlds first full-scale mission to test technology for defending Earth against potential asteroid or comet hazards, launched Wednesday at 1:21 a.m. EST on a SpaceX Falcon 9 rocket from Space Launch Complex 4 East at Vandenberg Space Force Base in California. Just one part of NASAs larger planetary ”
        https://www.nasa.gov/planetarydefense/dart/dart-news

        • gbaikie says:

          btw, DART is not using any kind of explosive, all one needs is mass and difference of velocity [nukes would just work better- or need launch less mass to slightly move a vast amount of mass].
          The problem is having enough distance and knowing the exact trajectory of object- so what mostly needed is more and better telescopes, which we doing, also.
          We getting large telescope which will be able to do this, and even James Webb could be of use.

  46. Ireneusz Palmowski says:

    Bitter cold to persist in wake of massive blizzard in north-central US.
    https://cms.accuweather.com/wp-content/uploads/2022/04/RFThursAm12Apr.jpg?w=632

  47. Gordon Robertson says:

    norman…”I looked up what Tyndall actually wrote on the topic and your right-wing liars fed you crap. They lie all the time to gain power over the mind. Reject this and return to you science mind. Demand evidence, proof, facts.

    https://babel.hathitrust.org/cgi/pt?id=hvd.hxdhu8&view=1up&seq=42

    Start at page 33 of John Tyndall book On Radiation”.

    ***

    Look at page 19 where he claims heat-waves flow through a luminescent aether. And, a few pages earlier where he claims IR from the Sun is more intense than any other part of the visible spectrum. Never seen solar IR cause a sunburn on human skin.

    I enjoy reading what Tyndall did re his experiment on CO2, and on the electrically-heated platinum wire, which is the basis of Stefan’s S-B equation, but we need to face it that his understanding of the atmosphere was very limited.

    It is this limited understanding that is the basis of modern AWG theory. No one has proved scientifically at any time that CO2 is warming the atmosphere.

    • Entropic man says:

      “No one has proved scientifically at any time that CO2 is warming the atmosphere. ”

      Actually they have. Unfortunately the proof is beyond your limited understanding.

    • Norman says:

      Gordon Robertson

      What Tyndall said about solar flux was correct than (based upon actual evidence, something that you do not like, you only want absurd theories from conspiracy theorists…you think Gary Novak, is a credible information source…he is not!) as it is now.

      Here:
      https://www.fondriest.com/environmental-measurements/parameters/weather/photosynthetically-active-radiation/#:~:text=The%20three%20relevant%20bands%2C%20or,of%20the%20total%20solar%20radiation.

      Infrared comprises 49.4% of Solar flux while visible makes up 42.3%.

      Maybe you should ask Gary Novak about this issue, I am sure he will tell you something that you will believe.

      • Gordon Robertson says:

        norman…”Infrared comprises 49.4% of Solar flux while visible makes up 42.3%”.

        ***

        I was aware of the amount of IR vs visible and that’s not what I was talking about. I was talking about the INTENSITY of each, which Tyndall was referencing.

        EM intensities from UV and above are far more intense than anything emitted below red in the spectrum. Tyndall was claiming the hidden IR radiation was more intense than the visible, which is wrong.

        The relationship between intensity and frequency can be expressed as E = hf. However, that led to the ultraviolet catastrophe which Planck got around by fudging the response curve to peak in the region of yellow/green light frequencies.

        Planck reasoned there would be less of the more intense frequencies than those at frequencies below yellow/green frequencies and he built an exponential function into his equation to force a drop off in the solar spectrum after the Y/G peak.

        That solved the E = hf conundrum but it is misleading in that it gives the impression that UV frequencies are not as intense as visible light frequencies at the Y/G peak.

        Anyone knows that UV and beyond is far more intense than IR and below, in the solar spectrum. As I said, no one ever got their skin burned by solar IR. UV is generated by much higher energy sources than IR.

  48. gbaikie says:

    Mining lunar water:
    https://theconversation.com/mining-the-moons-water-will-require-a-massive-infrastructure-investment-but-should-we-117883

    An interesting article, but wrong:
    “So, what is being proposed is to mine a precious and finite resource and burn it, just like we have been doing with petroleum and natural gas on Earth. ”

    “Let us not keep repeating the same unsustainable mistakes we have made on Earth we have a chance to get it right as we spread into the solar system.”

    The moon probably has very small amount to water [compared to Earth or Mars] you should use it all [if you can].
    The moon is not like Earth. Earth is limited energy, space has unlimited energy.

    In simple terms, the Moon might have say 1 billion tonnes of water.
    Or 1 trillion kg of water. If lunar sells at $10 per kg- 10 trillion dollar {gross] of water.
    Lunar water is like oil or natural gas, it’s a small part of the economy. If you could sell 10 trillion dollars of lunar water, you need a lunar market. If sell the water at $100 per kg, it doesn’t make a larger lunar market simply because, it totals 100 trillion dollars, instead the lunar market will be smaller if water cost $100 rather than $10 per kg.
    Space has many Earth oceans of water. You use every bit of lunar water and end up with trillions of tons of water on the Moon.
    The true value of lunar water is that it a way start a market for water in space.
    But first one needs the moon to have mineable water. If Moon doesn’t have mineable water, there are other ways to start market for water in space.
    For the moon to be a “superpower” it needs get stuff off the Moon without using rocket fuel- you want to get to the point using lunar mass drivers and thereby lower lunar launch cost to far less than $1 per kg of payload. Or the energy used to launch is electrical power and it’s quite possible that electrical power on the Moon could become less than electrical power on Earth.
    Solar power on Earth doesn’t work, but lunar solar can cheaper than using coal power on Earth. But to get to this point, you need a market [large market] for electrical power on the Moon.
    If lunar water is mineable, then this make electrical market on the Moon- or you converting lunar water into chemical energy [rocket fuel].
    So if cost of lunar electricity can brought down to cost of electrical power on earth within shortest period of time- this mean Space power satellite for the Earth’s surface. And also mean SPS for Mars- if the Martians don’t already have them.
    NASA job, is to explore the Moon and then Mars. And if there mineable water on either or both, Mars or Moon. It lower launch cost on the Moon and/or Mars.
    NASA’s obsessive has been to lower Earth launch cost, it do it, by exploring the Moon and Mars. If can lower Mars or Moon launch cost, you lower Earth, Moon, and Mars launch costs. And then NASA can explore solar system and the universe.

  49. Mike Shearn says:

    A very interesting article. I’ve always wondered that if carbon dioxide really is a “well-mixed” gas that seasonal variations due to plant growth should make their way to a relatively remote island in the Pacific. It isn’t like Hawaii itself is prone to large seasonal variations, so it must come from elsewhere.

    Furthermore, it is difficult to believe that the rate of change of photosynthesis goes negative in late spring, just to remain fairly steady until the autumn.

    I think it far more likely that the major influence on the CO2 fluctuation is the fact that about only about 1/3 of the land surface of the earth is in the Southern Hemisphere, including Antarctica, and so the out-gassing surface is greater, and that there would be a time lag before Mauna Loa would be able to notice.

    • Entropic man says:

      Mike

      I wrote this for Chic Bowdrie upthread.

      It helps answer your guestion.

      Entropic man says:
      April 14, 2022 at 12:08 PM
      Chic Bowdrie

      The chemical reactions for photosynthesis and respiration are balanced. But do you have any data to support your claim that they cancel out on a global yearly basis?

      Yes.

      Look at the Keeling Curve.

      https://keelingcurve.ucsd.edu

      The curve shows two patterns.

      There is a long term trend, an increase in concentration of about 2ppm/year Which is new CO2 entering the system.

      There is also an annual cycle. You see a minimum in October. The concentration then increases by 10ppm to a peak in March and then decreases again.

      The cycle follows the Northern Hemisphere growing season.

      This is because the majority of Earths biomass is on land in the Northern Hemisphere.

      From March to October there is globally more photosynthesis than respiration and there is a net decrease in CO2 of 10 ppm. From October to March there is more respiration than photosynthesis and a net increase in CO2 concentration of 10 ppm.

      Since the cycle returns to its original value each year any contribution to increasing CO2 will be small.

      Both sceptics and NASA agree that the planet is greening, ie that the amount of biomass is increasing and the biosphere is a net absorber of CO2 from the atmosphere. Do the numbers and the biosphere is absorbing the equivalent of 1 ppm/year.

      • Mike Shearn says:

        Hi Entropic man,

        Thanks for the reply.

        I’ve had the Keeling curve bookmarked for a good long time, and the correlation of annual cycle with the growing season in the Northern Hemisphere is familiar to me and, of course, is noticeable. It is certainly a major cause.

        What has always jumped out at me is just how straight the line segments from high to low and back again are. I really need to crunch numbers and stop relying on my eye.

        I do think that out-gassing is underestimated in general, particularly in analysis of ice cores, etc., because of what it implies for cause and effect of warming in general…the third rail if you will.

    • Chic Bowdrie says:

      Mike,

      This was my response to E man upthread:

      https://www.drroyspencer.com/2022/04/explaining-mauna-loa-co2-increases-with-anthropogenic-and-natural-influences/#comment-1244377

      He has no numbers that will definitively indicate how much CO2 remaining in the atmosphere each year is from fossil fuel emissions or new emissions exceeding previous years. His hands must be very sore.

        • Willard says:

          But where’s the evidence for all the things we know nothing about, EM?

        • Entropic man says:

          Chic

          I think you’ve fallen into the same trap as Ed Berry. You’ve created a model which tells you what you want to hear, rather than what you need to know.

          • Chic Bowdrie says:

            And I think you have no idea what you are talking about. Let me know when the coin drops.

          • Gordon Robertson says:

            Oh, good, you’ve figured Entropic out.

          • Willard says:

            C’mon, Gordo.

            Do you have any evidence that you know what EM’s talking about?

          • stephen p anderson says:

            Eman,

            So, why can’t a plant photosynthesize a fossil fuel CO2 molecule? Why do commercial greenhouses concentrate CO2 with fossil fuel CO2 molecules?

          • Entropic man says:

            stephen p anderson says:
            April 15, 2022 at 6:28 AM
            Eman,

            “So, why cant a plant photosynthesize a fossil fuel CO2 molecule? Why do commercial greenhouses concentrate CO2 with fossil fuel CO2 molecules? ”

            Plants can photosynthesis fossil fuel derived CO2.

            Once released into the atmosphere all CO2 molecules behave in the same way.

            Commercial greenhouses use CO2 produced as a byproduct of the Haber process.

            If you remember methane is reacted with oxygen to produce hydrogen and CO2. The CO2 is separated out by cooling until it condenses and the hydrogen is reacted with nitrogen to produce ammonia.

            https://en.m.wikipedia.org/wiki/Haber_process

          • Entropic man says:

            Willard says:
            April 14, 2022 at 8:02 PM
            Cmon, Gordo.

            “Do you have any evidence that you know what EMs talking about? ”

            No. He’s just armchair grandstanding like Chic and Stephen.

            It’s even ironic. Since biology is the application of other sciences to living organisms I perforce had to learn physical chemistry.

            These armchair grandstanders never had to learn biology, and it shows.

          • Chic Bowdrie says:

            https://www.drroyspencer.com/2022/04/explaining-mauna-loa-co2-increases-with-anthropogenic-and-natural-influences/#comment-1241741

            “I perforce had to learn physical chemistry.”

            Seems you haven’t learned much. I cannot take you seriously anymore.

          • Entropic man says:

            You shouldnt take me seriously. I’m here for the entertainment.

            Where else could I watch Gordon Robertson and Stephen Anderson so laughably misusing the Ideal Gas Law?

            Where else can I watch a man with so little understanding of the carbon cycle trying to model it?

            However, take my science seriously. Everything I write is backed up by the literature.

          • stephen p anderson says:

            Eman,
            You’re such an expert on everything, amazing. How many commercial greenhouses have you been in? It’s a real simple process. You sure like quoting Keeling Curve which isn’t an explanation for anything. So now that you understand that plants can photosynthesize CO2 molecules of any source and that absorp.tion is described by the IGL and Henry’s Law of partial pressures, your statement that photosynthesis and respiration are balanced is meaningless?

          • Entropic man says:

            Stephen

            Do you realise how absurd you sound?

          • Clint R says:

            Ent claims that everything he writes “is backed up by the literature.”

            That’s FALSE. He’s the one that religiously writes that passenger jets fly backwards.

            He’s such a phony.

            And if he REALLY understood photosynthesis, he would know the process can NOT be explained by evolution.

          • Willard says:

            Ah, the good ol’ days:

            [CHIC] Another approach is to test the cornerstone assumption that additional CO2 will have any further effect on the global average temperature. I have not found sufficient support for the latter.

            [AT] Then you’re not looking hard enough.

            https://andthentheresphysics.wordpress.com/2016/02/15/the-greenhouse-effect-an-illustration/#comment-72901

          • Willard, please stop trolling.

  50. Let’s demonstrate the Planet Surface Rotational Warming Phenomenon on the:
    Earth’s /Moon’s example

    Earth is on average warmer 68C than Moon.

    N = 1 rotation /per day, is Earths sidereal rotation spin
    cp.earth = 1 cal/gr*oC, it is because Earth has a vast ocean. Generally speaking almost the whole Earths surface is wet.

    Earth is on average warmer than Moon not only because of the Earth having 29,53 times faster rotational spin.

    Earth also has a five (5) times higher average surface specific heat (for Earth cp.earth = 1 cal/gr*oC, it is because Earth has a vast ocean; and for Moon cp.moon = 0,19cal/gr*oC its soil is a dry regolith).

    Earth is warmer than Moon not because of Earth’s very thin atmosphere trace greenhouse gasses content. Earth is warmer because its surface has 155,42 times higher the (N*cp) product than Moons surface.

    Earth(N*cp) /Moon(N*cp) = (29,53/1)*(1/0,19) = 155,42

    If Moon had Earth’s albedo (a=0,306), Moon’s mean surface temperature would have been 210K.

    As we know, Earth’s mean surface temperature is 288K. Earth is warmer because its surface has 155,42 times higher the (N*cp) product than Moons surface.

    Let’s compare the Earth’s and Moon’s (for equal average Albedo) the mean surface temperatures:
    Tmean.earth /Tmean.moon = 288K /210K = 1,3714
    and the Earth’s and Moon’s (N*cp) products sixteenth root:
    [ Earth(N*cp) /Moon(N*cp) ]^1/16 = (155,42)^1/16 = 1,3709

    The results (1,3714) and (1,3709) are almost identical!
    It is a demonstration of the Planet Surface Rotational Warming Phenomenon:

    Planets’ mean surface temperatures relate (everything else equals) as their (N*cp) products’ sixteenth root.

    The 4th root powers twice
    The 4th root powers twice is an observed the Rotational Warming (N*cp) in sixteenth root power phenomenon when planet mean surface temperatures comparison ratios with the coefficients is compared.
    Please also visit the page Earth/Mars 288K/210K
    Link: https://www.cristos-vournas.com/445868922

    The entire thread there is devoted to the planets mean surface temperatures comparison. And every time for the compared planets the (N*cp) in sixteenth root is necessarily present.

    https://www.cristos-vournas.com

  51. Ireneusz Palmowski says:

    Snow totals top 40 inches as April blizzard blasts northern US
    Hundreds of miles of roads were shut down, ranchers and their animals faced brutal conditions — and will see more tough weather ahead. Meanwhile, snowdrifts in some spots were estimated to be higher than 10 feet in some places.
    https://www.accuweather.com/en/winter-weather/april-blizzard-hits-north-dakota-and-montana/1172294?utm_campaign=AccuWeather&utm_medium=social&utm_source=facebook&fbclid=IwAR3e_wN2szqj3I2YiqiUZQUET43KmscviiMkxls7w98Cd3EM8dWlrWrJ2b0

    • TYSON MCGUFFIN says:

      Meh! You’re not from these parts are you?

      Songs have been written about this… https://youtu.be/-0OLOvP8zpY

      • Gordon Robertson says:

        maguff tries to divert from the message of super cold weather in an allegedly warming climate, wherever the climate in question may be.

        • Willard says:

          C’mon, Gordo:

          Following a record-warm December, the atmosphere seemed to remember in January that it was supposed to be winter in the United States. As detailed in the January climate summary from NOAA National Centers for Environmental Information, a series of storms brought significant snowfall to different parts of the East: a January 4 event that reached as far south as Arkansas, a January 16-17 event that blanketed areas from the Southern Appalachians to Maine, and a powerful nor’easter at the end of the month that left at least 100,000 resident of the Mid-Atlantic and Northeast without power.

          All that storminess contributed to making January 2022 the coldest January since 2014, according to the Centers’ monthly report. But what counts as a cool January has changed over time. The average temperature for the contiguous United States was 31.0F, which is 0.9F warmer than the 20th-century average. Alaska temperatures were warmer than average, but not extremely so: the average temperature of 3.9˚ F falls into the middle third of the state’s historical record.

          https://www.climate.gov/news-features/features/us-climate-summary-january-2022

          Read harder.

        • TYSON MCGUFFIN says:

          Gordon Robertson at 6:06 PM

          Weather is the totality of atmospheric conditions at any particular place and time – the instantaneous state of the atmosphere and especially those elements of it which directly affect living things.

          The elements of the weather are such things as temperature, atmospheric pressure, humidity, cloudiness, precipitation, sunshine, wind, visibility, considered separately.

          Spells of weather are recognized by the continuance of some type, or repetitive sequence, of weather over several days or weeks at a time. It is convenient to distinguish short spells (or “runs of weather”) lasting just a few days and long spells lasting several weeks (apart from trivial interruptions of not more than three days).

          This concludes today’s public service announcement!

        • Willard, Tyson, please stop trolling.

  52. Ireneusz Palmowski says:

    Snow and frost will bring severe conditions to the northern US. Snowfall continues in North Dakota and will move over the Great Lakes overnight.
    https://i.ibb.co/7kgbP0h/gfs-hgt-trop-NA-f036.png

    • Gordon Robertson says:

      They started out predicting a mild ice cover on the Great Lakes in January and had to revise it quickly in February. Wonder what it looks like now? Should be melting by now but I guess this cold was predicted by global warming theory. [Sarc /off]

    • Ken says:

      What is the weather station doing here without a scantily clad bleached blonde shaking her booty at me?

  53. Gordon Robertson says:

    entropic …”[GR]..No one has proved scientifically at any time that CO2 is warming the atmosphere.

    [ENT]Actually they have. Unfortunately the proof is beyond your limited understanding.

    ***

    Try me!!! If you have scientific evidence that is not hearsay, based on the opinions of 19th century scientists, correlation based on laboratory experiments, the propaganda of the IPCC, or directly verifiable in the atmosphere, let’s hear it.

    I am looking for scientific evidence, based on the scientific method, that can be independently verified.

    • Entropic man says:

      You live in Vancouver?

      You would probably benefit from seeing the evidence for yourself.

      May I suggest that you contact the Physics Department at the University of British Columbia.

      https://phas.ubc.ca

      https://phas.ubc.ca/contact-us

      They do physics demonstrations. Ask them to set up a gas cell and show you the IF absorb.tion and reemission of different concentrations of CO2.

  54. Gordon Robertson says:

    entropic…”But why is surface temperature increasing while the Sun is cooling?”

    ***

    It’s re-warming from the Little Ice Age, when something apparently affected solar output from the Sun or solar input to the Earth.

    • Entropic man says:

      “something”

      Can you be more specific.

      The changes in Earth’s orbit were already cooling us towards the next glacial cycle at -0.1C/millennium.

      Your hypothesis would predict that something accelerated the cooling for six centuries and then recovered to the original -0.1C/millennium cooling rate.

      Instead we are warming at 0.2C/decade. That is an enormous overshoot on the “recovery from the LIA” one would expect.

  55. Gordon Robertson says:

    norman…”On Tyndall. I pulled up the information not to convince you about the GHE, it was to demonstrate that the claim Tyndall said trace gases had no effect was false”.

    ***

    Tyndall did not prove they had an effect, he said they probably had a 10 to 15% effect. I have never claimed they have zero effect, but using the Ideal Gas Law, I estimated an effect at about 0.04C warming per 1C warming from other sources.

    In climate models, the warming effect of CO2 is rated at 9 – 25%. All they have done is take Tyndall’s guess and expand it based on the amount of WV in the air. Neither have supplied scientific proof that CO2 has any such capability in the atmosphere.

  56. gbaikie says:

    “The average global temperature during the period known as the Last Glacial Maximum from roughly 23,000 to 19,000 years ago was about 46 degrees Fahrenheit (7.8 degrees Celsius), some 13 degrees Fahrenheit (7 Celsius) colder than 2019, the researchers said.”

    What is interesting is that Alaska was not entirely covered with ice, Tierney said. There was an ice-free corridor that allowed humans to travel across the Bering Strait, into Alaska. Central Alaska was actually not that much colder than today, so for Ice Age humans it might have been a relatively nice place to settle.”
    https://www.weforum.org/agenda/2020/09/last-ice-age-global-temperature-scientist-predict/

    Central Alaska was nice place to live in these coldest 4000 years.
    It seems that Central Alaska is fairly dry these days, I wonder if it
    was wetter during those 4000 years.

  57. gbaikie says:

    “Last Saturday, at a workshop organized by the Foundation Questions Institute, Nobel laureate physicist Gerard ‘t Hooft gave a few informal remarks on the deep nature of reality. Searching for an analogy to the symmetries of basic physics, he asked the attendees to imagine what would happen to our solar system if you suddenly swapped Earth and Mars. He went on to discuss his ideas for explaining quantum mechanics, but I couldn’t get my mind off his question. What would happen?”
    https://blogs.scientificamerican.com/observations/what-would-happen-if-earth-and-mars-switched-places/

    “Obviously, Martians would be delighted with the new arrangement. A fairly modest increase in Mars’s temperature would melt the polar caps and liberate gases from the soil, flipping the Martian climate into a new, cozier state nearly as warm as Earth.

    Earthlings would get the short end of the deal. Sunlight would be half as intense and the planet would freeze over. On the plus side, we’d instantly be half as many years old.”

    Well, I would think Mars would be hellish.
    But it seems greenhouse effect theory would say it’s average temperature would be -18 C.
    It seems one could have a constant global dust storm.
    But it seems one get rid of dust and the CO2 if added enough ocean.

    With land a noon sun would heat it to 120 C.
    Due to lack pressure the ocean would boil at low temperature. But the boiling ocean would create air pressure of water vapor.
    It seems only way it works is if add 1 or 2 psi of oxygen, but that many trillions of tonnes of oxygen.
    Otherwise, Mars is better where it is.

  58. TYSON MCGUFFIN says:

    James Webb telescope’s coldest instrument reaches operating temperature:

    NASA’s James Webb Space Telescope will see the first galaxies to form after the Big Bang, but to do that, its instruments first need to get cold – really cold. On April 7, Webb’s Mid-Infrared Instrument (MIRI) – a joint development by NASA and ESA (European Space Agency) – reached its final operating temperature.

    Along with Webb’s three other instruments, MIRI initially cooled off in the shade of Webb’s tennis-court-size sunshield, dropping to about 90 Kelvin. But dropping to 6.4 Kelvin required an electrically powered cryocooler.

    The low temperature is necessary because all four of Webb’s instruments detect infrared light wavelengths slightly longer than those that human eyes can see. Distant galaxies and planets outside our solar system all emit infrared light. But so do other warm objects, including Webb’s own electronics and optics hardware. Cooling down the four instruments’ detectors and the surrounding hardware suppresses those infrared emissions. MIRI detects longer infrared wavelengths than the other three instruments, which means it needs to be even colder.

  59. CO2isLife says:

    “It takes 10 years and 22 ppm for CO2 to amass just 0.2 W/m in total surface energy flux. In contrast, short-wave cloud radiative forcing fluctuations vary in amplitude by 300 W/m within hours.”
    https://notrickszone.com/2022/04/14/2-more-new-studies-reaffirm-the-co2-drives-climate-change-paradigm-has-a-magnitude-problem/

    I’ve been saying that for years. A single cloudy day or El Nino can wipe out 10s if not 100s of years of energy back radiation of CO2. CO2 is simply an insignificant variable when it comes to the climate. Its input shows a log decay. Focusing on CO2 is like a nutritionist claiming the number of glasses of water a person drinks is responsible for the weightloss after the person eats 3 meals a day at McDonalds. CO2 backradiation is a rate, a very low rate of energy application. Simply calculate the amount of energy released by an El Nino and then calculate out how long 0.9 W/M^2 is required to replace the lost energy. CO2 is a minimal joke. The example I give is a giant tipping bucket at a water park. CO2 is like filling it with a garden hose when there are giant fire hoses representing the sun and clouds that are also filling it. El Nino’s are the tipping of the bucket, releasing energy so there will never be catastrophic warming, but the Sun and Cloud firehoses refill the bucket, not the CO2 gardenhose.

    • Willard says:

      Once again RK relies on tools who don’t do the reading to promote his crap:

      An energy imbalance, or residual, of 20% is not uncommon with a 30 min averaging period (Grachev et al., 2020) considering the canopy energy storage term is not included nor is sampling uncertainty.

      Srsly.

    • Gordon Robertson says:

      co2…quote from another source…”It takes 10 years and 22 ppm for CO2 to amass just 0.2 W/m in total surface energy flux. In contrast, short-wave cloud radiative forcing fluctuations vary in amplitude by 300 W/m within hours.

      ***

      Neither one of those EM sources will warm the surface if the temperature of the source is colder than the surface.

      I hope no one seriously thinks that radiation from clouds are going to warm you on a cloudy day.

  60. RLH says:

    There appears to be some confusion as to what the frequency response is for low (high) pass and notch filters.

    Low pass includes the gaussian ones I use, S-G and LOWESS. They all exhibit what would best be described as a sigmoid function frequency output (strictly the inverse of it for low pass).

    https://en.wikipedia.org/wiki/Sigmoid_function

    Notch filters are those with a normal frequency distribution

    https://en.wikipedia.org/wiki/Normal_distribution#/media/File:Normal_Distribution_PDF.svg

    These are often to be found in wavelet analysis or anything else to do with pure sinewave decompositions.

    At the limit (infinity or greater than the length of data available) then low pass approaches a linear OLS trend, but nothing in nature is a straight line or approaches infinity. This also tends to lead to ‘cherry picking’ of the start/end dates which is why it is depreciated for quasi-sinusoidal data.

    • RLH says:

      “the inverse of it for low pass”

      If frequency is as is normally shown with low frequencies to the left and high frequencies to the right.

    • Gordon Robertson says:

      rlh…”There appears to be some confusion as to what the frequency response is for low (high) pass and notch filters”.

      ***

      From an electronics perspective, there are two basic types of filters, bandpass and band-reject.

      Band refers to a range of frequencies, that when applied to a sinusoidal waveform, cover a certain range of frequencies of that sine wave signal. For example, the range of audio signals is defined as 20 hz to 20,000 hz. A band may be defined as 1000 hz(1Khz) to 5Khz.

      If I wanted a bandpass filter, I would design it with a centre frequency at maybe 3Khz, and it would pass frequencies from 1 Khz to 5 Khz while rejecting the rest of the audio spectrum.

      Of course, no electronic filter is perfect so the edges of the bandpass are defined as being 3 db below the peak at 3 Khz. The 3 dB is a reduction in power of 1/2 or a roll-off of power.

      A high pass filter would be set up to pass frequencies beyond say 5 Khz and reject those below that figure. A low pass filter would pass frequencies below maybe 200Hz while rejecting those above 200 HZ. In practical application, one does not want to completely reject frequencies above or below a certain frequency but to attenuate them to various degrees.

      A notch filter is used to reject frequencies around a specific frequency. If I applied a notch filter at 1 Khz, it would reject all frequencies around 1 Khz while passing all frequencies in a certain range around 1 Khz. There is no such thing as a filter that will notch 1 Khz only.

      A notch filter is used as part of a parametric equalizer, which can be adjusted to a certain frequency where a notch is applied based on its amplitude of attenuation. If I had several tracks of music recorded and I needed to create space for a vocal, I would tune the parametric to the range where the voice was expected and reduce the amplitude of other signals to make room for the voice. I don’t want to eliminate those frequencies but attenuate them slightly.

      That’s a notch in the frequency spectrum. It would not be a sharp notch since it must allow for a range of notes fundamentals from the vocalist while allowing the underlying instruments to be heard.

      Frequency response as applied to a filter describes the width of the band affected but its not actually a frequency response but a frequency attenuation. The response in ‘frequency response’ refers to the amount of amplification by an amplifier. It refers to how much an amplifier amplifies each cycle in the audio spectrum.

      Most filters can only attenuate, like a sophisticated tone control. There are filters that can amplify as well. As I described earlier, the filter does not attenuate with a flat response over a range of frequencies, its attenuation ‘rolls off’ from a centre frequency at so many dB per octave.

      An octave is a doubling of frequency. The note A above middle-C on a piano is at 440 hz. The note an octave higher would be another A at 880 hz. If you have a roll-off at 3 dB/octave, it means, for a filter set at 880 hz, it would be half the power at 440 Hz and at 1760 hz.

      Of course, some filters allow the roll-off to be adjusted to say 6 dB/octave or greater to steepen the attenuation.

      Nothing is perfect in the real world of filters, however, since they introduce phase distortion. If they are used in statistics, I would suspect similar distortions.

    • Gordon Robertson says:

      rlh…”This also tends to lead to cherry picking of the start/end dates which is why it is depreciated for quasi-sinusoidal data”.

      ***

      This is why I am suspicious of any data that is blindly number-crunched using purely statistical analysis without a good understanding of what the data means physically.

      For example, a person number-crunching the UAH data from 1979 – present would completely miss the flat trend from 1998 – 2015. Or the developing flat trend from 2016 onward.

      • RLH says:

        “there are two basic types of filters, bandpass and band-reject”

        In the digital domain they are the same thing. You can turn one into the other by subtracting just it from the original signal.

        Both together are the original signal. Subtract the bandpass and you get the stop band and vice versa. No losses as this is digital.

      • RLH says:

        Low pass is not the same as bandpass. One is a sigmoid function, the other is not.

        • Gordon Robertson says:

          I explained in my novella that a bandpass requires attenuated frequencies on either side. A low pass has attenuated frequencies above it and a high pass has rejected frequencies below it.

          The only difference between bandpass and band-reject is that one passes a band of frequencies and the other rejects them.

          In an AM radio receiver, an FM radio receiver, or a TV receiver, there is a row of filters called an intermediate frequency bandpass filter. When a range of signals is received at an antenna, they are beat with a local oscillator between one of the incoming signals to produce a lower intermediate frequency.

          For an FM radio, the IF is 10.7 Mhz (455 Khz for AM), for example. It is desirable to remove all signal associated with the IF within a certain bandwidth so the signal is passed through a series (about 2) of bandpass filters set to a certain bandwidth. If you view the signal on an oscilloscope, it looks similar to a bell curve, centred at 10.7 Mhz for an FM receiver.

          If we wanted to reject the 10.7 Mhz signal, we would use a filter to reject it in a bell-shaped curve while passing all other frequencies around it.

          That would not be the same as a low pass or high pass unless the band you were rejecting or passing was the entire band below or above the centre frequency.

          That is essentially the only difference between low pass, high pass, and bandpass in electronics. The bandpass passes frequencies either side of a centre frequency whereas the low pass and high pass pass frequencies below or above a centre frequency only. A band-reject would not pass frequencies at a centre frequency but all frequencies around it.

          In logic terms you could say a band-reject is NOT bandpass. No pun intended.

  61. stephen p anderson says:

    The Global Elite looks at Eman, Chihuahua, Norman, Nate, and the rest of the sycophants and thinks, “Useful Idiots.”

  62. gbaikie says:

    The Industrial Revolution lowered CO2 emission.
    A significant aspect of Industrial Revolution was to increase energy efficiency.
    And major factor which increased CO2 emission is poor governing.
    Governments are wasteful and inefficient.
    Governments have not lowered CO2 emission.
    Governments create poverty and have not done anything lower poverty.
    Government say they do things, and they don’t.

    If one wanted to lower CO2 emission, one would make more nuclear reactors, government made less nuclear reactors.
    Governments governing of nuclear reactors has been a train wreck.
    Politicians are mostly idiots managed by “special interests” and don’t represent the people they govern.
    The UN is cesspool of corruption.
    NASA is train wreck, but compared other governmental bodies, it’s shining city on the hill.
    The most massive thing governments screw up is education- public education has not worked, and has never worked, and it’s not getting better. Children are sent to prison and are brainwashed, badly. Trillions of dollars are thrown away in system that prevents education.

    • Willard says:

      > public education has not worked, and has never worked

      Well, actually:

      https://www.cgdev.org/blog/review-decade-ten-trends-global-education

      • stephen p anderson says:

        Chihuahua links a very objective organization, NOT! Surprise, surprise.

        • gbaikie says:

          Critical thinking not included with Willy.

          • Willard says:

            Guy whose guru is teh Dilbert haz strong words.

          • gbaikie says:

            “Guy whose guru is teh Dilbert haz strong words.”

            Scott’s amusing like Jon Steward used to be.
            Scott thinks global warming is serious problem.
            Thinks some new invention could suck out the CO2 in atmosphere.
            He doesn’t know that we living in a icehouse climate

          • gbaikie says:

            “Climate Science Challenge. Find a scientist — just one — who says the climate prediction models are credible”

            They are not credible.

            But they aren’t predictions, either, they are projections, according the IPCC which is issuing them.
            If there is a credible one, which one is it?
            But first you should perhaps inform the IPCC, which one is credible-
            because they need to know.

            No one can predict the future of global climate, except me:

            We are cold, and will remain cold for more than 100 years.
            [How long do you want me to predict?]

            But I can’t predict the weather.
            Instead I will look at weather forecasts.
            And when people think about global climate, they think it’s about the summation of weather.
            [And predicting weather for more than 1 week is not very credible.]

            But Earth’s global climate is actually an icehouse global climate.
            As everyone, knows, and no one argues, that we are not in an Ice Age. It was taught in elementary school.

            Scott in general is very skeptical of any and all models of anything, as is anyone, who is vaguely familiar with any models of anything.

            But apparently Scott thinks there are meant to be predictions [because foolish reporters say they are].
            Anyhow, Tony Heller did not convince Scott Adams.

            And Tony Heller hasn’t convince me, either.
            But Tony Heller could guess what Venus temperature was at Earth distance, I would very much like to listen to his opinion.

          • Willard says:

            Rope-a-doping won’t help you here, gb.

            Keep that for your science-fiction threads.

        • Willard says:

          Troglodyte’s solution to reduce global poverty and improve lives –

          LESS TAXES

          • gbaikie says:

            Less taxes rather than more taxes, would obviously be better.

            But school choice particularly for lower income families, would
            be better, than lower taxes.

          • Willard says:

            So you say, gb, so you say.

          • stephen p anderson says:

            The Chihuahua believes in government. He’s a gubment man.

          • Willard says:

            Troglodyte believes in Sierra Leone, but he won’t live there.

          • stephen p anderson says:

            That must be uncomfortable?

          • Willard says:

            There might be too much gubmint over there, Troglodyte.

            How about Antarctica?

          • gbaikie says:

            “The Chihuahua believes in government. Hes a gubment man.”

            Hmm, that’s interesting.
            Can you imagine being a gubment man and having Trump the Destructor, being the US president?
            Never considered it before.
            I guess, I tend to think of gubment men as being conservative.
            Sort why, I don’t support Republicans- having this insane idea that
            one shouldn’t “improve government”.
            So, don’t understand, that US has been working towards being a republic, so Republican need to improve the so called republic. Not freeze the ugly monster into impossible status quo.

            Or why think it would good if we could live on Mars- improve government- not just on Mars, but also governments on Earth.
            I am happy on Earth, but other people want to get off this rock.

    • gbaikie says:

      Though South Korea government gets a passing grade in terms of nuclear power

  63. Norman says:

    Gordon Robertson

    Since you are prone to believing lies like those coming from the mouth of vile Putin (a serial killer with an army backing him up so he can ruthlessly kill innocent people).

    You accept his garbage about protecting Russians and being pinched in by NATO.

    Read this and wake up. Putin is a liar and evil. He is the NAZI among them not Ukraine.

    https://encyclopedia.ushmm.org/content/en/article/invasion-of-poland-fall-1939#:~:text=Invasion%20and%20Partition%20of%20Poland,to%20encircle%20and%20dismember%20Germany.

    Vile lying Putin is pulling a page straight from the NAZI’s to justify his evil invasion of Ukraine and you swallow his lies and deceptions. You can’t see him as a vile and evil human that needs to be contained.

    You will believe the liars and conmen the rest of your life. I do not know why you find lies and deception so admirable.

    Go Ukraine!!

    • Clint R says:

      Norman, since you have so much time to rant against vile liying, did you ever find your “textbook” verification that two 315 W/m^2 fluxes arriving a surface will heat it to 325K?

      Remember, you ALWAYS support your claims.

      • Norman says:

        Clint R (Bot)

        The return of the program. Nothing new, just the same old routine over and over. I have already addressed this, your program does not understand logical thought so it ignores what is posted. Yet the routine resurfaces to repeat again and again.

        Clint R programmer, please add some new routines to your programmed Bot.

        • Clint R says:

          Actually Norman, you only believe you’ve “addressed” it. But that’s not reality.

          If you really had a source, you would be anxiously presenting it. But, you don’t have anything credible verifying fluxes simply add. You can’t support what you claim. You just make things up.

          • Willard says:

            You know, Pup, every time you suggest that flux is a non-additive measure you make me smile. The more you keep a straight face, the funnier it gets.

            It’s as if you were the Buster Keaton of the Dragon Cranks.

          • Clint R says:

            You’re late again, worthless Willard.

            We need some better stalkers.

    • Gordon Robertson says:

      norman…”Vile lying Putin is pulling a page straight from the NAZIs to justify his evil invasion of Ukraine…”

      ***

      Normie, you suffer from terminal naivete. Are you not aware that western Ukraine supplied divisions to the Nazis, like the Waffen-SS Galicia?. They committed war crimes right along with the Nazis, culminating in the mass slaughter of 40,000+ Jews at Babi Yar, a ravine outside Kiev.

      https://en.wikipedia.org/wiki/Babi_Yar

      There are factions, like the Svoboda Party, in the Ukraine parliament, who are supportive of those Ukrainian collaborators, like Stepan Bandera, wanted at Nuremberg for war crimes. The leader of Svoboda, Oleh Tyagnibok, applauded Ukrainians who fought against the Jews and ‘other scum’ in WW II.

      Shake your head, Norman, this guy is talking about the Allies.

      https://en.wikipedia.org/wiki/Oleh_Tyahnybok

      Any Ukrainians fighting against he Nazis fought alongside the Russians, who were our allies. Without them we would likely never have won the war.

      https://en.wikipedia.org/wiki/Ukrainian_collaboration_with_Nazi_Germany

      Clue in, for cripes sake.

      • Willard says:

        C’mon, Gordo.

        You clue in –

        The GermanSoviet military parade in Brest-Litovsk (German: Deutsch-sowjetische Siegesparade in Brest-Litowsk, Russian: Совместный парад вермахта и РККА в Бресте) was an official ceremony held by the troops of Nazi Germany and the Soviet Union on September 22, 1939, during the invasion of Poland in the city of Brest-Litovsk (Polish: Brześć nad Bugiem or Brześć Litewski, then in the Second Polish Republic, now Brest in Belarus). It marked the withdrawal of German troops to the demarcation line secretly agreed to in the MolotovRibbentrop Pact, and the handover of the city and its fortress to the Soviet Red Army.

        https://en.wikipedia.org/wiki/German%E2%80%93Soviet_military_parade_in_Brest-Litovsk

        • Gordon Robertson says:

          What does your link have to do with anything I posted about Ukrainian collaborators who fought with the Nazis and who are regarded by some modern Ukrainian idiots as heroes?

          Hope you’re not a Holocaust denier. I posted a link to Babi Yar where over 40,000 Jews were systematically murdered outside Kyiv. Ukrainian Nazi sympathizers joined in the massacre and those are the creeps the Ukrainian fascist elements today are honouring as war heroes.

          There are politicians sitting in the Ukrainian parliament today as members of the Svoboda Party who have denounced the Jews that were murdered, with reference to those fighting on their behalf as scum.

          Get your head out of the sand. This can be corroborated easily on the Net by reliable sources.

          • Willard says:

            C’mon, Gordo –

            Even you can see that my link establishes that Russia collaborated with Nazis too. Even you could have made the connection.

            Now, my turn. How is your “But Nazis” canard relevant to the discussion, except for you to regurgitate Russian propaganda?

            Here, have another cookie:

            https://imgur.com/JklAmAX

            At least they’re not raping men, right?

      • Norman says:

        Gordon Robertson

        Yes there was much evil done by the NAZIS, none of this justifies Putin’s evil ruthless tactics. As the Lithuanian President stated, Putin’s crimes are even worse than the NAZIs of which you are against. If you find NAZI evil than at least see Putin is doing the same with innocent Ukrainians. He is destroying whole cities with endless bombing. Putin is just evil and needs to be stopped. I do not understand how you can support his horrible human. There is zero justification for what he is doing.

        • Gordon Robertson says:

          I am not talking about justifying anything. Any time innocent people get killed it’s evil. But why are you so focused on Putin’s evil and ignoring the blatant evil of the Ukrainian government in suppressing a revolt by Ukrainians in eastern Ukraine who identify with Russians?

          The Ukraine is not innocent, there are some seriously evil SOB’s running amok in the country.

          Is it OK with you that a democratically-elected pro-Russian president was ousted in a coup just because he’s pro-Russian? Is it OK that the European parliament, NATO, and the US government under Obama participated in encouraging the coup that ousted the president?

          My main interest is in preventing a nuclear holocaust. The way we are approaching this through arming the Ukraine is leading straight into that scenario. Putin has now warned us twice, are we that seriously stupid, all for the sake of political bs?

          • Norman says:

            Gordon Robertson

            If the sick minded power hungry Putin can use Nuclear War threat to put the rest of the world in fear as he destroys cities and kills civilians at will, why is he going to stop with Ukraine? What would stop him from Poland, Romania, Lithuania, Latvia, Estonia, Finland, Sweden?

            Did Hitler stop with Poland? No he went on into France and then even Russia. Power hungry people stop when they want if his threats work then what will stop him.

            I think you fall for his lies way too much. There was a small group of alleged NAZI group of militia fighters.

          • Clint R says:

            Norman, your obsession with Nazis is interesting.

            Do you understand that Nazis were a cult? Do you see any similarities between Nazis and the cult idiots here? Notice the hatred, aversion to reality, and willingness to censor truth, displayed by all cults. People that are braindead can’t learn from history.

          • Willard says:

            Gordo’s the one who keeps talking about Nazis, Pup.

            You promised Tim an explanation, BTW.

          • Clint R says:

            Worthless Willard, it took you 45 minutes to respond. You even fail at stalking. And, you STILL don’t know what’s going on.

            https://www.drroyspencer.com/2022/04/uah-global-temperature-update-for-march-2022-0-15-deg-c/#comment-1245811

            Your incompetence goes well with your immaturity and ignorance.

          • Willard says:

            Oh, Pup.

            I *do* know what’s going on –

            You hide between a silly Sphynx act.

          • Willard, please stop trolling.

  64. Gordon Robertson says:

    maguff…”NASAs James Webb Space Telescope will see the first galaxies to form after the Big Bang, but to do that, its instruments first need to get cold really cold”.

    ***

    Sadly, this statement indicates how badly science has degenerated into pseudo-science.

    What makes these idiots think they are looking at the epicentre of a fictitious Big Bang?

    The light collected at the Webb telescope receiver is there right now. It does not represent a source in the past, it represents electromagnetic energy in the here and now.

    There is no ‘back then’. The universe as a whole is here and now, existing in the same physical space we experience here on Earth. There is no separate dimension to this physical space, or related to it, called time.

    I am not denying that a star that emitted light millions of years ago, and has now blown up as a supernova, and no longer exists as a star, was not there. I am claiming that the light we receive from that star, or ex-star, is arriving here right now, and in no way represents the distant past.

    That raises the question as to exactly what it is we are seeing out there. Posters on here have argued that fluxes add. If that’s the case, why do we see all those stars as point sources and not a mish-mosh of added fluxes?

    We know that light from a star is emitted isotropically, therefore it emits back they way as well as sideways. There are all sorts of dust clouds and hydrogen clouds in interstellar space, so why are we not seeing light from stars reflecting off those clouds, that are perpendicular to our line of sight to the stars?

    We should not be seeing a narrow beam of light from a specific star since that light from the source onward should have spread out as a sphere. One answer is that our eyes, and the eyes of a telescope use lenses. The waves from the original star are actually spherical but our eyes sample a tiny portion of the sphere and our lenses bend the light into a point source.

    We see our own Sun in this manner, since it emits only in spherical EM waves. The lens in our eyes sample the spherical waveform and turn it into a smaller source. Even solar input at TOA is measured in watts/unit area, the area being the section of a sphere.

    It seems then that all stars are emitting in spherical EM waves yet none of the waves interfere with each other. More evidence that such fluxes from incandescent-like sources do not add.

    • gbaikie says:

      “That raises the question as to exactly what it is we are seeing out there. Posters on here have argued that fluxes add. If thats the case, why do we see all those stars as point sources and not a mish-mosh of added fluxes?”

      The starlight is “direct sunlight” and they far apart?

      • Gordon Robertson says:

        Like I claimed, the light from any star spreads out in spherical waves. The lens in our eyes intercept a tiny portion of the sphere and focuses it on our retinas as a point source.

        We are obviously not seeing the star as a point source since many of them are far bigger than our Sun. We are seeing only a tiny portion of the spherical wave of light they give off at a huge diameter.

        The fact that we can see many, many stars suggests the fluxes making up the wavefronts do not interfere, therefore they don’t add.

        If you could see all the spheres from all the stars, there would be a myriad of intersecting spheres. Not only that, each sphere would be made up of bazillions of concentric spheres getting smaller and smaller as they got closer to the star.

        • gbaikie says:

          “Like I claimed, the light from any star spreads out in spherical waves. The lens in our eyes intercept a tiny portion of the sphere and focuses it on our retinas as a point source.”

          Yes. But you seem say it, as if the eyes are seeing it wrong [or something}.
          Or, the stars are points of light.

          And these points of light can be magnified and such magnified stars [if magnified enough] can similar to our sunlight [or hotter, if stars is as hot or hotter than our sun]. Or our sun if magnified enough, can melt brick [because sun’s temperature is way hotter than the temperature to melt brick].
          Your eyes will only let in a part of the sun’s light, and eye’s pupil will shrink because the sunlight is very bright {btw, don’t look at sun}, but stars are not bright/intense like sun- pupil will or should not shrink {much}. And eyes are roughly seeing the correct size of stars, sun, or the moon.

          There are illusions of their sizes, ie the moon looks bigger near the horizon, and etc. And Moon is bigger or smaller because it’s nearer or further from you [not an illusion].

          Melting bricks with sunlight, goggle:
          https://www.youtube.com/watch?v=SrfcjSuwRTM

          • Gordon Robertson says:

            gbaikie…”But you seem say it, as if the eyes are seeing it wrong [or something}”.

            ***

            Not questioning as much as trying to see it the way we actually see it. The whole point of my post was that light from a star does not represent the past. It can only represent the present.

            With regard to the light from a star, if a person has been blind from birth and he/sh receives some kind of modern treatment so they can see, I have read reports that many of them feel totally disoriented and horrified at times by what they see. From birth, our eyes learn to deal with depth perception so we can place objects at a distance in our binocular vision field.

            Biologist Rupert Sheldrake explained it something like the following. Light from a distant sources reaches our eyes, where it is immediately inverted upside down and right to left through the lens and appears at 2-D retina as that image. Then the image is converted to a biolectric signal where it reaches the brain for processing. The brain creates an imagine of what is seen and somehow that imagine is projected back out to where it is, in the field of vision.

            Sheldrake is not claiming a real image is projected and he admits no one knows. The image would need to be virtual or related to some kind of energy we have not yet encountered. The theme of the article from which this is taken is ‘The Sense of Being Stared At’. How can we sense someone is staring at us? Seems to be some kind of energy projected by the person staring and we seem to have the ability to detect that energy.

            Anyway, light from an image strikes the retina, which is actually a curved 2-D surface. There is no means by which the retina can create a 3-D image. Even if it could, the brain gets info from a 2-D surface, so how does it turn it into 3-D and add depth perception?

            This is chapter 2 from Sheldrake’s book….

            http://citeseerx.ist.psu.edu/viewdoc/download?doi=10.1.1.694.611&rep=rep1&type=pdf

            Getting back to the stars. We can’t really position a star via depth perception. Although something like the Little Dipper appears like a dipper, the stars forming Ursa Minor are huge distances apart and of very different brightnesses. Therefore the naked eye creates an asterism that appears to be a dipper.

            Even with a telescope it’s hard to detect distances because a very bright star can appear closer than one that is half the magnitude and a lot closer. So, what is it we are actually seeing. That’s my question.

            If stars generate light isotropically (in all directions over a sphere) why do we see them as a point source? On the other hand, Jupiter, which is a lot bigger than Earth, appears as a point source to the naked eye and can be mistaken for a star. That is, when the Sun is shining on it at an angle where we can see it. Even then, the light shining off Jupiter spreads out isotropically.

            When the isotropic sphere contacts us, our lenses take in only a fraction of the isotropic EM field and convert it to a point source because it’s all the light it can manage at that distance. If the same eye looks through a powerful telescope, the lens on the scope can amplify the isotropic portion to a larger disk.

          • gbaikie says:

            “With regard to the light from a star, if a person has been blind from birth and he/sh receives some kind of modern treatment so they can see, I have read reports that many of them feel totally disoriented and horrified at times by what they see. From birth, our eyes learn to deal with depth perception so we can place objects at a distance in our binocular vision field. ”

            Sure but I don’t think one needs some kind of disability- people actually see things differently.
            I tend to think there is an objective reality, but people can see it differently. Or I don’t believe we are in simulation- that there is not objective reality or the “apparent objective reality” is a kind of fiction.
            People have different points of view, and people can change their points of view, but seems doubtful anyone can have same point of view as someone else. People are different.
            Scott Adams likes to talk of the two movies, but I would guess he imagines there is more than two. But maybe not because he says the simulation has “finite resources” which could allow just two or finite number of movies. I believe in “infinite resources” or God.
            Scotts again, discuss the two movie thing:
            https://www.youtube.com/watch?v=627b9NzRKOM
            Anyhow, I would like to “see”/”understand” the cargo cult point of view- or anyone’s religious view.
            Ie, what is Venus temperature at Earth distance from the Sun?

          • Gordon Robertson says:

            gbaikie…”I tend to think there is an objective reality, but people can see it differently”.

            ***

            I agree. When the image on the retina is analyzed by the brain/mind, it can add information that is not there. That’s the basis of the ‘observer and the observed’ idea. The observer modifies the observed so what he/she is seeing is what he/she wants to see, not what is there.

            I am not implying the star is not real. Picture the star as the core of an onion, but instead of a few layers surrounding it, there are an infinite number of waves of electromagnetic energy surrounding it, all of them continually moving outwardly.

            Somewhere way out from the core, light years away, one of the concentric waves of energy is sampled by our eyes. Just one wavelet would do very little, we need a stream of them to produce the required frequency to produce colour or to produce the intensity required. As we stare at an object or a star, millions of wavelets strike our eyes in sequence.

            There will be many other wavelets from other stars intercepted by our eyes at the same time. The lenses in our eyes will move the samples to various parts of the retina by inverting them and moving them laterally as well. So, the tiny samples of light from each wavelet will be located as point sources at different parts of our retina.

            The point is, we are not seeing the actual star, we are seeing only the light that stimulates the retina in our eyes many light years away. Somehow, our minds create an image and has the ability to convert a 2-D image on the retina to a 3-D image with great depth.

            When the Webb telescope gathers light from stars, it lacks the ability to change that reality. However, NASA minds look at the data and distort it by claiming it represents the past. They turn fact into fiction. They not only claim the light gathered is from the past but from a fictitious Big Bang.

            All the education in the world cannot fix that illusion/bias, the only way around it is by becoming aware it is there and why it is there. Jiddu Krishnamurti spent a lifetime going into the reasons and his information has influenced scientists, like David Bohm, and celebrities who have been willing to listen.

            With regard to he point sources, they are illusions. The distance over which the light travels renders them as point sources to the mind. It does that by sampling a tiny portion of the EM field of the star, after it has expanded over many light years, which is focused on the retina as a point of light.

            We are not seeing the star itself, we are seeing a sample of light from it at a great distance. The star we are seeing as a point source may have exploded 100s of years ago and is no longer there but the light it gave off is still expanding isotropically through space. We are not seeing the actual star, we are seeing a tiny portion of its isotropic spherical expansion wave.

            Those waves are stacked one behind the other and ill always be coming at us as long as the initial light given off is still moving through space.

    • TYSON MCGUFFIN says:

      Gordon Robertson at 5:38 PM

      Just say no to drugs, man!

      Keith Richards – Cocaine Blues
      https://youtu.be/aBdGTNPDLc0

      Well, yonder comes my baby all dressed in white
      See baby gonna stay all night
      Cocaine all around my brain

      Yonder comes my baby all dressed in blue
      See baby what you gonna do
      Cocaine all around my brain

      Hey baby come here quick
      This old cocaine is making me sick
      Cocaine all around my brain

      Cocaine’s for horses, it’s not for men
      They say it’ll kill you but they don’t say when

      Cocaine all around my brain

      Ohh baby wouldn’t you get here quick
      This old cocaine is making me sick
      Cocaine all around my brain

    • RLH says:

      “The light collected at the Webb telescope receiver is there right now. It does not represent a source in the past, it represents electromagnetic energy in the here and now”

      When ago did that light emanate from? Given that the speed of light is a know number.

  65. gbaikie says:

    China will 1/2 it’s population by 2070

    Is China Screwed?
    https://www.battleswarmblog.com/?p=51172

    Or has China almost reached lefty heaven?

    It’s possible China 1/2 it’s population by 2050.
    If that is true, I am wrong about China reaching peak coal,
    Instead they reached peak people more than a decade ago and with
    the less people in future, they should have endless amounts of coal.
    But above in it’s video it’s claimed the economic collapse due huge amount debt will be worse.
    And:
    “I think Zeihan overstates the case a bit, and probably immanizes the timeline of crisis more than warranted, but the demographic and economic challenges China faces are very real.

    Also keep in mind that no one in 1988 expected the Soviet Union to collapse as quickly as it did, either

    Minimizes?

    Anyhow, China coal at $314 per US ton:
    https://tradingeconomics.com/commodity/coal
    And I don’t trust any news about China- but how much they pay for Coal, I do have fair amount of confidence in.

  66. Gordon Robertson says:

    entropic…”They [UBC…Vancouver} do physics demonstrations. Ask them to set up a gas cell and show you the IF absorb.tion and reemission of different concentrations of CO2.

    ***

    I have never questioned the fact that CO2 can absorb IR. I fully accept Tyndall’s excellent demonstration, circa 1850.

    I am questioning the proof that such an absorp.tion of surface IR by CO2 in the atmosphere is anywhere near enough to cause a significant warming of the atmosphere. As I have tried to point out, the Ideal Gas Law reveals only a warming proportional to the mass percent of CO2 in the atmosphere, which is about 0.04C per 1C warming.

    In climate models they use a warming factor of 9% to 25%. I want to know how they derived such a warming factor and I want to see the proof for it.

    An expert on CO2 and its properties, R.W.Wood, question this circa 1909. AGW theory is based on greenhouse warming theory and he questioned that CO2 in a real greenhouse could warm it via trapped radiation. He set out to prove that real greenhouses warm due to a lack of convection and it has nothing to do with radiation. He extended that to the atmosphere, claiming it was not possible for CO2 in the atmosphere to warm it.

    The prevailing theory held that IR trapped by glass somehow caused the greenhouse to warm. It’s kind of absurd in a way, where is the mechanism by which IR can cause an amplification of heat? It would mean CO2 emitting IR, the IR being blocked by the glass, CO2 reabsorbing the blocked IR and amplifying it in the process. Such heat amplification is perpetual motion.

    It makes far more sense that all air molecules are involved in the warming since heat is a property of mass, not IR. If the Earth had no convection, according to Lindzen, the surface would heat to 72C. Same in a greenhouse with no convection. However, a greenhouse has other means of dissipating heat via conduction through the glass and infrastructure, therefore it doesn’t reach 72C. It could easily reach into the 50C+ range with all doors and windows closed.

    The truth is that the GHE and AGW, based on a real greenhouse, are bad theories based on wrong-headed physics.

    • Gordon Robertson says:

      BTW…when Lindzen claimed a surface temperature of 72C with no convection, that meant with full radiation. So, if heated air did not rise, and there were no winds, solar energy would warm the surface to 72C despite radiation.

      • Willard says:

        C’mon, Gordo –

        We welcome the fact that [Dick] accepts that:

        There has been a large increase of atmospheric concentrations of carbon dioxide and other greenhouse gases due to emissions resulting from human activity over the past 150 years […]

        Increasing carbon dioxide alone, and in the absence of climate feedbacks, should cause about 1C warming for each doubling

        https://www.imperial.ac.uk/media/imperial-college/grantham-institute/public/publications/evidence–submission-papers/Critique-of-Lindzen%27s-lecture.pdf

        • stephen p anderson says:

          Does that refute what Gordo just said?

        • Gordon Robertson says:

          This is not a quote from Lindzen, it’s a quote from some wanker alarmist.

          • Willard says:

            C’mon, Gordo –

            “The objective of this note is to produce a short critique of some of the major scientific arguments in the talk given by Richard Lindzen (RSL) in the House of Commons Committee Rooms”

            You can be a jerk all you want, but don’t be an idiot.

        • Gordon Robertson says:

          Let’s dumb this down for you Willard. If you removed all CO2 and all water vapour from a greenhouse, would it still warm?

          • Willard says:

            C’mon, Gordo –

            Which part of “There has been a large increase of atmospheric concentrations of carbon dioxide and other greenhouse gases due to emissions resulting from human activity over the past 150 years” you do not get?

          • Gordon Robertson says:

            I have explained it thoroughly for you. There is not a shred of evidence that a trace gas in the atmosphere can lead to catastrophic warming and climate change.

            When glaciers expand enormously over the Little Ice Age then begin melting after it, my science tells me that’s a very good natural explanation. Don’t need eco-weenie alarmists making up pseudo-science.

          • Willard says:

            C’mon, Gordo –

            Which part of “It’s kind of absurd in a way, where is the mechanism by which IR can cause an amplification of heat?” you do not get?

            Dick does not deny the greenhouse effect. You do.

            Quit squirming and think.

          • Willard, please stop trolling.

      • gbaikie says:

        Global warming means a more uniform global temperature.
        One could have very hot daytime air temperature, in glaciation period
        [with low levels of CO2].

        • gbaikie says:

          I should add, if average temperature of all the oceans is warmer then about 3.5 C, one have a more uniform global temperature, but it would have a higher uniform average temperature.
          But this difference is bigger in an icehouse global climate.
          A ocean temperature going from 3.5 C to 4 C, a 1/2 C degree difference, is bigger change compared to ocean at 5 C, going to 6 C.
          Or a 6 C to 10 C is small difference.
          10 C ocean is not an icehouse global climate, and it might not be warm enough to be a greenhouse global climate.
          Or it seems like a complicated question of what average temperature of the Earth ocean would have to be, but it could be 10 C ocean.

  67. Gordon Robertson says:

    willard…”Even you can see that my link establishes that Russia collaborated with Nazis too”.

    ***

    In the beginning, that’s true. However, it did not take long for them to switch sides when they saw Hitler’s real intention. As I said, without them we’d have had it a lot worse by far.

    I am in no way defending Stalin or the USSR. I have no communist sympathies, either for the former USSR or in modern China. I don’t know anything about Putin, only what the western media has printed. I now know a lot about the dark-side of the Ukraine and it has me worried. I don’t like to see any factions who sympathize with Nazis running around creating havoc in a country especially when their actions could lead to a nuclear war.

    It’s the fascist SOBs who have created the problem with Russia and I’m all for letting Putin deal with them since our side wont. I think it’s despicable that countries, even Canada, are turning a blind eye to neo-Nazis.

    Just found out there are cemeteries in Canada with headstones honouring WW II Nazis. Even some Jewish faction in Canada are willing to overlook it but I’m not.

    https://en.wikipedia.org/wiki/St._Volodymyr_Ukrainian_Cemetery

    • Ireneusz Palmowski says:

      The strong temperature drop of the Peruvian Current promises to strengthen La Nia.
      https://www.tropicaltidbits.com/analysis/ocean/nino12.png

    • Ireneusz Palmowski says:

      I understand that you are afraid of nuclear war, however Ukraine had its borders guaranteed by Russia, UK and US if it gave up its nuclear weapons. Those borders were breached in 2014 and I’m afraid you’ll find more Nazis in Canada and the US than in Ukraine. There are also in Poland, Hungary, USA etc. You will find the most Nazis now in Russia.

    • Ireneusz Palmowski says:

      In previous years, hundreds of thousands of Ukrainians worked in the Polish economy, which is why now Poles are so eager to help Ukrainian families.

    • Willard says:

      > In the beginning, that’s true. However

      Exactly, Gordo. Same for Svoboda, who has one seat in the Verkhovna Rada, and it’s not even held by Oleh Tyahnybok. They received less than votes than Maxime Bernier did, which is quite a feat.

      Have more Russian fascists fans –

      Many commentators have already debunked Russian President Vladimir Putins absurd claim to be waging war to “de-nazify” Ukraine.

      Some have pointed out the far right received only 2% of the vote in Ukraines 2019 parliamentary elections, far less than in most of Europe. Others have drawn attention to Ukraine’s Jewish president, Volodymyr Zelenskyy, and the efforts of the Ukrainian state to protect minorities like Crimean Tatars and LGBTQ+ people, who are subject to brutal persecution in Russia.

      What has received less coverage is the Putin regime’s own record of collaboration with far-right extremists. Even as Russian diplomats condemned “fascists” in the Baltic states and Kremlin propagandists railed against imaginary “Ukronazis” in power in Kyiv, the Russian state was cultivating its own homegrown Nazis.

      https://theconversation.com/putins-fascists-the-russian-states-long-history-of-cultivating-homegrown-neo-nazis-178535

      Read, then think.

      • Brandon R. Gates says:

        nice one, w

      • Gordon Robertson says:

        willard…” Same for Svoboda, who has one seat in the Verkhovna Rada, and its not even held by Oleh Tyahnybok. They received less than votes than Maxime Bernier did, which is quite a feat”.

        ***

        So, you are claiming Ukrainians who believe in democracy held a coup to oust a democratically-elected president in 2014. What kind of bleeding democracy is that?

        And what peaceful Ukrainian runs around with the guns that were used during the coup?

        Willard, you are terminally naive.

        • Willard says:

          C’mon, Gordo.

          You can’t even get your number of Svoboda seats right.

          It’s one.

          There are lots of Ukrainians in Canada. Find a few. Tell them about your conspiracy theory. Meanwhile, please mind your mouth breathing.

    • Bindidon says:

      Robertson is one of the dumbest ignoramuses on this blog.

      All what he writes here is absolute trash, regardless what he writes about.

      He has, like some others, no idea of what is Fascism, where Neonazis live, etc etc.

      There are more Fascists and Neonazis between Southern Chile and Northern Canada than anywhere else on Earth: Germany, France, Hungaria and Italy of course included.

      Simply because after WW II, a huge number of them silently left Europe under the protection of the Catholic Church in Rome, and moved toward the American continent.

      • Gordon Robertson says:

        binny…”There are more Fascists and Neonazis between Southern Chile and Northern Canada than anywhere else on Earth: Germany, France, Hungaria and Italy of course included”.

        ***

        Binny is in terminal denial. The Nazi leaders ran to save their skins but they left behind a load of Nazi sympathizers whose descendants are alive and well in Europe. You are so dumb you don’t get it they exist today in modern Germany.

        https://en.wikipedia.org/wiki/Neo-Nazism#Germany_and_Austria,_1945%E2%80%931950s

        • Willard says:

          Gordo, you absolute twat:

          In the German Democratic Republic (East Germany) a former member of SA, Wilhelm Adam, founded the National Democratic Party of Germany. It reached out to those attracted by the Nazi Party before 1945 and provide them with a political outlet, so that they would not be tempted to support the far-right again or turn to the anti-communist Western Allies. Joseph Stalin wanted to use them to create a new pro-Soviet and anti-Western strain in German politics.

          As you can see, Vlad invented nothing.

          Binny is not even talking about that, BTW.

  68. TYSON MCGUFFIN says:

    Gordon Robertson 4/15/22 at 5:38 PM says:
    “[…]
    The light collected at the Webb telescope receiver is there right now. It does not represent a source in the past, it represents electromagnetic energy in the here and now.
    There is no ‘back then’.[…]”

    Must you be wrong about everything, all the time?

    Light speed to scale in time and space, it’s fast but slow

    https://youtu.be/HV7q9VrDgBo

    Light speed= 299,792 km/sec.
    Distance between pulses:
    At 1 sec= 0.3 million km.
    At 2 sec= 0.6 million km.
    At 5 sec= 1.5 million km.

    • Gordon Robertson says:

      where do you dig up that nonsense? What are pulses?

      Light is measured as a frequency with a wavelength. The relationship is …

      lambda(wavelength) = L = c/f = speed of light/frequency

      c = 300 x 10^6 m/s

      Therefore the distance between wavefronts is dependent on the frequency of the light emitted. If a star appears white, then it includes all of the frequencies in the visible light spectrum.

      Which one do you want? The middle of the visible spectrum could be taken as 0.6 um wavelength = 0.6 x 10^-6 metres. That means each successive wave front emitted is 0.6 x 10^-6 metres apart.

  69. gbaikie says:

    Gatekeepers Very Afraid That Elon Musk Will Remove the Gates From Twitter
    –“I am frightened by the impact on society and politics if Elon Musk acquires Twitter,” wrote Max Boot, columnist for The (Jeff Bezosowned) Washington Post, on Twitter. —
    https://reason.com/2022/04/14/gatekeepers-very-afraid-that-elon-musk-will-remove-the-gates-from-twitter/

    Can’t recall anything Max Boot said, that was worth recalling.
    I think Max is a man, and he sounds like a pussy.
    Though he could self identify as a whining baby.

    I would prefer Musk not buy twitter.
    If he buys it, and improves it a lot, I still won’t “go on twitter”.
    But he seems to likes twitter, so whatever.

    I think he is just shaking the box, and actually running twitter seems like it would be quite tedious.

    Hmm, he has eight children, maybe his children want him to do- that makes sense, and therefore, he should buy.
    I forget he has children- and they don’t like Tik Talk?
    Too old or too smart??
    Or China is just too much of a disaster.

  70. Ireneusz Palmowski says:

    The Russians are destroying the flourishing cities in Ukraine in recent years because feudal Russia envied its neighbor for such a rapid increase in the standard of living for the average citizen.

    • Bindidon says:

      Do the Russians not simply dream of reestablishing their good old CCCP?

      Chechnya, Georgia, Crimea, then the whole Ukraine… what will be next?

      The Baltic states?

    • Gordon Robertson says:

      Why would they want to destroy Maruipol? They would be punishing the Ukrainians who support them. The idea that the Russians are attacking cities like Maruipol as an attack on the Ukraine in general is western media propaganda.

      They are attacking Maruipol because that’s where the neo-Nazi Azov battalion is located.

      When the Allies landed at Normandy in WW II, they flattened Caen, killing thousands of innocent French civilians. They flattened the city because German panzer divisions had taken over the city.

      The hope is, obviously, that the civilians have evacuated the city. However, in Maruipol, the neo-Nazis SOBs were preventing the citizens from leaving, at gunpoint. They were essentially using the citizens as hostages. One western news outlet actually pointed that out.

      • Willard says:

        > Why would they want to destroy Maruipol?

        C’mon, Gordo:

        https://www.rferl.org/a/mariupol-ruins-drone-ukraine/31766973.html

        It’s Mariupol.

        And yeah, it’s more or less destroyed already.

        You’re a despicable man.

        • Gordon Robertson says:

          willard…”And yeah, its more or less destroyed already.

          Youre a despicable man”.

          ***

          I consider the source of such insults, a blithering idiot who cannot string two sentences together coherently and who relies on cherry picking wiki articles to present an opinion.

          • Willard says:

            > I consider the source of such insults

            C’mon, Gordo.

            That is an ad hominem.

            You know that thing you whine about every other day?

            Yeah, that thing.

          • Willard says:

            Besides, Gordo –

            Do you realize that right effing now you’re denying that Mariupol, which you can’t spell correctly, has been bombed down in ruins because that scenario does not cohere with your interpretation of your favorite dictator’s intentions?

            Have more photos of the devastation:

            Mariupol mayor says city ’90 percent’ destroyed following siege of over a month

            130,000 people remain trapped in city, continuously pounded by Russian attacks that largely come ‘from the sea,’ Boichenko says; evacuation attempts continue to face setbacks

            https://www.timesofisrael.com/mariupol-mayor-says-city-90-percent-destroyed-following-siege-of-over-a-month/

            Russians are starving to death those who are still in the city.

            Next you’ll try to pretend that a battalion of a few thousand men did that?

            I know that weirdos like are doubting if birds exist these days, but at least they’re confabulating on stuff that has little importance in the grand scheme of things.

  71. Gordon Robertson says:

    ren…”I understand that you are afraid of nuclear war, however Ukraine had its borders guaranteed by Russia, UK and US if it gave up its nuclear weapons. Those borders were breached in 2014 and Im afraid youll find more Nazis in Canada and the US than in Ukraine. There are also in Poland, Hungary, USA etc. You will find the most Nazis now in Russia”.

    ***

    The Ukraine created it’s own problems in 2014 when it allowed a coup that ousted a democratically elected president. He was pro-Russian and when he was ousted, pro-Russians in eastern Ukraine rebelled, leading to a civil war. Why did the Ukrainian army and police not stop the coup? Is it not obvious, they were sympathetic to the coup?

    People don’t do that in real democracies like Canada and the US.

    The rebels want independence, it has nothing to do with Russia stealing land from the Ukraine.

    When you say there are more Nazis in Canada and the US than the Ukraine, you are misguided. There are neo-Nazis in the US and Canada but none of them have any political influence. They cannot operate openly or they would be thrown in jail. They are forbidden to carry arms due to our strict gun-control rules.

    In the Ukraine, there is a neo-Nazi political party called the Svoboda Party. The leader of the party, Oleh Tyagnibok once applauded Ukrainian factions in WWII who fought Jews and ‘other scum’. Sorry Ren, but other scum to those neo-Nazis included people from Poland and Russia, as well as the Allies.

    There is a neo-Nazi faction called Right-Sector and the Ukrainian army has several divisions like the Azov battalion who have openly Nazi/fascist sympathies. Some of them wear the Swastika on their helmets and other use the SS insignia of the Nazi-SS.

    The leader of the Azov battalion, Andriiy Biletsky was an openly-fascist Ukrainian politician who sat in the Ukrainian parliament for 5 years. That would never be allowed to happen in Canada or the US.

    That’s how effectively the Ukraine has hidden their Nazi past and their current Nazi sympathizers. You live next door to the Ukraine and you don’t understand what has been going on there.

    Not all Ukrainians were Nazi sympathizers, only those in the western provinces like Galacia. Ukrainians in the eastern Ukraine fought with the Russians. That division is still there today and that is why this war is going on. It’s between Ukrainians with Russian sympathies and Ukrainians heavily influenced by fascist factions.

    Although Zelensky is Jewish, I am sure he has been threatened by the fascists. The previous president, Poroshenko, was threatened by them, so much so, that he was forced to pass a law honouring Ukrainian war criminals, like Stepan Bandera, as heroes. The SS Galacia, a Nazi SS division, are now regarded as heroes

    You seem to be unaware of your own past in Poland. These fascist SOBs, who fought with the Nazis, hated Poles. They committed atrocities against Poles, as well as Jews and Russians.

    https://en.wikipedia.org/wiki/Massacres_of_Poles_in_Volhynia_and_Eastern_Galicia

  72. Willard says:

    Gordo keeps writing the same walls of words all over again. Let’s pick apart his “But 2014” silliness:

    In November 2013, a wave of large-scale protests (known as Euromaidan) erupted in response to President Yanukovych’s sudden decision not to sign a political association and free trade agreement with the European Union (EU), instead choosing closer ties to Russia and the Eurasian Economic Union. In February of that year, the Verkhovna Rada (Ukrainian parliament) had overwhelmingly approved of finalizing the agreement with the EU. Russia had put pressure on Ukraine to reject it. These protests continued for months and their scope widened, with calls for the resignation of Yanukovych and the Azarov Government. Protesters opposed what they saw as widespread government corruption and abuse of power, the influence of oligarchs, police brutality, and violation of human rights in Ukraine. Repressive anti-protest laws fuelled further anger.

    https://en.wikipedia.org/wiki/Revolution_of_Dignity

    He ignores Yanukovytch’s abuse of power, and disregards police brutality, violation of human rights, and repressive anti-protest laws.

    Gordo’s just a coward boot licker like so many other history forgot.

  73. Gordon Robertson says:

    ren…”In previous years, hundreds of thousands of Ukrainians worked in the Polish economy, which is why now Poles are so eager to help Ukrainian families”.

    ***

    I have never claimed all Ukrainians have fascist sympathies or are White Supremists. However, it only takes a minority to influence governments into taking stupid and drastic action, as in the Ukraine.

    The Maidan protest of 2014 began peacefully with no violence. It began as a protest over the President not wanting to join the EU. He claimed the Russians had offered a far better deal. Then the fascist element joined in with their weapons and it turned ugly, ending with a coup.

  74. Willard says:

    [GORDO] Democratic people have no interest in over-throwing a democratically-elected governments

    [ALSO GORDO] They would have to stop same sex relationships at the same time.

    What an effing prick.

    • Gordon Robertson says:

      Finally got that one did you? Melted down.

      You are so flustered by it you can’t offer a decent come back.

      • Willard says:

        That authoritarian homophobes are prick is a well know fact, Gordo.

        Suck it up.

        • Swenson says:

          Willard,

          You wrote –

          “That authoritarian homophobes are prick is a well know fact, Gordo.

          Suck it up.”

          That your English expression is odd, is a well known fact.

          Are homosexual authoritarians somehow better than non-homosexual ones? That sounds a bit discriminatory. Are you anti-heterosexual perhaps? Maybe mixing “prick” and “suck it ” was an unfortunate Freudian slip.

          Tut, tut, Willard. You might give people the wrong impression.

          Carry on.

  75. Gordon Robertson says:

    willard…I regard you as one of most stupid, misinformed person who has ever posted on this blog since Binny. You fail to understand that armed rioters overthrew a democratically-elected government.

    Just how far do you think such rioters would get in the US or Canada?

    You’re a frigging idiot.

    If you read your wiki article more closely you will see that the Ukraine was regarded as one of the most corrupt countries in Europe, long before Yanukovich came to power.

    The Ukraine has apparently never been a democracy.

    https://en.wikipedia.org/wiki/Corruption_in_Ukraine

  76. Willard says:

    > the Ukraine

    C’mon, Gordo.

    Your melt down is delicious –

    Corruption is perceived as a significant problem in Russia, impacting various aspects of life, including the economy, business, public administration, law enforcement, healthcare, and education. The phenomenon of corruption is strongly established in the historical model of public governance, and attributed to general weakness of rule of law in the country. Russia was the lowest rated European country in Transparency International’s Corruption Perceptions Index for 2021; ranking 136th out of 180 countries.

    https://en.wikipedia.org/wiki/Corruption_in_Russia

    Think.

    • Gordon Robertson says:

      A meltdown is when someone loses it emotionally and raves on. Everything I said about you is the truth, based on observation. You have been trolling Roy’s blog for a long time now and others have pointed out the same to you.

      It gets tiresome trying to respond to an idiot troll when you know it will only return with the same old, same old. I reply to you only for the benefit of a third party who may be reading. You are so stupid, I have come to the conclusion that no third party reader could take you seriously.

      Your arguments are nothing more than black to someone’s white. There is never logic in them that has been well thought out, your replies are nothing more than a quick lookup on Google for anything that is remotely opposed to what has been said.

      Your ‘rat’ nym is appropriate.

      • Willard says:

        Alright, Gordo.

        Let’s take stocks of the crap you spouted in the span of the Hurricanes vs Avs game –

        Your rant about what happens in 2014 flies on the face that Ukraine’s president tried to go against the decision of the parliament.

        You deny that Mariupol has been completely destroyed by the man you’re boot licking for who knows what reason underneath that thick skull of yours.

        You divert Binny’s point that Nazis fled Europe by pointing out a Wiki entry where we see black and white that Stalin employed the very playbook Vlad uses.

        You became the most disgusting apologist I have ever seen. ZZ bots need to bow to you. If they had to build a Sauron module into the brain of an Orc, they’d have to copy-paste your comments.

        May God have mercy on your soul.

  77. Gordon Robertson says:

    maguff…”Just say no to drugs, man!”

    ***

    The idiot maguff, you loses every debate he has with me, now tries to link me to drugs. He even uses a loser like Keith Richards as his authority figure.

    I could be strung out on drugs and still think more clearly than maguff.

    I would like to see this wanker stoned on Orange Sunshine to reveal to him just how fragile is pitiful ego really is.

    • Gordon Robertson says:

      Typo…’you loses’ is obviously ‘who loses’.

    • Willard says:

      C’mon, Gordo.

      We need to choose what kind of world we will live to Keith Richards.

      Have some respect.

    • TYSON MCGUFFIN says:

      GR, my comment seems to have struck a nerve, it hit a vein! I hope it causes you to seek help.

      • Swenson says:

        Oooooh!

        TYSON MCGUFFIN exalts that he has struck a nerve, hit a vein!

        Unfortunately, nobody with any sense cares what an anonymous. powerless, impotent and pretentious moron believes.

        Why should they?

        TYSON MCGUFFIN, like the rest of the climate crackpots, resorts to sneering idiocy because reality denies the GHE which he worships.

        He can’t even describe this GHE in non-religious terms! Bad luck for TM and his dwindling band of like minded zealots. Appealing to the authority of Christian religious leaders shows the real nature of the GHE cult beliefs.

        Religion and faith – not science.

        • TYSON MCGUFFIN says:

          Swenson 4/17/22 at 5:00 PM

          Yes, your 95 word reply to my comment lets me know that you don’t care.

      • Gordon Robertson says:

        Nope. It just revealed to me how juvenile and stupid are the arguments you present.

  78. Willard says:

    What the hell. Why not. Let’s try to put that “But Nazis” line to rest once and for all:

    [M]embers of far-right groups played a greater role on the pro-Russian side of the conflict than on the Ukrainian side, especially at the beginning. Leaders of the Donetsk People’s Republic are closely linked to the neo-Nazi party Russian National Unity (RNU) led by Alexander Barkashov, which recruits fighters. A member of RNU, Pavel Gubarev, was the first “governor” of the Donetsk People’s Republic. In particular, RNU is linked to the Russian Orthodox Army, a separatist group in Donbas, and Barkashov is said to have given instructions to its commander Dmitry Boytsov according to a published audio recording. Volunteers from several other Russian far-right groups have joined the separatist militias, including members of the Eurasian Youth Union, the Russian Imperial Movement, and the banned Slavic Union and Movement Against Illegal Immigration. Other neo-Nazi groups fighting as part of the Donetsk People’s Republic include the ‘Svarozhich’, ‘Rusich’ and ‘Ratibor’ battalions, which have Slavic swastikas on their badges.

    https://en.wikipedia.org/wiki/Neo-Nazism

    That soldiers everyone around the world share affinities with machist and violent ideologies should not surprise anyone. The connection that Gordo tries to draw is, in a word, spurious.

    There is not one single conspiracy theory he won’t fall for. I guess it fills a void.

    Still, this one matters, and it’s worth not ignoring.

  79. gbaikie says:

    Let’s review again, warming from CO2
    “CO2 has increased from its pre-industrial level of 280 parts per million (ppm) to around 408 ppm today. Without actions to reduce emissions concentrations are likely to reach 560 ppm double pre-industrial levels around the year 2060.”
    [I think it’s more 500 ppm by 2060 AD]
    And 280 + 280 = 560 and 280 + 140 = 420 ppm
    And first part [+180 ppm does more than second 180 ppm added in terms of immediate effects, though not case long terms effect, as in:

    “There are three main measures of climate sensitivity that scientists use. The first is equilibrium climate sensitivity (ECS). The Earths climate takes time to adjust to changes in CO2 concentration. For example, the extra heat trapped by a doubling of CO2 will take decades to disperse down through the deep ocean. ECS is the amount of warming that will occur once all these processes have reached equilibrium.”
    Or the ECS effects haven’t time to kick in. And:
    “The second is transient climate response (TCR). This is the amount of warming that might occur at the time when CO2 doubles, having increased gradually by 1% each year. TCR more closely matches the way the CO2 concentration has changed in the past. It differs from ECS because the distribution of heat between the atmosphere and oceans will not yet have reached equilibrium.”

    So, I would most [90%} of TCR has shown up in present air measurement
    So my TCR is .1 to .5 C for doubling CO2, and that means what already shown up is .05 to .25 C and by +2060 AD will get other half of .05 to .25 C of TCR.
    This says:
    “..fifth assessment report, completed in 2014, gave a likely ECS range of 1.5C to 4.5C of warming for a doubling of atmospheric CO2 concentrations, but a likely TCR of only 1C to 2.5C.”
    I am saying 1/10th of fifth assessment report for TCR.
    But the fifth assessment report would saying we have already got
    .5 to 1.25 C of warming from the TCR.
    And it seems to me, if we actually got .5 to 1.25 C of warming from CO2, we could have measured that much.
    Instead, IPCC says they highly confident that rising CO2 has at least warmed by .2 C.
    Or IPCC is highly confident, I am correct with the range of .05 to .25 C, as .25 C is more than .2 C.

    Now, as I have said endlessly, warming the entire ocean would have large effect, but takes a long time to warm the ocean. And I would count warming of top 2 meter of ocean as “weather”- and I don’t think we have measured this, anyhow. Above says:
    “For example, the extra heat trapped by a doubling of CO2 will take decades to disperse down through the deep ocean.”
    I agree decades- though also, more than century, or even centuries.
    And then got the third thing:
    “A third way of looking at climate sensitivity, Earth system sensitivity (ESS), includes very long-term Earth system feedbacks, such as changes in ice sheets or changes in the distribution of vegetative cover.”
    I think greening desert could add about 1 C, and will not happen soon, unless we green the deserts. And I think most important desert to green, would be the Sahara Desert. And could take about 50 years to do this.

    [Looking at chart: 1990 AD: about 356 to 2019 AD: 416 or 30 years at 2 ppm per year totals +60 ppm and 40 years = 80 ppm and 416 + 80 = 496 ppm . And about 500 ppm by +2060]

    But in terms world ending within 10 years, or stopping .3 C in next 10 years. I don’t see how CO2 levels are adding this much. Or we are at .13 C per decade and could decline rather add to the .13 C per decade.
    And of course, Govt action has going in the wrong direction to lower CO2 levels {And think they increase CO2 with bad policies} Or Govt might focus of natural gas and/or nuclear power, but this takes time to do. And I have not seen anything serious in regard by any govt.

    It seems if you want to do anything within 10 years, we should explore the Moon- but this likewise has low amount govt actions- or even, certain degree of neglect.

    • Clint R says:

      The problem with all these “climate sensitivities” is they are based on the false belief that CO2 warms the planet. So they are invalid guesses based on false beliefs.

      That ain’t science.

      • gbaikie says:

        Clint, we live in a cold world, and we are heading towards a glaciation period.

        “That aint science.”
        Well, you shouldn’t expect a government “to do science”.
        And “things are just the way they are” is not related to science.

        I am not sure what your point “about it” is, my guess is you think, it’s the sun, stupid, and the molten rock, called Earth is cooling.

        I think the effect of CO2 levels are small- but this doesn’t seem to differ from what is mostly currently claimed about CO2 effects.
        CO2 is said to be a weak greenhouse gas.

        I think an important question is what causes cooling and a good starting point related to this, is what caused the cooling related to the Little Ice Age- which seems to have begun somewhere around 1250 AD and regarded as to ended in 1850 AD.
        It seems that some time before 1250 AD, Greenland had warmer conditions.
        And that northern hemisphere has become warmer, mostly after 1850 AD. And most people live in Northern Hemisphere and we have more data and records in terms centuries of time, in regards to the northern hemisphere. And in terms of tropical region, the seasons, mostly are related the rainy and less rainy seasons.

        • gbaikie says:

          “In the last millions years Earth’s climate has alternated between ice ages lasting about 100,000 years and interglacial periods of 10,000 to 15,000 years. The new results from the NEEM ice core drilling project in northwest Greenland, led by the Niels Bohr Institute at the University of Copenhagen show that the climate in Greenland was around 8 degrees C warmer than today during the last interglacial period, the Eemian period, 130,000 to 115,000 thousand years ago.

          “Even though the warm Eemian period was a period when the oceans were four to eight meters higher than today, the ice sheet in northwest Greenland was only a few hundred meters lower than the current level, which indicates that the contribution from the Greenland ice sheet was less than half the total sea-level rise during that period,” says Dorthe Dahl-Jensen, Professor at the Niels Bohr Institute, University of Copenhagen, and leader of the NEEM-project.”
          https://www.sciencedaily.com/releases/2013/01/130123133612.htm

          So, 4 to 8 meters higher than today. Greenland ice sheet “a few hundred meters” lower. And would tend to think it flowed faster, or less dry/cold glacial ice/snow. Ie: Could snow more and flow more.
          And evaporate more. But roughly not really changed, much.
          But as said above, the Canadian islands could have had a lot less glacial ice. Could prove this wrong, if that glacial ice was old.
          And maybe there are ice cores, but maybe not. Can’t recall any mention of it.
          Also, after this, we had the biggest and baddest continental ice sheet- which we are still rebounding from.
          So, Greenland 8 C colder and Antarctica 10 C colder.
          Why?

        • Gordon Robertson says:

          gbaikie…”And that northern hemisphere has become warmer, mostly after 1850 AD”.

          ***

          As you pointed out, the Little Ice Age ended circa 1850. Makes sense that the planet should begin re-warming, right?? Not according to the IPCC, who claimed the re-warming was caused by CO2.

    • Gordon Robertson says:

      gbaikie…”The Earths climate takes time to adjust to changes in CO2 concentration. For example, the extra heat trapped by a doubling of CO2 will take decades to disperse down through the deep ocean”.

      ***

      How does CO2 trap heat? Heat is the kinetic energy associated with atoms, so how do atoms/molecules trap atoms?

      The glass in a greenhouse can trap atoms, and the greenhouse gets hotter as a result. CO2 cannot trap heat. In fact, the IR it can absorb was created at the surface where the heat associated with it was lost. Beyond the surface, radiation cannot represent heat.

      This is the conservation of energy principle in practice. Heat energy in the atoms of the surface is converted to electromagnetic energy and EM is not heat.

      The entire AGW theory is fraught with such inconsistencies.

      • gbaikie says:

        Well, if CO2 traps heat, it seems it would only do it for short period of time. Minutes at most if not matter of seconds.
        Now compared to kinetic energy of velocity of air molecules, I would tend put the time at hours- or maybe more.
        Or I would say for CO2 to trap heat, in a significant way it might have something to with some connection with kinetic energy of velocity of 10 tons of air per square meter.

        But it seems obvious to me that the ocean can trap heat for thousands of years. And even the cold ocean of 3.5 C, holds vast amount of heat.
        It seems people will say the ocean is warmer than the Land, due to the ocean surface [which they don’t mean skin surface] holds more heat.
        But it’s commonly said that 2.5 meters of ocean surface holds as much heat as entire atmosphere.
        I would turn that around a bit, and say ocean surface doubles amount of heat as compared to a land surface. Though I know water vapor can hold a lot heat [latent heat].
        But I would go the numbers that entire ocean has about 1000 times more heat than the atmosphere, and the entire ocean temperature is actually the global surface temperature and global climate is very long durational issue.
        And it’s commonly said, to measure global temperature it meeds a minimal of 30 year period of time.
        Or rather than it’s the sun, stupid, I would say it’s the ocean, stupid.

  80. Entropic man says:

    Militarily the Russian attempts to flatten Mariupol made little sense if they wanted to capture the city easily.

    They have forgotten the Stalingred lesson, that a ruined city is much easier to defend.

    • Willard says:

      It’s all about getting access to Crimea by land.

    • Gordon Robertson says:

      The neo-Nazi Azov battalion is based in Mariupol, basically because they are zealots and one of the only battalions in the Ukrainian army willing to do house to house fighting. They are reported to be holding civilians hostage in the city.

      When the Russians tried to evacuate people from Mariupol, the western media claimed they were taking them to camps and for forced labour. That’s Ukrainian propaganda straight from Zelensky, the actor.

      With regard to WWII, how else would you attack a city held by the enemy? The Allies flattened Caen, in Normandy, because it was held by German panzer divisions.

      Ask yourself this. The civilians in Mariupol are on the side of the Russians, yet the Russians are fighting Ukrainian forces in the city. Makes no sense. You have swallowed western media propaganda.

      • Willard says:

        C’mon, Gordo.

        Not again –

        https://youtu.be/hgGHnxU4VIE

        Just wait till you realize what the ZZ did to Kharkiv today.

        • Gordon Robertson says:

          Kharkiv is right next to the Russian border and is part of the area being defended from the Russians by Ukrainian neo-Nazi battalions. As long as they continue to be in that area, the Russians will attack.

          The Ukrainian government in Kyiv could have fixed the problem a long time ago were they democratic. Unfortunately they are under the influence of neo-Nazis and not inclined to making democratic decisions.

          • Willard says:

            C’mon, Gordo –

            You keep repeating the same crap over and over again. Crap you don’t even check. Crap that is mostly ZZ propaganda.

            Your beloved ZZ’s are known to plant cluster bombs:

            Later on 28 February, Human Rights Watch stated that Russian forces used cluster bombs in the Industrialnyi, Moskovskyi, and Shevchenkivskyi districts of the city. Human Rights Watch noted that the use of cluster bombs is prohibited by the 2010 Convention on Cluster Munitions and that their use “might constitute a war crime”, due to the threat they pose to civilians.

            https://en.wikipedia.org/wiki/Battle_of_Kharkiv_(2022)

        • Nate says:

          Again Gordon, you think the presence of a neo-Nazi group in a country is justification to invade, bomb, and destroy that country?

          Shouldnt we have done that when neo-Nazis gathered in Charlottesville?

  81. TYSON MCGUFFIN says:

    Gordon Robertson 4/16/22 at 9:40 PM Says:
    “The idiot maguff, you loses every debate he has with me, now tries to link me to drugs. He even uses a loser like Keith Richards as his authority figure.”

    GR, I apologize for assuming that your cognitive deficits are manifestation of damage to your brain’s frontal lobe from substance abuse.

    I should simply take it at face value; you just don’t know the first principles of science or its language.

    “The light collected at the Webb telescope receiver is there right now. It does not represent a source in the past, it represents electromagnetic energy in the here and now https://www.drroyspencer.com/2022/04/explaining-mauna-loa-co2-increases-with-anthropogenic-and-natural-influences/#comment-1246465.”
    Ecce signum.

    • Gordon Robertson says:

      maguff…[GR]”The light collected at the Webb telescope receiver is there right now. It does not represent a source in the past, it represents electromagnetic energy in the here and now”

      ***

      What is it about your brain that cannot take this in? How do you think receptors in the eye collect light? Hopefully, you don’t think the receptors are seeing something billions and billions of miles away.

      We can see only the light that reaches receptors in the retina. When light is cut off in a totally dark room, we can see nothing.

      The light reaching us from stars is the light right there which excites rods and cones in our retinas. A telescope like Webb operates in a similar manner with the exception it requires receptors to collect the light and convert it to digital data for transmission to Earth. Those receptors are receiving stellar EM in real-time, not at some time in the past.

  82. TYSON MCGUFFIN says:

    On Easter 2022:

    If Christians truly believe we’ve been given responsibility – “dominion” – over every living thing on this planet, as it says at the very beginning of Genesis, then we won’t only objectively care about climate change. We will be at the front of the line demanding action because it’s our God-given responsibility to do so. Failing to care about climate change is a failure to love. And what is more Christian than to be good stewards of the planet and love our global neighbor as ourselves?

    • Clint R says:

      Tyson, you knowledge of the Bible appears to be about as lame as your knowledge of science.

    • gbaikie says:

      “And what is more Christian than to be good stewards of the planet and love our global neighbor as ourselves?”

      Becoming spacefaring?
      And/or going to heaven?

      One of the biggest climate change is related to the Sahara desert, becoming mostly grassland, and then becoming mostly a dry desert.

      “We will be at the front of the line demanding action…”

      What does demanding action mean in regards to the Sahara desert?

      It seems to me, most people might imagine demanding action, is something along the lines of telling government to do something.

      If not that, what is it?
      And…demanding fools to be more foolish, seems a bit crazy.

      But what is message: more grassland, or less grassland?
      As it’s changed in both directions.

      And of Christ, it’s what you do [wasn’t about making Roman leadership do the right thing].
      So, what is the temperature of Venus if at Earth distance from the Sun?

    • Ken says:

      “Failing to care about climate change is a failure to love.”

      Derp.

      • Gordon Robertson says:

        Just reading a book on Mao and the Stalinist system he was forced to use as a model. The quotation above, wherever it originated, is typical of Stalinist propaganda.

        Pretty soon, of the eco-weenies have their way, Gulags will be opened for the great-unwashed.

    • Gordon Robertson says:

      maguff…”If Christians truly believe weve been given responsibility dominion over every living thing on this planet, as it says at the very beginning of Genesis, then we wont only objectively care about climate change. We will be at the front of the line demanding action because its our God-given responsibility to do so”.

      ***

      One message of Jesus was that of helping the poor. Climate change orthodoxy will make the poor poorer, all based on a theory based in political-correctness.

      We would be far better focusing on fixing the housing crisis so the less fortunate can afford a shelter.

    • gbaikie says:

      I don’t think CO2 emission is much of problem.
      I don’t solar panels and wind power is good way
      to provide national electrical energy needs. Though in some situations they can work- particularly in remote locations far from
      an electrical grid. But in terms of lower CO2 emission and
      providing electrical energy to nation, it seems solar and wind
      don’t work.
      I think we will eventually get ocean settlement and I think this
      could happen soon rather later.
      So an ocean settlement is isolated from a grid, but I don’t think
      wind or solar power would good solution for electrical needs of
      ocean settlements.

      One thing I could regard wind power on the ocean being somewhat
      useful is they might establish ‘by accident” being able to own ocean
      property. I would rather such property rights not happen by accident or I regard it as continuation of stupid political leadership and it would be better to do it, not as series of accidents. I prefer, something one could call reasonable planning. Or something I would call, governance.

      But if you unreasonably have unwarrented hope that solar and/or wind might become a reasonable way to get national electrical needs, it seems you should try to more fully understand your unreasonable hobby.
      But the danger of doing this, is you probably find out, they don’t work.

  83. gbaikie says:

    The Jews Who Didnt Leave Egypt
    https://www.tabletmag.com/sections/news/articles/the-jews-who-didnt-leave-egypt
    linked from: https://instapundit.com/
    “…the text should be understood to be saying that only one-fifth of the Jewish people chose to leave Egypt.”

    [Hmm, I tend to think only 1/1000th of Earth population [or less] will go to Mars. Though I am not necessarily saying it’s related the Jewish exodus.
    But what could related, is, I tend to think, the religious are more likely to go to Mars and/or if religious, they might have higher chance of being successful.Though, also it’s not very analogous, or it could be the 40 years in desert as being global “reality show”- and it seems to me, any reality shows tend to be, train wrecks.
    Though these people might start out “non-religious” and become religious, quickly.]

  84. gbaikie says:

    China’s ‘space dream’: A Long March to the Moon and beyond
    “The return to Earth of three astronauts on Saturday after six months at China’s new space station marks a landmark step in the country’s space ambitions…”

    I was wondering how to “save China” and what could China do in space.
    I haven’t given it much thought, but it seems any country or entity could do a big wow, with an artificial gravity station.
    As said before, Musk should do one. And could do it really quickly and cheaply. Do it within month and not cost much.
    But such idea is more of demo/test thing- something one should do before doing the real thing.
    But a “real thing” might not be put in LEO. But if going to put in LEO, I would put in a zero inclination orbit. And China can’t do that- and only one who could do that is Europe.
    Europe’s spaceport latitude is “5 degrees 3 minutes north” or it’s closer to zero inclination one would getial with equator launch.
    But should test how to do a artificial gravity station, this doesn’t matter what inclination it’s in.

    Hmm, it seems a problem with China is there are not good with politics- and they don’t appear to want to be good at politics.
    I have some sympathy with the sentiment- but it’s not very practical.
    One could say it’s hard, to represent such a psychopathic regime in a good light, but one could probably find someone up to the challenge.
    In the best light, the China government are old men, who don’t want anyone on their lawn- someone talented probably could probably manage to sell that.

    • Gordon Robertson says:

      gbaikie…”I was wondering how to save China …”

      ***

      Just reading a book on the life of Mao. It’s interesting that he understood the impossibility of rushing toward the Stalinist model of communism and planned the initial phases as a democratic socialism. He was smart. Rather than try to force those onside who disagreed with Stalinist communism, he planned to ease them into it.

      I disagree strongly with that approach knowing what I know about Stalin today. At the time, Mao would only have the good side of Stalin available to him, if there was a good side at all. Stalin mistrusted everyone, including his own mother, I am sure.

      I think we tend to regard Mao as an omnipotent leader who was always the leader. Not so, he had to struggle with others for years to finally be recognized as leader of the Chinese communist party. His interest was never communism per se but regaining control over China’s destiny.

      He was hamstrung due to a lack of funding and arms. Those were supplied by Stalin and of course, it all came with a price tag. He had to implement Stalin’s vision of communism. That was not his decision alone, he was part of decision-making process whose members disagreed strongly with each other at times.

      An advisor to Roosevelt who was there as an observer, compared Mao’s forces hiding out in northern China as more of a social democracy than the communists they expected. Later, in WW II, the US began funneling funds to Mao, aimed at fighting the Japanese, much to the horror of Stalin.

      We have to be aware of the problems of establishing a democracy in a country which has never had one. Sun Yat Sen tried it in China circa 1915 and it failed dramatically because the Chinese did not trust such a system, never having encountered one.

      When asked about the purges associated with him, Mao calmly replied, “What else could I do”? He was referring to the colossal task of trying to deal with warlords, robbers, murderers, etc, who were operating openly in China as well as millions of peasants who had no intention of cooperating with the implementation of a communist order.

      That does not excuse him but it does bring into focus the immense problem of moving toward a democracy in a country like China. Those problems should not affect the modern Chinese communist party but watching the serious problems encountered in the Ukraine as they try to move toward a democracy, one can see the immense problems with China trying to move toward democracy.

      It would likely be chaos given the entrenchment of a Chinese oligarch system already established. Over the first 20 years of the Ukrainian pseudo-democracy, the Ukraine was regarded as the most corrupt country in Europe.

      Our western democracies all developed gradually and we were able to eventually establish some kind of order. Without that order in place, oligarchs tend to appear and with them every form of corruption imaginable. Look at Russia. We could have helped them in 1992 but for whatever stupid reason we abandoned them to their own fate.

      For cripes sake, Putin wanted to join NATO and we rejected him.

      That’s not to say we don’t have corruption in western democracies but they are generally governed by the law if they get too far out of line. When the law is part of the corruption, as in the Ukraine, you are doomed.

      • Willard says:

        > as in the Ukraine

        C’mon, Gordo.

        We already know Vlad’s playbook:

        The Republic of Georgia declared its independence in early 1991 as the Soviet Union began to fall apart. Amid this backdrop, fighting between Georgia and separatists left parts of the former South Ossetian Autonomous Oblast under the de facto control of Russian-backed but internationally unrecognised separatists. Following the war, a joint peacekeeping force of Georgian, Russian, and Ossetian troops was stationed in the territory. A similar stalemate developed in the region of Abkhazia, where Abkhaz separatists had waged a war in 19921993. Following the election of Vladimir Putin in Russia in 2000 and a pro-Western change of power in Georgia in 2003, relations between Russia and Georgia began to deteriorate, reaching a full diplomatic crisis by April 2008. On 1 August 2008, the Russian-backed South Ossetian forces started shelling Georgian villages, with a sporadic response from Georgian peacekeepers in the area.

        https://en.wikipedia.org/wiki/Russo-Georgian_War

        You don’t know anything because you never learning anything.

        Try a simple task. Say “Ukraine.” Not “the Ukraine.” Ukraine.

  85. Gordon Robertson says:

    rlh…”What are pulses?

    The start of a wave packet emitted 1, 2 and 5 seconds apart. Idiot”.

    ***

    To bring you up to speed and in the process reveal how you throw out insults without understanding the context, I must point out the origin of the pulses nonsense.

    I wrote in a post that the light we receive from stars is not out where the star appears to be but at the retina of the eye receiving it. That means the light both at the eye and at the Webb telescope is being received in real-time, in the here and now, not at some fictitious time in the past.

    The real idiot, maguff, replied with a link to an article talking about pulses, which had nothing to do with the EM waves emitted by stars. The pulses suggested a distance between waves of EM in the order of kilometres.

    That revealed maguff as a serious idiot and you as an even bigger idiot for defending him. The actual distance between EM wave fronts is measured in a fraction of a micron. Anyone with first year physics could have figured that out.

    • RLH says:

      “That means the light both at the eye and at the Webb telescope is being received in real-time, in the here and now, not at some fictitious time in the past”

      We always see things in the past. You admitted that we see the Sun some minutes in the past. The stars/glaziest that the JWT sees are that which was emitted many millennia in the past.

  86. Gordon Robertson says:

    willard the rat…”You divert Binnys point that Nazis fled Europe by pointing out a Wiki entry where we see black and white that Stalin employed the very playbook Vlad uses”.

    ***

    And we, the Allies, used the same tactics in France and Italy. We flattened cities that were harbouring the German army. We bombed German and Japanese cities into oblivion to scare them into surrendering.

    War is a seriously ugly affair. I do not condone the killing of innocent civilians but I am also pragmatic about war. If you don’t follow what works you stand a good chance of losing. Civilians are always the losers.

    If the Allies had not flattened Caen, we’d still be there on the beaches of Normandy. It’s ugly, seriously ugly, beyond human understanding, but in war, it is a necessity.

    I don’t care about Putin’s motives, I know no more about them than you. However, you are blaming him, after he showed immense patience for 8 years while the Ukrainians fought a civil war on his border, instigated largely by Ukrainian nationalists, who have fascist sympathies.

    You mentioned neo-Nazi pro-Russian forces in eastern Ukraine. Have no doubt about it, if Putin takes over in those areas, the neo-Nazis on either side will disappear. The pro-Russian neo-Nazis you mentioned were outlawed in Russia in 1998.

    If Putin wanted the Ukraine, he would have attacked 8 years ago after they ousted a democratically-elected pro-Russian president. Instead, he held talks with Obama, of all people, and actually felt encouraged about the way the talks were going.

    Dumb move. He should have known that the Obama admin had no intention of honouring any agreement via word of mouth. Obama couldn’t even support his own forces in Iraq or Afghanistan. He did everything to help out the terrorists, going so far as to declare terrorist killing in the name of religion to be OK.

    • Willard says:

      C’mon, Gordo.

      Here is you:

      [GORDO] I don’t care about Putin’s motives

      Here is also you:

      [ALSO GORDO] If Putin wanted the Ukraine

      And you still write “the Ukraine” like a brainless Tankie:

      “The Ukraine” is incorrect both grammatically and politically, says Oksana Kyzyma of the Embassy of Ukraine in London.

      “Ukraine is both the conventional short and long name of the country,” she says. “This name is stated in the Ukrainian Declaration of Independence and Constitution.”

      The use of the article relates to the time before independence in 1991, when Ukraine was a republic of the Soviet Union known as the Ukrainian Soviet Socialist Republic, she says. Since then, it should be merely Ukraine.

      https://www.bbc.com/news/magazine-18233844

      Think.

  87. Willard says:

    > I do not condone the killing of innocent civilians but

    Everyone can see the ZZ bombing Mariupol. The ZZ themselves say they’re bombing Mariupol. What does Gordo the Pragmatist do? He refuses to believe it because of how he interprets Vlad’s mind states. And of course he’ll pretend not to care about Vlad’s mind states!

    Here’s what’s coming in Ukraine if Vlad gets his way:

    Ethnic cleansing of Georgians in South Ossetia was a mass expulsion of ethnic Georgians conducted in South Ossetia and other territories occupied by Russian and South Ossetian forces, which happened during and after the 2008 RussiaGeorgia war. Overall, at least 20,000 Georgians were forcibly displaced from South Ossetia.

    https://en.wikipedia.org/wiki/Ethnic_cleansing_of_Georgians_in_South_Ossetia

  88. Willard says:

    > if Putin takes over in those areas, the neo-Nazis on either side will disappear

    Gordo is a True Believer:

    Russia has long been known to utilize military proxies to wage deniable or so-called gray zone warfare and promote the Kremlins interests in foreign conflicts. The most notorious of these proxies is the Wagner Group, a private mercenary group created in 2014 by Yevgeny Prigozhin, an oligarch with close ties to Vladimir Putin, which Russia has previously deployed in places like Syria, Libya, and Mozambique. The Wagner Group itself has been described by some as “an opaque network of titular companies and private military contractors that simultaneously further the Kremlin’s interests abroad.” Named after the German composer Richard Wagner,25 Adolph Hitler’s favorite musician, the group is rife with Nazi imagery. Wagner’s leader, Dmitry Utkin, reportedly is adorned with numerous Nazi tattoos, including a swastika, a Nazi eagle, and SS lightning bolts. Furthermore, the groups foot soldiers have lec behind neo-Nazi markings in the war zones where they have operated.

    https://thesoufancenter.org/wp-content/uploads/2022/04/TSC-Special-Report_Ukraine_April-2022.pdf

    • Swenson says:

      Willard,

      Sure you haven’t been sucked in by a disinformation campaign?

      Or maybe US and UK intelligence are so incompetent that that cannot find any useful evidence of the organisation. Surely, the CIA could easily get rid of the swines, if they exist. Maybe those cunning Russkies are too clever for the Western bumblers.

      Why don’t you send the Wagner group an email, or ring their head office and give them a severe dressing down?

      You really are a gullible wee chappie, aren’t you?

      Believe in ghosts and goblins as well, do you?

    • Gordon Robertson says:

      Private armies (PMCs = private military companies) or mercenaries are available in many country, including the US and the UK. There is no control over how they behave or where their political sympathies may lie.

      In the Ukraine, the Azov battalion was created and sponsored by a Ukrainian politician, Andriiy Biletsky, a known white supremist with neo-Nazi sympathies.

      The US Congress washed their hands of them when they found out they were neo-Nazis. Apparently they are OK with you.

      Much of the US forces’ support is now provided by private companies who specialize in ripping off the US taxpayer.

  89. gbaikie says:

    After launch pad test failure in 2016 [which resulted loss rocket and
    satellite payload, SpaceX falcon rocket has successfully launched
    119 rockets, 116 falcon-9 and 3 falcon heavy:
    https://www.statista.com/statistics/1266914/spacex-number-of-launches-by-type/
    And it seems SpaceX on track to launch a rocket per week or about 50 rockets per year, though Musk wants to do 60 and wants launch Starship in terms of test launch which is unlikely to successful in reuse the first stage, nor much hope of safely landing the second stage which is planned to land/crash into the ocean near Hawaii.
    And in 2020 launched 26, and in 2021 launched 34 per year, with 10 falcons launched so far in 2022.
    What found interesting or a bit surprising is number reused or “used Falcon 9” of this total 119 rocket which were used.
    Or another way to say it, very few new Falcon 9 rockets are being launched.
    Anyways having 50 falcon 9 launches in year, is not something I expected, nor is already having 34 launches in a year, imaginable only say, 5 years ago. I thought 20 per year would be impressive or hard to manage.
    But the Starship kind of hides what Falcon 9 has done, or obsession is the Starship- huge rocket and planned to be fully reusable.
    Of course with Falcon 9, every one of the launches has new second stage- or SpaceX making a lot of new Falcon 9 second stage rockets.

  90. gbaikie says:

    Blade-Runners: Wind Industry Illegally Dumping Discarded Turbine Blades Across America
    https://stopthesethings.com/2022/01/27/blade-runners-wind-industry-illegally-dumping-discarded-turbine-blades-across-america/

    I wonder what Europeans doing about it.
    Would ocean wind farms just dump it in the ocean.
    Don’t know if that a good or bad idea.

    • Nate says:

      This is a classic Whataboutism.

      How does that compare in magnitude to the pollution produced by coal on land, water and in the air?

      • stephen p anderson says:

        There is no comparison. CO2 isn’t pollution. The only pollution coming out of your mouth is your words.

        • Willard says:

          Perhaps you prefer:

          In the United States, this method of coal mining is conducted in the Appalachian Mountains in the eastern United States. Explosives are used to remove up to 400 vertical feet (120 m) of mountain to expose underlying coal seams. Excess rock and soil is dumped into nearby valleys, in what are called “holler fills” (“hollow fills”) or “valley fills”.

          https://en.wikipedia.org/wiki/Mountaintop_removal_mining

          • stephen p anderson says:

            That’s none of my business or yours. It is for the people of Kentucky, Virginia, Tennessee, West Virginia, Pennsylvania, and Ohio to make those decisions. If they’re good with it, then so am I. It is none of the Deep State’s business either.

          • Willard says:

            Funny you didn’t reply to gb’s “I wonder what Europeans doing about it” the same way, Troglodyte.

            I wonder why.

        • stephen p anderson says:

          Because it’s none of my business what the Europeans are doing about it?

      • gbaikie says:

        Ship wrecks can considered underwater parks.
        I don’t know enough about waste from wind mills,
        could they be used for underwater parks?

        Dragging wind mill waste to ocean could be unnecessary,
        but with wind mills in ocean, it seems it would happen,
        a question is should it happen and how should be done.

  91. TYSON MCGUFFIN says:

    God said, Let us make man in our image, after our likeness: and let them have dominion over the fish of the sea, and over the fowl of the air, and over the cattle, and over all the earth, and over every creeping thing that creepeth upon the earth. (Gen. 1:26).

    In its highest form, the meaning of dominion includes a sense of service to one’s fellow creatures and even a compulsion to protect those who cannot protect themselves. It also includes responsible governance and stewardship, which is defined as an individual’s responsibility to manage his life and property with proper regard to the rights of others.

    Just as most of us wouldn’t commit the small sin of throwing garbage into our neighbor’s yard, we can reconsider participating in or supporting activities that release waste into the air or water or ground or somewhere “away.” Realizing that those actions have an impact on a neighboring country or fellow creature strengthens our desire to act wisely.

    It naturally follows that instead of ignoring careless or illegal acts in our own area or beyond, it’s more beneficial for everyone (including us) to recognize that all people can exercise intelligent caring for the world.

    If we identify ourselves as God’s sons and daughters, having dominion over ourselves and our environment, we will be led to decisions that are supportive of our surroundings.

    • Ken says:

      Are you trying to say we, in our Western Democracies, aren’t acting responsibly in the exercise of Dominion over the earth? As opposed to countries that don’t have a high enough living standard due to lack of access to cheap reliable energy from fossil fuels so as to be able to afford to give a damn about the environment?

    • Gordon Robertson says:

      maguff…”If we identify ourselves as Gods sons and daughters, having dominion over ourselves and our environment, we will be led to decisions that are supportive of our surroundings”.

      ***

      You are mixing a religious belief system with science. Newton pulled it off quite well but when it came to science, he did not use the Bible as a source.

      Your argument above does not address the scientific theory that we humans are causing catastrophic warming and climate change. It also doesn’t address what Ken is talking about, where other nations are presumed to have the same ability for dominion. Neither does it address the problem that much of the world does not believe in the Bible.

      I agree with you about nations dumping crap in the oceans but as far as dumping CO2 in the atmosphere, thus far, the atmosphere can easily handled it. We have to face the fact that we are dependent on fossil fuels and until we develop something to replace it, we are stuck.

    • Swenson says:

      TM,

      To which invisible God do you refer?

      Does God speak to you on a regular basis, or do you just believe what others say God has told them?

      Have you any objection to me believing in a different God or Gods, or even no Gods at all?

      Or do you believe that your belief in a minority God gives you dominion over others?

      Playing the religious high moral ground card may not produce the outcome which you desire.

      Keep it up, but dont be disappointed if the majority ignore you.

  92. TYSON MCGUFFIN says:

    Gordon Robertson 4/17/22 at 5:59 PM
    https://www.drroyspencer.com/2022/04/explaining-mauna-loa-co2-increases-with-anthropogenic-and-natural-influences/#comment-1247905
    Says:
    What is it about your brain that cannot take this in? How do you think receptors in the eye collect light? Hopefully, you dont think the receptors are seeing something billions and billions of miles away.
    We can see only the light that reaches receptors in the retina. When light is cut off in a totally dark room, we can see nothing.
    The light reaching us from stars is the light right there which excites rods and cones in our retinas. A telescope like Webb operates in a similar manner with the exception it requires receptors to collect the light and convert it to digital data for transmission to Earth. Those receptors are receiving stellar EM in real-time, not at some time in the past.

    GR, your comments reveal more than your default knee-jerk contrarianism; you just don’t know first principles of the science involved.

    First, considering that it takes light time to get to us, traveling at its set speed limit, it follows that we can only see the light of the stars that has had enough time to get to us since the beginning of time.

    Second, Doppler shift is a property of any sort of wave motion, and light is a wave (except for when it’s a particle). It is the same process that causes the sound of a train whistle to become higher pitched by squashing the wave when it’s coming toward you, and to become lower pitched by stretching the wave when it’s moving away from you.
    A Doppler shift also affects light, but instead of a pitch change, squashing and stretching light waves changes the color of light we see. More stretched-out light waves are redder and more squashed light waves are bluer.

    Third, the universe has been expanding for the 13.8 billion years of its existence. This expansion stretches the light waves traveling across it and the further light travels in the universe, the more it gets redshifted.

    Fourth, the universe has expanded so much that the visible light from the most distant stars has been stretched beyond visible red light into infrared and microwaves.

    Fifth, these waves are invisible to our feeble human eyes.

    Ask yourself this: would the night sky would still be dark if what I said above didn’t hold?

    • Gordon Robertson says:

      maguff…why don’t you try addressing the problem rather than trying to explain science I learned in first year and in my astronomy classs? I stated that light we see from stars must be at our retinas, otherwise we would not be able to see it. Can you not just say, “OK, I got it”, rather than offering an obfuscated theory of the Big Bang?

      I’ll respond to your points.

      “First, considering that it takes light time to get to us, traveling at its set speed limit, it follows that we can only see the light of the stars that has had enough time to get to us since the beginning of time”.

      ***

      The beginning of time??? Where’s your proof there was a beginning? I am not trying to be mean, I am trying to get you to think beyond the propaganda in which we are all immersed. Do you really believe that malarkey about a Big Bang marking the beginning of time?

      Try to look at this as if time does not exist, which it doesn’t What do you see? How would you explain the universe without time?

      Start with something simple. What were you doing an hour ago, a day ago, or a year ago? What has changed physically with regard to time? Can you not see there is no time factor involved?

      *******************
      “Second, Doppler shift is a property of any sort of wave motion…”

      ***

      I am fully conversant with Doppler shifting. A body moving toward us or away from us, stretches/shrinks the wavelength. With sound it changes the audio frequency so we hear a tone changing in frequency. With the light, a known spectrum like that emitted from hydrogen, shifts toward the red or blue end of the spectrum. All stars have hydrogen spectra.

      However, astronomers and theorists, in a state of utter boredom, have tried to give more meaning to light frequency shifting in the universe. They have tried to imply it means motion from a centre. Problem is, no one has any idea how large the universe is, or where the centre may be.

      ***********************
      “Third, the universe has been expanding for the 13.8 billion years of its existence. This expansion stretches the light waves traveling across it and the further light travels in the universe, the more it gets redshifted”.

      ***

      Two points…

      1)Some stars are showing a blue shift. Don’t forget, we are located to a spiral arm of a galaxy, which could easily explain red/blue shifts.

      2)There is not a shred of evidence that the universe has been expanding from an epicentre. Furthermore, there is not a shred of evidence as posited by the BB theory that matter can be produced out of nothingness.

      **********************************
      “Fourth, the universe has expanded so much that the visible light from the most distant stars has been stretched beyond visible red light into infrared and microwaves”.

      ***

      Seriously, is that the best theory they can come up with? Where are these observation being performed? From Earth, right? Where is Earth placed in the universe? How large is the universe? Where is the centre from which this expansion is taking place?

      Have you read the entire theory? One part suggests the Universe collapsed on itself, reaching a density where it simply disappeared. Then magically, it reappeared in a Big Bang. These idiots prophecy another BB when the expansions slows enough that a mysterious gravity will start it contracting back to nothingness.

      Seriously, why do you believe this nonsense? Why should all the mass in the universe collapse into a dense mass that disappears? No one has ever seen that happen in physics and no one has seen mass appear out of nothing.

      This is E = mc^2 gone bad. Einstein claimed that energy, E, could be converted to mass, and I suppose it works backwards. Where is the proof?

      *************************

      “Fifth, these waves are invisible to our feeble human eyes.

      Ask yourself this: would the night sky would still be dark if what I said above didnt hold”?

      ***

      They are invisible until they strike the retina. That’s because the various frequencies of EM stmulate the retina in different ways. Even then only EM frequencies between IR and UV can stimulate the retina.

      That’s my point, none of the light from a star can be seen until a wavefront from the star is sampled by the lens and focused on the retina. We can see no light between the retina and the star. What we are seeing is light AFTER it has traveled light years from the star.

      If you examine the light hitting the retina at any instant, then you observe the light waves back to the source at the same instant, they are all in the here and now. Time has nothing to do with it, we are looking only at an immense space existing in the same instant.

      • TYSON MCGUFFIN says:

        GR, I’ve said all I’m going to say about this. It’s pointless discussing science with you.

  93. AaronS says:

    To the original post. Basically the ocean degassing and lags between global temperature and ECS explain this discretion nicely.

    Is this dragon slaying? Who is really on the other end of this debate?
    I should read the comments and see if this ruffled any feathers of rational birds.

  94. stephen p anderson says:

    Found a video describing Chihuahua, Eman, Nate, Blinny, B4, TM, Droege, et.al.

    https://tinyurl.com/ybk33ay8

  95. gbaikie says:

    Re: saving China:
    China Censors Its Own National Anthem amid Growing Unrest with Coronavirus Lockdowns
    https://www.breitbart.com/asia/2022/04/18/china-censors-its-own-national-anthem-amid-growing-unrest-with-coronavirus-lockdowns/
    Linked from: https://instapundit.com/

    “Sina Weibo, the heavily censored Chinese alternative to banned Twitter, appears to have banned a hashtag that quotes the Chinese national anthem to criticize coronavirus lockdowns. It also appears to have blocked searches for the lyrics to the anthem.”

  96. Brandon R. Gates says:

    test

  97. gbaikie says:

    “Shanghai residents are increasingly terrified of testing positive, even if they have no symptoms, and getting hauled off to one of the citys hundred or so grim quarantine centers, where they experience poor living conditions, minimal food, no privacy, lights that are never turned off and crowded environments peppered with visibly sick people that give them an excellent chance of contracting a more serious case of the highly contagious omicron variant of Chinese coronavirus.”

    I was going to ask whether anyone was hauled off outside of China.

    But then remembered nursing homes- so we had millions of people stuck in such places, and relatives being denied the right to visit them.
    And imagine many people were terrified about being moved into a nursing home. Or should have been, if they lived in New York, with the NY governer being an “award winning” governor.

  98. gbaikie says:

    Who knew so many would oppose the tanning of the testicles?

    OMG, this woman wrote an entire thread on why you cant tan your testicles:

    https://twitchy.com/samj-3930/2022/04/18/genius-troll-tucker-carlson-has-lefties-and-never-trumpers-caterwauling-about-testicle-tanning-and-lol-we-cant-even-make-this-up/

  99. Gordon Robertson says:

    rlh…”We always see things in the past. You admitted that we see the Sun some minutes in the past. The stars/glaziest that the JWT sees are that which was emitted many millennia in the past”.

    ***

    The human eye always sees in the present, only the human mind sees a past, as stored images in memory. If we want to talk about the past, we must retrieve information stored in memory or go to a history book, which is a set of stored memories.

    The Sun is not in the past. Just because we don’t get light from it till 8 minutes after it is emitted, does not place the Sun in the past. It’s the same with stars, no matter what the distance.

    Everything in the universe is doing whatever it does, right now. One of the those stars may be in the process of exploding into a supernova…right now. We won’t see the explosion at Earth for many light years. When it is seen, it will not be in the past, we will see a cloud of gases and debris typical of a supernova explosion in the state it is in several light years later…right now.

    Even though there is a delay of 8 minutes between light leaving the Sun and the time we receive it on our skin, and hopefully not directly in our eyes, the physical reality is that the Sun is located 93 million miles away in physical space. There is no physical time difference involved.

    The past can only ever exist within the human mind. Same with the future. There is no other state in the universe than the here and now.

    • Swenson says:

      GR,

      In the immortal words of Kung Fu Panda – The past is history, the futures a mystery. There is only now, and it is a gift. Thats why it is called the present.

    • RLH says:

      “The human eye always sees in the present”

      Except that you admitted that we see what happened on the Sun some minutes ago. Idiot.

  100. Gordon Robertson says:

    Getting back on topic, I was just watching a program on TV called Fatal Forecasts. They were talking about Arctic air which is now more scientifically called the Polar Vortex. The claims being made about it by alarmist scientists is astounding.

    Arctic air has descended on us here in Vancouver, Canada for years and years. It’s cold air moving south from the Arctic regions. It’s weather. Because the year 2014 had a particularly severe intrusion of Arctic air, going as far south as Florida and California, followed by another in 2021, alarmists are now claiming the cause is climate change. They claim it can be fixed by reducing carbon emissions.

    I wrote to one of the scientists interviewed, a Dr. Judah Cohen, who currently works out of MIT, and asked why none of them talk about the cause of Arctic air. None of them mention that it is caused by the tilt of the Earth and its position in Earth orbit that produces little or no sunlight in the Arctic winter.

    None of them pointed out the obvious. When the Arctic no longer has solar input, cooler air from the stratosphere descends into the Arctic, and sometimes as far south as Florida. The stratosphere is at its thinnest near the poles, between 4 and 12 km altitude. For comparison, Mt. Everest peaks a bit above 8 km.

    Thanks to ren for this initial information on the stratosphere.

    Another scientist in the program claimed the greenhouse effect of a real greenhouse is produced by infrared radiation being trapped in the greenhouse. He did not explain how trapped infrared can warm the air in the greenhouse. That theory is, in fact, a myth.

    The air in a real greenhouse, made up 99% of nitrogen and oxygen, is warmed directly by the soil and infrastructure heated by SW solar energy. That heated air rises but the molecules of O2/N2 are trapped by the glass. This could very easily be verified by removing all CO2 and water vapour from a greenhouse and see if it still warms.

  101. gbaikie says:

    https://www.youtube.com/watch?v=vRb-egOaWg4

    Right now Russia making their major move. Who knows what going to happen, other lots soldiers on both sides will be killed within a week of time.
    And above clip has russia clip where some women want the kind of censorship that China has {and she doesn’t like Youtube}.
    In past clips, it seems Russia news fully support this war against Ukraine. But since women wants censorship- maybe Russia people aren’t so keen on it as the media wants.

    • Gordon Robertson says:

      gb…why the Russians are flattening Mariupol….

      I’m sure they learned it from WW II and what the German army did to them or what the Allies did to French cities like Caen during the Normandy invasion.

      https://www.dw.com/en/the-azov-battalion-extremists-defending-mariupol/a-61151151

      • Gordon Robertson says:

        ps. and I’m sure, even though NATO is complaining, they are furiously taking notes as to what works and what doesn’t.

        I recall the Argentinian war over the Falklands. The US military was lending the UK weapons, like the Gatling-type machine gun used to deal with Exocet missiles. I am sure the Yanks were thrilled to see the technology work so well.

        I don’t recall any protest by the media when the UK nuclear sub sank the Argentinians General Belgrano warship with 323 lives lost. That was over a damned island in the South Atlantic.

        The irony here is that France helped the Brits as well but they also sold the Argentinians Exocet missiles, which wiped out several UK ships. They learned the hard way that warships made of aluminum actually burned.

        • gbaikie says:

          As far as I am aware, no NATO weapons [or food, medicine, or blankets] have gone to Mariupol.

          It’s possible this is being done, but that is not being reported by anyone.

          Most of Russian army as predicted in the video above and the heavy loses expected on both side is not going be near Mariupol

    • Nate says:

      Not sure why Gordon is rooting for mass murdering dictator..

  102. Gordon Robertson says:

    willard…”The Ukraine is incorrect both grammatically and politically, says Oksana Kyzyma of the Embassy of Ukraine in London”.

    ***

    Yeah, right…like I’m going to listen to some daft Ukrainian trying to teach me English.

    In Scotland, we have a soccer team called Glasgow Celtic. I pronounce it Seltic while the politically-correct call it Keltic. In English, a ‘c’ followed by an ‘e’ makes the c soft as in ‘s’, not ‘k’.

    In Latin, the plural of virus is virii. Since I don’t speak Latin, I say viruses.

    If you don’t like it, sue me. Or, I’ll send you a quarter so you can call someone who cares.

    • Willard says:

      > I’m going to listen to some daft Ukrainian

      C’mon, Gordo.

      You don’t listen to anyone.

      In fact, if you listened to yourself, you would cry in shame.

      Read harder:

      For most of the 20th century, English speakers referred to the Ukraine, following Soviet practice. That’s not the case now. Ukraine’s official name in English does not include the, and for good reason.

      Ambassadors, commentators and historians have tried to explain the change, but not everyone has gotten the message.

      So let me try. Im a linguistic anthropologist and an expert on language politics in Russia. Im also bilingual in Russian and English, so I understand the subtleties of the distinction.

      What is at stake? Nothing less than the political sovereignty of Ukraine.

      https://theconversation.com/its-ukraine-not-the-ukraine-heres-why-178748

      Keep on playing stupid. Your act is ZZ boot lickin’ good!

      • Gordon Robertson says:

        Are ye deef laddie? I said I don’t care.

        It’s ***THE*** Ukraine.

        • Willard says:

          C’mon, Gordo:

          The distinction is critically important for the sovereignty of the Ukrainian nation-state, suggesting as it does that Ukraine is either a bounded nation-state like Germany or a region of Russia with amorphous borders like the Caucasus. This is why, in 1993, Ukraines government asked Russias government to abandon the Soviet-era practice of referring to Ukraine as na Ukraine and use only v Ukraine. The na construction is, however, still widely used in Russia.

          https://theconversation.com/its-ukraine-not-the-ukraine-heres-why-178748

          If you don’t care, why should I?

        • RLH says:

          “Its ***THE*** Ukraine”

          Not GR knows better than the natives. Idiot.

          • stephen p anderson says:

            Eureka, Gordo is Putin!

          • Gordon Robertson says:

            rlh…beginning to wonder about your mental stability and comprehension. I just explained that I speak English (with a slight Scottish accent). In English, it’s ‘the Ukraine’.

            You see, many Europeans have trouble with the word ‘the’, especially Ukrainians. If you asked a Ukrainian to say, ‘The quick brown fox jumped over the sleeping dog’, he would first ask ‘Why fox jump over dog”?

            Ukrainians do not understand the word ‘the’.

            In Canada, if you are from Regina, on the prairies, you say, “I am from the prairies”. You don’t say, “I am from prairies”. If you do, they will think you are a Ukrainian from Winnipeg.

          • Gordon Robertson says:

            stephen…ah, you’re onto me.

  103. Willard says:

    Teh Gordo might not care for this:

    Intercepted radio chatter apparently consolidates claims that Russian troops committed atrocities in the town of Bucha, the German weekly magazine Der Spiegel has reported. It also said that the Russian mercenary unit called the Wagner Group played “a leading role in the atrocities.”

    https://www.newsweek.com/der-spiegel-russia-ukraine-troops-bucha-wagner-putin-1695974?piano_t=1

    • Gordon Robertson says:

      Were any of them there? The media makes money from these guesses.

      • RLH says:

        Are you saying there were no atrocities committed in Ukraine?

        • Swenson says:

          RLH,

          I don’t believe you can’t comprehend what Gordon Robertson wrote.

          Correct me if I’m wrong.

        • Gordon Robertson says:

          rlh…I’m not claiming anything, I just want proof of who did what.

          There are idiots fighting on both sides of the Ukrainian civil war. They tend to shoot and ask questions later. For all we know, the atrocities could be reprisals from within the Ukraine.

      • Willard says:

        > Were any of them there?

        The Gordo Just Asks Questions.

        Next he’s gonna ask for Hitler’s orders.

        Will he continue to deny that the Bucha Massacre happened?

        Let’s help him out:

        The image from 19 March, first reported by the New York Times and confirmed by the BBC, directly contradicts Russian Foreign Minister Sergei Lavrov’s claim that footage of bodies in Bucha, that has emerged in recent days, was “staged” after the Russians withdrew.

        The satellite image shows objects that appear to be bodies in the exact locations where they were subsequently found by Ukrainian forces when they regained control of the town north of Kyiv.

        https://www.bbc.com/news/60981238

  104. gbaikie says:

    Changes In Vegetation Shaped Global Temperatures Over Last 10,000 Years
    https://wattsupwiththat.com/2022/04/18/changes-in-vegetation-shaped-global-temperatures-over-last-10000-years/

    “Thompson had long been troubled by a problem with models of Earths atmospheric temperatures since the last ice age. Too many of these simulations showed temperatures warming consistently over time.

    But climate proxy records tell a different story. Many of those sources indicate a marked peak in global temperatures that occurred between 6,000 and 9,000 years ago.”

    Expanded vegetation during the Holocene warmed the globe by as much as 1.5 degrees Fahrenheit, Thompson said.”

  105. Nate says:

    Its Bart!

    “the rate of change still shows…”

    Nah, still doesnt with the relevant T.

    https://tinyurl.com/2p8r9rzc

    • Chic Bowdrie says:

      Who do you think you are fooling?

      The rate of CO2 change still tracks with temperature even with Had-crut data. The greater trend is irrelevant.

      https://tinyurl.com/2p956xm3

    • Bart says:

      Too dumb. No more time for you.

    • Nate says:

      “the greater trend is irrelevant”

      Explain that to Bart. He thinks it is. And he works hard to make the data behave as he desires.

      • Chic Bowdrie says:

        It’s hard to tell if you are obfuscating or misunderstanding, big time. Bart makes an obvious connection between the rate of CO2 change being in step with temperature change. You convolute a similar plot with a different temp data set to make it look like the correspondence no longer applies. But it is still there. The fact that Had-crut has a greater slope than UAH does not detract from correspondence despite you attempt to make it look like that.

        But that’s what you do. Your the King of Obfuscation.

      • Nate says:

        You are butting in not understanding, it seems, what Bart’s argument is.

        His argument has always been (he has been here many times) that both the short term variation of CO2 and the long term trend in CO2 are explained by T. And the same scale factor is supposed to fit both.

        The short term variation is well known to be correlated to ENSO, and has been shown to be due to specific pattern of warming and drying that El Nino creates in the tropics. It leads to reduced productivity of the tropical rainforest and reduced CO2 uptake.

        And the opposite during La Nina, greater rainforest productivity, greater CO2 uptake.

        The short term correlation, does not demonstrate ENSO or Temperature can explain the long term CO2 trend.

        The long term trend in CO2 derivative and Temperature are simply two things rising.

        • RLH says:

          “The short term variation is well known to be correlated to ENSO”

          and is larger than the effects of CO2.

        • Chic Bowdrie says:

          When possible, I will butt in whenever you obfuscate. However, in this case, I agree that ENSO and temperature correlation with the change in CO2 does not prove that either or both explains all the rise in CO2 alone. ENSO and temperature are highly correlated for obvious reasons.

          You are implying that Bart thinks that only temperature affects CO2 growth. Only Bart can confirm that and, if he agrees, he would need
          additional evidence to prove it, IMO.

          Clearly temperature/ENSO contributes to the yearly rise in CO2. The data and my physically-based model indicate the increase in CO2 is from FF emissions and other sources as well. My view is that you think that most, if not all, of any additional source is due to a Revelle factor. You claim this without having presented any data in evidence, only unverified assertions. I am working to evaluate the magnitude of your alleged push-back from any Revelle effect. I invite you to do likewise. Otherwise, you are the no data, no model, King of Obfuscation we have come to expect.

        • Nate says:

          “My view is that you think that most, if not all, of any additional source is due to a Revelle factor. ”

          Then your view of what I think, not surprisingly, would be wrong.

          The Revelle Factor is unrelated to additional sources.

          As explained several times, it explains the ocean bottleneck for CO2. Why CO2 added from an external source (like FF) is retained in the atmosphere, ocean surface, and biosphere, for a long time.

          You could read about it if you want to learn.

          I think that T rise will cause additional ocean outgassing and increase in CO2 of ~ 10 or 15 ppm.

          That leaves ~ 120 ppm to be explained. I think most of it is from FF.

          • Chic Bowdrie says:

            You have never explained how the Revelle factor creates a bottleneck with data. You always quote some reference which doesn’t explain it with data either. You are good at quoting dogma without data and referring to unverified models. My model shows that CO2 would return to steady state in less than 20 years with no increase in emissions.

            What you fail to learn is that the Mauna Loa data cannot be explained without an additional emission source or a decreasing absorp.tion rate.

            If you rearrange the formula for CO2 growth, deltaCO2 = FF + Inputs – Outputs or D = F + I – O, and substitute O = 20 * F you get I = 19 * F + D. Plug in values of F = 4, 4.5, 5 and D = 2, 2.25, 2.5 and notice that I, the non-FF input, increases from 78 to 97.5. With a spreadsheet, you can observe the same thing with the actual known annual values of FF and deltaCO2. D/F = 0.5, the relatively constant airborne fraction.

            With the additional inputs and a constant absorp.tion rate, the spreadsheet model indicates that removing all FF inputs decreases CO2 by only 16 ppm.

          • Nate says:

            “You have never explained how the Revelle factor creates a bottleneck with data. You always quote some reference which doesnt explain it with data either.”

            Ive explained it several times. The paper explains it well. The paper makes a falsifiable prediction, based on this theory, for the next 60 y. It passed.

            We have data showing that both the atmosphere, biosphere, and ocean surface have elevated carbon levels, while the deep ocean does not, as predicted.

            We have isotope evidence. We have the basic chemistry operating in the ocean, and data measuring the Revelle Factor all over the world.

            You could read about it. But if you don’t want to learn and understand, then I cant make you.

            Many others have found this model or similar can explain Earth’s carbon cycle.

          • Nate says:

            “What you fail to learn is that the Mauna Loa data cannot be explained without an additional emission source or a decreasing absorp.tion rate.”

            It WAS explained by the Bolin and Erickson paper. If you didnt bother to read it, why are you making this claim?

            “If you rearrange the formula for CO2 growth, deltaCO2 = FF + Inputs Outputs or D = F + I O, and substitute O = 20 * F you get I = 19 * F + D.”

            Why would I put O = 20 * F? Evidence for that?

            “Plug in values of F = 4, 4.5, 5 and D = 2, 2.25, 2.5 and notice that I, the non-FF input, increases from 78 to 97.5.”

            Sure based on the unproven presumption that O = 20*F.

            Again. Your factor of 20, I think, comes from the annual exchanges of of carbon between the non-deep-ocean reservoirs.

            The BE paper, and recent papers, do not dispute that there are large annual exchanges of C between these.

            The issue is that that C is not removed to the deep ocean because of the bottleneck. It continues to be a NET addition to these reservoirs, which results in ~ 40-50% remaining in the atmosphere for a long time.

          • Chic Bowdrie says:

            “The paper explains it well. The paper makes a falsifiable prediction, based on this theory, for the next 60 y. It passed.”

            Indulge me. What paper are you talking about? Bolin/Erickson? What data shows “it passed?”

            “We have data showing that both the atmosphere, biosphere, and ocean surface have elevated carbon levels, while the deep ocean does not, as predicted.”

            We only have MY data in MY model. You have no data, only allegations that somebody else does, and you seem reluctant to justify your claims with a verified model.

            “Your factor of 20, I think, comes from the annual exchanges of carbon between the non-deep-ocean reservoirs.”

            No, unless by “non-deep-ocean reservoirs” you mean land and surface oceans, then yes. Sorry I didn’t explain that above. The non-FF fluxes are about 200 GtC/year or 100 ppm CO2, which is 20 times the current FF input.

            Despite your bottleneck claims, the airborne fraction is decreasing while emissions rise. The sinks don’t seem to have a supply chain problem.

          • Nate says:

            “No, unless by ‘non-deep-ocean reservoirs’ you mean land and surface oceans, then yes. ”

            OK so we agree that 20 x exchanges are with the other surface reservoirs, not with the deep ocean.

            Then you should understand that the 20x is irrelevant for removal of C to the deep ocean.

            The 20x is simply exchanging it between reservoirs of comparable size. Thus added CO2 from FF is quickly divided between those reservoirs–and thus the atmospheric portion settles at 40% or whatever it is, for a long time, until it is all removed to the deep ocean.

          • Nate says:

            “Indulge me. What paper are you talking about? Bolin/Erickson? What data shows ‘it passed?'”

            Yes, BE.

            It predicted the rise over the next decades with a guess about what emissions would be. It says:

            “The most likely value for na at that time (y 2000) seems to be 25%, it may possibly be larger but probably not exceed 40%”

            This is the percent rise since 1880. Assuming 280 ppm in 1880, we expect 280*1.25 = 350 ppm in 2000.

            Mauna Loa shows 369 ppm in 2000. Well within the error range of BE.

            Obviously the parameters are all known better now.

          • Chic Bowdrie says:

            “Then you should understand that the 20x is irrelevant for removal of C to the deep ocean.”

            I somewhat agree. Maybe you need to understand that the deep ocean is irrelevant to whether or not additional sources contribute to the added atmospheric CO2. Either the absorp.tion rates are slowing or the inputs are increasing or both. The simple Inputs = deltaCO2 – FF + Outputs [20 times FF] calculations from actual data should convince you that at least the inputs are increasing.

            “…thus the atmospheric portion settles at 40% or whatever it is, for a long time, until it is all removed to the deep ocean.”

            The airborne fraction is not settling. If anything, it is decreasing instead of a predicted increase. What makes you think that absorbed CO2 is not being removed to the deep ocean in accord with normal transfer rates? If you do, then what are you waiting for? Show the data.

            The Bolin-Erickson model does not distinguish FF emissions from the growth in natural emissions. The fact that the predicted increase is in the predicted range does not in any way support your contention that all the rise in CO2 is human caused.

          • Nate says:

            ” Maybe you need to understand that the deep ocean is irrelevant to whether or not additional sources contribute to the added atmospheric CO2.”

            How so? Their is no NEED for large additional sources if the output to the deep ocean is small.

            “Either the absorp.tion rates are slowing or the inputs are increasing or both.”

            The BE idea is that 60 y ago, the rates were low, and still are low today.

            “The simple Inputs = deltaCO2 FF + Outputs [20 times FF] calculations from actual data should convince you that at least the inputs are increasing.”

            No, Not at all. The input is an ADDITION to the three surface reservoirs. While the Outputs [20 times FF] are simply circulating among the three surface reservoirs, and not removing any of it. Again, removal from these surface reservoirs must be to the deep ocean. There is nowhere else for it to go.

            “The airborne fraction is not settling. If anything, it is decreasing instead of a predicted increase.”

            Data??

            “What makes you think that absorbed CO2 is not being removed to the deep ocean in accord with normal transfer rates?”

            What is your definition of ‘normal transfer rates” ? Is it the rate one would get if we ignore ocean chemistry?

            Normal transfer rates are the ones we should expect for the real ocean with its real chemistry.

            What is your evidence/data showing that ocean is behaving differently?

            There is data in BE and after BE on bomb C14 penetration into deep ocean. It is LOW.

            Lots of measurements of Revelle factor have been made.

            https://agupubs.onlinelibrary.wiley.com/doi/full/10.1029/2008GB003407

            Measurements of the surface ocean show its increase in C tracking the atmosphere.

            https://www.co2.earth/images/figures/noaa/co2_atmosphereseawater_noaa_2014-1217_with_text_696w.jpg

            “The Bolin-Erickson model does not distinguish FF emissions from the growth in natural emissions. The fact that the predicted increase is in the predicted range does not in any way support your contention that all the rise in CO2 is human caused.”

            Sure if their predicted FF emissions never happened and instead were replaced by an equal amount of natural emissions? C’mon.

          • Chic Bowdrie says:

            I for one am not arguing a NEED for large additional sources, only those that are needed to make physical sense out of the data. The large ratio of natural to FF emissions is well known by everyone not trying to obfuscate. In any case, the deep ocean is large and therefore a small increase in its concentration compensates for whatever large increase in atmospheric CO2 you imagine. If you don’t agree, all you have to do is present the data to prove your point.

            The BE rate for residence time was five years, same as today, which is consistent with my model and the relatively constant airborne fraction.

            “There is nowhere else for [the FF input] to go.”

            Get real. FF emissions increase CO2 incrementally in all the reservoirs including the deep ocean according to normal transfer rates all described in the Bolin-Erickson paper. You would know this if you actually applied data to their equations. No need to ignore ocean chemistry. No need for evidence the oceans behave differently. LOW C14 penetration into the deep ocean is relative to what? Is “low” normal or less than normal? Your claims are meaningless until you apply data proving your case.

            My data for the airborne fraction is in this spreadsheet calculated from 10 year averages of CO2 and FF data: https://tinyurl.com/3628ty2j

            There you go again with the Revelle factor without showing any evidence that is has any effect on the rates of CO2 absorp.tion. The paper claims “The net result will be a less efficient absorp.tion of CO2 from the atmosphere” without providing any evidence of that.

            “Sure if their predicted FF emissions never happened and instead were replaced by an equal amount of natural emissions? C’mon.”

            Typical obfuscation, Nate. Actually worse. More like C’mon-man-Joe-Biden dumb.

            As you can see from the last column in my spreadsheet, the amount of additional natural input each year is one to two ppm, only a fraction of the FF input. But that is enough to justify my claim that FF emissions are not 100% of the rise. And because the sinks take out FF emissions equally well, FF emissions represent no more than 5% of atmospheric CO2.

          • Bart says:

            It’s really not all that hard. CO2 is transported to the deep oceans in the polar regions, and upwells again many centuries later in the equatorial latitudes. What is coming up can’t be stopped. What goes down is, however, throttled by temperature.

            So, if temperature rises, downflow is constricted, and accumulation at the surface occurs. This is all consistent with the data, and the proportionality observed in both the short and long term between the rate of change of CO2 and the temperature anomaly.

            Nate thinks that if he rescales the data so that it no longer matches, that is proof that it doesn’t match. It’s like saying “F = ma isn’t true because if I plot them together, and multiply F by 2, they no longer match.” It’s real galaxy brain thinking. A person with such silly thoughts is not worth engaging at least until he finishes high school.

          • Nate says:

            “Get real. FF emissions increase CO2 incrementally in all the reservoirs including the deep ocean according to normal transfer rates all described in the Bolin-Erickson paper. You would know this if you actually applied data to their equations.”

            Not sure why you say that if you actually read the paper.

            Becoming clearer that you havent.

            “I for one am not arguing a NEED for large additional sources”

            Yes, yes you are. Regardless of the need.

            “only those that are needed to make physical sense out of the data.”

            To make physical sense of the carbon cycle you need to account for the ocean chemistry and physics that actually constrains the real Earth system. The BE paper explains it. But you choose to ignore this reality.

            As they say I can only lead the horse to water.

            “The large ratio of natural to FF emissions is well known by everyone not trying to obfuscate.”

            It is endless obfuscation on your part to pretend that this ratio is relevant to removing added CO2 when it clearly cannot be.

            We seem to agree earlier that it is relevant to moving CO2 around among the surface reservoirs, but then you seem to stop following where this logically leads.

            Lets break it down. Lets approximate the Land, Atmosphere and ocean Mixed Layer as equal reservoirs.

            We add 3 units of CO2 to the atmosphere from burning FF. The 3 units get shared quickly (in ~ 4 y) with the Land and ML.

            Then the end result is an increase in 1 unit of CO2 in the atmosphere, and ML and Land. It stays there for a long time, UNTIL it can get removed to the deep ocean. This is the effect of the Revelle factor. It is explain in BE paper, and many other places.

            So it should be clear that the 4 y, has nothing to do with the time to remove the remaining 1 unit of added CO2 from the atmosphere.

            This is the current (basic) understanding of Earth’s carbon cycle, and its been tested over the last 60 y. This is simply the way the Earth behaves. You need new data and evidence and logic to show otherwise.

            If you want to do science, it has to be based on following the facts that we have, logically, to where they lead, not to where youd prefer them to go.

          • Nate says:

            “Nate thinks that if he rescales the data so that it no longer matches, that is proof that it doesnt match. Its like saying ‘F = ma isnt true because if I plot them together, and multiply F by 2, they no longer match.'”

            I scaled the data exactly as you did, Bart, in order to obtain the best match to the variations in the two data sets.

            But it does not match BOTH the short term variation and the long term trend (in amplitude or shape).

            Oh well.

            Is totally misrepresenting what I did your best argument, Bart?

            Sad.

          • Nate says:

            “CO2 is transported to the deep oceans in the polar regions, and upwells again many centuries later in the equatorial latitudes. What is coming up cant be stopped. What goes down is, however, throttled by temperature.”

            Is there any quantitative data showing ‘throttling by temperature’. Is there any evidence this effect has the trend and a magnitude large enough to explain the CO2 rise?

            There is a difference between hand-waving speculation and an actual theory, Bart.

            An actual theory needs to be quantitative. An actual theory needs to be falsifiable. It needs to be tested and validated against the data.

            We have none of those.

            In addition, your model makes no sense.

            With increased CO2 content in atm and ocean, MORE is being transported to the deep oceans in the downwelling water.

            It also seems to violate conservation of mass with downwelling slowed, but upwelling not.

  106. TYSON MCGUFFIN says:

    Apropo of the original post:

    US spending on science, space, and technology correlates with Suicides by hanging, strangulation and suffocation with 99.79% r^2. https://www.datasciencecentral.com/wp-content/uploads/2021/10/2808309778.png

    Total revenue generated by arcades correlates with Computer science doctorates awarded in the US with 98.51% r^2. https://www.datasciencecentral.com/wp-content/uploads/2021/10/2808310210.png

    An engineer, a physicist, and a mathematician are all staying at a hotel for a convention.

    The engineer wakes up in the middle of the night and smells smoke. He opens the door of his room and sees a small fire in the hall. He gets the ice bucket from his room, fills it to the top with water from the sink, takes it out into the hall, and throws it on the fire. The fire is out, and he goes back to bed.

    An hour later, the physicist wakes up and smells smoke. He opens the door of his room and sees a small fire. He goes back into his room to get some instruments to take some readings from the fire. He goes back into his room and uses the 6 ounce water glass in the bathroom to measure out a precise amount of water so he can fill the ice bucket with just enough to put out the fire. He goes back into the hallway, douses the flames with water, and goes back to bed.

    An hour later the mathematician wakes up and smells smoke. He opens the door of his room and sees a small fire. He stands there, thinking. And thinking. And thinking. Looking at the fire and thinking. Staring off into space and thinking. Finally, his eyes light up and he exclaims “Yes! A solution exists!” and he goes back to bed.

    • stephen p anderson says:

      Were they a class A, B, C, or D fires?

      • Gordon Robertson says:

        Reminds me of a fire demonstration we had with a major communications company. We were warned how to deal with burning vinyl insulation since it is toxic to breath. After the demo, our supy gathered us together and told us to forget what we had just been told, if there is a fire, to get our butts out the door asap and let the fire department deal with it.

    • RLH says:

      Looks like they all failed to put out the fire, long term.

  107. Willard says:

    While it snows around here:

    The March 2022 global surface temperature was 1.71F (0.95C) above the 20th-century average of 54.9F (12.7C) the fifth-warmest March in the 143-year record. The seven warmest March months have occurred since 2015. March 2022 also marked the 46th consecutive March and the 447th consecutive month with temperatures, at least nominally, above the 20th-century average.

    https://www.ncei.noaa.gov/news/global-climate-202203