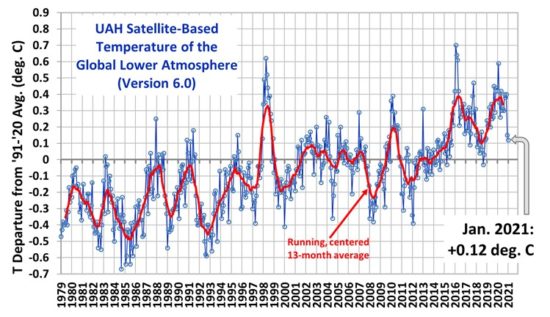
UAH Global Temperature Update for January 2021: +0.12 deg. C (new base period)

February 2nd, 2021 by Roy W. Spencer, Ph. D.

The Version 6.0 global average lower tropospheric temperature (LT) anomaly for January, 2021 was +0.12 deg. C, down a little from the December, 2020 value of +0.15 deg. C. NOTE: We have changed the 30-year averaging period from which we compute anomalies to 1991-2020, from the old period 1981-2010. This change does not affect the temperature trends.

The linear warming trend since January, 1979 remains at +0.14 C/decade (+0.12 C/decade over the global-averaged oceans, and +0.18 C/decade over global-averaged land).

Various regional LT departures from the 30-year (1991-2020) average for the last 13 months are:

YEAR MO GLOBE NHEM. SHEM. TROPIC USA48 ARCTIC AUST 
2020 01 0.42 0.44 0.41 0.52 0.57 -0.22 0.41
2020 02 0.59 0.74 0.45 0.63 0.17 -0.27 0.20
2020 03 0.35 0.42 0.28 0.53 0.81 -0.96 -0.04
2020 04 0.26 0.26 0.25 0.35 -0.70 0.63 0.78
2020 05 0.42 0.43 0.41 0.53 0.07 0.83 -0.20
2020 06 0.30 0.29 0.30 0.31 0.26 0.54 0.97
2020 07 0.31 0.31 0.31 0.28 0.44 0.26 0.26
2020 08 0.30 0.34 0.26 0.45 0.35 0.30 0.25
2020 09 0.40 0.41 0.39 0.29 0.69 0.24 0.64
2020 10 0.38 0.53 0.22 0.24 0.86 0.94 -0.01
2020 11 0.40 0.52 0.27 0.17 1.45 1.09 1.28
2020 12 0.15 0.08 0.22 -0.07 0.29 0.43 0.13
2021 01 0.12 0.34 -0.09 -0.08 0.36 0.49 -0.52

The full UAH Global Temperature Report, along with the LT global gridpoint anomaly image for January, 2021 should be available within the next few days here.

The global and regional monthly anomalies for the various atmospheric layers we monitor should be available in the next few days at the following locations:

Lower Troposphere: http://vortex.nsstc.uah.edu/data/msu/v6.0/tlt/uahncdc_lt_6.0.txt
Mid-Troposphere: http://vortex.nsstc.uah.edu/data/msu/v6.0/tmt/uahncdc_mt_6.0.txt
Tropopause: http://vortex.nsstc.uah.edu/data/msu/v6.0/ttp/uahncdc_tp_6.0.txt
Lower Stratosphere: http://vortex.nsstc.uah.edu/data/msu/v6.0/tls/uahncdc_ls_6.0.txt


1,616 Responses to “UAH Global Temperature Update for January 2021: +0.12 deg. C (new base period)”

Toggle Trackbacks

  1. E. Swanson says:

    Dr. Spencer, to my knowledge, you and Dr. Christy have not presented a public description of the method used to produce the equation you use to combine the three MSU/AMSU channels, which is central to your LT product. As with the earlier TLT versions, the logic for this effort was to remove the known cooling influence of the stratosphere on the TMT, which you now call the MT. The Version 6 equation is a weighted averaged of the TM, TP and LS series, given by :

    LT = 1.538 * MT – .548 * TP + 0.01 * TP

    In this equation, a negative trend in the TP will result in an additional positive trend in the LT. Of course, if the TP has a positive trend, the result would be a cooler value for your LT as the weights add to nearly 1.0. Is this equation derived using an assumption of the atmospheric temperature profile with pressure height, such as the US Standard Atmosphere, which is tuned for mid-latitudes?

    If so, what is the effect on the calculated weighting if one selects lapse rates more typical of Winter in the high Arctic, where the Tropopause appears at a much lower pressure height than that found in mid-latitudes. I suggest that for the lower Troposphere, the trend for the TP on occasion may become positive, such in the Tropics where the height of the tropopause has been found to be increasing or during events like the recent warm Stratosphere reported at high latitudes. These conditions would result in a cooler monthly value and thus result in a more negative trend for the LT. Have you all investigated the seasonal and regional impacts on your choice of channel weights?

    Other researchers have produced products which do not include the TP series, using only a weighted average of the LT minus the LS, for example, the TTT produced by RSS. It has also been suggested that a stronger weight be used for the LS during Winter would provide a more accurate product. Your thoughts would be appreciated.

    • The details of Version 6, including what you are asking about, was posted here back in 2015 (link below)… read the discussion surrounding Fig. 7. Basically, the averaging kernel we use (the equation you show, except your last term should be “LS”) is optimized to reduce the stratospheric influence on LT as much as possible. You cannot interpret the terms individually because they represent a deconvolution of overlapping weighting functions. For instance, if the lower stratosphere was to cool, you cannot know how it will affect LT without also taking into account how that cooling also affects the other 2 channel (MT and TP).
      https://www.drroyspencer.com/2015/04/version-6-0-of-the-uah-temperature-dataset-released-new-lt-trend-0-11-cdecade/

      • E. Swanson says:

        Thanks Roy. I hadn’t looked at your link for a while. Sorry about that typo (TP instead of LS) in the equation, I hadn’t completely finished editing when I hit “send”.

        But, you still haven’t described your method for calculating the weighting functions, such as those for the individual scan angles in Fig 2 and for the different channels in Fig 7. I repeat, don’t you need to make an assumption regarding lapse rate, such as the US Standard Atmosphere, to create these theoretical weighting profiles?

        Please note that one can simply use the respective channel trends in your equation and calculate the trend for the LT. I think this fact refutes your comment:

        You cannot interpret the terms individually because they represent a deconvolution of overlapping weighting functions. For instance, if the lower stratosphere was to cool, you cannot know how it will affect LT without also taking into account how that cooling also affects the other 2 channel (MT and TP).

        As a result, one can see directly from the data what the impact is, by comparing the trends from earlier time periods with the trend for the entire period. Of course, the LT weighting for the LS is only 0.01, thus the trend in the LS has ~1/55 the impact of the TP on the trend in the LT. In the end, it’s the trends which matter most, not the monthly values.

      • Rune Valaker says:

        Dr. Spencer, I have no insight into what E. Swanson is talking about. But his questions seem insightful. There is also a rumor that UAH are the only of the global series that do not state their “code” (whatever this may mean) so that it is impossible for other professionals to find out how UAH arrive at their results. This has been a persistent objection to UAH. It is claimed that GISS, RSS, NOAA, Berkley etc. all provide information so that anyone with the necessary understanding can verify their calculations but not UAH.

        Why?

    • bdgwx says:

      Eric,

      To demonstrate just how sensitive the linear regression trend is to even small changes in the weighting I changed the LS term from +0.01 to -0.01. The trend jumped from +0.1378C/decade to +0.1434C/decade. You wouldn’t notice on individual monthly anomalies, but over the long term this has a HUGE impact on the trend and it wasn’t even a big change.

      Do we have any justification for the selection of 1.538, -0.548, and 0.01 tuning parameters?

      And why are we adding part of the LS channel anyway. It seems like by adding you are injecting its cooling bias into the LT. If anything wouldn’t you want to subtract a portion of it to remove that cooling bias?

      • bdgwx says:

        Err…it’s worse than I thought. My +0.1434C/decade figure above should have been +0.1446C/decade.

        That’s with…

        MT = 1.548
        TP = -0.538
        LS = -0.010

        …which sums to 1.000 like it did before. I just added 0.01 to MT and TP to make up for the loss of 0.02 on LS.

    • Gordon Robertson says:

      swannie…”Dr. Spencer, to my knowledge, you and Dr. Christy have not presented a public description of the method used to produce the equation you use to combine the three MSU/AMSU channels…”

      Typical. The global average shows significant cooling and Swannie et al begin questioning the UAH methodology. As far as I can make out, the responses of each channel are the weighting curves. You should be able to work out the responses yourself and compare them to what UAH has derived. It’s not a big secret.

  2. Eben says:

    Let the debate begin

    • jon says:

      No debate really, the world is not rapidly warming and there is no need for panic. Greta can now go and try to be an average teenage…

      • jon says:

        Of course, she will need extensive counseling to reverse the emotional damage her parents and the alarmist media inflicted on her.

    • Ned Nikolov says:

      Arguing about minute differences is global warming trends with the intent to prove or disprove anthropogenic “Climate Change” is really a waste of time from a standpoint of the emerging new Science of Climate Change, which shows:

      a) Lack of a physical mechanism for non-condensing trace gases to affect Earth’s climate;

      b) Lack of evidence in the geological record that CO2 has ever controlled climate; and

      c) Plenty of evidence that a reduction of cloud cover and albedo was the cause of warming since 1980, not CO2!

      For more details, please watch the video presentations linked to this blog post:
      https://tallbloke.wordpress.com/2021/02/08/ned-nikolov-what-can-nasa-planetary-data-tell-us-about-drivers-of-earths-climate/

      These presentations were made at the AMS 101st Annual Meeting last month… The climate Paradigm is shifting!

      • bdgwx says:

        It sounds like you have it all figured out. Can you post your model so that we can see how it ranks in explaining and predicting the global mean temperature? Also, what causes cloud cover and albedo to change in your model?

        • Ball4 says:

          bdgwx, Ned doesn’t have it all figured out, doesn’t even sound like it. A better source for evidence of cloud cover and albedo interannual variability is here and contradicts Ned Nikolov’s c):

          https://agupubs.onlinelibrary.wiley.com/doi/full/10.1002/2014RG000449

          “The satellite observations obtained over this period (last 40 years) indicate that the albedo of Earth is highly constrained, restricting the degree to which the albedo varies over space and limits the variability of albedo over time…The small variability observed suggests a high degree of buffering by the albedo of clouds.”

          Variations in albedo cannot account for the magnitude of the recent past and current EEI. There are many papers contradicting Ned’s a) both from experimental results in the lab and in the wild.

          Ned’s linked video shows the source of the model is not 1st principle theoretically derived. Ned’s model as discussed in the video is just an advanced curve fit that mixes both brightness temperatures and thermometer temperatures for certain solar system objects without much, if any, discussion of the implications.

      • PCman999 says:

        One could add as well that there were periods like the Minoan, Roman, and Middle Ages or Viking that were warmer than now and were regarded as prosperous times, opposite of the Bronze Age Collapse, Dark Ages, or Little Ice Age. Probably the warmest period in 10K years was about 8K yrs ago when the Sahara was a savanna or forest and large mega fauna could survive. So even if the 1.5C/100 years turned into 5C, it wouldn’t be the end of the world but a rebirth.

  3. Patrick says:

    Why not go to 40 year?

    • Ric Werme says:

      IIRC, the 30 averaging standard was originally chosen to match the size ledger paper the Weather Bureau folks had handy.

      Today we can make much better suggestions for tracking several intervals, e.g. 60 years to try to smooth out a PDO or AMO cycle.

      • Nicholas McGinley says:

        Climates are defined in terms of a 30 year average of weather conditions.
        So 30 years is not just some random number.

        • PCman999 says:

          If you are going to reply to Ric, it’s customary to read what he had to say. 30 years is just a convention, and really is a random number – if the Weather Bureau had tabloid size paper we would probably have a 60 year standard. I don’t see why don’t they use the whole period available, ~200 years – after all climate is a property that surely is more permanent than the lifespan of a human.

    • Tim Folkerts says:

      I was wondering that, too. 30 years is often mentioned as a *minimum* time for a climate baseline, but it seems a longer baseline would be better. Basically, the data is all now 0.12 C lower than it was before. A 40 yr average would pretty closely split the difference to only be 0.06 C lower than before (using an eyeball estimate).

      This change has the psychological effect of making the 1980’s seem cool, rather than making the 2010’s seem warm. Of course, there is no actual change in data, but it will be easier for casual observers to conclude there has not been much warming. If the consensus had been that the 1980’s were unusually cool, this would make more sense to me. Instead, the 1980’s were already warmer than previous decades, so making them look “cool” seems odd to me.

      This *will* make it much more likely that those who have been predicting a drop below the baseline will be correct. /grin

      • Rawandi says:

        “it will be easier for casual observers to conclude there has not been much warming”

        Which is great, because actually there hasn’t been much warm-up.

      • Ken says:

        I’m struggling with the concept of 0.24C being somehow psychologically warmer than 0.12C.

        • Rawandi says:

          The time has come. The kingdom of negative temperatures has come near.

        • Bindidon says:

          Ken

          As you can see below your comment, Rawandi seems to have the same problem.

          Both 0.24 C and 0.12 C aren’t temperatures.

          They are mathematical constructs: differences between the absolute temperature computed for a given month and the average of such monthly temperatures over a given reference period, be it 1979-1998 (in earlier UAH times), 1981-2010 or now 1991-2020.

          Here are these monthly averages for 1981-2010 (Kelvin, Celsius):

          Jan 263.04 -10.11
          Feb 263.11 -10.04
          Mar 263.30 -9.85
          Apr 263.72 -9.43
          Mai 264.32 -8.83
          Jun 264.97 -8.18
          Jul 265.29 -7.86
          Aug 265.11 -8.04
          Sep 264.47 -8.68
          Oct 263.78 -9.37
          Nov 263.27 -9.88
          Dec 263.07 -10.08

          If you obtain, for the Globe in Dec 2020, the average absolute temperature 263.34 K, the anomaly wrt 1981-2010 will be

          263-34 – 263.07 = 0.27 (K or C, but not… F!).

          J.-P. D.

          • Rawandi says:

            “Both 0.24 C and 0.12 C aren’t temperatures”

            Bindidon, you’re terribly wrong. When you put the symbol C for Celsius behind a number what you get is a temperature. It is so by definition.

          • Gordon Robertson says:

            binny…”Both 0.24 C and 0.12 C arent temperatures.

            They are mathematical constructs:”

            More Teutonic mysticism from Binny. Whey do they use C for Celsius if the values are mathematical constructs? One degree C is based on dividing the range of expansion of mercury in a vial between the heat quantities at the freezing point of water and the boiling point of water by 100.

            It would seem reasonable to conclude that the values -.24C and -.12C are based on heat quantities therefore not mathematical constructs.

          • Bindidon says:

            I repeat: anomalies are NOT temperatures.

            1. They are departures from a mean computed out of measured temperatures or quantities out of which temperatures can be inferred.

            2. And moreover, this mean is not the trivial average over all months of the reference period; it is a 12 month vector instead, whose elements are the average of all corresponding months in the period, what makes them even more abstract because they (intentionally) lack seasonal information.

            Hence, though being expressed in Celsius, Kelvin, Fahrenheit, Rankine Réaumur or whatever you want, anomalies are mathematical constructs, and NOT technically measured entities.

            Basta ya!

            J.-P. D.

          • Rawandi says:

            Bindidon, I don’t think you realize that an “abstract” or “mathematically constructed” temperature is still a temperature.
            That is why Roy states that 0.12 C is the “global temperature” for last January.

          • Bindidon says:

            Rawandi

            I think it’s better for you never to write things like

            ” I don’t think you realize… ”

            I realize a lot more than you ever could imagine.

            And… you did not understand a bit of what I wrote.

            J.-P. D.

          • Rawandi says:

            Bindidon, how do you explain Roy’s statement that 0.12 C is the “global temperature” for January?
            The obvious explanation is that the anomalies are temperatures.

          • Chic Bowdrie says:

            Rawandi,

            Dr. Spencer writes +12 C meaning a positive departure from a mean of the 30 year actual temperatures whatever they are. It is not a measured temperature like +12 C above 0 C and -12 C below 0 C equal to 285K and 261K, respectively.

            I’m happy to agree with Bindidon.

          • Bindidon says:

            Chic Bowdrie

            Thank you, fair enough!

            J.-P. D.

          • barry says:

            Roy Spencer wrote above:

            “The Version 6.0 global average lower tropospheric temperature (LT) anomaly for January, 2021 was +0.12 deg. C, down a little from the December, 2020 value of +0.15 deg. C. NOTE: We have changed the 30-year averaging period from which we compute anomalies to 1991-2020, from the old period 1981-2010. This change does not affect the temperature trends.”

            Without getting into a philosophical debate about measurements, the anomaly is the value you get when you subtract the that 30-year average Roy just mentioned from the actual temperature.

            So if the global temperature for the month of December is -9.81 C and the 30-year average for Decembers is -10.08, the difference is 0.27.

            That anomaly is based on the average of Decembers for 1981-2010, and was the result last month.

            This month the anomaly for that same month is now 0.15 C, because the baseline has been changed. It is now the average of the 30 Decembers from 1991-2020.

            So which is the “real” temperature? 0.27C, 0.15C, or -9.81C?

            It’s -9.81C. That remains the same regardless of the baseline (unless UAH adjust the data at some later time).

            Anomalies are fairly simple mathematical constructs to help work with data more efficiently, particularly if we want to examine global and regional climate change over time.

          • Bindidon says:

            Three charts to explain the transition from the real world of temperatures to the abstract world of anomalies: a comparison of UAH6.0 LT (lower troposphere) with UAH6.0 LS (lower stratosphere)

            1. Averages of absolute temperatures

            https://drive.google.com/file/d/16GaarHUs7npnzyN5-wtJ7z0qODSKplVq/view

            In fact, we leave already here the world of measurements, as all points on the plots don’t represent real data, but rather monthly averages of 9504 grid cells spanning the Globe, which themselves are the result of an average of the interpretation of the original data: O2 emission sensing values coming from various sources.

            2. Means of absolute temperatures

            https://drive.google.com/file/d/12ntQPUMotlrIUXTYn8721WpD3S0sihjc/view

            Here we are a step farer from original data and nearer to abstraction.

            3. Departures from a mean including annual cycle removal

            https://drive.google.com/file/d/1_ecu50TZYPYfr57XIWZ_rcu9p2trm2hy/view

            Real temperatures no longer exist here. Though we express them in C, K, or F, they have no longer any direct relation to temperatures.

            But… that doesn’t matter: this is the way we need to accurately compare distant measurements like temperatures, snow cover, ice extent, sea levels, etc etc!

            J.-P. D.

      • Tim Folkerts says:

        My point is that when you see data close to the baseline, that would naturally seem somehow “typical” or “close to average”. Departures from the baseline are departures from “normal”.

        With a high baseline (1990-2020), the recent decade looks pretty “typical”, with the first decade as “well below average”.
        With a low baseline (1980-2010), the recent decade looks “well above average”, with the first decade as pretty “typical”.

        Or consider what we can say about the streaks.
        * Old baseline: No month below the baseline for almost 9 years.
        * New baseline: No month below the baseline for just 2.5 years.
        These “feel” very different, even though the shape of the graph is identical.

        A 40 year baseline would put the 1980’s a little below average, and the 2010’s a bit above average, which seems most ‘honest’ to me.

        • Rawandi says:

          Tim, if you are suggesting that using a low baseline is psychologically favorable to climate alarmists, I think you are correct.

        • Patrick says:

          A 40-year temperature record as a baseline is 33% more “compacted” (solid) measurement, but now that I have thought this out it’s clearer to me that a more recent, 30-year temperature “grouping” has a more accurate accounting built within it simply due to advancements in measuring. The ARGO Float System was launched in 2002, yet it took 3 years to shake out all of the bugs. ARGO data actually begins in 2005. Right?

        • barry says:

          The baseline is arbitrary. It’s the ‘alarmists’ saying that, and it’s the ‘skeptics’ who seems to think it has significance.

          So I suggest you are projecting onto ‘alarmists’ what you are actually experiencing yourself.

  4. Scott R says:

    While the new basis period certainly looks more appropriate to my eye, this is going to mean all my databases are going to have to be changed. Can’t say I’m excited about that. lol

    See how the highs and lows are now equally distant from the 0 line? This adjustment makes a lot of sense as 1980 was the end of the -AMO mid century cooling period, and 2016 was the end of the +AMO modern maximum, +AMO period.

    The data now seems to want to bounce off or near the 0 line, or get pulled back towards it. Seems like a good pivot.

    • Gordon Robertson says:

      scott r…”This adjustment makes a lot of sense as 1980 was the end of the -AMO mid century cooling period, and 2016 was the end of the +AMO modern maximum, +AMO period”.

      Interesting.

    • Bindidon says:

      Scott R

      Will there be one day in the future where you begin to understand and to take into consideration the fact

      – that you are all the time looking at and talking about the detrended AMO, whose one and only reason to exist is to show AMO’s internal cyclic behavior, and

      – that you have to use the undetrended variant when putting AMO in relation to any temperature series?

      J.-P. D.

    • barry says:

      The absolute gormless stupidity of interpreting the optics of a baseline shift.

      The relationship between anomalies at different parts of the time series remains the same regardless of the baseline.

      The baseline is not a physically measured thing, it’s an arbitrary zero line that changes nothing about the anomalies relative to each other, nor the trends derived therefrom. The trend for a time period will remain the same for that time period regardless of where you put the baseline.

      Like someone else referred above, it seems odd to keep changing the baseline every 10 years. Any published data prior to the changepoint now has to be adjusted to directly compare. You have to subtract the amount of the baseline shift from every anomaly to get a direct comparison.

      Otherwise, it doesn’t change anything else essential, just the optics. Little bit of extra work for some people.

      Someone later may will point out the 2020 anomaly compared to 2021, and not realizing they got it from two different baselines, and proclaim a massive cooling.

  5. Andy says:

    Last month December was 0,26, now it’s 0,15. Wrong graph.

  6. Eben says:

    It doesn’t look right to me , it is too high, it should be 1080 to 2020

  7. I love the data where is all that AGW ? No where that is where it is because it is a fraud.

    Just wait until we get a major volcanic eruption in the right location and with a big SO2 discharge.

    AGW theory will live on even if an Ice Age were to come about because the whole thing is a scam and many have bought into the scam and will not let go.

    • gbaikie says:

      “AGW theory will live on even if an Ice Age were to come about because the whole thing is a scam and many have bought into the scam and will not let go.”

      An Ice Age can’t come, cause we been in Ice Age for millions of years.
      I don’t think we going get something like the Little Ice Age, any time soon {within 50 years}. When glaciation period starts is questionable {was little Ice Age a “beginning”- was 5000 year ago a “beginning”]. It seems metric will be when glacier grow as they did during Little Ice Age and it exceeds the Little Ice Age glacial advance. Whenever that happens probably more than 50 year into future and could be more centuries or more than 1000 years.
      I think glacial advance could occur more rapidly as compared to time it took glacier to advance during LIA, and the “speed” of such advance might considered more important rather than total extent that had occurred {whenever that happens} in terms claiming “the beginning” of glaciation period. It seems if go “flat” for decades, it seems we will not have fast glacial advance {anytime soon} but but it seems possible will could have “brief” pause, and get something like .14 C per decade warming for several decades which might “cause” there to be a later, rapid glacial advance.
      Or seems if get anything like what IPCC is projecting in terms of global temperatures, we could return a glaciation period much sooner than 1000 years.
      But seems to me it will longer than 1000 years.
      Though I think anything 100 years or longer is not practical, sort like having weather forecast 5 year in future. And I don’t much going to “happen” within 100 years or said differently be similar to last 100 years. Though a super volcano whether on land or more likely in the Ocean would be “something different” if happening within 100 years.
      What are chances? We don’t know when last super volcano happenned in ocean:
      “Tamu Massif is an extinct submarine shield volcano in the northwest Pacific Ocean, with the characteristics of a hybrid between a mid-ocean ridge and a shield volcano. On 5 September 2013, researchers announced that it could be a single volcano which, if corroborated, would make Tamu Massif the largest known volcano on Earth.–
      The Tamu Massif was formed about 145 million years ago during the Late Jurassic to Early Cretaceous period over a relatively short period of time (a few million years) and then became extinct. Tamu Massif was formed during one, geologically brief eruptive period, which scientists had previously thought was impossible on Earth.”
      https://en.wikipedia.org/wiki/Tamu_Massif
      So mean something much smaller than Tamu Massif, but a super volcano in terms +1000 cubic km of lava.

      • Roger says:

        No, we are not in an “Ice Age” technically atm, we are in an interglacial (ie a warm period) in the holocene. I agree that from the beginning of the pleistocene, yes, Ice Age, would overall fit. But the last cold period ended around 12 K years ago. From the patterns we know in geology this interglacial and warm period should end more or less soon. Pray it won´t happen.

        • gbaikie says:

          Ice Age, or one call it Icehouse Climate.
          An Ice Age has variation of glacial and interglacial periods.

          One could say our present Icehouse Climate has a number of Ice Ages- and each Ice Age has a number of glaciation and interglacial periods.
          Or we have been in Ice Climate tens millions of year, and currently we in the coldest Ice Age of entire duration of our Icehouse Climate.
          Also our interglacial period has not been warm as other interglacial periods within this most recent Ice Age.
          Or, wiki:
          An “icehouse Earth” is a period in which the Earth has at least two ice sheets, Arctic and Antarctic (on both poles); these sheets wax and wane throughout shorter times known as glacial periods (with other ice sheets in addition to the 2 polar ones) and interglacial periods (without). During an icehouse Earth, greenhouse gases tend to be less abundant, and temperatures tend to be cooler globally. The Earth is currently in an icehouse stage, that started 34 Ma with the ongoing Late Cenozoic Ice Age.”
          More wiki:
          “The Pleistocene often colloquially referred to as the Ice Age) is the geological epoch that lasted from about 2,580,000 to 11,700 years ago, spanning the world’s most recent period of repeated glaciations.”
          more Wiki:
          “The Pliocene follows the Miocene Epoch and is followed by the Pleistocene Epoch”

          The Pliocene was warmer than Pleistocene Epoch:
          https://www.globalwarming-sowhat.com/warm–cool-/
          And the Pliocene and Pleistocene were colder than any other time [within last 34 millions] and as I said “recently” Pleistocene was colder than Pliocene. And earlier than 34 million ago, Earth was warmer, but when it’s warmer it also had cooler and warmer periods, where coolest times perhaps could have been as warm as our interglacial periods- or when talking +1 million of time, it cools and warms, cools, etc. And could warm then cool within 100,000 years. And it’s thought to be related to Milankovitch cycles which going on for more than billion years.

          Idea that Earth is warm, now, and/or will be, is simply, dumb.
          That a Ice Age creature doesn’t want it to become warmer, well, that could be regarded as a somewhat reasonable opinion.

          • Roger says:

            You reiterated my post with WAY WAY more words and not really more relevant info 😉 /SCNR. BTW wiki is BS for geological stuff mostly (i am a geoscientist). But yes, i agree, “we” are totally forgetting that “climate history” did not start in 1880. That the last “Ice Age” aka pleistocene and holocene started 2.6 million years ago and that the Tertiary was a way warmer period most of the time is beyond the horizon of 90% of the malleable folks.

          • gbaikie says:

            “You reiterated my post with WAY WAY more words…”
            Yes, I do that.
            As far returning to glaciation period. I am uncertain of what others would define as returning to it.
            I would say if entire ocean cooled by .5 C.
            Or it’s said our ocean average temperature is 3.5, and so if average was .5 C colder.
            Or during Little Ice Age, I think our ocean may have cooled by as much as about 3.3 C.
            Anyhow some predicted returning to glaciation period within about 1000 years.
            And longest guess, I seen 75,000 years and it predicted because human are CO2 to atmosphere. As in because we adding so much CO2 it means that be delayed by long time. Which didn’t regard as reasonable. But whether 1000 or 75,000 years, what indicate it’s starting. It seems most people would say, adding glacial ice like what happenned in Little Ice Age, but just more added and adding for a longer time.
            But it seems to going into glaciation period is a long process.
            It seems once this current warming period ends, some going say the Ice Age is coming.
            But I am not sure if Little Ice Age, wasn’t a beginning or maybe in future, it will determined that whenever the Sahara becomes a desert, that is the beginning.

  8. My suggestion is the global temperature deviation should also be put out from the period of time from 1971- 1990 so we can get a better sense of things.

    This 1991-2020 is misleading because the period is so warm for the most part. We need to contrast current temperatures to a cooler period of time in my opinion.

    Or at least run two different periods of time.

    • bdgwx says:

      It’s not misleading in the slightest. You can pick whatever baseline you want and it wouldn’t change the trend or ranking of years. You could pick the average from 1981-2020, absolute zero, the melting point of tungsten, or even the temperature of the Sun as your baseline and it wouldn’t matter…AT ALL.

  9. cor 1971- 2000 for period of time.

  10. In any event to me surface oceanic temperature deviation is the best indicator on the state of the climate. Currently only +.12 c above latest 30 year means.

    And yet some are trying to say this is the warmest period in history, what a joke.

  11. bdgwx says:

    Unfortunately I only have 12 samples to work with here since the files haven’t updated yet, but I’m estimating the baseline moved up about +0.136C. There is large error here though. Part of the problem is that I’m comparing last month’s update with 3 decimals of precision to the screenshot above which only has 2 decimals. But I’m still seeing some oddities. For example, the change from Jan to Feb according to last month’s update was 0.755 – 0.564 = 0.191. But with this update and with its new baseline the change is 0.59 – 0.42 = 0.17. I was expecting it to be closer 0.19 like it was before. I’ve not seen an update have that big of an effect before.

    Anyway…+0.136 is my best guess at the baseline change. We’ll have to wait until the new files post to get a better estimate.

    The cool thing for those of you saying the anomaly would drop below zero this month is that it is now about 0.136 easier for that happen now.

    • bill hunter says:

      Seems to me that it should take a good deal of time to drop below zero. . . . like ~15 years with a 30 year baseline if one assumed all the climate influencing parameters inverted. With an older baseline it would have taken ~25 years.

      Since would only only take a short time for about 50% of the anthropogenic CO2 to leave the atmosphere if we stopped burning fossil fuels it seems a reasonable idea to not do anything until we can actually recognize any harm from it. Way too much hot wind about absolute numbers, base periods and predictions that never seem to materialize.

  12. Tim Wells says:

    I believed in the CO2 warming fraud back in 2006, then worked for a UK Carbon management company. I walked out in disgust. Looks like I am gradually been proved right.

  13. Martin Trittelvitz says:

    It takes time to get used to the new baseline. At the moment it’s a bit strange for me.

  14. This is a biased climate alarmist chart.

    Reason: It has a small vertical range of only 1.6 degrees C., making tiny changes in the temperature, that no human could notice, appear to be important.

    • bdgwx says:

      The standard deviation on the UAH data is about 0.25. It is regarded as best practice if the vertical range on chart is no more than 1-sigma below the min or above the max. Therefore he could have, and probably should have, made the vertical range even wider at -0.9 to +0.9.

      Also, keep in mind that the standard deviation on global mean temperatures over the last 2000 years is about 0.2. So the warming of 0.55 over the last 40 years is exceeds the past variation by almost 2 standards of deviation. To capture this warming you need a large vertical range. The plot would look kinda like the chart of the GameStop stock price as of late.

      https://www.nature.com/articles/s41597-020-0530-7/figures/3

      • Geoff Sherrington says:

        bdgwx,
        There are multiple ways to derive standard deviation SD depending on what is chosen for the input data.
        Here, one can choose to gather some numbers from an instrument on a laboratory bench, to look at its distribution and if valid, calculate a SD. Then, one might repeat with another instrument. Then in a different lab. One can then gather data from space, with one SD possibly to measure the SD of noise with radiation masked, then another SD with radiation coming in.
        The type of SD that has most information content is an overall SD calculated on numbers closest to what happens in reality, the boots and all, worst cases included, overall SD that can be compared with other operators like RSS. The differences between UAH, RSS and others if any have to be reflected in the figures that are relied upon for major decisions like government policies.
        So, in this type of context, can you please tell us what SD you are discussing? And why you chose SD as a measure of goodness? How do you propose comparing land based systems to these satellite ones, if indeed you do? Geoff S

        • bdgwx says:

          For UAH I did a stdev.p in Excel on the monthly values.

          For the Holocene I used the values provided by Kaufman et al. 2020.

    • Eben says:

      I have said the same thing , the scale should be set at the full temperature variations range of the Holocene last 10000 years to put it in the right context , and I’m talking real data spread, not the fake smoothed and bastardized hockey chart
      The warming contained in this data set on this correct scale would become almost a flat line

    • Bindidon says:

      Richard Greene

      I agree. But the same data displayed in WoodForTrees’ miniwindow is even worse:

      https://www.woodfortrees.org/graph/uah6/every

      My preferred chart is this one:

      https://drive.google.com/file/d/1VWxcZvDTDr54UgKn8fltiPwBX59ESVEr/view

      because here I see more a forest than lots of trees.

      J.-P. D.

      • Your chart is worse.
        The vertical range is even smaller.
        An honest chart would have the range of conventional thermometer as on the home page of my climate science blog:
        http://elonionbloggle.blogspot.com/

        Any UAH chart is biased because it happens to start at the beginning of the poast-1970s warming trend, which is long after man made CO2 emissions began ramping up.

        CO2 levels have been increasing since the trough of the Great Depression in 1932, although we have no accurate measurements until 1958.

        1940 would be a good starting point for a chart comparing the global average temperature and CO2 emissions.

        … But surface temperature compilations did not sufficient global coverage before 1950, so had a lot of infilling

        … But UAH data, with good global coverage, start in 1979

        … But CO2 real-time data start in 1958

        We far too often see biased charts that visually exaggerate global warming.

        Due diligence:
        I loved the past 45 years of global warming, and want more of it.

        • Nicholas McGinley says:

          Also important but not apparent on such graphs is the location in time and space of such variations.
          If it is only warming in the upper atmosphere, or if the warming is where it is bitterly cold all year around, or if it is warming in Winter, or mostly at night, is that actually warming?
          Or is it more properly referred to as “becoming more mild’?

    • barry says:

      The purpose of any chart is to make the data clear. Ideally, the data should fill the chart, and you adjust x and y axes to accommodate easy viewing.

      What would be dumb, for example, would be to track the growth in height of a human being, using the height of the atmosphere as the scale.

      Never mind the irony of the chart being called ‘a biased climate alarmist chart’, when the author is anything but.

      • Richard Greene says:

        A chart covering the range of the knowledge gained from reading your comments, would range from “”negative” to zero”.

      • barry says:

        I was talking about ‘projection’ above, and this is as clear an example as you could hope for, garnished with a generous dollop of irony.

      • Nicholas McGinley says:

        Is it as dumb as impoverishing people, and destroying our economy, and putting people out of work, and milling wildlife, all over some changes in temperature that no one could notice on bare skin, even if that change occurred over a period of minutes while someone was trying to notice any change?

  15. Tim S says:

    From my perspective, the end year for the average range should be closer to the current year, so 2020 is a good choice. The remaining question is whether the range should have been extended to 40 years instead of 30. More important is the downward trend for the last two months. Is there a good explanation for why last year was so warm?

    • Ken says:

      Last year was so ‘warm’ because there was an El Nino event. El Nino is now over and we are entering what looks to be a strong La Nina.

    • bdgwx says:

      The two hypothesis I’ve seen are 1) reduced aerosol optical depths due to the pandemic and 2) record low Arctic sea ice which always Earth to gain more heat in the summer and then release more of into the atmosphere during the fall. Note that 2020 ONI was -0.3 or since ENSO effects are usually lagged by 3 months or so the average from 2019/10 to 2020/9 was 0.1. So ENSO was mostly neutral. We would normally have expected 2020 to be a bit cooler than 2016 due to the ENSO cycle.

    • Richard M says:

      Time S,

      2020 was warm because the oceans were warm. The oceans were warm because ENSO/PDO have been mainly positive over the last 7 years. This graph shows where the oceans have been and you can see why we are now cooling.

      https://woodfortrees.org/plot/hadsst3gl/from:2014/to/plot/hadsst3gl/from:2014/to/trend

      The other part of the equation is the AMO which has been positive for at least 25 years. When that goes negative we will see more lasting cooling.

      The last time the PDO and AMO were both negative was the 1960-1977 period.

      • Rob says:

        Hey Richard, just wondering if you still believe that ENSO 1.2 is the first indicator of what is coming?

        • Richard M says:

          Rob, generally speaking the 1.2 area tells us whether we are seeing a lot of upwelling cold water. So, it is often a leading indictor for the future of the 3.4 area. Recently, it has been warming so that would generally indicate the La Nina is coming to an end within a few months.

          OTOH, this particular change appeared to be driven in a rather unusual manner. Large storms in the N. Pacific drove currents in a move southerly direction which pushed some warmer water into the 1.2 area. This has cut off most of the upwelling cold water for now.

          It will be interesting to see if this effect lasts or the more normal east to west flow returns. It appears so but the upwelling cold water has not returned to any large degree.

          • Rob says:

            It is not just 1.2. Three of the four ENSO regions have warmed by a degree or more from their lowest point.

            And although the prevailing current is east to west either side of the equator, the prevailing current in the convergence zone is west to east.

        • Bindidon says:

          Rob

          It might be interesting to look at HadSST3’s 5 degree grid cells in all these NINO x corners.

          Maybe I download it again, my data on the disk sure is a bit oldy.

          HadISST1 SST would be even more interesting because of the absolute data and the 1 degree resolution, but they have a huge delay before publishing their most recent data.

          J.-P. D.

  16. Dan M says:

    Dr. Spencer,

    I totally agree with those who’ve been saying that you should use the 40 year averaging period. A longer period gives a more accurate anomaly value relative to the long term average. You’ve got the data, use it. I assume that you start in 1980 so as to have a 13 month history in the average.

    Using only a 30 year average captures more of the most recent plus side of the AMO, leaving out a decade of – AMO. Ironically, that actually makes it looks like there has been less warming to the casual observer. But that also leaves you open to the criticism that you are purposely cooking the books to reduce the anomaly.

    Alarmists cook the books; scientists do what makes the most sense to yield the most accurate picture of what is going on.

    Can you justify using a 30 year period rather than the available 40 year period? “We’ve always used 30 years” is not a good answer. If you are going to make a change in the baseline once every 10 years, you should make the one that provides the most comprehensive picture to the consumer of the data.

    • ren says:

      “We’ve always used 30 years” is the best response to current trends.

    • bdgwx says:

      Choosing 40 vs 30 years does not make the monthly anomalies any more or less accurate. Hell, Dr. Spencer could wake up one day and decide to make the baseline the monthly average from November 1986 and it would literally make no difference whatsoever to the accuracy of the data, the trends, the 13m mean, or the rankings of months and annual means.

      And because the baseline is completely arbitrary then “We’ve always used 30 years” is a perfectly acceptable answer. It just doesn’t matter…like…AT ALL.

      • Tim Folkerts says:

        I completely agree that — mathematically — the baseline makes no difference. As you say, important results like the trend will be exactly the same.

        But reporting that the current month was “+0.24 C” or only “+0.12 C” (or even “-0.5 C” or “+1.2 C” from some other arbitrary baseline) *sounds* very different to a causal observer. Saying “we have not dipped below the baseline for nearly 9 years” sounds very different from “we were below the baseline just 2.5 years ago”.

        • bdgwx says:

          That…I absolutely agree with. And you bet that the misinformed will be supremely confused and not even realize it. Your comment above about the possibility of the anomaly dropping below zero and the misinformed proclaiming their previous prediction of such an event to be correct is a good example. Trying to explain that they aren’t as correct as thought is going to be a nightmare.

      • Dan M says:

        It seems to me that there are two objectives for plotting this data. One is to see the temperature trends, short and long term, and their response to events such as El ninos. A second objective is comparing the current value against a long term baseline. Therefore using data covering the longest period will yield a more accurate long term baseline unless there is something wrong with that part of the dataset. To say that “it doesn’t matter regarding the anomaly is absurd. The anomaly calculated on the 40 year baseline is twice (.24C) that of one calculated on the 30 year baseline (.12C). It matters because the anomaly number will be quoted on other discussions boards all over the internet.

        Sure, “long term” with respect to climate is not decades but centuries or millenia. But in this data set, we’ve only got 40 years of good data, so all 40 years should be used to determine the average value against which the anomaly is calculated. It’s just common sense.

        Plus, it protects against the charge that only a portion of the data was used in order to generate results more favorable to one’s own viewpoint.

        • bdgwx says:

          The only thing that changes when you use all 40 years vs a 30 year subset is the position of the 0 line in the chart. Nothing else changes.

          Nobody is going to charge UAH with using only a subset of the data to produce the anomaly baseline because none of us think it will make any difference. The results are all the same no matter what baseline UAH choses to use. The accuracy of the data stays the same. The warming trend stays the same. The relative ranking of the months stays the same. And all conclusions made with the 1981-2010 baseline are the exact same as the conclusions made with the 1991-2020 baseline. In fact, UAH could arbitrarily decide to make the baseline based only on the 1979 data. Everything still stays the same except the positioning of the 0 line in the chart.

          • Bindidon says:

            bdgwx

            Dan M is right, even if the anomaly wrt the mean of 1981-2020 is 0.20 instead of 0.24 C, when he writes

            ” It matters because the anomaly number will be quoted on other discussions boards all over the internet. ”

            ” Plus, it protects against the charge that only a portion of the data was used in order to generate results more favorable to ones own viewpoint. ”

            That namely is the point he made. It is no longer a simple technical detail.

            J.-P. D.

          • bdgwx says:

            Ah…so this isn’t a technical point, but a point about how the less informed may misinterpret the data because of the change. That I can agree with.

    • ren says:

      -Weve always used 30 years- is the best response to current trends.

    • gbaikie says:

      I think 30 or 40 years is weather. And century is more connected to global temperature. But we don’t have accurate record and don’t have long record of something approaching “more accurate”. So in meantime, 30 years seems ok. How about we wait another decade before going to 40 or 50 years?
      And as for global temperature, sea level rise, and what happening with Artic polar sea ice {and Argo floats] are going improve over time as metric of global temperature

  17. David Holliday says:

    Last month the delta for December 2020 was +0.27 deg. C. This month its +0.15 deg. C. No one else finds that a little misleading? For continuity would it be useful to maintain some reference to that?

    • ren says:

      No, 30 years is an appropriate period in climatology. This is half the recognized 60-year cycle and corresponds to current measurement methods.

    • bdgwx says:

      The baseline changed.

      NOTE: We have changed the 30-year averaging period from which we compute anomalies to 1991-2020, from the old period 1981-2010. This change does not affect the temperature trends.

  18. Rob says:

    The response of Salvatore Del Prete illustrates precisely why the baseline was changed by Dr Spencer when there was no logical reason to do so – to make unthinking followers believe there has been less warming. If Mr Del Prete does in fact understand simple arithmetic, he will prefer to act otherwise, knowing this is seen as a positive amongst his cohort.

    • bdgwx says:

      I guess I don’t understand the impetus for the change either. We’ll see what other groups do, but I suspect they’ll stick with what they had been using before. This is certainly going to confuse the less informed people.

      • Rob says:

        And we know who the “less-informed” people are, and their willingness to be deliberately “confused”.

      • barry says:

        The other groups will likely stay with the baselines they have chosen for continuity. RSS, I believe, has been using the 1979-1998 baseline consistently for the past 20 years.

    • No you are missing my point. I want to use earlier years so the warming that has taken place won’t be obscured.

      The use of later years may show a decline but based on a high temperature avg.

  19. ren says:

    It was not the rise in global temperature but the rise in galactic radiation during times of low solar activity that coincided with the pandemic.
    https://i.ibb.co/7QSWPCx/onlinequery.gif

  20. David Clancy says:

    What about continuing to make the old baseline readily available to users for plotting the data? That is, create a setup where if someone wants to see the same chart against the prior baseline, they can. The chart with the new baseline could be the default, and thered be a link to the same chart with the old baseline. I fully admit I am a non-expert in this area, but it seems like that approach would resolve the controversy on this message board, without (seemingly) any scientific compromise. Also it would largely moot any argument that the switch was effected to in some way obscure the raw amount of warming over time the response would be no, the new baseline makes sense for reasons X Y and Z, but the same chart on the prior baseline is readily available.

  21. David Clancy says:

    Typo corrected: What about continuing to make the old baseline readily available to users for plotting the data? That is, create a setup where if someone wants to see the same chart against the prior baseline, they can. The chart with the new baseline could be the default, and there would be a link to the same chart with the old baseline. I fully admit I am a non-expert in this area, but it seems like that approach would resolve the controversy on this message board, without (seemingly) any scientific compromise. Also it would largely moot any argument that the switch was effected to in some way obscure the raw amount of warming over time: the response would be no, the new baseline makes sense for reasons X Y and Z, but the same chart on the prior baseline is readily available.

  22. Rob says:

    If this is just a simple change of baseline, why have some months gone down by 0.12 while other months have gone down by 0.17?

    • bdgwx says:

      Ditto. I noticed that too.

    • Bellman says:

      Because the base value is calculated for each calendar month. If some months have warmed more than others in the past ten years they will have relatively lower anomalies under the new base period.

      I think under the old version, this January would have been 0.26°C, which means it would have been a drop of 0.01°C compared with December 2020. In the new version it’s a drop 0.03°C. (This is one reason why I don’t think it’s a good idea to obsess over the change from one month to another)

      • bdgwx says:

        Ah yes. Once the data files get posted we should be able to infer the changes in the monthly averages with 1991-2020 vs 1981-2010.

        • Bellman says:

          You can do that by looking at the average for each month of the old values during the new base period. They should all be zero for the old base period.

          1 0.143
          2 0.16
          3 0.128
          4 0.122
          5 0.124
          6 0.132
          7 0.130
          8 0.126
          9 0.166
          10 0.161
          11 0.134
          12 0.119

          There may be some rounding errors, but subtract this from an old value to get a new value, or add to a new to get an old.

        • bdgwx says:

          +1 yes of course. Thanks Bellman.

  23. David Clancy says:

    I meant on a going-forward basis in the future, a user can see the up to date chart on the old baseline if they want to call it up. Just an idea.

  24. Rob says:

    0.12 loseth March, April, May and December, all the rest loseth 0.13, except for January, February, September or October, in which case take your pick from 0.14, 0.16 or 0.17.

  25. David Clancy says:

    Ok. I get your point.

  26. Afterthought says:

    So again, literally nothing is happening.

  27. Dr Roys Emergency Moderation Team says:

    More importantly, the moon does not rotate on its own axis.

    • Bindidon says:

      DREMT

      Of course it doesn’t! Everybody knows that, DREMT.

      Apart from some poor ignorants, like Cassini, Newton, Mercator, Mayer, Lagrange, Laplace… and a few hundred people like Habibullin, Rizvanov, Rakhimov, Kopal, Koziel, Calamé, Eckhardt, Chapront, Migus, Moons, the Apollo and Chang’e teams etc etc etc, who continued and refined their work till nowadays.

      ‘We’ know: they were unfortunately all utterly wrong.

      J.-P. D.

      • Swenson says:

        Binny,

        Newton knew it. How many of the other authorities you appeal to do you also miscategorise?

        Think for yourself. Slavishly believing experts might not be the best approach, particularly if you misunderstand their writings.

        Have you figured out when your warming trend stops? Will there be a change to the laws of physics, or will temperatures rise to around 60,000 K in a million years?

        This does not seem realistic, but is the result of a 0.6 C per decade warming trend, after a million years.

        Over to you.

        • Bindidon says:

          Swenson

          ” Newton knew it. How many of the other authorities you appeal to do you also miscategorise? ”

          Newton perfectly understood that our Moon rotates about is axis.

          See his Principia Mathematica, Book III, Proposition XVII, Theorem XV (especially in the foot notes).

          You are exactly the same kind of dumb, ignorant and stubborn ass as are Robertson and ClintR.

          J.-P. D.

          • Clint R says:

            Wrong again, JD.

            Newton was clearly referring to rotating about its axis relative to the stars.

            This has been explained to you before. Why do you keep trying to use the same trick? Why do you keep doing the same thing over and over, hoping for different results?

            Look up Einstein’s definition of “insanity”.

          • Nate says:

            “Newton was clearly referring to rotating about its axis relative to the stars.”

            ‘about its axis.’ Yes indeed!

            First time anyone on the TEAM realized that. Congrats!

          • Bindidon says:

            ClintR

            ” Newton was clearly referring to rotating about its axis relative to the stars. ”

            What is really disgusting with people like you and Robertson is that you two always repeat the same nonsense, though you were clearly contradicted and did not reply – simply because you had nothing to reply.

            You are a dishonest person.

            Here is – again and again and again – my reaction to your lie.

            No astronomer describes a rotation ‘in relation to the stars’.

            Astronomers measure the exact duration of a rotation ‘in relation to the stars’.

            Simply because when you measure the duration of a movement in relation to an object being itself in movement, you inevitably will obtain an erroneous result.

            Newton has perfectly understood the problem.

            He wrote for example that with respect to Earth, the spots on the Sun rotate in 27 1/2 days, but they do that in 25 1/2 days with respect to the fixed stars.

            *
            You will never accept that you are wrong.

            You will repeat your nonsense all the time, exactly as does your friend-in-denial Robertson.

            ClintR, you must be mentally sick to repeatedly pretend the same nonsense.

            J.-P. D.

          • Bindidon says:

            I’m definitely sad of this discussion based on ignorance and lies.

            J.-P. D.

          • Dr Roys Emergency Moderation Team says:

            With respect to the fixed stars, astronomers can measure that the moon is rotating about the Earth/moon barycenter, and not on its own axis. The motion is referred to as “revolution” or “orbiting”. The Earth both “orbits” the sun/Earth barycenter and rotates on its own axis, whilst the moon only “orbits”.

            Once you understand what “orbiting” is, it is all really very simple to understand. “Orbiting” is motion in which the same side of the object remains facing towards the center of revolution, throughout.

          • Clint R says:

            Bindidon and Nate are so desperate.

            (DREMT, will they ever get it?)

          • Tim Folkerts says:

            “Orbiting is motion in which the same side of the object remains facing towards the center of revolution, throughout.”

            Does that rule also apply to elliptical orbits? Or do you need a special rule when the orbit is not a perfect circle? Also, when you say “center”, do you mean the center of the ellipse or the focus where the barycenter is?

          • Dr Roys Emergency Moderation Team says:

            I don’t know if they will ever get it, ClintR. I doubt they will. Just look at Tim Folkerts.

            I don’t post for them, I just post for anybody reading who might be interested.

            So, anyway:

            https://en.m.wikipedia.org/wiki/Rotation

            “A rotation is simply a progressive radial orientation to a common point. That common point lies within the axis of that motion. The axis is 90 degrees perpendicular to the plane of the motion. If the axis of the rotation lies external of the body in question then the body is said to orbit. There is no fundamental difference between a “rotation” and an “orbit” and or "spin". The key distinction is simply where the axis of the rotation lies, either within or outside of a body in question. This distinction can be demonstrated for both “rigid” and “non rigid” bodies.”

            An object that is rotating about an external axis, without rotating about its own center of mass, keeps the same side always oriented towards the center of revolution. So there is a source for the definition of “orbiting” that I mentioned.

          • Clint R says:

            Folkerts is still hung up about what the “center” of an orbit is. He’s either an idiot, or playing games with semantics.

            I vote “Both of the above”.

            A train on an oval track always has the same side facing the inside of the track. Possibly TF is too stupid to face that reality.

          • Nate says:

            “(DREMT, will they ever get it?)”

            Well, YOU, Clint, said, ‘about its axis’.

            You don’t seem to agree with DREMT or your previous self.

            Do you get that?

          • Nate says:

            “I don’t post for them, I just post for anybody reading who might be interested.”

            Those people should be aware that you are purposefully misleading them.

            Same Wikipedia article on Rotation

            “A rotation is a circular movement of an object around a center (or point) of rotation.”

            We all know that ORBITS are ELLIPTICAL.

            Thus ORBITS are NOT, in general, equivalent to a ROTATION, which is required to be a CIRCULAR MOVEMENT.

            For the 47th time you guys misrepresent and cherry-pick the facts, requiring us to correct you.

            This is the essence of trolling, and is pointless.

            Just stop.

          • Clint R says:

            Troll Nate, any rational person that follows this will quickly realize it is YOU that is the idiot.

            The statement in my comment was crystal clear. I even bolded the clarification.

            http://www.drroyspencer.com/2021/02/uah-global-temperature-update-for-january-2021-0-12-deg-c-new-base-period/#comment-606584

            Yet you tried to misrepresent my words.

            You are a troll, but there is no way you will stop because that requires maturity.

          • Tim Folkerts says:

            “A train on an oval track always has the same side facing the inside of the track. Possibly TF is too stupid to face that reality.”

            But the “side of a train” only faces the exact center of an ellipse at 4 points each orbit (when it reaches the major or minor axes). The “side of a train” only faces the foci twice per orbit (at the major axis.

            So it is simply incorrect to say one side of a train always faces toward a fixed point. Any rule would have to specify exactly which way a moon would face. (HINT: Moons do not stay oriented the way a train would. Nor do they always face one focus. Nor do they face the center of an ellipse.)

            The “rule” that “the same side of the object remains facing towards the center of revolution” is simply wrong — it does not match with how real orbits work.

            “A rotation is simply a progressive radial orientation to a common point.”
            But orbits are not rotations! Moons do not move in perfect circles. Therefore this definition does not apply.

          • Dr Roys Emergency Moderation Team says:

            Tim, nobody is denying libration happens. Still, the same side of the moon generally faces towards the Earth throughout the orbit. Libration means we see slightly more than that one side at various points.

            If you don’t like the Wikipedia entry on rotation, which plainly states that an “orbit” is just another word for a rotation about an external axis, then maybe you should try changing the entry. I’m sure the authors are aware that most orbits are elliptical, yet they happily state what they state. It’s not a problem for them, so why is it a problem for you?

          • Clint R says:

            What TF is trying to do is throw out enough nonsense to confuse the issue. It’s called “perverting reality”. He can’t admit that the same side of a body in pure orbital motion always faces the inside of the orbit. If he admits the truth, he knows his false “church” is found wrong. His cult doesn’t allow that.

            Denying reality is why they’re idiots.

          • Nate says:

            ‘relative to the stars’ is not helpful to your cause. It just shows that you are confused about the issue.

            All of us, including DREMT, have been discussing rotation relative to the stars.

            The issue has been the axis of rotation.

          • Nate says:

            Given that anyone can edit Wikipedia, it is a good place to start on a quest for information, and gets many things roughly right, but also has errors and inaccuracies.

            But when it ‘seems’ to agree with him, DREMT wants us to accept it as being the ultimate AUTHORITY even when it exhibits contradictions.

            Regardless, all sources agree that a ROTATION is circular motion around a point. And elliptical motion, in general, is not equal to circular motion.

            If we can’t agree on these basic facts then all is lost.

          • Dr Roys Emergency Moderation Team says:

            Clint R…whilst some of them obfuscate the issue (Group A), others won’t even accept that a ball on a string can be described as rotating about an external axis, and not about its own center of mass (Group B). There are endless disputes with people arguing that a ball on a string is rotating on its own axis. Until Group A starts correcting Group B, these discussions will carry on going nowhere.

            Once again, those from Group A still confused about rotation and elliptical orbits need to read these comments from ftop_t:

            https://www.drroyspencer.com/2020/12/uah-global-temperature-update-for-november-2020-0-53-deg-c/#comment-582080

          • Tim Folkerts says:

            “Tim, nobody is denying libration happens. Still, the same side of the moon generally faces towards the Earth… “

            That’s a start. A tidally locked moon does always face generally toward its planet. Now take the next step. Any robust theory should be able to predict *precisely* which way the moon will face. You should be able to state *why* libration occurs in your theory, and how big the librations will be.

            PS. “You” have one paragraph from a wikipedia article that supports your position. A paragraph that is directly contradicted by the very first sentence that defines “rotation”.
            “We” have the definition of rotation from that article. We have the wiki article about orbits. We have literally the rest of the internet and every astronomy textbook.
            Your “appeal to authority” actually weakens your case.

          • Clint R says:

            TF, you’re still trying to pervert reality. You’re desperate. Moon is NOT rotating about its axis. That’s why we only see one side of it. You keep trying to throw out nonsense. Libration is due to its orbital motion, as observed from Earth.

            All you have is garbage, and you keep flinging it, believing you can somehow achieve different results.

            That’s insanity.

          • Dr Roys Emergency Moderation Team says:

            Tim, I’m not making an appeal to authority. I’m simply showing you that the definition of “orbit” is a rotation about an external axis, and that an object that is rotating about an external axis (without rotating about its own center of mass) keeps the same side always pointed (generally) towards the center of revolution. These are just facts. It is not a “theory” as you keep suggesting.

            Also, you seem to be avoiding ftop_t’s comments…

          • Nate says:

            “I’m simply showing you that the definition of ‘orbit’ is a rotation about an external axis”

            “These are just facts.”

            These are opposite to the facts.

            Tim and I just pointed out, again, where your ‘source’ and many other sources, prove that definition is FALSE.

            But you continue to declare it is a ‘Fact’ regardless.

            Ellipses are not circles, as everyone understands.

            But you continue to claim the “authority” of a cherry pick of a Wikipedia post, while ignoring contradictory facts from the same article and others.

            This just shows that you have NO INTEGRITY whatsoever.

            Neutral observers take note: DREMT’s posts are DISHONEST and should be rejected.

          • Nate says:

            FTOP”An object orbiting elliptical around an external axis cannot also be rotating on its own axis and keep the same face of the object pointing toward the external center of rotation.”

            Duh!

            We all (except FTOP) know that the Moon DOES NOT keep the same face pointing to the center. It has LIBRATION due to its elliptical orbit and steady rotation rate.

            So FTOP wastes a lot of time DISPROVING what nobody thinks is true.

          • Dr Roys Emergency Moderation Team says:

            "Also, you seem to be avoiding ftop_t’s comments…"

            …because as you’ll note, he shows using the Desmos online tool that you can rotate an object through an elliptical orbit (i.e. it doesn’t have to be in a circle), and he was even able to recreate libration too.

            So, you have:
            1) the fact that an "orbit" is just another word for a rotation about an external axis.
            2) the fact that an object that is rotating about an external axis (without rotating about its own center of mass) keeps the same side facing the center of revolution throughout.
            3) the fact that an object can rotate through an elliptical orbit (i.e. rotation doesn’t have to be in a circle).
            4) the fact that libration can be accounted for by this rotation.

            Four facts for you to deny.

          • SkepticGoneWild says:

            DREMT,

            Ftop_t is AWOL because he got his ass whupped, and made a total fool of himself, proving he has no clue what he’s talking about:

            http://www.drroyspencer.com/2020/12/uah-global-temperature-update-for-november-2020-0-53-deg-c/#comment-608183

            YOU are just as clueless as he is, only worse, incessantly yelping the slogans of Tesla, because you have no brain of your own.

            https://giphy.com/gifs/DNCE-3oKIPusxB2uXOmoP0k

          • Nate says:

            None of those are facts. You’ve lost the argument, and now youve lost all credibility.

          • Dr Roys Emergency Moderation Team says:

            Now SGW is here to deny that a ball on a string can be described as rotating about an external axis, and not about its own center of mass…

            …and none of the others, that know better, will correct him!

          • SkepticGoneWild says:

            Yelp away, Fluffy.

          • Dr Roys Emergency Moderation Team says:

            OK, SGW.

          • Tim Folkerts says:

            DREMT: “Now SGW is here to deny that a ball on a string can be described as rotating about an external axis, and not about its own center of mass”

            A ball on a string CAN legitimately be described as rotating about an external point (the far end of the string). The ball (mostly) goes in a circle and (mostly) keeps a fixed orientation relative to the string while moving at a (mostly) constant speed. So can a horse on a merry-go-round.

            It is, however, worth noting that the total angular momentum of the system, L = I(omega) is NOT simply
            L = MRv = MR^2(omega_string)
            but
            L = MRv + (2/5)Mr^2(omega_ball).
            = orbital angular momentum + spin angular momentum.
            (R = radius from center of rotation to center of ball; r = radius of ball, M = mass of ball, v = speed of the center of the ball, omega_string = angular speed of the string; omega_ball = angular speed of ball).
            So even here, the *correct* calculation must include the rotation of the ball at the same angular speed as the string.

            But real orbits CANNOT be described like this. Real moons don’t travel in circles at constant speeds.

            Real moons maintain a constant total angular momentum (ignoring tiny tidal interactions). Newton proved MRV is constant (for circles and ellipses). That means (2/5)Mr^2(omega_ball) is constant, so omega_ball = angular speed of the moon is constant.

          • Dr Roys Emergency Moderation Team says:

            Tim, just because you can choose to calculate something a certain way does not mean that a ball on a string is actually rotating on its own axis in any true physical sense. From kinematics, there are two ways to describe the motion of a ball on a string:

            1) As a translation of the center of mass of the ball plus a rotation about that center of mass.
            2) As a rotation of the ball about an external axis, with no rotation about the center of mass of the ball.

            1) would be classed as general plane motion.
            2) would be classed as fixed axis rotation.

            However, if you read up on it, you will note that you should not treat as a general plane motion that which can be described as a pure rotation or a pure translation. I can link to an appropriate source if necessary. So, a ball on a string is not rotating on its own axis, at least as far as kinematics is concerned.

            I will only be moving on from this once you categorically confirm that you agree a ball on a string is not rotating on its own axis.

          • Nate says:

            This summarizes it well:

            “However, if you read up on it, you will note that you should not treat as a general plane motion that which can be described as a pure rotation or a pure translation.”

            Very good.

            So since we all know the Moon is moving on an elliptical path thru space, it CANNOT be described as a pure rotation.

            {Here’s where DREMT will jump in to say its perfectly ok to change fundamental definitions as needed.}

            But regardless, the Moon’s elliptical motion CANNOT be described as a pure rotation, and its rotational axis is tilted.

            So as DREMT AGREES: it can only be described as a General Plane Motion:

            “As a translation of the center of mass of the ball plus a rotation about that center of mass.”

            I think we can all thankfully say that the argument is over.

          • Dr Roys Emergency Moderation Team says:

            Still no response from Tim…

          • Nate says:

            Let me add to what Tim was saying about angular momentum.

            For a rigid body in a pure rotation, you can describe its angular momentum as L = I*omega.

            I is the sum (mr^2) of all the parts of the rigid body. Omega is the constant angular velocity of the rigid body.

            For the Moon, we CANNOT do that.

            If you try to write down its I, using parallel axis thm, I = Mr^2 +ICM, r is distance from center,

            but r is not a constant. So I is not constant. Nor is omega for the orbit, a constant.

            Its angular momentum can only be written as two parts. L= Mvxr + ICM*omega, where omega is its axial angular velocity. And v and r are vector velocity and distance of the CM

            Again this illustrates that the rigid-body-model is not appropriate.

          • Dr Roys Emergency Moderation Team says:

            No response from Tim, still.

    • Steve Samuels says:

      Here is a thought experiment for you. Suppose you could suddenly and instantaneously remove the Earth from the solar system. What would the Moon do?

      In terms of the motion of the Moon’s center of mass, a fraction of a second after the Earth vanished the magnitude of the instanteous velocity of the Moon would not change, and the direction would be tangent to the orbital curve at the point where the Earth vanished. An analogy would be if you were in the garden spinning a ball around at the end of a string, and then you cut the string. The ball would instantly take on a straight path. This is the basic idea of the hammer throw in track and field (athletics). The Moon’s motion would from then on be determined by the gravitational pull of the Sun and to a lesser extent the other planets. The mathematical equation for position is a second order differential equation which requires two inital conditions (position and velocity) at the instant the earth is removed. The fact that the Earth was there previously has no relevance. The same subsequent motion of the Moon could be obtained by “throwing” it with the same velocity from the same position it was in when the Earth was removed.

      Hopefully this is not controversial.

      The more interesting question is whether the Moon would be spinning after the Earth is removed. Again, the rotation of the Moon from the reference point of the Sun or any distant point would not change in the instant after the Earth is removed. The “Moon doesn’t rotate on its axis” crowd would have to insist that after the Earth is removed, the Moon would move on with no rotation since the absence of the Earth cannot change the Moon’s angular momentum about its axis. Hence the moon would instantly switch from showing the same side to the Earth to showing the same side to the Sun. I suggest you try this with a tennis ball and a string in the garden.

      SS

      • Clint R says:

        Steve, the instant Earth disappeared, Moon would still have its instantaneous linear momentum, but no angular momentum. If its velocity vector were directed toward Sun, it may even impact that body, or go into orbit around it. If its velocity vector were directed away from Sun, it may have enough escape velocity to get away.

        But, you’re correct in that if Moon got into a new orbit around Sun, it would have only one side facing the center of that orbit. It has no axial rotation now, and gravity does not provide axial rotation.

        • gbaikie says:

          Earth is going about 30 km/sec around the Sun and our moon is going about 30 km/sec around the sun.
          And Moon is going about 1 km/sec around Earth.

          Or Moon would still be going around the Sun, but one could have hohmann transfer of about 1 km/sec. So if timed right, it’s solar orbit could lower in perihelion or raise in Aphelion.
          Currently Earth at
          Perihelion (10^6 km) 147.092
          Aphelion (10^6 km) 152.099

          So it lower the Perihelion of 147.092
          Or raise Aphelion of 152.099
          So could raise a lot get near Mars distance
          Or lower a lot and get near Venus.
          Or it raise Perihelion or lower Aphelion
          An interesting question is if does inefficient hohmann transfer,
          Say, happen near Equidox??
          Also moon tilted relative to Sun so possible to change it’s inclination to Sun. We are at zero inclination to Sun {because universe revolves around us:) but depending when, it could remain at zero or not. Zero would be “Moon’s Equidox” relative to Earth {a half moon as we see it}.

          • gbaikie says:

            Rather than “universe revolves around us”, I should said, “spins around us”.

            And the 1.5 degree tilt of moon remains a 1.5 degree tilt to the Sun. But without Earth, Moon’s tilt would wander more over enough time. And Moon gets a 365 day, day. With same tilt {for some time}.

          • Clint R says:

      • Nate says:

        “Moon would still have its instantaneous linear momentum, but no angular momentum. ”

        Oh? The ease with which Clint discards laws of physics is astonishing.

        We’ll add Conservation of Angular Momentum to the growing list of physics laws and principles that Clint denies.

        But no worries, TROLLS dont need to make sense.

        • Clint R says:

          Wrong again, troll Nate.

          Angular momentum is conserved. Moon has no angular momentum before Earth vanishes, so it has no angular momentum after.

          But you’re correct in that you never make any sense.

        • Nate says:

          “Moon has no angular momentum”

          You and DREMT continually claimed the Moon is simply orbiting and therefore it is simply ROTATING around the barycenter.

          So we have a mass that has ROTATION but NO ANGULAR MOMENTUM?

      • bobdroege says:

        A similar experiment has already been done and referenced on this site on one of the thousands of posts about this topic.

        A guy on a space station, which orbits the Earth spin a ball on a string and released it, the ball referenced to the earth continued to spin and did not keep one face towards the earth.

      • ftop_t says:

        @Steve

        The linear velocity of the closest point of the moon is

        v(closest) = (r-r(1)) x w

        The linear velocity of the farthest point of the moon is

        v(farthest) = (r+r(1)) x w

        Where:
        r is the radius from the barycenter to the center of the moon
        r(1) is the radius of the moon
        w is the angular velocity of the moon’s orbital rotation

        Bottom line is the far side of the moon is moving faster by the diameter of the moon (times the same angular velocity) than the near side. This variance in velocity will cause the orbital rotation to convert to axial rotation when you remove the Earth.

        It is the same principle as releasing a ball from over your head. The ball is not rotating in your hands, but the higher point is moving faster than the lower point which is near your head.

        • Nate says:

          FTOP,

          All this is true except:

          “This variance in velocity will cause the orbital rotation to convert to axial rotation when you remove the Earth.”

          The Moon has axial-spin, and spin angular momentum after leaving orbit.

          While in orbit it had orbital angular momentum, Mvr, associated with orbiting at speed v, at a distance, r from the barycenter.

          But this is NOT converted to spin angular momentum. It is still present after the Earth vanishes, since the Moon still has M and v, and is still r from the barycenter.

          Thus by conservation of angular momentum it MUST ALSO have had spin angular momentum, and thus axial-spin WHILE IN ORBIT.

          • ftop_t says:

            Nope.

            It has angular momentum relative to the barycenter. Not relative to its own axis. That angular momentum gets imparted into axial rotation upon release

            The formula for the “closest” point’s position can be seen in the proof section here:

            https://en.wikipedia.org/wiki/Epicycloid

            axial rotation radian = (alpha)
            orbital rotation radian = (theta)
            R = orbital radius to “closest” point
            r = rotation object’s radius

            Starting as the “closest” point; its location is:
            x = (R)COS(theta)
            y = (R)SIN(theta)

            As rotational movement happens, the “closest” point is found by:

            x = (R + r)COS(theta) – (r)COS((alpha)+(theta))
            y = (R + r)COS(theta) – (r)SIN((alpha)+(theta))

            (see proof linked above)

            In order to remain in the position of “closest”, its current location must equal
            x = (R)COS(theta)
            y = (R)SIN(theta)

            Thus,
            x = (R)COS(theta) = (R + r)COS(theta) – (r)COS((alpha)+(theta))
            y = (R)COS(theta) = (R + r)COS(theta) – (r)SIN((alpha)+(theta))

            This condition can only be true when
            (alpha) = 0

            This is obvious when you combine terms:
            x = (R + r)COS(theta) – (r)COS((ZERO)+(theta))
            y = (R + r)COS(theta) – (r)SIN((ZERO)+(theta))

            Becomes
            x = (R + r)COS(theta) – (r)COS(theta)
            y = (R + r)COS(theta) – (r)SIN(theta)

            Consolidating r(COS) results in
            x = (R)COS(theta)
            y = (R)SIN(theta)

            This is a great visual that shows any axial rotation will move the “closest” point farther from the center of rotation and since the closest point always stays the same; there is no axial rotation.

            https://www.geogebra.org/m/zGPdwNBY

          • ftop_t says:

            ** Correcting y-axis where COS was accidentally used instead of SIN **

            Nope.

            It has angular momentum relative to the barycenter. Not relative to its own axis. That angular momentum gets imparted into axial rotation upon release

            The formula for the closest points position can be seen in the proof section here:

            https://en.wikipedia.org/wiki/Epicycloid

            axial rotation radian = (alpha)
            orbital rotation radian = (theta)
            R = orbital radius to closest point
            r = rotation objects radius

            Starting as the closest point; its location is:
            x = (R)COS(theta)
            y = (R)SIN(theta)

            As rotational movement happens, the closest point is found by:

            x = (R + r)COS(theta) (r)COS((alpha)+(theta))
            y = (R + r)SIN(theta) (r)SIN((alpha)+(theta))

            (see proof linked above)

            In order to remain in the position of closest, its current location must equal
            x = (R)COS(theta)
            y = (R)SIN(theta)

            Thus,
            x = (R)COS(theta) = (R + r)COS(theta) (r)COS((alpha)+(theta))
            y = (R)SIN(theta) = (R + r)SIN(theta) (r)SIN((alpha)+(theta))

            This condition can only be true when
            (alpha) = 0

            This is obvious when you combine terms:
            x = (R + r)COS(theta) (r)COS((ZERO)+(theta))
            y = (R + r)SIN(theta) (r)SIN((ZERO)+(theta))

            Becomes
            x = (R + r)COS(theta) (r)COS(theta)
            y = (R + r)SIN(theta) (r)SIN(theta)

            Consolidating r(COS) results in
            x = (R)COS(theta)
            y = (R)SIN(theta)

            This is a great visual that shows any axial rotation will move the closest point farther from the center of rotation and since the closest point always stays the same; there is no axial rotation.

            https://www.geogebra.org/m/zGPdwNBY

          • ftop_t says:

            ** Man, this site is FUBAR, it just drops characters like “-“, hope it posts correctly this time **

            Nope.

            It has angular momentum relative to the barycenter. Not relative to its own axis. That angular momentum gets imparted into axial rotation upon release

            The formula for the closest points position can be seen in the proof section here:

            https://en.wikipedia.org/wiki/Epicycloid

            axial rotation radian = (alpha)
            orbital rotation radian = (theta)
            R = orbital radius to closest point
            r = rotation objects radius

            Starting as the closest point; its location is:
            x = (R)COS(theta)
            y = (R)SIN(theta)

            As rotational movement happens, the closest point is found by:

            x = (R + r)COS(theta) – (r)COS((alpha)+(theta))
            y = (R + r)SIN(theta) – (r)SIN((alpha)+(theta))

            (see proof linked above)

            In order to remain in the position of closest, its current location must equal
            x = (R)COS(theta)
            y = (R)SIN(theta)

            Thus,
            x = (R)COS(theta) = (R + r)COS(theta) – (r)COS((alpha)+(theta))
            y = (R)SIN(theta) = (R + r)SIN(theta) – (r)SIN((alpha)+(theta))

            This condition can only be true when
            (alpha) = 0

            This is obvious when you combine terms:
            x = (R + r)COS(theta) – (r)COS((ZERO)+(theta))
            y = (R + r)SIN(theta) – (r)SIN((ZERO)+(theta))

            Becomes
            x = (R + r)COS(theta) – (r)COS(theta)
            y = (R + r)SIN(theta) – (r)SIN(theta)

            Consolidating r(COS)/r(SIN) results in
            x = (R)COS(theta)
            y = (R)SIN(theta)

            This is a great visual that shows any axial rotation will move the closest point farther from the center of rotation and since the closest point always stays the same; there is no axial rotation.

            https://www.geogebra.org/m/zGPdwNBY

          • Ball4 says:

            “It has angular momentum relative to the barycenter. Not relative to its own axis.”

            Nate, ftop_t demonstrates jumping observations from the inertial frame to an accelerated frame with that statement & without informing the reader.

            ftop_t has already demonstrated with desmos that Earth’s moon has both angular momentum about a barycenter AND angular momentum about the moon’s own axis rotating once per orbit of Earth to keep the same face to Earth when observed from the single inertial frame of black cartesian coordinates shown here:

            http://www.drroyspencer.com/2020/12/uah-global-temperature-update-for-november-2020-0-53-deg-c/#comment-584290

        • Nate says:

          “It has angular momentum relative to the barycenter.” “The angular momentum gets imparted into axial rotation upon release”

          Declarations without evidence FTOP. There is no mechanism you can identify for angular momentum to be transferred from one axis to the other in this problem.

          None of your math addresses that.

          This is standard physics. The Moon has orbital and spin angular momentum.

          When in orbit, the parallel axis thm is used to find the total angular momentum, and it is the sum of two terms. The first is Orbital, mvr. The second is Spin, Icm*omega.

          Notice that the second term contains the moment of inertia of the Moon about its own center of mass.

          That is only needed when there is rotation around the CM.

          • ftop_t says:

            @Nate,

            Study this diagram VERY CAREFULLY
            https://en.wikipedia.org/wiki/Epicycloid#/media/File:Epizykloide_herleitung.svg

            Please provide the value for the angle (alpha) where the length of the radian denoted as: l(r) is ZERO.

            (alpha) represents the axial rotation.

            If the object is rotating on its own axis:

            (alpha) must be greater than ZERO
            l(r) must be greater than ZERO
            the side closest to the origin (barycenter) must move away from the barycenter

            All sides of the rotating object will at some time interval be closer to origin that point “P”

            Since time is infinite, any lengthening of l(r) will eventually result in a full rotation of the Point “P” away from and back toward the barycenter.

          • Nate says:

            Ill take a look at it FTOP.

            Meanwhile, address the specific physics points in my post please. Where do you disagree and why?

          • Nate says:

            FTOP,

            You see there are good physical reasons to SEPARATE planetary motions into center of mass (CM) orbit, and rotation around the CM.

            Orbits are well known to be elliptical. And this is explained by Newtons law of gravity. Newtons law can easily account for the elliptical path of the CM, thru space.

            There are Constants of the orbital motion, the energy, E, and the angular momentum, Lorb.

            Rotations around the center of mass (Spin) are best understood as independent motions with their own constant angular momentum, Lspin, and their own axis, that may have an axial tilt (obliquity).

            Thus the Moon’s orbit is an elliptical path of its CM, and rotation around the CM. Due to tidal-locking they have the SAME average angular rate, a so-called 1-1 resonance.

            Thus the Moon keeps the same face toward Earth on average, but in fact has Libration, due to the CONSTANT Spin angular velocity, and the VARYING orbital angular velocity, and its obliquity of 6.7 degrees.

            There is no compelling reason for physics or astronomy to abandon this approach to orbital mechanics, and replace it with a description that works ONLY for purely circular, tidally-locked orbits, with obliquity = 0.

          • SkepticGoneWild says:

            ftop_t says:

            (alpha) represents the axial rotation.

            Wrong! That’s where you mess up, proving you are completely ignorant of inertial reference frames.

          • Dr Roys Emergency Moderation Team says:

            SGW, alpha has to represent the axial rotation if you are keeping the axial rotation separate from the orbital motion. Orbital motion (without axial rotation) already involves the object changing orientation wrt an inertial frame, you see. An object that is orbiting (without rotating on its own axis) already points through e.g. N, E, S, W and back to N as it completes one orbit. That is the outside (to the orbit) face of the object.

            The inside face remains pointing towards the center of revolution throughout.

            So when you are adding axial rotation as well as orbital motion, alpha is going to represent that axial rotation.

          • ftop_t says:

            @Nate

            First, we are discussing what “would happen” if the earth were removed. So any position taken is theoretical.

            I believe we both agree that “in theory” the moon would move tangential to its orbital path if the earth was removed and it would exhibit axial rotation.

            The question is, assuming we are correct, why?

            It is interesting that you cite the parallel axis theorem above.

            If a person swings a bat in their hands, all portions of the bat have angular momentum based on their radius from the person’s body, but the bat is not rotating around its own axis.

            The axis of rotation is the batter’s body.

            https://www.youtube.com/watch?v=-Oq0fQJaQY0

            Upon release, the angular momentum of the swing gets imparted on the bat and it spins on an internal axis around its center of mass.

            The axis of rotation is external to the bat before it is released and gets imparted on the bat after release conserving the angular momentum.

            You correctly note that the angular momentum can move to a different axis of rotation based on the parallel axis theorem. This includes moving from external to internal.

          • Nate says:

            And FTOP,

            Your Alpha is the angular velocity of the object in the rotating reference frame, as noted by Ball4.

            So it is self-evident that Alpha must = 0 for the orientation to remain fixed toward the orbit center.

            But the relevant reference frame for the Moon is the inertial frame. In that frame alpha not/= 0.

            Thus you have proven the Moon must be rotating on its axis. Which agrees with the discussion above of Orbital angular momentum and Spin angular momentum.

            The Moon has spin angular momentum.

          • Nate says:

            “You correctly note that the angular momentum can move to a different axis of rotation based on the parallel axis theorem. This includes moving from external to internal.”

            Your batter and bat are ONE body. And that body as a whole has rotation and an axis of rotation.

            You describe the batter releasing the bat. Then the bat is an independent body. And then you can describe the motion of that independent body with its own axis of rotation.

            Whereas for the Moon case, the Moon is always an independent body. In orbital mechanics we need to describe the Moon’s motion while in orbit.

            We do so by describing the elliptical orbit of its CM around the barycenter, combined with its spin around its CM.

            The two independent motions have angular momenta Lorb = mvr and Lspin =Icm*omega.

            As discussed above, this is the most useful way to describe planetary motion from the physics point of view.

            We can see, for example, that Lspin, and the spin angular velocity, omega, remains fixed throughout the orbit, helping us to explain Libration.

            And in the thought experiment with Earths gravity vanishing, we can see that the Moon continues with the same Lspin, and omega, due to the fact that it was an independent body and its angular momentum is conserved.

          • SkepticGoneWild says:

            Poor clueless DREMT yelps:

            SGW, alpha has to represent the axial rotation if you are keeping the axial rotation separate from the orbital motion!

            Alpha does not represent the axial rotation of the outer circle. Axial rotations need to be referenced to the inertial reference frame. Alpha represents the axial rotation of the outer circle wrt the rotating line extending from the origin to the center of the outer circle. Ftop_t makes a rookie mistake using a rotating reference frame. His so called proof is totally worthless.

            He obviously did not heed his own advice to Study this diagram VERY CAREFULLY

          • Dr Roys Emergency Moderation Team says:

            Sorry SGW, you are already referencing the orbital motion to the inertial reference frame. And orbital motion already involves the object changing its orientation wrt the inertial frame, e.g. the object faces through N, E, S, W and back to N as it completes each orbit. That is without axial rotation. So, in order to keep the axial rotation separate from the orbital motion as just described, alpha has to represent the axial rotation. It’s not that you are using a rotating frame. It’s that you are using an inertial reference frame for the orbital motion, and in order to keep axial rotation separate from the orbital motion, it has to be represented by alpha.

          • SkepticGoneWild says:

            Poor DREMT did not study the diagram carefully, or can’t read a simple diagram. The angle alpha is clearly shown. Angle alpha is measured from the ray of the angle formed by line segment Rr, which is rotating. Inertial reference frames do not rotate. You clearly do not know what you are talking about.

            https://en.wikipedia.org/wiki/Epicycloid#/media/File:Epizykloide_herleitung.svg

            Plus you are using one of your made up definitions: orbital motion.

          • SkepticGoneWild says:

            DREMT’s explanation had nothing to do with kinematics and everything to do with quackery. Pure nonsense.

          • Dr Roys Emergency Moderation Team says:

            You are not listening to me. The number one rule here is that orbital motion and axial rotation have to be two completely separate motions. We are already referencing the orbital motion to the inertial reference frame. That is motion in which the same side of the object always remains pointing towards the inside of the orbit. The only way to keep axial rotation separate from that motion is to have alpha represent the axial rotation.

            There is also only one way to have axial rotation as you intend it to be. That is if you have your definition of orbital motion as being motion in which the same side of the object remains pointing towards the same distant star, throughout.

            The problem I have with explaining this to people is that it requires them to be able to mentally process and visualize two separate motions, and the act of adding them together, and most of the stubborn idiots on here seem to be unable to do that. Even now, you will be preparing a response with the words, "an orbit is just a path, clown" in it, completely unaware that even from the "Spinner" perspective, "an orbit" necessarily includes the orientation of the object in its definition. If not, then you can’t correctly separate the axial rotation from the orbital motion.

            OK, you can respond without listening to or understanding what I’m saying now. Off you go.

          • SkepticGoneWild says:

            DREMT spouts more nonsense, but refuses to look at the diagram, which is the topic at hand. Ftop_t wants you to CAREFULLY examine it. His whole proof is based on that diagram.

          • Dr Roys Emergency Moderation Team says:

            I have looked at, and understand, the diagram. I understand the point you are making. I am not spouting nonsense. Try reading and understanding what I am saying, since it refutes what you are saying.

          • Nate says:

            “There is also only one way to have axial rotation as you intend it to be. That is if you have your definition of orbital motion as being motion in which the same side of the object remains pointing towards the same distant star, throughout.”

            Which is the standard definition of orbit. Orbit is the trajectory of an object thru inertial space. Definitions need to be universally accepted, and yours is not.

            Sorry, you don’t get to change them whenever you want in order to ‘prove’ your beliefs correct.

            And NO, you cannot determine rotation rate of a celestial object using an arbitrary rotating reference frame of your choosing that cancels out its rotation.

            Then claim: ‘See. The the Moon is not rotating!’

            Just stop being ridiculous.

          • SkepticGoneWild says:

            DREMT shrieks:

            You are not listening to me!

            You got one thing right.

            I’ll wait for ftop_t to show his face. I can only stand so much drivel.

          • Dr Roys Emergency Moderation Team says:

            I’m sorry for your argument loss, but happy with the win.

          • Nate says:

            And sorry, no credits are given out for delusions..

          • ftop_t says:

            @Nate,

            Aside from the fact that with the number of posts and constant activity, I am curious if anyone is employed who follow this site?!?

            That aside, this comment is fundamentally wrong
            http://www.drroyspencer.com/2021/02/uah-global-temperature-update-for-january-2021-0-12-deg-c-new-base-period/#comment-610653

            (alpha) is the axial rotation of point “P” around the center of the smaller circle.

            This does not change, regardless of reference frame.

            If I place a 33-lp on a record player and mark a point on the outside of the record with a dot, it will make 33 revolutions per minute around the post in the center of the record player.

            If I plug the record player into my RV and drive down the road in a straight line, the dot will still make 33 revolutions per minute.

            In either case, the location of “P” will consist of applying:
            1. Locational change in the post (which may be zero, a translation, or a rotation)
            2. (alpha) of “P” around the post on the record player

            These are two separate motions

            If I drive my RV around the 285 Loop in Atlanta (assuming) there is an external axis in downtown for orientation. The location of “P” will be:
            1. Rotation of the RV around the center of town (theta)
            2. (alpha) of “P” around the post on the record player

            Because (alpha) is zero when the record player is turned off, you can find the location of “P” based only on the change in #1, but that is because (alpha) is zero and that portion of the equation can be resolved to not exist.

            Resolving for (theta) and then calling (alpha) non-zero is applying a value from another part of the equation to a zero value.

            (alpha) is not arbitrary. It would have the same value if the small circle was stationary, translating in a straight line, rotating about an external axis. Either the record player is on or it is off.

          • Nate says:

            Ftop.

            Lets stick with your original diagram, please, since all is well defined.

            “(alpha) is the axial rotation of point ‘P’ around the center of the smaller circle.
            This does not change, regardless of reference frame.”

            The line called R is vector, connecting the center of the big circle to the center of the small circle, is rotating around the center. Yes?

            Alpha is an angle measured from R. IOW alpha is measured RELATIVE to R, which is ROTATING.

            Thus alpha is measured in a ROTAING REFERENCE FRAME. It is unambiguous.

            If I stand at the center of the small circle, with my arm pointing always to P, and alpha is 0, when I look up, I will see the stars rotating around. I am standing still in a rotating frame.

          • Ball4 says:

            ftop_t writes 7:20am about axial rotation: “This does not change, regardless of reference frame.”

            Not in field of relativity. ftop_t should be able to learn about relativity from that remark. Axial rotation of point “P” around the center of the smaller circle external axis does not change because ftop_t remains observing from the inertial frame in the RV.

            Building on what Nate wrote, ftop_t should climb into the accelerated frame on the spindle of the LP record at 33rpm and find that ftop_t has joined the “non-spinners” frame because from that accelerated frame point “P” is observed fixed to the LP (non-spinning about center) and the RV is now observed spinning about ftop_t.

            Thus reference frames do matter & need to be accounted for in firld of relativity for which ftop_t does not account correctly in many desmos applications.

          • Dr Roys Emergency Moderation Team says:

            The “Spinners” define “orbital motion without axial rotation” as movement in which the same side of the orbiting body remains oriented towards a distant star, throughout.

            The “Non-Spinners” define “orbital motion without axial rotation” as movement in which the same side of the orbiting body remains oriented towards the inside of the orbit, throughout.

            Axial rotation then has to be kept separate from the motion described in the above definitions, in each case.

            If you think it through, you should see how this transcends reference frames.

          • Nate says:

            And ftop. In Astrophysics when the rotational speed (axial spin rate) of a celestial object is measured and published, it is always wrt to inertial space of the stars. Thus it is unambiguous and univerally understood.

            Your alpha is not that, since it is a rrelative speed.

          • Nate says:

            And again, from the physics POV, the standard Orbit has no rotation rate specified. It is just the path of the CM.

            Why is that?

            Because Newtons law of gravity, when solved as Newton first did, for the orbit of a spherical planet, the path thru space of CM is found to be an ellipse. And no orientational change is found. A planet can have spin and this has no impact on orbit.

            The idea that the planet may or may not be tidally locked and have a 1:1 or 1:2 resonance with the orbit was not part of his analysis.

        • Dr Roys Emergency Moderation Team says:

          Ball4 continues to link to something that proves him wrong. In the Desmos link you keep posting, the object is orbiting the central point with the same face always oriented towards the center of revolution. There are two sliders to control the motion of the object. Only the external axis rotation slider is moving. Thus the object is only rotating about the external axis, not about its internal axis. The internal axis rotation slider is not moving!

          • Ball4 says:

            The accelerated frame internal (relative to its own) axis rotation slider is not moving from zero since it shows the moon has orbital momentum but as ftop_t writes: “Not relative to its own axis.” in the accelerated frame motion that internal axis slider controls.

            Relativity is hard; neither ftop_t nor DREMT can deal with relativity correctly but Nate shows them it can be done.

          • Dr Roys Emergency Moderation Team says:

            All from the inertial reference frame:

            Only the external axis rotation slider is moving. Thus the object is only rotating about the external axis, not about its internal axis. The internal axis rotation slider is not moving!

    • Bindidon says:

      Steve Samuels

      Oooooooh…

      I’m sincerely afraid you’ve just put your finger in a hornet’s nest.

      J.-P. D.

    • Dr Roys Emergency Moderation Team says:

      Steve, whatever would happen to the moon after the Earth is removed, whether it spun on its own axis or not, does not change the fact that it is not rotating on its own axis now.

      A ball on a string being whirled about your head is not rotating on its own axis, it is rotating about an axis that is external to the ball. Even Bindidon would agree with that. Yet when the string is cut, the ball does indeed rotate on its own axis upon release. As Tesla put it "in angular motion the axial rotation is nothing more than an abstract conception; in rectilinear movement it is a positive event".

      By the way, this is about the twentieth time this exact same point has been raised.

  28. tygrus says:

    Thank you for clearly stating the change & updating the datasets.
    But..
    Having the various sources of data (ocean, land, air, satelite, models, whatever) using different baseline periods is annoying & makes comparisons much harder.

    I wish they would all used the same baseline period and stick to it to make life a lot easier. I know some data sets start at different times but this moving the goalposts allows less scrutiny of changing data (so called corrections in other data sets).

    • bdgwx says:

      +1. I really wish everyone would just standardize on one period. One problem with UAH, RSS, and others is that their datasets begin in 1979 so the period would have to be after that. But since most (all?) temperature datasets have data at least back to 1979 it seems like everyone could standardize on 1981-2010.

      • Yes and just use that baseline for the foreseeable future.

      • Bindidon says:

        Exactly.

        I don’t understand why RSS did not move, like did UAH, from the old 1979-1998 baseline to WCO’s standard.

        The same holds of course for all surface providers, with the notable exception of Japan’s Met Agency, which did that many years ago (their grid data, however, still is based on 1971-2000).

        J.-P. D.

  29. Bindidon says:

    I see some commenters being irritated by the fact that the new monthly anomalies do not equally differ for each month.

    Bellman got it right.

    By using, in Roy Spencer’s data sets for the atmospheric layers LT, MT, TP and LS, the anomaly files and the climatology file, we can reconstruct the absolute data, and generate absolute time series together with the corresponding 12 month baseline for the current reference period.

    For LT these are the files tltmonamg.1978_6.0 till tltmonamg.2020_6.0 (anomalies), and tltmonacg_6.0 (current climatology data for 1981-2010), unitl now located in the directory

    https://www.nsstc.uah.edu/data/msu/v6.0/tlt/

    *
    The old 12 month baseline for 1981-2010 is, in C:

    -10.11
    -10.04
    -9.85
    -9.43
    -8.83
    -8.18
    -7.86
    -8.04
    -8.68
    -9.37
    -9.88
    -10.08

    If I made no errors, the new 12 month baseline for 1991-2020 should now be:

    -9.97
    -9.88
    -9.72
    -9.31
    -8.70
    -8.05
    -7.73
    -7.92
    -8.51
    -9.21
    -9.75
    -9.96

    The difference between 1991-2020 and 1981-2010 then is

    0.14
    0.16
    0.13
    0.12
    0.12
    0.13
    0.13
    0.12
    0.17
    0.16
    0.13
    0.12

    If we now finally consider the absolute values for 2020

    2020 1 263.60
    2020 2 263.86
    2020 3 263.77
    2020 4 264.10
    2020 5 264.87
    2020 6 265.39
    2020 7 265.72
    2020 8 265.53
    2020 9 265.04
    2020 10 264.32
    2020 11 263.80
    2020 12 263.34

    we then see how the anomalies differ, depending of the reference period chosen resp. the 12 month baseline generated out of it.

    J.-P. D.

    • Bindidon says:

      Sorry, the months for 2020 were posted in K; here are they in C:

      -9.55
      -9.29
      -9.38
      -9.05
      -8.28
      -7.76
      -7.43
      -7.62
      -8.11
      -8.83
      -9.35
      -9.81

    • Gordon Robertson says:

      binny…”If I made no errors, the new 12 month baseline for 1991-2020 should now be:”

      I wonder if you are ever going to understand that the numbers are not about statistics, they are about physical phenomena in the atmosphere, surface and oceans. All of those numbers are based on physical phenomena and not on the blind number crunching you do in your Excel spreadsheets.

      Due to the complexity of the atmospheric interface with the surface/oceans and the vastness and turbulent nature of both, it is difficult to extract meaningful numbers to represent the reality. In fact, it’s likely that a global average has no meaning. Therefore, any statistical analysis has to be even more vague.

      Ask yourself what is going on in the real world to produce such data so that when presenting an apparently concise statistical analysis you can offer a disclaimer that all of your analyses are ballpark figures that likely have no accuracy, let alone meaning.

      Having said that, NOAA and their kinder, NASA GISS and Had-crut, are playing statistical games and have no interest in what is going on in the real world and what has transpired. Their goal all along has been to alter the temperature record to support the anthropogenic theory.

      • Bindidon says:

        Ha ha ha ha haaah…

        Robertson the dumbie spouts one more time his absolutely ignorant trash.

        Weiter so!

        J.-P. D.

      • Bindidon says:

        Robertson

        ” All of those numbers are based on physical phenomena and not on the blind number crunching you do in your Excel spreadsheets. ”

        If you had a brain below your skull, and a bit of experience out of some real professional life, you would have understood that all numbers here come directly from UAH’s data, publicly accessible in

        https://www.nsstc.uah.edu/data/msu/v6.0/tlt/

        and not out of any alleged ‘blind number crunching’.

        How is it possible to be so dumb?

        J.-P. D.

        • nurse ratchet says:

          My apologies. Gordon always has a hissy fit every time Roy presents new numbers. It is getting worse – he now has no faith in numbers at all. He thinks they are a cunning device to confuse and enslave everybody.
          Time to up his medications.

  30. Bindidon says:

    I sincerely hope that the UAH team will save, for all layers of the V6 revision, the current anomalies with the 1981-2010 climatology, and create a new tree for all data generated wrt the monthly means of 1991-2020…

    J.-P. D.

  31. David Holliday says:

    I agree with this. There should be a reference to the start of the satellite era. Otherwise, there will be claims the new magnitude delta is misleading. And before you respond. Yes. I understand the trend remains the same.

  32. Bindidon says:

    Regardless the reference period chosen to compute a 12 month baseline and corresponding anomalies out of UAH’s absolute grid data, one thing remains equal: the absolute values!

    https://tinyurl.com/gzw9qqoi (grrr, again the bloody ‘d c’)

    Unless, of course, something wrong is detected a posteriori in their construction.

    J.-P. D.

  33. Eben says:

    I have been on this blog since it started , the early charts were totally different including the zero line in a completely different place ,
    It has evolved since , you newbees just don’t know that

    • Rob says:

      Yes, the length of the baseline period had to increase, at least until there was 30 years of data. There is no reason why the length of the baseline could not increase to 40 years. But there is *no* justification for translating the 30 year baseline period. And no, that has not happened before. The 80s were always included in the baseline.

  34. Ken says:

    Where be the baseline?

    It matters naught. Yards, Meters, or Cubits, the distance between two points remains the same.

    Baseline isn’t a measurement either; just an arbitrary standard. The big deal is the difference between start and end points. 0.5C (or K)

    • Rob says:

      Except only NOAA and NASA are predicting this. The other half dozen or so are not.

      • Swenson says:

        R,

        And?

        Do you really think that the future is determined by vote?

        Are you only pretending to be stupid?

        • Rob says:

          It would be clear to any intelligent person that I am pointing out that the future is not determined by one or two predictions. I made no inference of my my own. Do you qualify?

          • Swenson says:

            R,

            The future is not determined by any number of predictions, is it?

            Try a different way of trolling.

            Maybe condescension might make you appear more intelligent.

            Or pointing out the blindingly obvious.

          • Rob says:

            Evan when I agree that ‘the future is not determined by vote’, you choose to be disagreeable. Why is that?

    • Bindidon says:

      It is always astonishing to see that while NOAA is permanently discredited for calculating excessively high temperature anomalies, they are rated positively when they show something that can be interpreted as … cooling.

      Ah! Comme le monde est simple pour certains…

      J.-P. D.

  35. Rob says:

    It seems people did not understand the point in asking about the different amounts by which each month fell under the readjustment.

    The point is to enquire why Dr Spencer chose not to make the sensible choose to expand the size of the baseline period to 40 years to reduce the effect of random variability that lead to this issue, instead choosing to make the politically expedient but statistically non-sensical choice of merely shifting the baseline.

    • Rob says:

      “…sensible choice …”

      • Swenson says:

        R,

        If you think people dont understand you, maybe you should learn how to communicate effectively.

        In any case, why should anybody care what an anonymous commenter opines?

        Do you care what I think? No?

        Why is that?

        • Rob says:

          “Do you care what I think?” is equivalent to “do you care what Stevie Wonder sees?”

          • Swenson says:

            R,

            And? Just changing words to suit yourself is characteristic of alarmist fanatics.

            As in claiming that reducing the rate of cooling is equivalent to heating.

            Your efforts at trolling leave a bit to be desired. You need more practice.

          • Rob says:

            I’ll try to pay more attention to your mastery of the art of trolling – just in case I need it one day.

  36. barry says:

    Dr Sepncer, what is the rationale for changing the baseline, and for doing it every 10 years?

    • Ken says:

      The low point on the graph is -0.7C. The high point on the graph is 0.9C. That might mean the expectation is the anomaly is more likely to go higher than the maximum record of 0.7K than falling below the minimum record 0.68K

      • Rob says:

        Firstly, you can’t determine probabilities from looking only at extreme values.
        Secondly, why does this qualify as a rationale for changing the baseline?

        • Swenson says:

          R,

          What probabilities are you talking about? Not concerning the future, I hope.

          That would just be silly, wouldnt it?

          • Rob says:

            “expectation” … duh

          • Swenson says:

            R,

            What do you mean –

            * expectation … duh *

            Are you intellectually challenged? Or just plain stupid?

          • Rob says:

            Is it really so difficult to read the comment I was relying to?

          • Bindidon says:

            The little ankle-biting dog is back, barking and barking and barking …

            Oh Noes! Will that never end?

          • Ken says:

            The probability/expectation is that the warming trend will continue into the future. The trend since 1979 is 0.14K per decade …

            The rationale for changing the baseline now is to stick with a ten year update rather than having to update as result of another El Nino peak that goes higher than the graph allows.

            I am guessing but the rationale would make sense.

          • Rob says:

            In any graphing tool, scale is adjustable. It is not a reason for changing the baseline.

          • Bindidon says:

            Ken

            You write amazing things.

            A decade ago, UAH’s reference period was 1979-1998.

            Here you see one of the last graphs produced out of UAH data according to that elder period:

            http://www.drroyspencer.com/wp-content/uploads/UAH_LT_1979_thru_Jan_10.jpg

            As you can see, the top coordinate on the y-axis was at that time… 1.2.

            One more time, I see that Skeptics have a very static view on the world around them.

            J.-P. D.

  37. Ken says:

    * -0.68K

  38. ren says:

    It is important to correctly assess the average height of the tropopause in winter. Interestingly, during the SSW, with the increase in temperature in the upper troposphere, the temperature at the surface drops.
    https://www.cpc.ncep.noaa.gov/products/stratosphere/strat-trop/gif_files/time_pres_TEMP_MEAN_JFM_NH_2021.png

  39. Mark Wapples says:

    Rob can you just tell people how much the baseline went up by.

    I am sure even our least mathematically inclined contributors could do a simple addition.

    • Rob says:

      The issue is that the baseline has increased by different amounts for each month of the year. Although a small fraction of this will be due to seasonal effects (the hemispheres are not identical), the majority will be due to randomness.

      Dr Spencer has missed an opportunity to increase the robustness of the data by taking a longer baseline for the purpose of reducing this random variation. Instead he has opted for a statistically purposeless baseline shift, with the sole aim of misleading the likes of Salvatore who are unable or unwilling to understand the concept of a baseline.

      • Swenson says:

        R,

        Have you added mindreading to your list of superpowers?

        You certainly excel at appearing condescending and patronising! If jumping to conclusions was an Olympic pursuit, you could no doubt try for gold.

        However, you might really be a common or garden variety gullible alarmist acolyte. Can you demonstrate otherwise? No?

        No surprise there.

        • Rob says:

          Thanks for covering me in spittle.

          • Swenson says:

            R,

            No. You havent mastered mindreading yet.

            Nor predicting the future by rigorous examination of the past.

            Ho ho ho.

          • Rob says:

            Would someone lend me a towel.

          • Swenson says:

            R,

            Are you incontinent, or do you suffer from uncontrollable dribbling?

            Are you able to wipe yourself clean, or do you need help?

            By the way, how are you going with the GHE description you were going to copy and paste?

  40. Håkan says:

    Dr Spencer

    It looks strange that September 2020 jumped 0,17 C when you changed base period but December 2020 only jumped 0,12 C.

    Is there a calculation error hidden somewhere?

    • barry says:

      That’s a good question.
      I thought

      Shifting the baseline forward by 10 years changes a third of the data for working out each monthly average over the (new) 30 years. The difference between 30 years of averaged Junes and 30 years of averaged Julys is pretty much inevitably going to be different.

      The data undergoes revision throughout each year, and often there are relative changes to anomalies.

    • barry says:

      Might be worth reading about how the baseline is calculated.

      https://tinyurl.com/yyzjrktz

      • Swenson says:

        b,

        Ah, I see.

        * The climatology of a variable, for example 2m air temperature, is the variables condition averaged over a period of time. *

        Are you really trying to redefine an average to be a climatology?

        Are you delusional, or just really, really, stupid?

        • Bindidon says:

          Swenson aka Flynn

          There is (at least right now) only one stupid person writing on this blog, and that’s definitively you.

          J.-P. D.

          • nurse ratchet says:

            Swenson/MF has been with the asylum now for many years. He is housed in the “delusions” ward. That is why he uses the word “delusional” so often.
            Please don’t upset him by mentioning facts.

          • Swenson says:

            Gee. All I did was ask somebody a question.

            As usual, no answer, just the usual intellectually vacant ad homs from the Binny and the psychobabbler.

            Are you still claiming that trends continue forever, Binny? You do realise that 0.5 C per decade is 5 C per century, 50 C per millennium, and a whopping 50,000 C per million years!

            What do you think will stop the trend? A change in the laws of physics?

            Or maybe you think that CO2 will exhaust its magical heating powers (run out of phlogiston, perhaps?), and the trend will come to an end.

            Another possibility might be that the GHE is specious nonsense.

            Maybe Binny and the psychobabbler should get together, and try to figure out how sunlight can heat the Earth to 50,000 C, if Binnys calculations are correct.

            Ho ho ho!

  41. If solar stays low this decade will very likely end the global warming trend. It will be abrupt when it occurs.

    If it does happen I would only be 10 years off.

  42. ren says:

    Sea surface temperature is also 0.12 C, compared to the average 1981-2010.
    https://www.tropicaltidbits.com/analysis/ocean/global.png

  43. As I have said when the cooling comes it will be quick and fast.

  44. ren says:

    This is going to be a massive stratospheric intrusion in the northern US.
    https://i.ibb.co/DVpdnqv/gfs-hgt-trop-NA-f120.png
    https://i.ibb.co/qRKYP4w/gfs-toz-NA-f120.png

  45. Nate says:

    All ’bout that base, ’bout that base, no troubles…

  46. Rob Mitchell says:

    According to Dr. Spencer’s data, the tropics have been getting cooler during the past year. I know ren has been mentioning the Southern Hemisphere for quite some time. Will the Northern Hemisphere follow?

  47. What ever the trend is that is what most jump on . That is the easy thing to do ,but just try to predict a reverse hardly anyone is going to do that because that is entirely another matter.

    I am predicting a reverse.

  48. Rob says:

    Here is a diversion from the climate discussion for those who enjoy mathematical problems.

    A staircase has n stairs.
    You are permitted to climb the staircase 1 or 2 steps at a time.
    For example, you might:
    – climb the entire staircase one step at a time
    – climb the entire staircase two steps at a time (if n is even)
    – climb the staircase using any combination of 1s and 2s, eg. 2 1 1 2 1 2 2 …

    Explain why the number of different ways of climbing the staircase is the (n+1)th Fibonacci number.
    (Assume the first two terms of the Fibonacci sequence are 1, 1)

    (There is no reason for a certain hater of learning and thinking to leave comment here.)

    • Eben says:

      Take your useless chaff to some facebook girls chit chat page

      • Bindidon says:

        Eben

        What Rob presents here is 100 times more interesting than your eternal, boring youtube garbage.

        And you are invited to spare us your primitive and impolite alt-right behavior.

        Why don’t you post your garbage at Breitbart, Eben?

        J.-P. D.

    • Nick Stokes says:

      Induction. If w(n) is the number of ways of getting to n steps, then to get to the n+1, you could either
      1. take 1 step from the nth stair, so w(n) ways after getting to the nth step, or
      2. Take 2 steps from the (n-1)th stair; there were w(n-1) ways of getting there
      So w(n+1)=w(n)+w(n-1)

      • Clint R says:

        Can two ice cube warm the thermometer more than one?

      • Rob says:

        Hi Nick,

        Just the man I need to speak to!

        First though, 100% correct, although you technically need to go through the motions of working out the two base cases.

        Regarding your global temperature anomaly map:
        https://s3-us-west-1.amazonaws.com/www.moyhu.org/pages/latest/NCEP/GLncep.html
        I see it hasn’t been updated since Jan 15. Will that be updated again soon?

        I’m sure you can recognise from the responses which people I was not referring to in my opening sentence, and who I might have been referring to in my final sentence. They are like Stepford wives, having been programmed for only one purpose, and have never been instructed how to react to climate-neutral discussions.

        • Swenson says:

          R,

          More stupidity through obscurity?

          On the other hand, maybe you are dim enough to think that anybody actually cares about your opinions. All the opinion in the world (plus a few dollars) will probably buy you a cup of coffee.

          Here’s an opinion from a distinguished professor at Penn State –

          * Always keep in mind that atmospheric radiation moves at the speed of light and that all objects are always radiating. Moreover, as soon as an object absorbs radiation and increases its temperature, its emitted radiation will increase. Thus energy is not “trapped” in the atmosphere and greenhouse gases do not “trap heat.” We will see instead that greenhouse gases act like another radiation energy source for Earth’s surface. *

          Another from a different professor, different university –

          * Carbon dioxide and other heat-trapping gases have three or more atoms and frequencies that correspond to infrared radiation emitted by Earth. Oxygen and nitrogen, with just two atoms in their molecules, do not absorb infrared radiation. *

          Oh dear. Opinions. Arent they grand. Have you an opinion about whether GHGs trap heat?

          Or are you just another fact free unscientific alarmist troll, trying to appear intelligent, but failing miserably.

          By the way, how is your search for a useful GHE description going? Not well, I assume.

          Oh well, maybe you could try for another distraction, to try to keep the CO2 GHE illusion from collapsing. Good luck!

          • Rob says:

            Thanks for your input Ms Stepford.

          • nurse ratchet says:

            The medications are not working. His blood pressure is through the roof.

          • Swenson says:

            The trolls have nothing better to offer than obscure references and pointless psychobabble.

            Ask for something useful, such as a GHE description, and . . .

            Nothing. So much for alarmist non-science.

          • Bindidon says:

            The little Flynn dog gets more aggressive every day, his endless barking is so terribly boring and annoying.

            Perhaps he is now suffering from chronic diarrhea.

            Can’t anyone save us from this nuisance?

            J.-P. D.

          • Rob says:

            Why doesn’t Dr Spencer ban people like him, as is done on most climate blogs?
            This person’s childish comments are deliberately hindering any rational discussion, and deliberately inciting others to behave like him.

          • Bindidon says:

            Rob

            You then would have to ban a lot of people.

            Mr Spencer only bans those who keep in destructive, aggressive contradiction to himself.

            J.-P. D.

          • Clint R says:

            The benefit of allowing trolls like Rob, “Nurse Ratchet”, Nate, and Bindidon, is that people need to see what types are out there. These trolls reject reality and are anti-science. Other people need to learn what the trolls are about.

          • Nate says:

            “These trolls reject reality and are anti-science.”

            Run it thru the Clintspeak translator:

            “These intelligent posters accept reality and are advocates for science”

        • Nick Stokes says:

          Hi Rob,
          Every year after Jan 1 I have some trouble with my NCEP program. I thought I had a complete fix this year. Apparently not; I’ll check.

          • Rob says:

            Thanks Nick. I always thought you just went away for a holiday in January. Just pointing out that the daily data is coming through on your site, but your map of the globe is not updating.

    • Swenson says:

      R,

      Nice try at diversion. Discussing the climate is tolerably pointless. It is the average of weather, by definition.

      Maybe you could try to unearth the strangely absent description of the GHE – the one which leads to a testable hypothesis.

      As to your diversion, I have to point out that assuming the first two terms of the Fibonacci sequence are 1, 1, is about as silly as assuming that slow cooling is really heating. The Fibonacci sequence starts 0, 1, 1, 2, 3, 5, and so on – for good reason. Ill let you figure out the reason.

      When you copy from elsewhere, try to understand what it is you are copying,

      You can look up the solution on the Internet.

      • studentb says:

        “Discussing the climate is tolerably pointless.”
        Yet you seem to spend a lot of time doing just that.
        Why do you bother ?

      • Rob says:

        You have to wonder at someone who treats mathematics as a set of inflexible definitions to be rote learned, rather than a thinking process that merely requires your choice of definition to be understood by all you communicate with, then uses their rigid definitions as a pawn in a pathetic power play.

        • Swenson says:

          R,

          As I said, you should try to understand something you found on the internet.

          Definitions are there for a purpose. Otherwise every idiot would be redefining things to suit themselves. For example, in the US state of Indiana, in 1897, a Bill was proposed to legally set the value of Pi to one of four rational approximations. Luckily, the bill was defeated.

          Maybe you are annoyed that you have been caught out in an elementary mistake.

          How are you going with your definition of the GHE? Doesnt fit your thinking process?

          Poor diddums. Try political science, or social science. Or climate science. Then you can define anything to be anything you want!

          Cooling is heating. Water vapour heats and cools simultaneously. Michael Mann is a Nobel Laureate. You actually know what you are talking about.

          See how easy it is? Just pretend reality doesnt apply to you.

          Good luck with that.

          • Rob says:

            Please explain how Nick’s proof is affected by the choice of definition.

          • Rob says:

            And BTW, you are wrong. 0 is given the notation F_0, making it the “zeroth” Fibonacci number. You can also define the “negative first” Fibonacci number, etc.
            F_1 = 1 and F_2 = 1, that is … the first and second Fibonacci number.

          • Rob says:

            Live by the definitions, die by the definitions.

          • Swenson says:

            R,

            Still wrong.

            Nick has not provided a proof. Your definition of a proof would make a trained mathematician blanch.

            Keep digging.

            Maybe you need to visit a few other sites which explain the solutions to this problem

            Here’s a clue –

            No. I changed my mind. Why should I help you?

          • Rob says:

            HAHAHAHA – now you’re a denier of mathematics!!!
            It is an OUTLINE of a proof. At least you’ve given up claiming that terms 1 and 2 are 1 and 1.

          • Swenson says:

            R,

            You wrote earlier –

            * Please explain how Nick’s proof is affected by the choice of definition. *

            You now say its not a proof, its an outline of a proof. Or maybe its neither?

            You assert that I have given up claiming something or other – maybe you could quote me instead of just making stuff up?

            What is a denier of mathematics? Mathematics exists. Maybe you coukd name someone who denies this, but I doubt it.

            In the meantime, you might as well keep up your demented cackling. Your comment is largely incomprehensible.

            Carry on. How about explaining why nobody has managed to make a thermometer hotter by increasing the amount of CO2 between the thermometer and a heat source?

            Time for redefinitions, perhaps?

          • Rob says:

            Feck you’re a baby.

          • Swenson says:

            Is that the best you can do?

            Face reality. Its your choice to act like a dimwitted fact free alarmist, my choice to point this out.

            Seems fair to me.

  49. Norman says:

    Entropic man

    I did find an article (from 2010) that addresses my question I asked on a previous thread about the change in latent heat surface loss with increasing temperature for the Water Vapor Feedback.

    https://agupubs.onlinelibrary.wiley.com/doi/full/10.1029/2010JD013949

    If you look at Figure 3 of this article it certainly looks like Water Vapor Feedback is not nearly as strong as current thinking makes it (can almost double warming of CO2 alone).

    It shows that the increased evaporation (latent heat loss) for each degree K is more than the gain from increased radiant forcing until up to 3.5 Watt/m^2 of forcing.

    If modern models assume the water vapor feedback is highly positive that could explain why so many model runs are on the hot side.

    https://wattsupwiththat.com/2021/02/02/climate-model-failure/

    I think it is very necessary for future political action on Climate Change to get this water feedback correct.

    Two articles now are showing that evaporative cooling is quite significant in a warming world and cannot be ignored as it is a strong negative feedback.

    • Entropic man says:

      Over the last 140 years the direct forcing from CO2 has been 5.35ln(411/280)=2.05W/m^2.

      Using the usual estimated warming effect of 3.7W/degree, the 1.2C warming since 1880 would require forcing of 1.2*3.7=4.44W/m^2.

      That is a feedback of 4.44-2.05=2.39W/m^2.

      If the feedback isn’t a more active water cycle it must be something else. Any candidates?

  50. Miles Jacobs says:

    Ok, so the current value is actually 0.24 relative to the old baseline?

    • Rob says:

      January has gone down by 0.14, so it’s 0.26.

    • Bindidon says:

      Miles Jacobs

      Not quite. The difference for the January month in the baselines for 1991-2020 resp. 1981-2010 is +0.14.

      So the current value is actually 0.26 relative to the old baseline.

      J.-P. D.

  51. Bindidon says:

    For all visitors who are irritated by UAH’s abrupt change of the reference period, here are the offsets you have to add to monthly anomalies wrt 1991-2020 when you want to obtain the ‘old’ anomaly wrt 1981-2010:

    Jan: 0.14
    Feb: 0.16
    Mar: 0.13
    Apr: 0.12
    May: 0.12
    Jun: 0.13
    Jul: 0.13
    Aug: 0.12
    Sep: 0.17
    Oct: 0.16
    Nov: 0.13
    Dec: 0.12

    J.-P. D.

    • Rob says:

      Just pointing out that as these numbers are based only on 2020 figures at the moment, there could be some rounding errors. The actual numbers might vary by 0.01 from these.

      • Bindidon says:

        Rob

        No, they are not: I constructed the baseline wrt the mean of 1991-2020 out of an absolute time series, itself generated out of UAH’s 2.5 degree grid data valid till Dec 2020 (anomalies plus climatology).

        The addition of the numbers I gave above indeed may lead to rounding errors; but this is due to the fact that UAH publishes data with 2 digits after the decimal point.

        Even if I would have given the data with 3 datdp

        0.142
        0.160
        0.128
        0.121
        0.123
        0.132
        0.129
        0.125
        0.166
        0.161
        0.134
        0.119

        that wouldn’t have solved the problem (and this list would even still not be quite correct, as the differences were calculated out of absolute data generated with only 2 datdp, he he).

        We are lay(wo)men here, and hoefully all won’t care about such infinitesimal stuff!

        J.-P. D.

        • bdgwx says:

          UAH does provide 3 decimals places for the monthly global mean here. This is what I usually load up into Excel.

          https://www.nsstc.uah.edu/data/msu/v6.0/tlt/tltglhmam_6.0.txt

          • Bindidon says:

            bdgwx

            You misunderstood me here. I was speaking about the generation of UAH time series out of UAH’s 2.5 degree grid data, for which until now I saw no need to have more than 2 datdp.

            Anyway, OK: tltglhmam_6.0.txt has 3 datdp, but… it is a global mean.

            What do you do with it if you want to look at the Arctic?
            And what do I do if I want to look at the data for 5N-5S–170W-120W?

            J.-P. D.

          • bdgwx says:

            Oh yeah…no…I totally get the gridded data is only 2 decimal places. But to calculate the offsets I don’t think you need the gridded data. I get very close to what you posted above with some minor differences. For example, I get 0.161 vs 0.160 for February when using the 3 decimal place file.

          • Bindidon says:

            ” I totally get the gridded data is only 2 decimal places. ”

            But… that is not the problem, bdgwx.

            When you process data consisting of 5 digit integers like in the UAH grid, nobody hinders you to put the average of thousands of them in 64bit floating point numbers!

            No idea what you really mean here. But I will by now add one or two decimal places when generating series out of UAH data, that’s all.

            But again: for those who want to consider zonal or regional UAH data published from now on, but with respect to the old reference period, that will be of no help as long as UAH itself doesn’t increase the precision.

            J.-P. D.

          • bdgwx says:

            Oh…gotcha…I’m following you now.

        • Rob says:

          My point was precisely the effect of publishing rounded figures. Now that the full data set is available, and using only the data showing 2 dp, it turns out that August should have been 0.13. I haven’t done the calculation on the data with 3 dp.

          Also, and being even more pedantic, the new baseline has increased the trend by 0.13%.
          Not a big deal at all, but perhaps Dr Spencer should not have made the claim that the shift in baseline has not affected the trend.

          I still don’t understand why he would have not chosen to extend to a 40-year baseline.

          • Swenson says:

            R,

            Shall I add that to the list of things you dont understand?

            Maybe it would be easier to list the things you do understand. A much shorter list.

            Dont agree?

            Off you go, then. List the things you do understand. Be prepared to defend your choices.

          • Rob says:

            The lack of self-awareness by Son of Swen of how boorish, boring and socially inept he is beggars belief.

          • Swenson says:

            R,

            I see.

            You still dont understand, and cant understand why you dont understand. Is that it?

            Maybe you also cant understand why I cant be bothered to feel offended or annoyed by silly attempts at gratuitous insults by an anonymous person.

            Unless you have some hidden super power, of course! Can you unleash lightning bolts? Then I would be afraid, very afraid.

            Even better, flap a copy of a testable GHE explanation at me!

            Oh, the horror!

          • bobdroege says:

            Been there done that and you admitted I had one.

            Not doing that again.

          • Rob says:

            And his response is to continue the childish boorishness.

          • Swenson says:

            bob,

            Dont be silly. If you had one, you would flash it about like mad.

            Trying to convince others that you have produced the mythical GHE document, but are now keeping it secret, is unlikely to succeed.

          • Swenson says:

            R,

            If you need some help with how to be gratuitously insulting, let me know.

            First precept – it is a waste of time trying to insult someone who declines to feel insulted or offended. Someone like me, for example.

            All you achieve is making yourself look like an impotent idiot.

          • Rob says:

            So … someone who has no soul.

          • bobdroege says:

            Swennson,

            Now you are just a backpedaling liar.

            Why can’t you admit you can’t argue your way out of a paper bag?

            A wet paper bag.

    • E. Swanson says:

      The data for January is up now and I compared the two sets for the North Polar region. On average, the mean change for the data was increased by 0.28 deg C. The monthly differences were all over the map. I found that one would need to add the following to the new version to match the old averaging period:

      Jan: 0.347
      Feb: 0.291
      Mar: 0.237
      Apr: 0.400
      May: 0.322
      Jun: 0.266
      Jul: 0.130
      Aug: 0.173
      Sep: 0.236
      Oct: 0.285
      Nov: 0.289
      Dec: 0.153

      These data show that January and April are somewhat cooler in the new data set while July, August and December are warmer than average. It would be of interest to know why these differences in seasonal values appeared. As Roy noted, the trends in the two sets are the same.
      —————-

  52. meaning jan deviation would be +.26 not +.12 if using 1981-2010 data. Correct?

  53. I am going to continue with that 1981-2010 baseline. It is ridiculous to go to 1991-2020.

    • Bindidon says:

      Salvatore

      To say ‘It is ridiculous…’ imho is exaggerated, and also a little unfair.

      Simply because we all should have been thankful to UAH to have introduced so early WHO’s recommendation for 1981-2010 (their previous recommendation was 1971-2000).

      Look at Hadley Centre/CRU, they still stay on 1961-1990, or GISS on 1951-1980, and RSS still did not leave its antiquated 1979-1998 (used by UAH until 2010 or so).

      The transition up to 1991-2020 at WHO is inevitable, as they always try to move forward, thus giving new developments the possibility to produce data comparable with elder providers by using departures from a common mean.

      J.-P. D.

      • Clint R says:

        JD, I salute you for an intelligent comment. You don’t do that often. You should stick with the areas you have some experience in, rather than trying to pervert areas such as “orbital motion”.

        Of course, if you want to be an idiot, you have that right.

  54. Entropic man says:

    “In addition, the results demonstrate the dominant role of both the air‐sea temperature difference and relative humidity over, for example, wind speed in reducing the evaporation change in climate models below the Clausius‐Clapeyron rate.”

    This was the last sentence in the abstract of your Lorenz et al link.

    It would seem that surface evaporation is considered in the models.

    • Bindidon says:

      ren

      People like you seem to see the world only through their ‘cooling’ pink glasses, and to ignore the rest.

      While Northern Germany will have a few days below 10 C, the southern part of the country has been suffering from devastating floods for weeks.

      That is thousand times worse than some few colder days, ren.

      But that doesn’t seem to disturb you.

      J.-P. D.

      • ren says:

        Unfortunately, I prefer warmth.

      • ren says:

        The Rhine is a dangerous river.

        • Bindidon says:

          Wrong, ren.

          Not the Rhine is the problem – not at all.
          The problem is 100% located near its many tributaries.

          It’s always bad to look at things you don’t know through the wrong side of the binoculars.

          J.-P. D.

          • Bindidon says:

            To tak jakby wytłumaczyć Wam, jak wygląda Pojezierze Mazurskie.

          • ren says:

            The area around the river Rhine in Cologne was flooded on Wednesday following snowmelt and heavy rainfall, causing disruption to shipping on the waterway.

            Water could be seen pouring over the river banks, leaving surrounding paths and public benches almost completely submerged. On Tuesday the Cologne authorities reported a water level of 8.23 metres (27 feet), with that level expected to rise in the coming week.

            Ships are blocked from sailing on the important trade route when the water level reaches over 8.3 metres (27.23 feet) around Cologne, as they are unable to fit under the bridges on the river, but most drivers have already stopped on safety grounds according to local media.

            The Rhine has suffered numerous floods in recent decades. In 2018, its water level reportedly topped 9 metres (29.5 feet), leading to flooding of the historical city of Koblenz.
            https://youtu.be/PljUwmK32Qw

          • ren says:

            Bindidon,
            You’re right, the Rhine poured because of rain in the mountains.

          • ren says:

            Bindidon,
            Heavy rain in the lower reaches of the Rhine shall not cease.

  55. bdgwx says:

    Above E. Swanson talked about UAH’s TLT weighting function.

    LT = 1.538 * MT 0.548 * TP + 0.01 * LS

    I was doing some analysis and was surprised by just how sensitive the warming trend is to even some changes to the weightings.

    For example…

    LT = 1.55 * MT 0.54 * TP – 0.01 * LS

    …yields +0.1447C/decade.

    But, out of curiosity I wanted to see which weights got UAH-LT to most closely correlate with the surface datasets. After a bit of experimentation I feel that UAH’s choices of 1.538, -0.548, and 0.01 actually provide the best month-to-month correlation. It is important to note, however, that UAH is already a terrible predictor of the month-to-month surface values and obviously the overall warming trend of the various surface datasets including GISS, NOAA, BEST, Had.CRUT, ERA, TempLS (Nick Stokes), etc. My point is only that I find no obvious fault with UAH’s selection of the weighting values.

    My biggest concern is just how sensitive LT warming trend is to the choice of values.

    And yes, I’m aware that LT is not really meant to be a proxy for the surface temperature. But the reality is that everyone treats as such.

    • bdgwx says:

      I should point out that I’m applying the weighting function to the monthly global mean. In that regard I’m implicitly using the same function for all grid cells. It would be cool if someone could do the experiment with the gridded data and use different weighting functions for different regions to see what happens.

      Bindidon…I know you like to work with the gridded data. Do you want to take a stab at deriving your own LT values from the MT, TP, and LS grids?

      • Bindidon says:

        ” Do you want to take a stab at deriving your own LT values from the MT, TP, and LS grids? ”

        Sorry, no. I have so many things to do, e.g. improving my sea level corner, adding ‘GHCN V4’ to replace ‘GHCN daily’ over the long term, etc etc etc.

        J.-P. D.

  56. Maz says:

    Entropic,

    I’ve always been confused by that 5.35 constant.
    I first noticed it in IPCC TAR ( in a table on page 10 of chapter 6). I believe it came from multiple model runs reported in a paper published in 1998 ?
    In the same table there’s another constant ….3.35…. submitted from WMO ( Hansen et al 1998).
    I’ve always wondered why the higher value was chosen.
    It seems to me that calculations of radiative forcing became a circular argument where the models start and end the process ?

    • Bindidon says:

      Maz

      A quick look at the document in question shows this:

      https://drive.google.com/file/d/1mJuzan0JdJvmg_jW8Y6mgLcAltRd0wAT/view

      Did you REALLY overlook that there are indeed three rows with three different alpha constants in the table, but that these different constants must be put in relation to the three different formulas in which they are used?

      Amazing.

      J.-P. D.

    • Entropic man says:

      You’ll find it discussed here

      globalwarmingequation.info eqn derivation.pdf

      and here.

      http://clivebest.com/blog/?p=4697

      • Bindidon says:

        Entropic man

        Thanks, I had forgotten Clive Best’s article. Now bookmarked!

        J.-P. D.

      • Clint R says:

        Ent and JD, it has been pointed out to you that the bogus equation is based on assumption and circular reasoning. You can believe it is “science”, but it is “belief”.

      • Swenson says:

        Clive Best appears to be delusional.

        He is apparently unaware that heat accumulation or trapping in nonsensical.

        He also seems to be unaware that all heat created on the Earths surface by any means escapes to space – never to be seen again. Regardless of wavelength. Any energy intercepted by the atmosphere is promptly re-radiated at the same or longer wavelengths. And, of course, bodies already emitting shorter wavelengths cannot absorb longer ones.

        A simple example is the fact that liquid water cannot be warmed by the longer wavelengths emitted by ice, regardless of their intensity.

        That is reality. No GHE. The only AGW is the ephemeral heat produced by man, in various forms. Let a fire go out, and the temperature in the vicinity drops. Simple.

        • nurse ratchet says:

          Back to the delusional ward with you!
          And take that tin foil hat with you.

          BTW, did you know that “it has long been suspected that the government has been using satellites to read and control the minds of certain citizens. The use of aluminium helmets has been a common guerrilla tactic against the government’s invasive tactics.

          Surprisingly, these helmets can in fact help the government spy on citizens by amplifying certain key frequency ranges reserved for government use.”

        • Swenson says:

          Go away, troll!

    • bdgwx says:

      I believe the first appearance in literature was the Myhre 1998 publication.

      https://agupubs.onlinelibrary.wiley.com/doi/pdf/10.1029/98GL01908

      • Swenson says:

        b,

        Surely you jest!

        Estimates (guesses) based on models (using guesses as parameters).

        Here. What is the radiative forcing of a column of CO2 1 metre deep, with a 1 m2 surface normal to a heat source, when interposed between a heat source of 5000 K with a radiative intensity of 1000 W/m2, and a thermometer?

        Feel free to ask for clarification of the obviously missing parameters.

        Maybe you could look it up on the internet? Maybe it is specified in absolute terms in all those thousands of peer reviewed papers so beloved of alarmists. Proceed as you see fit.

  57. ren says:

    Bindidon, how much snow do you think will fall on sunday in Berlin?

    • barry says:

      The title of that blog continues to completely mislead readers. “Notrickszone” continues its tradition of twisting and omitting facts to present an agenda-driven view.

      The very first paper it cites, it gets completely wrong. Notricks says that NH temperatures dropped by 0.6 C from 1958 to 1963. This is based on a 1973 paper. What is misleading? The fact that notricks makes it as if these are surface temps, and that this cooling is no longer apparent in the surface records.

      The temperatures are of the atmosphere at 18km above sea level. They are stratospheric temps, which, by the way, are expected to cool under greenhouse warming.

      So this wasn’t airbrushed out of the surface records at all, because thesae values are not surface temps. They’re not even lower troposhperic temps.

      The misleading continues throughout the article. Notricks cites a paper that he says is about the US cooling at roughly the same time. But check the paper and it says that what is being examined is parts of the US that cooled in opposition to the rest of the country and the world. Local effects.

      I went through a couple other papers and it’s the same, sordid story. Complete misrepresentation.

      This is absolutely typical of the rubbish ‘science’ promulgated by this blogger. Go check it out if you want to make up yor own mind, and be sure to check the papers cited. If you have trouble getting the full versions, you can get all the ones listed on ‘notricks’ website here:

      https://sci-hub.do/

      Do not trust this blogger. They are full of shit.

      • bdgwx says:

        I’ve seen that site literally photoshop graph/charts and alter them from how they originally appear in the publications. I’ve seen them attach graph/charts to their blog entries with the implication that they appear in the referenced publications, but I can’t find them anywhere in the original manuscripts. They frequently cite publications from predatory journals, misrepresent publications, and disseminate misinformation.

        • Clint R says:

          bdgwx, maybe you should clean up your own messes before you start attacking others.

          “Finally you used the SB law (which you think is bogus) to determine that 303K must be the right temperature now even though earlier you thought it should be 231.7K.”

          1) Where did I ever claim the S/B Law was bogus?
          2) Where did I ever claim 231.7K for Earth’s temperature?

          Clean up your own messes, you phony.

          • Stephen` Paul Anderson says:

            BGDWX is going to have to find another pseudonym. We’re on to him. These leftists don’t realize that no matter what pseudonym they use, their illogical, unscientific thought patterns give them away.

          • bdgwx says:

            SPA, I think you have me confused with someone else. I’m not a leftist. And remember…I’m not the one that referred to a paper about the declining stratosphere temperature and misrepresented it as the surface temperature. That was Kenneth Richard and Pierre Gosselin on the NTZ site.

      • Swenson says:

        b,

        So which bloggers would you trust unreservedly?

        None?

        I agree.

      • Bindidon says:

        barry

        I completely agree with you about Gosselin’s TricksZone, as well as about Goddard aka Heller’s stuff, and, though being a lot more risible and inoffensive, about ‘iceage.info’.

        Recently I read a guest post at WUWT, where one of these intentionally misleading and misrepresenting TricksZone stories were reblogged:

        https://wattsupwiththat.com/2021/01/24/study-shows-arctic-sea-ice-reached-lowest-point-on-modern-record-in-the-1940s-not-today/

        This was really incredible: nowhere in the original source was this claim visible.

        Gosselin and his acolyte simply analyzed some pictures and made a tricky story about them.

        This is so brazen because WUWT’s mod Charles Rotter published the entire article!

        And what makes it even more peppery: the original article’s really alarmist conclusions were simply ignored by Gosselin, and of course by the WUWT commenters, whose vast majority doesn’t even read the guest posts, let alone the articles these refer to.

        Some people there detected the flaw, but were discredited and denigrated by a very aggressive commenter nicknamed ‘fred250’.

        *
        Six years ago, I analyzed some Heller claims concerning allegedly wrong adjustments made to GHCN V3’s unadjusted station data.

        Some were correct, but a vast majority of them were not, and above all: Heller only complained about the 60% positive adjustments within the 7280 stations, but was all the time pretty silent concerning the remaining 40%.

        J.-P. D.

    • barry says:

      Notrickszone gets nicely taken apart in this video.

      https://www.youtube.com/watch?v=LyMaRx7gIGY

      Claims that 400 papers debunk AGW, but turns out that many of them actually endorse AGW.

      That’s how ‘notricks’ rolls. Complete garbage site.

      Tony Heller’s site, realclimatescience, is just as bad.

  58. barry says:

    It actually does make a difference to trends when changing the baseline on a month by month basis. The relative position of anomalies change a bit when making averages for each month individually – the difference between the averages will change, therefore the difference between monthly anomalies will change. It won’t change trends much, barely enough to notice, but when the difference between August and September 2020 was 0.14 under the old baseline, and 0.10 under the new baseline, there will be some slight differences in trends.

    • Bindidon says:

      barry

      No, this is not the case: the trends for anomalies wrt 1991-2020 differs from those wrt 1981-2010 by… -0.00004 K / decade.

      This is far below anything significant.

      But an amazing detail with UAH’s absolute data, when reconstructed out of anomalies and climatology, it that it has a slightly higher trend than the anomalies.

      Usually, we observe the contrary, due to the fact that departure for winter months have a higher trend than those for summer months.

      J.-P. D.

    • barry says:

      Well, I did say “It won’t change trends much, barely enough to notice.”

      It’s insignificant, but even a tiny shift like that causes me to qualify what we usually say, that the trends will be exactly the same regardless of the baseline.

  59. ren says:

    In February, temperatures in the Northern Hemisphere will drop, both on the surface and in the troposphere.
    https://i.ibb.co/TBGrD5w/Screenshot-1.png
    https://www.cpc.ncep.noaa.gov/products/stratosphere/strat-trop/gif_files/time_pres_HGT_ANOM_JFM_NH_2021.png

  60. ren says:

    Analysis of the monthly mean 20C isotherm depth for February 2021 on the Pacific.
    http://www.bom.gov.au/cgi-bin/oceanography/wrap_ocean_analysis.pl?id=IDYOC005&year=2021&month=02

  61. Harves says:

    Just checked to see how long ago all the Arctic ice vanished. Was I surprised or what? Seems there is more ice up there than on the same day 16 years ago!!!
    I suspect Arctic ice extent is no longer held up as proof of settled science? Pesky darn ice.. melt!!!

    • bdgwx says:

      Long term Arctic sea ice is decline is occurring much faster than scientists predicted. It is true that on this date 2005 was lower than 2021. However, there will be a lot of daily variation so this isn’t unexpected. But over the long term the decline is decisive. The annual mean in 2020 was lower than that in 2005. In fact, 2020 actually set a new record low. Sea ice has been declining so fast that scientists’ predictions have struggled to keep up.

      • Clint R says:

        When all that sea ice is gone, we can drill for oil up there.

        Win-win.

        • bdgwx says:

          I don’t know. Winter ice would likely cause significant issues with oil rigs. Winter ice will be a mainstay of the Arctic region for hundreds of years even with RCPs that exceed RCP8.5.

          • Clint R says:

            Yeah, we can’t even get rid of the summer sea ice.

            It was just wishful thinking. The planet’s too cold.

          • Stephen Paul Anderson says:

            That’s a problem the left has never understood. We don’t have a global warming problem. We have a global cooling problem.

      • Swenson says:

        b,

        Which scientists made the prediction?

        If you say their prediction was wrong, why should anybody believe their next one?

        Probably self proclaimed climate scientists. Its always worse than they thought, didnt happen at all, or wont happen until after they retire!

        Sack the lot of them. Spend the taxpayers money on something that may turn out to be useful.

    • Bindidon says:

      Harves

      On the same day? Are you serious?

      Here are the averages, in Mkm^2, of all years since 1979:

      2016: 10.16
      2020: 10.18
      2019: 10.21
      2018: 10.35
      2017: 10.4
      2012: 10.42
      2007: 10.5
      2011: 10.51
      2015: 10.59
      2010: 10.73
      2006: 10.79
      2014: 10.81
      2013: 10.92
      2005: 10.93
      2009: 10.96
      2008: 10.99
      2004: 11.25
      2002: 11.39
      2003: 11.42
      1995: 11.44
      2000: 11.52
      2001: 11.62
      1997: 11.69
      1999: 11.71
      1990: 11.72
      1991: 11.77
      1998: 11.78
      1996: 11.85
      1984: 11.92
      1993: 11.95
      1989: 11.99
      1985: 12.02
      1994: 12.03
      1988: 12.06
      1992: 12.12
      1981: 12.15
      1987: 12.18
      1986: 12.22
      1979: 12.35
      1980: 12.35
      1983: 12.35
      1982: 12.47

      And here is a graph showing all months in anomaly form wrt the mean of 1981-2010:

      https://drive.google.com/file/d/1BwaIAZDAG96tMZ8NupH-jCQx7pTUZnF1/view

      But… maybe you think, only daily data will show it right, so we look at the daily anomalies wrt the mean of 1981-2010:

      https://drive.google.com/file/d/19I6WWxw-xavC0H7K7tS_Ocef8BE2gzcs/view

      J.-P. D.

    • barry says:

      Harves is quite right.

      The sea ice extent for the first four days of February 2021:

      14.183
      14.232
      14.332
      14.286

      And 16 years ago, the first four days of February 2005:

      14.031
      14.071
      14.145
      14.128

      to repeat a refrain here, just because a day or two in Winter can be warmer than a day or two in Summer, Summer is still warmer than Winter.

      Harves doesn’t know the difference between weather and climate.

  62. bdgwx says:

    The trendline sits at about +0.21. Jan 2021 was 0.09 below the trendline. This is somewhat unusual in that we would normally expect a much larger excursion below the trendline for the first January in which a La Nina formed following a transition from an El Nino.

  63. Stephen Paul Anderson says:

    The Democrats are now demanding a “purity” test be given to the military. Does it remind you of anyone or a group in particular? Maybe a political movement in Germany after WWI?

    • Bindidon says:

      Stephen Paul Anderson

      An answer from Germany you seem to ignore everything about

      Only far right-wing, alt-right people like you can be so brazen and/or ignorant to establish such a disgusting, woeful link between US Democrats and the German Fascists around Hitler, Goebbels, Himmler, the SA, the NSDAP, the SS and millions of Germans.

      Who were responsible for WWII, at least 50 million deaths, plus killing of
      – 6 million Jewish people
      – 1 million people who wanted nothing to do with fascism (Catholics, Protestants, Conservatives, Liberals, Social Democrats, Socialists, Communists)
      – 500,000 Roma and Sinti (also named Gypsies)
      – hundred thousands of mentally or physically disabled people
      and
      – not to forget the terrible torture of so many people by the Gestapo thugs.

      Are you a Fascist, Stephen Paul Anderson?

      And don’t even try to reply with the typical ‘Communists under Stalin, Mao, Pol Pot etc were even worse’.

      J.-P. D.

      • Stephen Paul Anderson says:

        Bindi,

        What is the opposite of up? What is the opposite of light? What is the opposite of the left? So, how can the opposite of big government totalitarianism be big government totalitarianism? The Nazis and the Fascists were left. Historically, only the left has murdered its own citizens.

        • Bindidon says:

          Stephen Paul Anderson

          ” The Nazis and the Fascists were left. ”

          I can’t recall having read such a digusting lie during the last decades.

          Such a sentence, Anderson, exposes you as a real Fascist, like are all the Fascists in South America who supported the Nazis who escaped there after 1945 and, conversely, received great help from them in establishing their dictatorships in Argentina, Chile, Paraguay. Brazil etc.

          Pfui Deibel, Anderson!

          J.-P. D.

          • Stephen` Paul Anderson says:

            Bindi,
            Read “Road to Serfdom” by Freidrich Hayek. That Austrian disagrees with you.

          • Stephen` Paul Anderson says:

            By the way, all those South American dictators to whom you alluded were leftists.

          • Bindidon says:

            Yeah

            Pinochet, Videla, Stroessner: all leftists.

            Some people are ready to any manipulation.

            I repeat, Anderson: you are a fascist, and above all, a stubborn one.

            J.-P. D.

          • Stephen` Paul Anderson says:

            J.P.D.-Just Plain Dumb.

      • Swenson says:

        Binny,

        I think you mean the National Socialist German Workers’ Party.

        Rehashing old history is not generally productive.

        As to Fascism, try to define the term. You have demonised groups and people in your comments, and have wished people with whom you disagree suffer lingering, painful deaths.

        Are you a closet Fascist? Maybe Fascism means different things to different people. Just like communism, Buddhism, or democracy.

        The past is history. The futures a mystery. Today is a gift – that is why it is called the present.

        Carry on promulgating Wokeism.

        • Stephen Paul Anderson says:

          Swen,
          Fascist is an easy term to define if you read its history. Fasci is the Italian term for “bundle of sticks.” Mussolini started the Fascist Party in Italy when he became disenchanted with Marxism. He believed Marx got it wrong that the middle class worldwide would rise against the upper class. In his writings, he said that what Marx got wrong is that socialists identified with their country and not with globalism. So, Italian socialists were Italians first. German socialists were Germans first. They would not follow the Marxists in Russia. So, a Fascist is just a National socialist. Leftist elites have been trying to redefine the term since WWII.

    • Nate says:

      Godwin’s law at work here again.

      Connect Dems, liberals, progressives with the most murderous people of the last century, Hitler, Stalin, Mao.

      Or even better, turn them into a cabal (pronounced ‘cable’ by MT Greene) of demonic pedophiles, controlled by the international cable of Jewish puppeteers, like George Soros, with their Jewish Lasers in space that started the California wildfires.

      Make America Hate Again. Hate DEMs. Hate progressives. Hate non-white non-Christians. Hate brown immigrants.

      By any means necessary.

      This seems to be what works for right-wing media ratings and click-bait on social media.

      • Stephen` Paul Anderson says:

        Talk about denial. The left has denied who they are for decades and who can blame them. Leftists, the party of slavery, the Nazis and Fascists, the KKK, Japanese-American internment, the Marxists, Globalists, Socialists, Democrats, Khmer Rouge, Antifa, BLM. Leftists, all.

      • Bindidon says:

        Nate

        Some people really need to see a psychiatrist.

        The Nazis killed and tortured hundreds of thousands of Socialists and Communists between 1933 and 1945, but perverted American ignoramuses presume to describe them as leftists.

        No need for any further discussion.

        I think guys like Anderson should be sent for the rest of their life to a country directed by fascists, so they would understand the fundamental difference between

        – cowardly writing their trash at home in a tolerant democracy
        and
        – living in a Nazi-like hell.

        J.-P. D.

        • Stephen Paul Anderson says:

          Bindi, Bindi, Bindi. That’s an old argument. If the Nazis were leftists, then why did they kill other leftists, Communists? You need to read a little bit of your own German history, Bindi. The Communists and Marxists in Germany weren’t loyal to Germany. They were Leninists and Stalinists. The Nazis were Nationalists. The Fascists in Italy, started by Mussolini, a former Marxist, were Nationalists. Nazi, The NATIONAL Socialist German Workers Party. There, now do you understand? It is the same idea as Sunnis killing Shia or Catholics killing Protestants. Or one Monarchist killing another Monarchist.

          • Stephen` Paul Anderson says:

            Bindi,
            If you don’t believe me, read Hayek. He was there.

          • Stephen` Paul Anderson says:

            In 1945, no one misunderstood who the Nazis were. But, when the horrors of the Holocaust appeared, leftist academics and writers began re-writing history, describing the Nazis as “right-wing.” The argument, “why would Nazis kill Marxists if they were leftist brethren?” Stupid reasoning meant for the gullible acolytes.

          • Nate says:

            It gets tiresonme to have to repeat the same facts that contradict Stephen over and over.

            “They were Leninists and Stalinists.”

            No they werent. They beat up and killed Lenninists and Stalinists.

            “The Nazis were Nationalists. The Fascists in Italy, started by Mussolini, a former Marxist, were Nationalists.”

            Ok, so by Stephen’s rules:

            Ronald Reagan, a former liberal Democrat supporter of FDR…a Lefitist!

            Once a Leftist, Ronald Reagan was always a Leftist!

            Riiiigght???

            “Nazi, The NATIONAL Socialist German Workers”

            OMG. Its all about the name, by Stephen’s rules. Once they got that name from the previous incarnation of the party, thats it. They were stuck being socialists!

          • Stephen` Paul Anderson says:

            Ronald Reagan changed parties. He was a Democrat but then saw the error of his ways. NATE! Read Freidrich Hayek if you don’t believe me. Look at the 25 point Nazi Party platform. The Nazis were socialists.

          • Stephen Paul Anderson says:

            Ronald Reagan did not become another kind of leftist. He didn’t leave the Democrat Party and join the Communist Party or the Green Party. He changed his political philosophy, Mussolini didn’t. Mussolini believed in most of the tenets of Marxism, but not their global view. Italians didn’t owe their allegiance to Russia but Italy.

          • Nate says:

            “Ronald Reagan did not become another kind of leftist.”

            And the point goes whoosh way over your head!

          • Stephen` Paul Anderson says:

            I’ve pointed out authors of the past who were there, who described who the Nazis were, Freidrich Hayek and Albert Speer. Why don’t you try educating yourself instead of remaining clueless sycophant?

          • Nate says:

            I know about Speer from reading and watching a lot of WWII history. I know after the war he was all about CYA.

            I looked up Hayek. I would agree with a lot he said about economics and government. He was critical of central planning, like the Communist 5 y plans, and advocated a market driven economy.

            But he seemed to understand that govt could provide a safety net, like welfare and SS, and rules and regulations, as long as they applied equally. Even environmental rules.

            He argued that socialism inevitably would lead to totalitarianism.

            But history has proven him wrong about that. There are many European countries, that post WWII have had socialist policies, like Sweden, that did not end up as totalitarian states.

      • Nate says:

        “Talk about denial. ”

        Let me get this straight Stephen.

        You think today’s Democratic party, and progressives are advocates of slavery, the Holocaust, white supremacy, anti-semitism, anti-democracy, militant nationalism, political prisons, and military dictatorship?

        And you still need to explain YOUR advocacy for right-wing authoritarianism.

        • Nate says:

          And you are a Tennesseean right?

          Thus by your logic, you must be an advocate of slavery, since Tennesseeans advocated for slavery and secession in 1861.

          C’mon.

          • Stephen` Paul Anderson says:

            You can’t even follow. You make arguments, and you don’t even have a clue. You’re not even worth responding to; you’re so clueless. The communists in Germany in the 1920s and 1930s were Leninists and Stalinists. Any competent history book on the era, like Hayek’s, will explain that to you. So, now do you want to stop sticking your foot in your mouth?

          • Stephen` Paul Anderson says:

            The Civil War wasn’t a war between the North and the South. Democrats controlled Tennessee at the time. The Civil War was a war between Republicans and Democrats. In 1860 there were four million slaves. Democrats owned all slaves. Not ONE Republican owned a slave.

          • Stephen Paul Anderson says:

            So Nate, when did the Nazis make this big switch to the right? The right is limited government, small government, Bill of Rights, small taxes, de-centralized, private ownership. When did the Nazis do this? Tell me!

          • Nate says:

            “Democrats owned all slaves.”

            Why does that matter?

            Tennesseans owned slaves. Southerners owned slaves. Northerners didnt own slaves, even Democrats.

            Democrat, Tennessean, Southerner. These are labels.

            I don’t think Tennesseans, Southerners, or Democrats have the same beliefs today as in 1861.

            How bout you?

        • Stephen` Paul Anderson says:

          The Democrat Party is the party of slavery, the KKK, white supremacy, and Nazis. Do I think Democrats will advocate this? No. But it is in your nature to ultimately be who you are. The Democrats claim not to be the party of slavery but continue to enslave blacks for their votes. They claim not to be Nazis or KKK but are Antifa and BLM’s party, avowed Marxists. Political prisons? How many Democrats have recently hinted that conservatives need to be “re-educated?” Who is the party of cancel culture and censorship? Leftists can disavow all they want but can’t escape their true nature. Have you ever heard the tale of the frog and the scorpion?

          • Nate says:

            “Do I think Democrats will advocate this? No.:

            OK, good.

            “But it is in your nature to ultimately be who you are.”

            Ok, then racism must be in your nature, since you are a Southerner?

          • Nate says:

            “Who is the party of cancel culture and censorship?”

            The R party is the center of cancel culture and censorship right now.

            Anyone who didnt support Trump, or his bid to overturn the election, is being censured by their state parties.

            The party is saying bend the knee to Trump or get the hell out of the party!

          • Nate says:

            Democrats are not/= Nazis.

            But is is a common practice to suggest anyone you hate must be a Nazi.

            https://en.wikipedia.org/wiki/Godwin%27s_law

          • Stephen Paul Anderson says:

            Nate, do you know who Albert Speer was? He wrote a book when he got out of prison. Maybe you should read it. Maybe even you can learn something.

          • Stephen Paul Anderson says:

            Racism isn’t defined by where you’re from. It is defined by how you think. Racists and the KKK were exclusive to the Democrat Party. I had ancestors who fought for the Union and the Confederacy. The ones who fought for the Confederacy were racist Democrats. The ones who fought for the Union were anti-slavery. They were all from the South.

          • Nate says:

            “Racism isn’t defined by where you’re from.”

            “The Civil War wasn’t a war between the North and the South. Democrats controlled Tennessee at the time. The Civil War was a war between Republicans and Democrats.”

            OK Stephen,

            Never mind that in 1860 Southern Dems split from Northern Dems over slavery, and ran their own Presidential candidate.

            We all know that Robt E. Lee joined the Confederacy because of his loyalty to Virginia, his state, which was more important than his loyalty to his country.

            Would you have us believe it was instead because of his loyalty to the Democratic party?

            And the secessionists in South Carolina and other southern states? Were they imploring their compatriots to join the cause out of loyalty to the Democratic party?

            This is, of course, absurd historical revisionism.

            It seems you want desperately to connect all the bad events in history to the group that you hate TODAY.

            Maybe you should ponder why it is you need to do that? And why it is that right-wing media wants you to do that?

            This is similar to the QANON phenomenon. People are willing to believe the most absurd things about a group, to somehow justify their hatred for them.

            Only now are some people realizing that they have been deceived.

            You?

          • Stephen` Paul Anderson says:

            Anonymous Nate,

            Robert E. Lee, owner of hundreds of slaves. Lee was smart enough to know he couldnt say Im joining Virginia because I support slavery Like most Confederates, it was about states rights. Balderdash.

          • Stephen` Paul Anderson says:

            Lincoln said Republicans believe that man owns the fruits of his labors. He said the left believes….You work, I eat! No different than the left today.

          • Stephen` Paul Anderson says:

            Out of loyalty to the Democratic Party? Of course and ALL its ideals. You work, I eat! Did the KKK murder Democrats out of loyalty to a particular state or an ideal? Did Democrat states create Jim Crow laws out of loyalty to a state? Did the Democrats continue to elect Democrat Legislatures and Democrat Governors out of loyalty to a state?

          • Stephen Paul Anderson says:

            Nate says: OK Stephen,

            Never mind that in 1860 Southern Dems split from Northern Dems over slavery, and ran their own Presidential candidate.

            I just explained to you who Lincoln described as the Four Horsemen of Slavery. They were all NORTHERN Democrats. Duh!

          • Stephen Paul Anderson says:

            What was the reason for the split? This is a teachable moment.

          • Stephen Paul Anderson says:

            Anonymous Nate,

            I’ve given you two authors, Hayek and Speer, who completely contradict your view. I have another. Ludwig Von Mises. Omnipotent Government: The Rise of Total State and Total War.

            Read it!

          • Nate says:

            “Out of loyalty to the Democratic Party? Of course and ALL its ideals.”

            Stephen, you are a lost cause. And part of the Lost Cause, which as you point out (states rights!) was historical revisionism by Southerners.

            And you are doing the very same thing here. Revisionism to blame all past bad events on Democratic ideals.

            Please show us a link to History of the Civil War that agrees with your POV, that the Civil War was all about Democratic party ideals.

            You have major causality issues.

            Slavery was brought here in the 1600s. It was incorporated in the US Constitution in the 1780s.

            The Democratic Party was created ~ 1830.

            NO, you cannot blame Slavery on Democratic party ideals.

            The Southern Democratic party ideals of 1860, were different from those of Northern Democrats, and COMPLETELY different from those of TODAY’s Democratic party.

            So NO, you cannot blame slavery on TODAYS Democratic party ideals either.

            And quit trying to link Todays Dems with Nazis. That is utterly absurd.

            Its all just to excuse, justify, your hatred for Democrats TODAY.

            But it is just weird twisted fantasy, Stephen.

            Get a grip!

          • Nate says:

            “Democratic part ideals”

            Here is the first Dem party platform I could find, from 1840.

            https://www.presidency.ucsb.edu/documents/1840-democratic-party-platform

            Is it what you thought it would be?

            Seems to be all about limited Federal government and States rights.

          • Stephen` Paul Anderson says:

            You are such a dimwit. And, all your leftist brethren are such dimwits. You don’t know your history. I wonder if the Cherokee Nation agrees with you.

            https://www.ushistory.org/us/24f.asp

          • Stephen` Paul Anderson says:

            Was Andrew Jackson acting LIMITED when he ordered the removal of all those Cherokee? How many died?

          • Stephen Paul Anderson says:

            Slavery was part of the British Empire. That isn’t the point. Who fought to keep slavery? Hmmmm?

          • Stephen Paul Anderson says:

            Nate says: The Southern Democratic party ideals of 1860, were different from those of Northern Democrats….

            Explain?

          • Nate says:

            BTW, Andrew Jackson is Trumps favorite President.

            As President, Jackson was for limited federal govt power, and states rights. And that you can see in the Party platform I posted.

            So, why don’t you think these are Democratic party ideals?

            But you do think oppressing the Native Americans are Democratic party ideals?

            Oppressing Native Americans was going on since the 1500s, well before the start of the Democratic party.

            It continued to be the policy of the Republican party, where treaties were broken and ethnic cleansing took place into the 20th century.

            You cherry pick the negative things from the 190 y history of the Democratic party.

            And you want us to believe that:

            1. The bad things done by people in history are due to their political party.

            2. The bad policies/ideals of a party more than a century ago are somehow retained in TODAYs people and party, but not the good policies/ideals.

            This makes no sense, Stephen. People evolved. Policies evolved.

            History is multi-dimensional. Many causes and influences on events.

            You cannot boil it down to one variable (R vs D).

            Particularly for the purpose of maligning a group of people today.

            Many new variables are involved that didnt exist a century ago.

            We shouldn’t blame slavery or the Civil War on today’s Southerners, for the same reason.

          • Nate says:

            Stephen,

            This discussion reminds me of someone that is likely one of your conservative heroes. Antonin Scalia.

            He and liberal hero, Ruth Bader Ginzburg, were very good friends.

            He obviously did not think of her as evil, simply because she was a liberal Democrat.

          • Stephen` Paul Anderson says:

            Cherrypick!LOL. A common refrain from the left. It isn’t hard to cherry-pick. Let’s see, the forced internment of the Cherokee, fought to preserve slavery, KKK, Jim Crow, Japanese American incarceration. The Democrats have a pretty nasty record. The Democrats are the party of progressivism, income tax, Federal Reserve, 17th Amendment, Social Security, The New Deal, Medicare, Medicaid, Welfare, and Obamacare. The Democrats are the party of big government egalitarianism, except for the Cherokee. Oh, and the blacks, and the Japanese Americans, and Christians, and conservatives. But, other than those, they are for equanimity.

          • Stephen` Paul Anderson says:

            Look at the Democrats today. They are the party of censorship, cancel culture, #Me Too, reparations, BLM, and Antifa.

          • Nate says:

            Stephen,

            Just as Germans cannot just blame one political party for what they did in WWII, the long-ago attrocities of Americans, cannot be blamed on one party.

            Americans, of all parties, were racist. Americans tolerated slavery. Americans wiped out the Native Americans. Americans were in favor of Japanese internment.

            People dont choose their party based on what distant ancestors did 150 y ago.

            People choose the party that works for them, in the present.

            Since FDR, and more so since the Civil Rights era, minorities chose the Democratic party.

            Since Civil Rights era, racists chose the Republican party. And they seem to prefer it today.

          • Stephen Paul Anderson says:

            No, sorry, Nate, that argument doesn’t work. Leftists do the atrocities and then want to spread the blame around on “America.” In 1860, at the start of the Civil War, there were four million slaves. Name one slave owned by a Republican?

            Name one Republican Governor who signed Jim Crow legislation?

            Name one Republican President who committed an atrocity like “Trail of Tears” or Japanese American internment?

            It wasn’t “America.” It was the Left.

            Name one mass genocide that wasn’t committed by the left: the Holocaust, Stalin, Mao, Khmer Rouge, all left committed atrocities.

            Not our nature or America’s nature. It is YOUR Nature. Stop running away from who you are. Stop trying to obfuscate the facts.

          • Stephen` Paul Anderson says:

            Nate says: Oppression of the Native Americans was going on since the 1500s.

            By who Nate? You still don’t get it.

            Leftists. It is always leftists. The colonialists and monarchists were leftists. Big government. Totalitarianism. Wrapped in the cloak of monarchy and royalty. Maybe if you try really hard you can understand. Oppression is a tool of the Left.

          • Stephen Paul Anderson says:

            In Nate’s world, Nazis made this big switch to the right, and Republicans made this big switch to become racists. Tell us when Nate?

            Nate, you’re living in this delusional world of projection. It is who YOU are.

          • Nate says:

            “Leftists. It is always leftists. The colonialists and monarchists were leftists. ”

            The ‘Left’ did not exist when slaves were brought here, you idiot.

            Monarchists were the opposite of Leftists, who wanted the Monarchy ended, dumbass!

            And plenty of Republicans were in charge, 1870-1920 when the natives were ethnically cleansed, removed to reservations, and/or wiped out, dimwit!

            https://www.okhistory.org/research/airemoval

            Stop revising history to suit your hatreds in the present.

            It is transparent, and nobody buys it.

          • Stephen` Paul Anderson says:

            You’re brilliant, aren’t you? Just ask you. There have always been a left and a right, ever since there were governments. Monarchs weren’t left? Really? Genius. Pathological Projector!

          • Nate says:

            “Nazis made this big switch to the right, and Republicans made this big switch to become racists. Tell us when Nate?”

            Nazis? Irrelevant to Dems, who as much as you would like them to be, are not Nazis. Take it up with historians.

            I did not say Republicans became racists. I said racists became Republicans, in 1964 and after.

            In 1948 after military desegregation under D Truman, Strom Thurmond left the D party, and won 4 Southern States as 3rd party candidate.

            Barry Goldwater, Republican candidate for President in 1964, opposed Civil Rights Legislation.

            The only states he won were his home state of AZ, and FIVE DEEP SOUTH STATES.

            After Civil Rights passed, you had segregationists Strom Thurmond and George Wallace leaving the D party, Thurmond became R, and Wallace a 3rd party.

            Then in 1968 you had Nixon and the Southern Strategy to use the race-card to lure white southern voters. It worked: Nixon and Wallace split the Southern States.

          • Stephen` Paul Anderson says:

            More revisionist history from Anonymous Nate the Pathological Projector.

            One Dixiecrat, Strom Thurmond, joined the Republican Party. All the rest of the Dixiecrats remained Democrats to their deaths. Robert “KKK” Byrd remained a Democrat. Robert Byrd, a member of the KKK, who Joe Biden at his eulogy said spoke “truth to power.” Whatever that means. What does that mean, Nate?

            Barry Goldwater was a racist? No one makes that argument, Nate, not even pathological leftists. Barry Goldwater, a member of the NAACP and supporter of Civil Rights. Yes, he voted against Johnson’s Civil Rights Act because he opposed the overreach and language. How long did the Dixiecrats filibuster the Civil Rights Act? It wasn’t Republicans filibustering the Act.

          • Stephen Paul Anderson says:

            George Wallace, segregationist, ” I don’t believe in bussing those GD little bitty school children to try and recede the racial balance.”

            That’s a hoot Nate. George Wallace was never a Republican. George Wallace was a bigot to his dying day. And a Dixiecrat.

          • Nate says:

            Stephen.

            History does not conform to your weird fantasy that every event and trend was caused by political party membership.

            Goldwater “Yes, he voted against Johnsons Civil Rights Act because he opposed the overreach and language.”

            Sure.

            “During this era, several Republican candidates expressed support for states’ rights, a reversal of the position held by Republicans prior to the Civil War. Some political analysts said this term was used in the 20th century as a ‘code word’ to represent opposition to federal enforcement of civil rights for blacks and to federal intervention on their behalf; many individual southerners had opposed passage of the Voting Rights Act.”

            Regardless of why Barry Goldwater opposed Civil Rights Legislation, the result was he won 5 states in the Deep South, who voted Republican.

            Why did they switch? It should be obvious.

            Then came the Southern Strategy and Southern States voted Rep or 3rd party for President in 1968 and 1972 elections.

            Chairman of Rep party Ken Mehlman, later admitted that there was a deliberate Southern strategy whereby Republican leaders consciously appealed to many white Southerners’ racial grievances in order to gain their support.

            Your state started electing Republican senators in 1966, and continued D/R until all Republican from the 1990s.

            The exceptions were 1976, 1992, with Southern and/or evangelical Christian candidates.

          • Stephen Paul Anderson says:

            Nate, the correlation is that as the South got more conservative, it got less racist. This is a historical fact. And, to say that Republicans had not been supportive of states’ rights is idiocy. Republicans have always supported the tenth amendment. What they didn’t support was using states’ rights to defend slavery.

            The Left, the egalitarian ilk, have historically resorted to murder to achieve their means. They are the arbiters of good or bad, right or wrong, winners or losers, and will kill anyone who interferes with their God-given right to be society’s masterminds.

          • Nate says:

            Stephen,

            “Nate, the correlation is that as the South got more conservative, it got less racist.”

            Again, a correlation causation fallacy.

            And, really? You believe Southerners were NOT CONSERVATIVE prior to 1964? But became so after?

            Republican’s were always for States Rights?

            Just look up the impeachment of Andrew Johnson. DEMs were the main advocates of States Rights.

            Reconstruction, imposed by the Republican majority in Congress was certainly an infringement by the Federal Government on States Rights.

            Republican President Grant wanted to continue it.

            You are stuck in a fantasy Star-Wars-like Universe, not ours. Where your Team is GOOD and always was GOOD, and my Team is EVIL, and always was EVIL.

          • Nate says:

            You might be surprised that Lincoln imposed the first Income Tax.

            And Republican “President William Howard Taft, in an address to the Sixty-first Congress, proposed a two percent federal income tax on corporations by way of an excise tax and a constitutional amendment to allow the previously enacted income tax.”

            Republican Teddy Roosevelt supported it.

            16th Amendment passed bipartisan 3/4 of states in 1913

            And speaking of TRossevelt he was big on American Imperialism, and took by force Cuba, Philippines and imposed our will on Panama.

  64. Norman says:

    Entropic man

    In your post:
    http://www.drroyspencer.com/2021/02/uah-global-temperature-update-for-january-2021-0-12-deg-c-new-base-period/#comment-607053

    You figured out what I was looking for. Thanks.

    Using the MODTRAN tool:
    http://climatemodels.uchicago.edu/modtran/

    If I change both the CO2 value and the Water vapor value from 1880 (water vapor is thought to increase 7% per K so a 1.2 C increase would increase the Water vapor 8.4 %.)

    I set the altitude to 0 for Earth surface and changed the view to looking up so you get the DWIR at the surface.

    I put in 280 for the CO2 value and 0.916 for the Water Vapor to simulate 1880 DWIR. With no other changes I got a value of 361.728 W/m^2. Then I changed the values to current. CO2 to 411 and Water Vapor to 1. The DWIR calculated to 369.264. The difference was 7.536 W/m^2. Without the negative contribution of increased evaporation the Surface would now be 7.536/3.7= 2.04 C warmer rather than the value of 1.2 C.

    The contribution of CO2 was given by you as 2.05 W/m^2. The increase in WV would add 5.486 W/m^2. You calculated the WV feedback as responsible for a gain of 2.39 W/m^2 so the negative value for evaporation increase would be 3.096 W/m^2 (could be less since sensible heat losses could also increase with higher temperature). Anyway it looks like evaporative cooling does reduce the water feedback by about half as found in the article I linked you to in a previous thread.

    https://web.ma.utexas.edu/mp_arc/c/11/11-16.pdf

    So if the modern models are not adding the evaporative cooling with a warmer surface into the model, it will run hot which all the evidence seems to show. If they added the negative value of evaporative losses the models may match the current surface temperature warming data.

  65. ren says:

    Strong frost in the north of the US tonight.
    https://i.ibb.co/0MJdfdz/Screenshot-3.png

    • Bindidon says:

      ren

      A little reminder about ‘the north of the US’

      1. Minesotta, top 5 over all years

      USC00218311 MN_TOWER_2S___________________ 1996 2 2 -51.1
      USC00214652 MN_LEECH_LAKE_________________ 1899 2 9 -50.6
      USC00216612 MN_POKEGAMA_DAM_______________ 1903 2 16 -50.6
      USC00218311 MN_TOWER_2S___________________ 1996 2 1 -50.0
      USC00212576 MN_EMBARRASS__________________ 1996 1 20 -49.4

      2. Minesotta, top 5 over 2010-2021

      USC00211840 MN_COT.TON_____________________ 2019 1 27 -48.9
      USC00211840 MN_COT.TON_____________________ 2019 2 1 -48.9
      USC00211840 MN_COT.TON_____________________ 2019 1 31 -47.2
      USC00210515 MN_BAUDETTE___________________ 2019 1 31 -46.1
      USC00211250 MN_CAMP_NORRIS_DNR____________ 2019 1 31 -45.6

      Please weak me up when you see such nice temperatures ahead!

      J.-P. D.

  66. CO2isLife says:

    I just went through stations that existed since 1900 and identified locations that had a low BI. It was difficult to find any stations at all that showed warming. Here is a list of 100 stations that show no warming trend at all over the past 100+ years. How can CO2 increase from under 300 to 410 and not have an impact on temperatures in these locations? Do the laws of Physics cease to exist in these locations?

    Steveston (49.1333N, 123.1833W) ID:CA001107710
    Maiduguri (11.8500N, 13.0830E) ID:NIM00065082
    Zanzibar (6.222S, 39.2250E) ID:TZM00063870
    Laghouat (33.7997N, 2.8900E) ID:AGE00147719
    Luqa (35.8500N, 14.4831E) ID:MT000016597
    Ponta Delgada (37.7410N, 25.698W) ID:POM00008512
    Wauseon Wtp (41.5183N, 84.1453W) ID:USC00338822
    Valentia Observatory (51.9394N, 10.2219W) ID:EI000003953
    Dombaas (62.0830N, 9.1170E) ID:NOM00001233
    Okecie (52.1660N, 20.9670E) ID:PLM00012375
    Vilnius (54.6331N, 25.1000E) ID:LH000026730
    Vardo (70.3670N, 31.1000E) ID:NO000098550
    Port Blair (11.6670N, 92.7170E) ID:IN099999901
    Nagpur Sonegaon (21.1000N, 79.0500E) ID:IN012141800
    Indore (22.7170N, 75.8000E) ID:IN011170400
    Enisejsk (58.4500N, 92.1500E) ID:RSM00029263
    Vladivostok (43.8000N, 131.9331E) ID:RSM00031960
    Nikolaevsk Na Amure (53.1500N, 140.7164E) ID:RSM00031369
    Nemuro (43.3330N, 145.5830E) ID:JA000047420
    York (31.8997S, 116.7650E) ID:ASN00010311
    Albany (35.0289S, 117.8808E) ID:ASN00009500
    Adelaide West Terrace (34.9254S, 138.5869E) ID:ASN00023000
    Yamba Pilot Station (29.4333S, 153.3633E) ID:ASN00058012
    Wilsons Promontory Lighthouse (39.1297S, 146.4244E) ID:ASN00085096
    Mount Gambier Post Office (37.8333S, 140.7833E) ID:ASN00026020
    Cape Otway Lighthouse (38.8556S, 143.5128E) ID:ASN00090015
    Lencois (12.567S, 41.383W) ID:BR047571250
    Eagle (64.7856N, 141.2036W) ID:USC00502607
    Orland (39.7458N, 122.1997W) ID:USC00046506
    Bahia Blanca Aero (38.733S, 62.167W) ID:AR000877500
    Punta Arenas (53.0S, 70.967W) ID:CI000085934
    Brazzaville (4.25S, 15.2500E) ID:CF000004450
    Durban Intl (29.97S, 30.9510E) ID:SFM00068588
    Port Elizabeth Intl (33.985S, 25.6170E) ID:SFM00068842
    Zanzibar (6.222S, 39.2250E) ID:TZM00063870
    Sandakan (5.9000N, 118.0670E) ID:MY000096491
    Aparri (18.3670N, 121.6330E) ID:RP000098232
    Darwin Airport (12.4239S, 130.8925E) ID:ASN00014015
    Palmerville (16.0008S, 144.0758E) ID:ASN00028004
    Yamba Pilot Station (29.4333S, 153.3633E) ID:ASN00058012
    Coonabarabran Namoi Street (31.2712S, 149.2714E) ID:ASN00064008
    Newcastle Nobbys Signal Stati (32.9185S, 151.7985E) ID:ASN00061055
    Moruya Heads Pilot Station (35.9093S, 150.1532E) ID:ASN00069018
    Omeo (37.1017S, 147.6008E) ID:ASN00083090
    Gabo Island Lighthouse (37.5679S, 149.9158E) ID:ASN00084016
    Wilsons Promontory Lighthouse (39.1297S, 146.4244E) ID:ASN00085096
    Echucaaerodrome (36.1647S, 144.7642E) ID:ASN00080015
    Cape Otway Lighthouse (38.8556S, 143.5128E) ID:ASN00090015
    Maryborough (37.056S, 143.7320E) ID:ASN00088043
    Longerenong (36.6722S, 142.2991E) ID:ASN00079028
    Christchurch Intl (43.489S, 172.5320E) ID:NZM00093780
    Hokitika Aerodrome (42.717S, 170.9830E) ID:NZ000936150
    Auckland Aero Aws (37.0S, 174.8000E) ID:NZM00093110
    St Paul Island Ap (57.1553N, 170.2222W) ID:USW00025713
    Nome Muni Ap (64.5111N, 165.44W) ID:USW00026617
    Kodiak Ap (57.7511N, 152.4856W) ID:USW00025501
    Eagle (64.7856N, 141.2036W) ID:USC00502607
    Dawson A (64.0500N, 139.1333W) ID:CA002100402
    Atlin (59.5667N, 133.7W) ID:CA001200560
    Juneau Intl Ap (58.3567N, 134.5639W) ID:USW00025309
    Skagway (59.4547N, 135.3136W) ID:USC00508525
    Hay River A (60.8333N, 115.7833W) ID:CA002202400
    Prince Albert A (53.2167N, 105.6667W) ID:CA004056240
    Kamloops A (50.7000N, 120.45W) ID:CA001163780
    Banff (51.1833N, 115.5667W) ID:CA003050520
    Mina (38.3844N, 118.1056W) ID:USC00265168
    Merced Muni Ap (37.2847N, 120.5128W) ID:USW00023257
    So Entr Yosemite Np (37.5122N, 119.6331W) ID:USC00048380
    Santa Maria (34.9500N, 120.4333W) ID:USC00047940
    Maricopa (35.0833N, 119.3833W) ID:USC00045338
    Ojai (34.4478N, 119.2275W) ID:USC00046399
    Death Valley (36.4622N, 116.8669W) ID:USC00042319
    Rio Grande City (26.3769N, 98.8117W) ID:USC00417622
    Beeville 5 Ne (28.4575N, 97.7061W) ID:USC00410639
    Carlsbad (32.3478N, 104.2225W) ID:USC00291469
    Burnet (30.7586N, 98.2339W) ID:USC00411250
    Mtn Park (32.9539N, 105.8225W) ID:USC00295960
    Williams (35.2414N, 112.1928W) ID:USC00029359
    Needles Ap (34.7675N, 114.6189W) ID:USW00023179
    Loa (38.4058N, 111.6433W) ID:USC00425148
    Priest River Exp Stn (48.3511N, 116.8353W) ID:USC00107386
    Republic (48.6469N, 118.7314W) ID:USC00456974
    Rangely 1E (40.0892N, 108.7722W) ID:USC00056832
    Lovelock (40.1906N, 118.4767W) ID:USC00264698
    Pendleton (45.6906N, 118.8528W) ID:USW00024155
    Nevada City (39.2467N, 121.0008W) ID:USC00046136
    Culbertson (48.1503N, 104.5089W) ID:USC00242122
    Indian Head Cda (50.5500N, 103.65W) ID:CA004013480
    Sherman (33.7033N, 96.6419W) ID:USC00418274
    Ballinger 2 Nw (31.7414N, 99.9764W) ID:USC00410493
    Ocala (29.1639N, 82.0778W) ID:USC00086414
    Akron 4 E (40.1550N, 103.1417W) ID:USC00050109
    Yates Ctr (37.8786N, 95.7292W) ID:USC00149080
    Alfred (42.2497N, 77.7583W) ID:USC00300085
    Georgetown (6.8000N, 58.15W) ID:GYM00081001
    Casa Blancala Habana (23.1670N, 82.35W) ID:CUM00078325
    Ft Kent (47.2386N, 68.6136W) ID:USC00172878
    Moosonee (51.2833N, 80.6W) ID:CA006075420
    Jackman (45.6275N, 70.2583W) ID:USC00174086
    Columbia Rgnl Ap (38.8169N, 92.2183W) ID:USW00003945

    • barry says:

      Could you provide a link so we can check your work? I just picked a random weather station from your list – Dombaas – and it tells me the record starts in 2006, rather than 1900.

      https://tinyurl.com/y4mnvtup

    • barry says:

      And what does BI stand for, just to be clear?

    • bdgwx says:

      It was difficult to find any stations at all that showed warming.

      Just spot checking a couple of them.

      Okecie warmed at a rate +0.13C/decade. +0.38C/decade after 1960.
      Vilnius warmed at a rate +0.15C/decade. +0.42C/decade after 1960.

      Also, what result do you get when you check them all?

      How can CO2 increase from under 300 to 410 and not have an impact on temperatures in these locations?

      CO2 is not the only thing that determines annual mean temperature at specific locations.

      Do the laws of Physics cease to exist in these locations?

      No. That’s why CO2 is still not the only that determines annual temperature at specific locations.

      • CO2isLife says:

        None of those charts show an uptrend, none. There is extreme volatility, some may be at a high temp due to a sudden recent spike, but none of them show uptrends. They show volatility, but no trend. If you publish the R-Square of your regression it will be close to 0.00. That means there is volatility and no trend.

        Please explain how there can be any, let alone 100, that show no trend in temperatures with a 30% increase in CO2 if it is the main driver of temperatures.

        • bdgwx says:

          Okecie from 1880 is +0.128C/decade +/- 0.019
          Okecie from 1960 is +0.379C/decade +/- 0.064

          Vilnius from 1880 is +0.159C/decade +/- 0.020
          Vilnius from 1960 is +0.420C/decade +/- 0.064

          This is from Excel’s LINEST function. The results are statistically significant for both stations and both time periods.

          No matter how much you want CO2 to be the only modulating factor for mean temperatures on short spatial and temporal scales it just simply isn’t going to be that way. We have got to break you of this “CO2 is the only factor” mentality. I just don’t know how to do that right now.

    • Bindidon says:

      CO2IsLife

      We had this useless discussion several times, and I did my best to show you why it is useless.

      But you persist in trying to demonstrate your strange ideas about CO2 and surface temperatures.

      For the umpteenth time: I have NOTHING to do with this CO2 discussion.

      Thus I restrict as usual this comment to a neutral evaluation of the stations you present here.

      *
      1. Your list contains five duplicates:
      ASN00058012
      ASN00085096
      ASN00090015
      TZM00063870
      USC00502607

      2. You wrote above:

      ” I just went through stations that existed since 1900… ”

      But a run through the cleaned station list shows that out of the 95 remaining stations, a lot had a life span less than 50 years, the five with the least one being:

      CA006075420 2010 2021 12 ON MOOSONEE
      NOM00001233 2006 2021 16 DOMBAAS
      ASN00083090 2004 2021 18 OMEO
      USW00023257 1998 2021 24 CA MERCED MUNI AP
      ASN00010311 1996 2021 26 YORK

      I dropped all stations off having existed for less than 50 years, leaving imho sufficient 82 stations.

      Their trends in C / decade over the respective life span ranged between

      – USC00411250, TX BURNET: -0.096
      and
      – GYM00081001, GEORGETOWN: 0.239

      Two time series (TMIN, TMAX) averagiong the data of all 82 stations were generated.

      Trends for 1900-2021, again in C / decade
      TMIN: 0.30 +- 0.04
      TMAX: 0.05 +- 0.05

      Average trend: 0.17 +- 0.05

      Here is the chart:

      https://drive.google.com/file/d/1V7Tskvpt9HXE8C9bhuwpHStK-KiUUK0v/view

      As you can see, only the average over the TMAX temperature shows no trend over 120 years; but for TMIN, it is quite different.

      This, CO2isLife, is the reason why so many commenters try to say that only TMAX temperatures matter.

      Just a hint: the average trend for TMIN over 40029 stations worldwide, for 1900-2020, was 0.11 C / decade.

      So I ask you: what exactly is your point with your station selection?

      J.-P. D.

      • CO2isLife says:

        5 Stations had duplicates, and a few other had less than 100 years? That is your response?

        OK, there are 82, and I’ll just go dig up some more and I’m sure I’ll have over 200 shortly, please explain how any of these stations can show 0.00 warming over 100 years when CO2 increased by over 30%? How can CO2 be the main driver in temperatures and not cause warming in so many stations?

        Someone please answer that question. Do the laws of physics cease to exist in all those locations? Does CO2 some how turn off randomly for no reason at all?

        Someone please give me an explanation as to why CO2 causes warming i some locations, mostly near cities, and doesn’t cause warming in others, mainly cold and hot deserts sheltered from the corrupting influence of H20 and the UHI Effect.

        • Bindidon says:

          CO2isLife

          ” … mainly cold and hot deserts sheltered from the corrupting influence of H20 and the UHI Effect. ”

          You are lying here.

          Weeks ago, I have shown you lots and lots of desert places (GHCN V3 stations, do you remember?), lacking any UHI but having a warming trend on average.

          You always ignore what has been shown to you and restart the discussion as if you were never contradicted.

          I don’t continue discussions on such an insane basis.

          J.-P. D.

      • Gordon Robertson says:

        binny…”We had this useless discussion several times, and I did my best to show you why it is useless.

        But you persist in trying to demonstrate your strange ideas about CO2 and surface temperatures”.

        ***

        You doing your best to teach anyone anything is hilarious. CO2 is way ahead of you on this, dealing from a higher level of intelligence. Such a source tends to confuse you, so you resort to insults.

    • Clint R says:

      Trying to show how the surface record has been corrupted won’t work. The idiots have an answer for everything.

      The way to squash their nonsense is asking: “Can two ice cubes heat an object more than one ice cube?’

      They will launch into dissertations about “absolute zero”, “dry ice”, and a plethora of such distractions.

      That’s why this is so much fun.

    • barry says:

      CO2isLife made demonstrably false claims. Your pitiful attempt to spin that is quite transparent.

      • Bindidon says:

        barry

        It makes few sense to answer to people like ClintR.

        They twist every argument into its reverse, regardless what we talk about, be it surface temperatures, Moon spin etc etc.

        You can recognize them by the fact that they always want the last word. I recall JD*Huffman and ge*r*an’s behavior, ClintR behaves exactly the same as these two.

        J.-P. D.

      • Clint R says:

        Well barry, since you believe you’re an expert on “transparency”, you should be happy to answer the simple question: Can two ice cubes heat an object more than one ice cube?

        • barry says:

          Depending on the set up, yes.

          If I finish sealing a window with a second block of ice, then the room being heated by a heater will get warmer, because heat loss from the room is slowed down.

          If the object is colder than the blocks of ice, then two blocks of ice in proximity will make it warm faster than one.

          If I put a second block of ice in a warm drink, though, it will cool faster than with one.

          But this is beside the point under discussion.

          Do you agree that CO2isLife made demonstrably false claimss, and that his suggestion based on those claims, that the world has not warmed since 1900, is therefore invalid?

          • Clint R says:

            Well “Mr. Transparency”, you are WRONG. Your distractions don’t help you.

            The simple example of adding an ice cube to another ice cube destroys your false beliefs.

            You have been tested positive for idiot, and you are unmasked.

      • CO2isLife says:

        Barry Says: “demonstrably false claims”

        Please name one? I had some duplicates? Does that change the conclusion? I’ll simply go find more. Trust me, there are plenty.

        Some didn’t have a 100 year record? I just double-checked by screen and the start data is 1900, so it is a 120 year period. If you have a problem with that, take it up with NASA GISS. I simply used their system.

        Anyway, nothing you day refutes the fact that there are many many many sites that show 0.00 warming with a 30%+ increase in CO2. The fact that you are making nonsensical claims that I can easily correct, this is a hobby after all, and won’t explain how increasing CO2 by 30% doesn’t cause warming pretty much proves you can’t refute it.

        • bdgwx says:

          No one is saying that every single location on Earth will experience warming. No one is saying that CO2 is the only thing that modulates mean temperatures on small spatial and temporal scales. It’s not even the only factor on large spatial and temporal scales. You’re testing a hypothesis that we’ve all known to be false for a really long time.

        • barry says:

          You lied when you said:

          “I just went through stations that existed since 1900 and identified locations that had a low BI… Here is a list of 100 stations that show no warming trend at all over the past 100+ years.”

          Dombaas has temp data for only 14 years, and four others had less than 30.

          You lied when you said:

          “Here is a list of 100 stations that show no warming trend at all over the past 100+ years”

          Many of them do have warming trends. According to Bindidon, the average trend of all of them is 0.17 C/decade.

          2 clear falsehoods.

          Does that answer your question?

          Also, you were asked to provide a link to the data you accessed, so we could check your work. You failed to do that, and I can only surmise that you didn’t want to be found out.

        • barry says:

          bdgwx also took some stations out for a run:

          Okecie from 1880 is +0.128C/decade +/- 0.019
          Okecie from 1960 is +0.379C/decade +/- 0.064

          Vilnius from 1880 is +0.159C/decade +/- 0.020
          Vilnius from 1960 is +0.420C/decade +/- 0.064

          Did you actually do any linear regressions, or was your check of these 100, 95, sorry 82 weather stations by eyeball?

  67. Bindidon says:

    ren

    Maybe I owe you this time an apology:

    https://tinyurl.com/o48zatw8

    Looks pretty good like kinda SSW.

    It has very few in common with that experienced at the end of January 2019 in Northern CONUS, but…

    J.-P. D.

  68. Eben says:

    Believing in Six degrees of Impossible warming from CO2 Before Breakfast , hockey sticks so forth and what not
    https://youtu.be/19q1i-wAUpY

    • Bindidon says:

      Ha ha ha haaah

      GWPF TV, das ist ja echt geil.

      Bravo Eben!

    • Gordon Robertson says:

      eben…”Believing in Six degrees of Impossible warming from CO2…”

      Interesting how ckaotic systems like climate average out to zero in the long term. Also, how the Navier-Stokes equation, which are the basis of climate models, have no solutions in such a chaotic system. Unless of course. you fix the parameters using bs inferences.

      BTW…Gerlich and Tscheuschner pointed that out more than ten years ago. They revealed there are no computers with the computing power to forecast our climate.

      That’s why Binny is laughing so hard, this stuff is waa-a-a-a-a-y over his head. He can’t understand libration never mind differential equation theory.

    • Michael Jackson says:

      Ha ha ha.
      The guy is lecturing to an empty room.
      Hilarious.

  69. studentb says:

    Written in June 2020 by Seth Jones, CSIS:
    “First, far-right terrorism has significantly outpaced terrorism from other types of perpetrators, including from far-left networks and individuals inspired by the Islamic State and al-Qaeda. Right-wing attacks and plots account for the majority of all terrorist incidents in the United States since 1994, and the total number of right-wing attacks and plots has grown significantly during the past six years. Right-wing extremists perpetrated two thirds of the attacks and plots in the United States in 2019 and over 90 percent between January 1 and May 8, 2020. Second, terrorism in the United States will likely increase over the next year in response to several factors. One of the most concerning is the 2020 U.S. presidential election, before and after which extremists may resort to violence, depending on the outcome of the election. Far-right and far-left networks have used violence against each other at protests, raising the possibility of escalating violence during the election period.”

    As he correctly foreshadowed, right-wingers are much more of a menace to society than left-wingers.

    • Gordon Robertson says:

      student…”As he correctly foreshadowed, right-wingers are much more of a menace to society than left-wingers”.

      We saw very recently that the so-called left-wingers opposing Trump and the US police burned buildings, police cars, and caused millions of dollars worth of damage. They also killed people and injured them.

      I have yet to see one instance of right wing violence that comes near to that kind of anarchy. I don’t call the White House invasion a terrorist act. Some people got hurt but I don’t think violence was the intent. It was far more a case of simple a civil disobedience based protest.

      Hey…when I was an engineer, some of the guys invaded the British Columbia legislature and stole the Speaker’s chair, leaving a small pyramid in its place. It was a prank. We have a cannon in a local park that is fired every night at 9 o’clock. The engineers stole it as well. They took it back to the metallurgical engineering faculty and repaired it, removing rust and repainting it.

      To hear the howls of protest from city aldermen and the media you’d think a major terrorist attack had taken place. There was egg all over their faces when they learned the Speaker’s chair was being held ransom for donations to the Children’s Fund. Same with the cannon.

      I am a left-winger, one who stands for democracy and equality for all. The idiots being labelled left-wingers these days have nothing to do with left-wing ideals. And, no, those left-wing ideals have nothing to do with the brutal Stalinist regime or the current violent regimes like China and other countries.

      CSIS is a Canadian security agency and Canada is a socialism (social democracy to the politically-correct), which is based on true left-wing principles. I have seen no so-called left-wing terrorists working out of Canada. We’re too busy watching hockey games.

      I have no idea what CSIS is thinking about when they refer to left-wing factions. I have seen no honest left-wing activity since the last time I stood on a union picket line. Even at that, many of the guys on the line were capitalists who had no interest in socialism or left-wing ideals.

      The notion has been out there for a while that people who engage in civil disobedience are left-wing anarchists. It means essentially, that anyone willfully crossing the street against a red light (civil disobedience) is a left-wing anarchists. I recall while attending union rallies, there were undercover police filming individuals. I could not understand why they were wasting their time.

      I have been involved with men who willingly committed civil disobedience here in Canada, and willing to face jail time, but not one of them was un-Canadian or interested in over-throwing the government. In fact, if Canada came under attack, they’d be the first to sign up in the Canadian forces to oppose such an attack.

      • studentb says:

        Facts are facts, no matter how unpalatable:
        “Right-wing extremists perpetrated two thirds of the attacks and plots in the United States in 2019 and over 90 percent between January 1 and May 8, 2020.”

      • studentb says:

        “I dont call the White House invasion a terrorist act. Some people got hurt but I dont think violence was the intent. ”

        Everybody, just look at this statement and ponder for a while.

        Where is Swenson when we need him to shout out his favourite accusation: “delusional” ?

    • gbaikie says:

      Left wing are incapable of planning

    • Eben says:

      Eco-Terrorists shoot at Christy and Spencer
      https://youtu.be/EpZKm6PR5LQ

  70. ren says:

    Bindidon,
    continuous rainfall in the Rhine basin threatens to floods.
    https://www.accuweather.com/pl/de/national/weather-radar

  71. ren says:

    Gordon Robertson,
    the forecasts show a dramatic drop in temperature in Canada.
    https://i.ibb.co/y65sVMW/ecmwf-T850-namer-6.png

    • Gordon Robertson says:

      ren…”Gordon Robertson,
      the forecasts show a dramatic drop in temperature in Canada”.

      Canada covers a very large area. Here on the SW coast, near Vancouver, we’ve had no snow at sea level and only a sprinkling at 600 feet. So far, no Arctic air…very mild recently with lots of rain. Lots!!!

      Typical La Nina conditions. It’s flooding in California. Roads are being washed out along the Northern California coastline.

      We have been expecting the cold but so far there has been nothing. Two forecasts of cold and snow were wrong. Hard to predict weather around here due to the warm air pushing in from the Pacific.

    • Gordon Robertson says:

      ren…ps…don’t like all that blue on the map.

      • ren says:

        Gordon look at the pressure in the North (1056 hPa!). In the Arctic above Canada, the pressure will reach 1065 hPa!

        • Gordon Robertson says:

          ren…”Gordon look at the pressure in the North (1056 hPa!). In the Arctic above Canada, the pressure will reach 1065 hPa!”

          You are right. The forecast for next week is very cold, well below zero C.

          Thanks for the info.

          • Michael Jackson says:

            “The forecast for next week is very cold, well below zero C…”

            Do you really believe that forecast? After all, it is based on a computer model. In fact, probably the same model used to predict climate change. And it also uses the fake data manipulated by NASA et al.

            Remember that “climate is just the average of weather” therefore by the same reasoning climate forecasts are just the average of weather forecasts! It follows that the weather forecasts, which are notoriously inaccurate, should be ignored!
            You slavishly pay attention to them only when they predict cool conditions. I call that hypocrisy.

          • gbaikie says:

            –“The forecast for next week is very cold, well below zero C…”

            Do you really believe that forecast? After all, it is based on a computer model.–
            It is computer model, but it’s based upon a huge amount of measurement, without this daily constant huge amount of measuring,
            the models predicting a couple days in future, would fail badly.

  72. CO2isLife says:

    OK, I updated by list and removed duplicates and am now up to 103 unique stations. I won’t republish the list. I want to challenge those that attacked by honesty above to provide their evidence.

    I also want to define the issue, and how to refute any of my claims.

    This is one of the charts I identified. There are certain characteristics that demonstrate no uptrend in temperatures.
    1) High volatility that can’t be explained by CO2
    2) No continual series of higher highs and higher lows over the entire period
    3) Current or recent temperatures are below levels set in the early 1900s.
    4) Current temperatures are not at an all-time high, or if they are, they have had a recent spike in temperatures that couldn’t be caused by CO2

    Punta Arenas (53.0S, 70.967W) ID:CI000085934
    https://data.giss.nasa.gov/cgi-bin/gistemp/stdata_show_v4.cgi?id=CI000085934&dt=1&ds=15

    This is what an uptrend looks like, and is due to construction (UHI), not CO2.

    1) Current temperatures are clearly above the early 1900s
    2) You have a series of higher highs and higher lows
    3) Recent high temperatures aren’t the result of a spike

    Fort Simpson (61.7667N, 121.2333W) ID:CA002202115
    https://data.giss.nasa.gov/cgi-bin/gistemp/stdata_show_v4.cgi?id=CA002202115&dt=1&ds=15

    For those who challenged by credibility, please demonstrate by posting a link to the sites that I posted that do not fit the definition of not haveing an uptrend in temperatures.

    • barry says:

      Ok, so I chose one that was a neighbour to Punta Arenas. Got an upward trend first try.

      https://data.giss.nasa.gov/cgi-bin/gistemp/stdata_show_v4.cgi?id=CIXLT002335&ds=15&dt=1

      Have you thought about Bindidon’s work getting all desert locations and finding there is an upward trend if you average all their trends?

      And have you responded to numerous people saying that not every place in the world will have trends dominated by warming, but that the average will be?

      Weather effects have more influence at the local level, so some places may buck the global trend if weather patterns change over the course of time.

      Here is the change in global temps since mid 1900s.

      https://upload.wikimedia.org/wikipedia/commons/8/88/Change_in_Average_Temperature.svg

      You can see that there are still a few regions that cooled, even with general warming. If the resolution gets finer, you can see some cooling locations dotted around the globe, but the average of them all is warming.

      The world is not a featureless billiard ball, and CO2 is not the only thing affecting temperatures, especially at single locations. There is no reason to expect a uniform, monotonic response to rising CO2 everywhere.

  73. Gordon Robertson says:

    binny…”For all visitors who are irritated by UAHs abrupt change of the reference period, here are the offsets you have to add to monthly anomalies ”

    Give it up. Look at an old mercury thermometer and see if you can find the difference in the height of the mercury column.

    • nurse ratchet says:

      The inhalation of elemental mercury vapours can cause neurological and behavioural disorders, such as tremors, emotional instability, insomnia, memory loss, neuromuscular changes and headaches. They can also harm the kidneys and thyroid. High exposures have also led to deaths.

      Explains a lot.

      • Swenson says:

        n,

        Inhale mercury vapour on a regular basis, do you?

      • Gordon Robertson says:

        nurse crotchrot..”The inhalation of elemental mercury vapours can cause neurological and behavioural disorders…”

        Look what its done to you. has you cross-dressing, claiming to be a nurse, and raving about who knows what.

        • nurse ratchet says:

          Maybe your symptoms have nothing to do with your mercury thermometer. Maybe they can be explained by the fact that you are Canadian (with some inbreeding thrown in for good measure).

  74. Eben says:

    From Six degrees to zero, Venus fallacy , mob attacks, climate shysters and such
    https://youtu.be/9EkKsuCmdpw

    • Michael Jackson says:

      Crikey digger!.
      Where did you unearth this “drongo”? We here in Oz have never heard of this “wally” – nor his university which must be “back of beyond”.
      I suspect he is all “piss and wind” and has got his facts “arse about face”. In fact, he sounds “as barmy as a Bandicoot” and “wouldn’t know if he was Arthur or Martha”.

      “Oo roo”!

      • Gordon Robertson says:

        MJ…”We here in Oz have never heard of this wally nor his university which must be back of beyond.”

        No surprise, you don’t don’t sound like the type who would know where to look for a university.

  75. jay cadbury says:

    lol. And if the arctic ice completely melted, it wouldnt add 1 penny to sea level. But we never see the oh so studious bdgxw mention that. Nor do he and bindidon mention that the global average temperature is 60F. Because that wrecks their narrative.

    • Bindidon says:

      cadbury

      Stop your nonsense.

      I never and never put sea ice melting and sea level change together.

      That is rather what people like you post in order to discredit others.

      The effect of ice melt – regardless whether sea ice or ice sheet – is, in the Northwestern Atlantic, quite another one.

      I wrote about that already, no need to replicate, and your sort of writing tells me you wouldn’t understand it anyway.

      60F, hu? You US people aren’t even able to adapt yourself. Who uses your bloody Fahrenheit today, apart the US and its backyards here and there?

      J.-P. D.

    • bdgwx says:

      jay said: And if the arctic ice completely melted, it wouldnt add 1 penny to sea level. But we never see the oh so studious bdgxw mention that.

      Actually I have. But so there is no confusion I’ll do so again now. Melting sea ice does not directly contribute to sea level rise.

      jay said: Nor do he and bindidon mention that the global average temperature is 60F.

      Actually I have. But so there is no confusion I’ll do so again now. According to Berkeley Earth and using the 5 centered mean updated as of 2020 the global mean temperature is 15.057C +/- 0.061. This is 59.1F.

      jay said: Because that wrecks their narrative.

      These facts and observations are consistent with the body evidence and theory that 1) the planet is warming and 2) agents modulated by human behavior are providing a significant net positive radiative force that is keeping the Earth Energy Imbalance significantly positive. This will result in continued thermal expansion of the ocean and melting of land ice which both directly effect sea level rise.

      • Clint R says:

        bdgwx, why don’t you share with us that “theory” that “adding CO2 to the atmosphere will raise surface temperatures”?

        We know you like models. So show us the “model” to support your belief. Both the “steel greenhouse” and the “blue/green plates” have been debunked.

        Where’s the physics to support your cult beliefs?

        • Norman says:

          Clint R

          You make the claim the “steel greenhouse” and “blue/green plates” have been debunked. Where has that been done. The only places I see the “steel greenhouse” debunked are on the contrarian blog run by the fanatic Joseph Postma. He is beyond reason and he shows poor knowledge of heat transfer physics.

          Where do you find this debunking?

          the “steel greenhouse” is based upon well established physics.
          http://machineryequipmentonline.com/hydraulics-and-pneumatics/radiation-heat-transferradiation-shields-and-the-radiation-effects/

          Read through this, you might learn something of value. You are wrong about the “steel greenhouse”

          Making false claims with zero support makes you and idiot.

          Support you claims or don’t make them. No one is interested in your lunatic opinions. Show some physics or shut up!

          • Clint R says:

            Norman, this has been explained before. Maybe you missed it.

            In the “steel greenhouse” nonsense, the sphere must be emitting 480 W/m^2, for the shell to emit 240 W/m^2 to space. That requires the sphere (Earth) to be at a temperature of 303K. But Earth is only at 288 K. So the bogus “steel greenhouse” has Earth temperature 15 K hotter than it really is.

            (And, once again, you don’t understand the link you found.)

          • Norman says:

            ClintR

            Instead of being an intentional idiot, describe what I do not understand in the link I posted. You are not able to do it because you are an idiot. If you had intelligence you could describe what you claim. You can’t, idiot!

            And the steel greenhouse was not meant as a replica of Earth system. It was a point to show how the GHE works. That is all. The Earth has an atmospheric window that allows surface emitted IR to leave directly to space. The surface also has other mechanisms for removing energy from the surface and cooling it (latent and sensible heat loss).

            If you did not have have evaporation or convection cooling the surface would be much warmer.

            Get a brain, please. Your opinions suck! They are really bad, like fake news, fake everything. You are not capable of supporting any of your claims with valid science. You never have been able and it seems you are still not capable of doing this.

          • Clint R says:

            This is classic “Norman”, Norman. You’ve got the insults, false accusations, and a link you can’t understand. You’ve got it all there.

            Classic!

            And now you want to deny your own AGW nonsense! You want to deny that the “steel greenhouse” and “plates” have been used for years to “prove” the AGW nonsense.

            The rats are leaving their sinking ship.

            The link you found, but can’t understand, involves “high-reflectivity, low-emissivity radiation shields”:

            “Radiation heat transfer between two surfaces can be reduced greatly by inserting a thin, high-reflectivity (low-emissivity) sheet of material between the two surfaces. Such highly reflective thin plates or shells are called radiation shields.”

            Both the “steel greenhouse” and “plates” have emissivity = 1.0.

            Denying and perverting reality is why you’re an idiot.

          • Norman says:

            ClintR

            In the link you can use any material to reduce the flow of heat.

            A shiny object with low emissivity would make a superior heat shield, yes that is correct.

            But in the equation you will find that if you have an emissivity of 1 (blackbody) you will still reduce the rate of heat transfer by half. If you have a low emissivity material you get much better results.

            http://machineryequipmentonline.com/hydraulics-and-pneumatics/wp-content/uploads/2016/03/RADIATION-HEAT-TRANSFER-0076.jpg

            If you put a one in for all the emissivities in the equation you reduce the heat flow by half.

            If the shield had an emissivity of 0.1 and the other two plates are blackbodies you reduce the heat flow by 1/20.

            The steel greenhouse works as a single blackbody shield between the heated object it surrounds and empty space. It would reduce the heat flow of the inner object by half.

          • Clint R says:

            Now you’ve made a complete loop, Norman. You’re just abusing your keyboard again.

            The reduction “by half” results in the temperature difference by a factor of the fourth root of 2, or 1.189.

            255K * 1.189 = 303K

            But Earth is 288K, not 303K.

            You’re back to the starting point. You’ve done a full “360” just spinning in place, learning nothing, like a complete idiot.

          • Norman says:

            ClintR

            I did not make a loop. The surface of the inner sphere in the “steel greenhouse” would be 303 K.

            The Earth’s surface would be around that value as well if you did not have latent and sensible heat removing over 100 W/m^2 from the Earth’s surface.

            I do not know where you got the information that the “steel greenhouse” is an exact replica of the energy balance for the Earth’s surface. From what I read on it, it was just a demonstration of the GHE. How a HEATED surface (continuous energy input) would increase in temperature if you put a shell around it. The shell would warm up and emit IR both ways. It would warm up until it emitted 240 W/m^2 out to space but when it reached this point it also emits 240 W/m^2 back to the surface forcing the HEATED surface to a higher temperature. When the surface of the inner sphere reaches 303 K it is emitting 480 W/m^2. Now it is in balance with the continuous input energy of 240 W/m^2. The heat loss is the amount of energy it emits minus the energy it receives from the outer shell 480-240.

          • Norman says:

            ClintR

            Please take the time to read section 3 of this article.

            http://mafija.fmf.uni-lj.si/seminar/files/2015_2016/Thermal_radiation_heat_transfer_between_surfaces_Luka_Klobucar.pdf

            The energy balance for a surface is how much energy it emits MINUS the amount it absorbs from its surroundings.

          • Clint R says:

            Norman, if you now want to admit that the “steel greenhouse”‘ and the “plates” are NOT representative of Earth, that’s an improvement. That’s all that is really important. It is not important for you to understand all of the physics involved.

            And your second link adds nothing. Everyone knows about energy conservation, except idiots.
            Idiots believe flux is conserved! As you once did, before I taught you correctly.

            You did learn, didn’t you?

          • gbaikie says:

            What steel greenhouse “proves” is you don’t need a sun nor an atmosphere, to keep a planet warm. But you would need a massive amount of geothermal energy.

            One might see, that if you have ocean and atmosphere, and there is a much smaller amount of geothermal energy at the ocean sea floor, that could have a warming effect from geothermal energy.

          • gbaikie says:

            A new thought, Willis Eschenbach, basically puts steel greenhouse high enough to avoid mountains {and he doesn’t even know what mountains would like in his mythical world.
            Instead on cover a planet with ocean, making the surface level.
            Then put steel greenhouse 5 feet above the ocean {and you could keep there by floating above the ocean- but don’t need to do that, but start it that way.

            What happens?

          • gbaikie says:

            “For our thought experiment, imagine a planet the size of the Earth, a perfect blackbody, heated from the interior at 235 watts per square metre of surface area.”

            Instead put ball water with mass of the Moon at Neptune L-3
            Perfect sphere, and frozen at surface.
            Drop a bunch nuclear reactor on to the this dwarf planet, And going to sink them until 20 km below surface {and stop them sinking further]. 20 km depth on Earth is 29,000 psi, on Moon it’s 1/6th or
            4,833 psi or equal to earth depth of 3,333.3 meters {which btw shallower than Earth ocean average depth}.
            So, drop enough nuclear reactor so it will radiate 235 watts of energy globally at the surface. And once reactor reach 20 km depth or 4,833 psi, they not be hot enough to boil water at that pressure.
            And 3226 psi {highest a ref gives] is 374 C and 706 F.
            Or reactor designed not heat water over 400 C, and at 4,833 psi and at 400 C, I am guessing it’s not boiling the water. Though would be boiling the water until get somewhere nearer the 20 km depth. So math is done and there spaced evenly to get the 235 watts at the surface. And say these reactors run for 50 years at near constant output {and then are refueled/replaced}.
            Now addition making electrical power from high pressure H20 steam, they want build a global roof and they going to ceiling 5 feet above the ice surface. And rather than having foundations on ice they going to be floating foundation of water.
            And so build a steel greenhouse which will be 5 feet above waterline.
            So world starts, close perfect vacuum and if surface is liquid or 0 C, then the partial pressure of 0 C H20 is 0.0060 atm or 0.0882 psi. Mars pressure is 0.095 psi so lower pressure than Mars, thin atmosphere]. But without steel greenhouse it’s suppose to 235 watt per square meter which some could imagine is about -18 C. Don’t have number of partial pressure of water at -18 C. Just using, this:
            https://en.wikipedia.org/wiki/Vapour_pressure_of_water
            Also all electrical power used will done at 100 meter or lower below surface {100 meter has 24.5 psi pressure} or house air would need to be 24.5 psi to match the exterior pressure of water at 24.5 psi at 100 meter depth. {and iron ore and any carbon needed is imported}

          • gbaikie says:

            Another aspect is heat gradient and going thru earth rock it’s about 25 K per km.

            And the thermal conductivity of ice is similar to earth rock.
            Or it appears granite conducts more heat and basalt conducts less
            than ice.
            And liquid has very poor thermal conductivity, but with temperature difference which add buoyancy water can transport heat by convection. So, water: 1.34 (at 0 °C) and ice 5.3 (0 °C):
            https://www.britannica.com/science/rock-geology/Thermal-properties
            basalt: 4.0 and granite: 7.8

            If surface in vacuum is radiating 235 watt and said to -18 C and is heated internally, ice will be about 25 K warming 1 km below
            the ice surface {25 – 18 = 7 C}
            But if it’s 400 C and going to thru ice and 20 km down.
            19 times 25 = 475 or minus -75 C
            But 10 km up times 25 = 250 and 400 – 250 is water at 150 C and liquid water will not allow 25 C difference per km, as it will rise from convection.
            So as long as has ice, it transport heat pretty well, once liquid it transport heat quickly if there is difference in temperature of
            water but poorly if water temperature is near uniformity in temperature.
            So for fun, before heat is added make it, radiates 235 watts. We start liquid water to make a good sphere, then let it cool so, have 50 km of ice near surface. And going tunnel thru ice down to 20 km
            depth.
            And to make “easier” to tunnel, we use radioactive heated sphere which is 1.5 meter in radius and has density of 10, with steel which is 8 and on outside of it. So earth that weighs, it volume of 14.14 cubic meters, so 141.1 ton. But in water it’s 9 = 127.26 tons and 1/6th gravity it weighs 21.21 tons. And have cable and with winch which can deal with as much 50 ton. And hot sphere is 400 C when in water.
            So lower down until plus cable weight is 50 tons, then attach end cable to float which can float 50 tons. And then, lower another 1.5 radius sphere.
            Meantime the hot sphere makes a larger hole in ice, then you remove it and then got big enough hole that one can lower the nuclear power plant into. And much later, than that, make the steel greenhouse- from the imported iron ore and the electrical power.

      • jay cadbury says:

        with the current global average temperature well below the geological average, it is pretty hard to isolate the human fingerprint. The sinks and sources are not fixed and the earth energy imbalance isn’t a fact, it’s an opinion. So when Pinatubo erupted and the ocean absorbed more carbon, we could say that’s an earth energy imbalance, lol. Oh hey! Did I just prove natural processes actually affect the temperature more than manmade?

        • bdgwx says:

          Which geological period are you referring to?

          No, the concept of an energy imbalance is not an opinion. It is a fact. It is actually one of the core tenets of the 1st law of thermodynamics. Ya know dEtot = Ein – Eout. And Earth’s Energy Imbalance (EEI) has been measured. It is currently at +0.87 W/m^2 +/- 0.12 (or +14 ZJ/year) https://tinyurl.com/34pjx4hj

          No. The rate at which oceans absorb carbon is a completely different concept from the EEI.

  76. ren says:

    After a turbulent weekend with a blizzard and freezing rain, the new week is quieter. A cold peak over Scandinavia determines the weather here. The coldest winter week in years is looming for many regions, and the nights are particularly icy.
    https://www.wetteronline.de/wetterticker/c74ca637-126c-4a89-9b40-f656d5742d98

  77. http://ocean.dmi.dk/arctic/icecover.uk.php

    As one can see the demise of Arctic Sea Ice is highly exaggerated.

    In the 1930’s a similar situation played out.

    So just like the hype on how this period of global warming is so unusual the same can be applied to the hype about Arctic Ice.

    AGW theory should be called AGW hype theory.

  78. CO2isLife says:

    OK, now I’ve removed duplicates and relaxed the BI Restriction and now I’m up to 140 sites that show no continuous uptrend over the past 120 years. The screen shows that there are 1121 Stations that have data since Dec 1900. That means that over 10% of weather stations show no warming, and I’ve just started looking. Rarely do I find a station that shows a definitive uptrend, and they are mostly city locations. Regression trends on this kind of volatile data are worthless. The R-Squares are near or at 0.00. People that see trends in these charts simply don’t know how to read charts.

    Steveston (49.1333N, 123.1833W) ID:CA001107710
    Maiduguri (11.8500N, 13.0830E) ID:NIM00065082
    Zanzibar (6.222S, 39.2250E) ID:TZM00063870
    Laghouat (33.7997N, 2.8900E) ID:AGE00147719
    Luqa (35.8500N, 14.4831E) ID:MT000016597
    Ponta Delgada (37.7410N, 25.698W) ID:POM00008512
    Wauseon Wtp (41.5183N, 84.1453W) ID:USC00338822
    Valentia Observatory (51.9394N, 10.2219W) ID:EI000003953
    Dombaas (62.0830N, 9.1170E) ID:NOM00001233
    Okecie (52.1660N, 20.9670E) ID:PLM00012375
    Vilnius (54.6331N, 25.1000E) ID:LH000026730
    Vardo (70.3670N, 31.1000E) ID:NO000098550
    Port Blair (11.6670N, 92.7170E) ID:IN099999901
    Nagpur Sonegaon (21.1000N, 79.0500E) ID:IN012141800
    Indore (22.7170N, 75.8000E) ID:IN011170400
    Enisejsk (58.4500N, 92.1500E) ID:RSM00029263
    Vladivostok (43.8000N, 131.9331E) ID:RSM00031960
    Nikolaevsk Na Amure (53.1500N, 140.7164E) ID:RSM00031369
    Nemuro (43.3330N, 145.5830E) ID:JA000047420
    York (31.8997S, 116.7650E) ID:ASN00010311
    Albany (35.0289S, 117.8808E) ID:ASN00009500
    Adelaide West Terrace (34.9254S, 138.5869E) ID:ASN00023000
    Yamba Pilot Station (29.4333S, 153.3633E) ID:ASN00058012
    Wilsons Promontory Lighthouse (39.1297S, 146.4244E) ID:ASN00085096
    Mount Gambier Post Office (37.8333S, 140.7833E) ID:ASN00026020
    Cape Otway Lighthouse (38.8556S, 143.5128E) ID:ASN00090015
    Lencois (12.567S, 41.383W) ID:BR047571250
    Eagle (64.7856N, 141.2036W) ID:USC00502607
    Orland (39.7458N, 122.1997W) ID:USC00046506
    Bahia Blanca Aero (38.733S, 62.167W) ID:AR000877500
    Punta Arenas (53.0S, 70.967W) ID:CI000085934
    Brazzaville (4.25S, 15.2500E) ID:CF000004450
    Durban Intl (29.97S, 30.9510E) ID:SFM00068588
    Port Elizabeth Intl (33.985S, 25.6170E) ID:SFM00068842
    Sandakan (5.9000N, 118.0670E) ID:MY000096491
    Aparri (18.3670N, 121.6330E) ID:RP000098232
    Darwin Airport (12.4239S, 130.8925E) ID:ASN00014015
    Palmerville (16.0008S, 144.0758E) ID:ASN00028004
    Coonabarabran Namoi Street (31.2712S, 149.2714E) ID:ASN00064008
    Newcastle Nobbys Signal Stati (32.9185S, 151.7985E) ID:ASN00061055
    Moruya Heads Pilot Station (35.9093S, 150.1532E) ID:ASN00069018
    Omeo (37.1017S, 147.6008E) ID:ASN00083090
    Gabo Island Lighthouse (37.5679S, 149.9158E) ID:ASN00084016
    Echucaaerodrome (36.1647S, 144.7642E) ID:ASN00080015
    Maryborough (37.056S, 143.7320E) ID:ASN00088043
    Longerenong (36.6722S, 142.2991E) ID:ASN00079028
    Christchurch Intl (43.489S, 172.5320E) ID:NZM00093780
    Hokitika Aerodrome (42.717S, 170.9830E) ID:NZ000936150
    Auckland Aero Aws (37.0S, 174.8000E) ID:NZM00093110
    St Paul Island Ap (57.1553N, 170.2222W) ID:USW00025713
    Nome Muni Ap (64.5111N, 165.44W) ID:USW00026617
    Kodiak Ap (57.7511N, 152.4856W) ID:USW00025501
    Dawson A (64.0500N, 139.1333W) ID:CA002100402
    Atlin (59.5667N, 133.7W) ID:CA001200560
    Juneau Intl Ap (58.3567N, 134.5639W) ID:USW00025309
    Skagway (59.4547N, 135.3136W) ID:USC00508525
    Hay River A (60.8333N, 115.7833W) ID:CA002202400
    Prince Albert A (53.2167N, 105.6667W) ID:CA004056240
    Kamloops A (50.7000N, 120.45W) ID:CA001163780
    Banff (51.1833N, 115.5667W) ID:CA003050520
    Mina (38.3844N, 118.1056W) ID:USC00265168
    Merced Muni Ap (37.2847N, 120.5128W) ID:USW00023257
    So Entr Yosemite Np (37.5122N, 119.6331W) ID:USC00048380
    Santa Maria (34.9500N, 120.4333W) ID:USC00047940
    Maricopa (35.0833N, 119.3833W) ID:USC00045338
    Ojai (34.4478N, 119.2275W) ID:USC00046399
    Death Valley (36.4622N, 116.8669W) ID:USC00042319
    Rio Grande City (26.3769N, 98.8117W) ID:USC00417622
    Beeville 5 Ne (28.4575N, 97.7061W) ID:USC00410639
    Carlsbad (32.3478N, 104.2225W) ID:USC00291469
    Burnet (30.7586N, 98.2339W) ID:USC00411250
    Mtn Park (32.9539N, 105.8225W) ID:USC00295960
    Williams (35.2414N, 112.1928W) ID:USC00029359
    Needles Ap (34.7675N, 114.6189W) ID:USW00023179
    Loa (38.4058N, 111.6433W) ID:USC00425148
    Priest River Exp Stn (48.3511N, 116.8353W) ID:USC00107386
    Republic (48.6469N, 118.7314W) ID:USC00456974
    Rangely 1E (40.0892N, 108.7722W) ID:USC00056832
    Lovelock (40.1906N, 118.4767W) ID:USC00264698
    Pendleton (45.6906N, 118.8528W) ID:USW00024155
    Nevada City (39.2467N, 121.0008W) ID:USC00046136
    Culbertson (48.1503N, 104.5089W) ID:USC00242122
    Indian Head Cda (50.5500N, 103.65W) ID:CA004013480
    Sherman (33.7033N, 96.6419W) ID:USC00418274
    Ballinger 2 Nw (31.7414N, 99.9764W) ID:USC00410493
    Ocala (29.1639N, 82.0778W) ID:USC00086414
    Akron 4 E (40.1550N, 103.1417W) ID:USC00050109
    Yates Ctr (37.8786N, 95.7292W) ID:USC00149080
    Alfred (42.2497N, 77.7583W) ID:USC00300085
    Georgetown (6.8000N, 58.15W) ID:GYM00081001
    Casa Blancala Habana (23.1670N, 82.35W) ID:CUM00078325
    Ft Kent (47.2386N, 68.6136W) ID:USC00172878
    Moosonee (51.2833N, 80.6W) ID:CA006075420
    Jackman (45.6275N, 70.2583W) ID:USC00174086
    Columbia Rgnl Ap (38.8169N, 92.2183W) ID:USW00003945
    Srinagar (34.0830N, 74.8330E) ID:IN008010200
    Olekminsk (60.4000N, 120.4167E) ID:RSM00024944
    Turkestan (43.2700N, 68.2200E) ID:KZ000038198
    Shimla (31.1000N, 77.1670E) ID:IN007101600
    Silvio Pettirossi Intl (25.24S, 57.519W) ID:PAM00086218
    El Golea (30.5667N, 2.8667E) ID:AG000060590
    Salamanca Aeropuerto (40.9592N, 5.4981W) ID:SP000008202
    Kahler Asten Wst (51.1817N, 8.4900E) ID:GME00111457
    Coloso (18.3808N, 67.1569W) ID:RQC00662801
    Nassau Airport New (25.0500N, 77.467W) ID:BF000078073
    Tarpon Spgs Sewage Pl (28.1522N, 82.7539W) ID:USC00088824
    Cape Hatteras Ap (35.2325N, 75.6219W) ID:USW00093729
    Hamburg (40.5511N, 75.9914W) ID:USC00363632
    Charlottetown A (46.2833N, 63.1167W) ID:CA008300301
    Saint Johnsbury (44.4200N, 72.0194W) ID:USC00437054
    Lake Placid 2 S (44.2489N, 73.985W) ID:USC00304555
    Elmira (42.0997N, 76.8358W) ID:USC00302610
    Franklin (41.4003N, 79.8306W) ID:USC00363028
    Sparta (43.9364N, 90.8164W) ID:USC00477997
    La Harpe (40.5839N, 90.9686W) ID:USC00114823
    Ashley (46.0406N, 99.3742W) ID:USC00320382
    Tooele (40.5353N, 112.3217W) ID:USC00428771
    Lander Hunt Fld Ap (42.8153N, 108.7261W) ID:USW00024021
    Green River (41.5167N, 109.4703W) ID:USC00484065
    Kennebec (43.9072N, 99.8628W) ID:USC00394516
    Cooperstown (42.7167N, 74.9267W) ID:USC00301752
    Marshall (39.1342N, 93.2225W) ID:USW00013991
    Imperial (40.5208N, 101.655W) ID:USC00254110
    Milan 1 Nw (45.1219N, 95.9269W) ID:USC00215400
    Grundy Ctr (42.3647N, 92.7594W) ID:USC00133487
    Laramie Rgnl Ap (41.3119N, 105.6747W) ID:USW00024022
    Curtis 3Nne (40.6742N, 100.4936W) ID:USC00252100
    Laketown (41.8250N, 111.3208W) ID:USC00424856
    Springview (42.8222N, 99.7467W) ID:USC00258090
    Culbertson (40.2333N, 100.8292W) ID:USC00252065
    Deseret (39.2872N, 112.6519W) ID:USC00422101
    Lamoni (40.6233N, 93.9508W) ID:USC00134585
    Vestmannaeyjar (63.4000N, 20.2831W) ID:IC000004048
    Akureyri (65.6800N, 18.0794W) ID:IC000004063
    Maliye Karmakuly (72.3794N, 52.7300E) ID:RSM00020744
    Torshavn (62.0170N, 6.767W) ID:DAM00006011
    Oestersund (63.1831N, 14.4831E) ID:SWE00100026
    Karlstad (59.3500N, 13.4667E) ID:SW000024180
    Linkoeping (58.4000N, 15.5331E) ID:SW000008525
    Torungen Fyr (58.3831N, 8.7917E) ID:NO000001465

    • bdgwx says:

      I decided to start at the bottom of your list this time.

      Torungen Fyr from 1880 is +0.093C/decade +/- 0.018
      Torungen Fyr from 1960 is +0.354C/decade +/- 0.058

      As you an see there is a statistically significant warming trend from 1880-2020 and 1960-2020.

      You’ll have to forgive me if I’m suspicious regarding the other sites in your list since the first station I checked has a large warming trend. But that is moot because no one thinks you can derive an accurate global mean temperature trend from 140 cherry-picked sites. So my question for you is…what result do you get for the warming trend when you plug in all 27,000+ GHCN-M stations into a routine that computes the global mean temperature?

      • CO2isLife says:

        bdgwx, regressions mean absolutely nothing on volatile data sets like that when put in the context of a continually increasing function. CO2 is claimed to “trap” heat. CO2 increase from 300 to 410 during that time.

        Without even looking at the site you identified, I’m sure that temperatures within the last decade are below the levels reached back around 1900. If the current levels are at or near an all time high, it would have occurred due to a spike in temperatures which most likely died after the recent El Nino. There is no trend. There is no series of higher highs and higher lows. Spikes aren’t due to CO2, they are due to the UHI, fewer clouds, etc etc, but not CO2.

        Once again, show an uptrend. Here, I went and looked up the station. No one that knows how to read a chart would consider this an uptrend.
        https://data.giss.nasa.gov/cgi-bin/gistemp/stdata_show_v4.cgi?id=NO000001465&dt=1&ds=15

        Observations:
        1) Current levels 2015 are way below the level set in 1880
        2) Current level is barely above the level set in 1882 and below the level in 1950
        3) Current high temperature is the result of a spike in temperature that is quickly collapsing
        4) Start the regression in 1882 and end in 2015 and the slope will be negative
        5) A near by site shows even flatter temperatures
        https://data.giss.nasa.gov/cgi-bin/gistemp/stdata_show_v4.cgi?id=NOE00105483&ds=15&dt=1

        • bdgwx says:

          No one that knows how to read a chart would consider this an uptrend.

          I don’t know what to tell you here.

          Excel’s LINEST function outputs for Torungen Fyr…

          +0.093C/decade +/- 0.018 from 1880-2020
          +0.354C/decade +/- 0.058 from 1960-2020
          +0.086C/decade +/- 0.018 from 1882-2015

          …those are statistically significant trends.

          And the 5yr centered mean in 2015 is 8.84 and in 1882 it is 7.16.

          For Oksoey Fyr I get…

          +0.084C/decade +/- 0.016 from 1880-2020
          +0.360C/decade +/- 0.056 from 1960-2020
          +0.066C/decade +/- 0.016 from 1882-2015

          …which again is statistically significant.

          • CO2isLife says:

            bdgwx, what you are referencing is a least-squares line slope. That is totally meaningless for demonstrating the impact of CO2 over temperatures because CO2 only adds W/M^2 to a system. The line you are referring has an R-Squared of around 0.00. In other words, basically it is a random meaningless line. If a Data set had 18 degrees in 1880, and in 1990 it had 16 degrees, clearly CO2 didn’t cause warming even if current temperatures are 20 Degrees. That kind of variability simply can’t be caused by CO2. Even if the current temperature is a record high, that doesn’t mean it was caused by CO2 is just 4 or 5 years ago it was below the level of 1880. You have to show a sustained continual increase tied to W/M^2 over the past 140 years to blame it on CO2. You can’t find that anywhere in these charts. The only significant uptrends in temperatures you will find are in the Cities.

            Also, the statistically significant beta isn’t meaningful either, and is 100% time period dependent. Stop the data series 10 of so years earlier and your beta will be the opposite sign.

            What would be statistically significant is if the current temperatures are 2 or 3 standard deviations above the mean. I doubt you will find that in any data sets.

            Anyway, if you are going to publish the LINEST, also publish the results for the R-Squared so we can determine the validity of the regression line. The Excel Function is =RSQ(). Time is the X-Axis and Temp is the Y-Axis.

            When you include the RSQ you will see that your regressions are meaningless. RSQ below 70 would be considered meaningless in most sciences, even the social sciences.

          • bdgwx says:

            bdgwx, what you are referencing is a least-squares line slope. That is totally meaningless for demonstrating the impact of CO2 over temperatures because CO2 only adds W/M^2 to a system.

            The entire exercise has little relevance in demonstrating the impact of CO2 because 1) it is for a single site and 2) there are a bunch of factors that determine the y-values with no effort taken to control for those factors. Both of these facts make it difficult to impossible to determine the impact of CO2 has on a global scale.

            If you want to determine CO2’s impact you need to 1) work with the global mean temperature trajectory and 2) remove non-CO2 influencing components from that trajectory.

            The line you are referring has an R-Squared of around 0.00.

            LINEST provides the R^2 value. It is the same as RSQ. For Torungen Fyr is was 0.2.

            In other words, basically it is a random meaningless line.

            No. It is not. Those trends ARE statistically significant. The R^2 is ~0.2 because the standard deviation of the y-values is high. There is a lot of variability of those annual means. That means the trend has limited skill in predicting the exact y-values from the x-values. That is not be confused with the trends ability to predict the trajectory of the y-values relative to the x-values. And it does that with statistically significant skill. The y-values rise as x-values rise. Another way to think about this is to consider what condition results in an R^2 of 1. R^2 = 1 occurs when every annual mean lies exactly on the trend line itself. In other words, there is perfect correlation when the temperature trajectory is a perfectly linear line. So the R^2 value is really telling you how straight the temperature trajectory is. It’s not very straight. We already known that.

            That kind of variability simply can’t be caused by CO2.

            Duh! That is exactly what we’ve been trying to tell you. CO2, by itself, is not adequate to explain the variability of temperatures on the spatial and temporal scales you are focused on here. There is no scientist that seriously considers the hypothesis “CO2 explains all temperature variability on all spatial and temporal scales” to be viable. We’ve all known this false for a long time.

        • Norman says:

          CO2isLife

          I have to totally agree with bdgwx. The graph you posted most certainly has an upward trend and you can easily discern this without use of drawing a line through the graph.

          If you look at the graph after 1990 you find 4 annual mean annual temperatures above 9 C and NONE before it.

          Not sure how you read graphs but you are wrong on this point.

          • CO2isLife says:

            Norman Says: CO2isLife

            I have to totally agree with bdgwx. The graph you posted most certainly has an upward trend.

            Wrong, especially when put in the context of the molecule we are attempting to model. CO2 has one and only one mechanism to impact Climate Change, that being the log decay increase in W/M^2. That is the only defined mechanism. Therefor CO2 can only cause a gradual and marginally declining increase in temperatures. Therefor there is no way for temperatures to ever fall, because CO2 can only drive temperatures higher, and they do it very very very gradually.

            With that understanding, let’s look at the chart that you claim shows an “Uptrend.”
            https://data.giss.nasa.gov/cgi-bin/gistemp/stdata_show_v4.cgi?id=NO000001465&dt=1&ds=15
            1) The range established between 1880 and 1920 persists to this day
            2) The range gets broken about 1990 after a sharp increase in temperatures which can’t be caused by CO2
            3) There are 3 periods of trends 1880 to 1950 (UP) 1950 to 1990 (DN) 1990 to 2020 (UP)
            4) Except for a few short-lived peaks post-1980, the range established between 1880 and 1920 holds.
            5) Once again, to blame CO2 you have to identify a sustained continual increase in temperatures, not a recent spink. That doesn’t constitute a trend.
            6) The R-Squared of your regression line would be very low
            7) 90% of the data falls below the peak set in 1920
            8) A recent spurt in temperatures is evidence CO2 isn’t causing the warming.

            This is what a real uptrend looks like:
            https://data.giss.nasa.gov/cgi-bin/gistemp/stdata_show_v4.cgi?id=ASN00091293&dt=1&ds=15

            The current temperature range is clearly and permanently outside the range established between 1880 and 1920. Temperatures march higher from under 12 to over 14.5. No one would disagree that the post 1945 data doesn’t represent an uptrend. You simply don’t have anything near that in the chart I addressed above. You have variability, that is all, you have no trend.

          • barry says:

            https://data.giss.nasa.gov/cgi-bin/gistemp/stdata_show_v4.cgi?id=NO000001465&dt=1&ds=15

            That shows a clear uptrend.

            The simplest way to find out better than your eyes if there is a trend in the data is to do a linear regression. The fact that you are dismissing that in favour of your personal ‘analysis’ speaks volumes. Tests like linear regresssion are there to stop us fooling ourselves. If you’re going to talk about ‘trend’, you have to employ the tools or sit back down.

  79. CO2isLife says:

    UAh Data doesn’t show an uptrend in temperatures:

    http://www.drroyspencer.com/wp-content/uploads/UAH_LT_1979_thru_January_2021_v6-550×317.jpg

    1) A regression would have a very low R-Squared
    2) The coefficient is highly dependent upon time frame
    3) The data starts during the unusually cold “Coming Ice Age” Era
    4) CO2 isn’t volatile, temperatures are
    5) The level in 1980 and 2018 are nearly identical
    6) CO2 gradually adds W/M^2 in a log-decay function
    7) CO2 doesn’t cause spikes and collapses
    8) A regression starting in 1997 would show flat or falling temperatures
    9) Eliminate El Ninos and the regression would be nearly flat over the entire time period
    10) Current temps are below 1987 and near 1980
    11) If CO2 “traps” heat, there is no way temperatures would be below 1987 levels unless it doesn’t “trap heat”
    12) There is no way the current level is 2 or 3 standard deviations above the mean
    13) Highly variable temperature measurements is evidence something other than CO2 is impacting the temperatures, the IPCC doesn’t even try to explain that residual and their models don’t work.

    • Norman says:

      CO2isLife

      It does seem they are aware of one large influence that causes cooling and that would be large volcanoes. They may cool the surface for a few a years and cause large spikes in the temperature record.

      http://www.cmar.csiro.au/e-print/open/greenhouse_2000e.htm

      • CO2isLife says:

        Norman, simply look at the results of their models. They fail in modeling the temperatures because they have CO2 as the most significant variable. It is that simple. That is why they are trying to “adjust” the date to make it more linear. They need a linear trend in temperature to match the near linear trend in CO2. Otherwise their R-Squared of their models is near 0.00 and meaningless. If they can’t model the temp, they need to adjust the data to produce the desired output. The marginal W/M^2 increases due to CO2 aren’t linear, so their adjustments to the temperature prove it is a deliberate fraud, otherwise the adjustments would show a log decay. They don’t. They all project a linear increase.

    • bdgwx says:

      CO2isLife said: If CO2 traps heat, there is no way temperatures would be below 1987 levels unless it doesnt trap heat

      Oceans are taking up huge amounts of heat. tinyurl.com/12vln336

      And the Earth Energy Imbalance is +0.87 W/m^2 +/- 0.12. tinyurl.com/34pjx4hj

      Burn this into your brain.

      CO2 is not the only factor that modulates temperatures on small spatial or temporal scales.

      • bdgwx says:

        And not to be forgotten…CO2 is not even the only thing that modulates temperatures globally over long periods of time either.

      • CO2isLife says:

        “Oceans are taking up huge amounts of heat. tinyurl.com/12vln336”

        That is my point. Visible Radiation, not LWIR between 13 and 18µ, warms the oceans. If the oceans are warming there are a few issues:
        1) Fewer clouds and more radiation is reaching the oceans to warm them
        2) Fewer El Ninos and Huricanes to release the extra accumulated energy

        Neither of the above are due to CO2.

        • bdgwx says:

          My point was that 90% of the EEI goes into the ocean. The ocean has a lot of thermal mass and inertia whereas the atmosphere does not. We expect that temperature variability of the ocean to be more narrowly constrained relative to the atmosphere. In other words, there is high variability in the atmosphere and low variability in the hydrosphere. This is all expected regardless of the contributing cases for the positive EEI.

          Anyway, clouds are complicated. Fewer low clouds have a net positive radiative force, but fewer high clouds have a net negative radiative force. But you’re still in a pickle here because you haven’t explain why cloud patterns have changed. If you don’t know why cloud patterns have changed then you can’t eliminate CO2 as the cause yet.

          • Clint R says:

            bdgwx, your “EEI” is nonsense. This has been explained to you before. Why do you reject reality?

            * Flux is NOT energy. Flux is NOT conserved. Outgoing flux does NOT equal incoming flux, as Norman learned the hard way.

            * Fluxes can’t be treated as simple numbers. Fluxes are not simple scalars.

            Rejecting reality makes you an idiot. Clinging to false beliefs makes you a cultist.

          • Swenson says:

            b,

            Oceans dont trap heat. Neither does anything else.

            Give it a try. Trap some heat.

            Ho ho ho!

          • gbaikie says:

            –Swenson says:
            February 7, 2021 at 12:53 AM
            b,

            Oceans dont trap heat. Neither does anything else.

            Give it a try. Trap some heat.

            Ho ho ho!–

            Solar ponds “trap” heat.
            The ocean is roughly a solar pond. Or solar ponds are wrecked by rain and wind, oceans “like” wind and rain. Or the ocean “solar pond” is “unaffected” by wind or rain, and sort of “works” because of waves. {solar pond must have still water}. But an ocean does not “work” for humans, it warms the entire world- it’s wild animal.

      • Andre De Rick says:

        And the Earth Energy Imbalance is +0.87 W/m^2 +/- 0.12. tinyurl.com/34pjx4hj
        In another recent study they found a negative trend in the last 2 decades.
        Remote Sensing | Free Full-Text | Decadal Changes of the Reflected Solar Radiation and the Earth Energy Imbalance | HTML (mdpi.com)
        As a result, over the 20002018 period the Earth Energy Imbalance (EEI) appears to have a downward trend of −0.16 0.11 W/m2dec. The EEI trend agrees with a trend of the Ocean Heat Content Time Derivative of −0.26 0.06 (1 σ ) W/m2dec.

        • Ball4 says:

          Andre, thanks for linking that 9/2020 paper using the CERES results reported by Loeb et. al. in the satellite period:

          “Over the period 1971-2018 average EEI amounts to 0.47 +/- 0.1 W m-2, but (EEI from CERES satellite observation)) amounts to 0.87 +/- 0.12 W m-2 during 2010-2018 (Fig. 8).”

    • barry says:

      “UAh Data doesn’t show an uptrend in temperatures”

      Yes, it does. In fact UAH provide those trends for you on their data page for UAH lower troposphere:

      https://tinyurl.com/y62sq3xo

      Look down the bottom, you’ll see the global trend: 0.14 C/decade.

      Or you can perform a linear regression and also take into account autocorrelation, and get a result of:

      0.137 C/decade (+/- 0.051)

      Yep, that is a statistically significant warming trend.

      Enjoy this tool:

      http://www.ysbl.york.ac.uk/~cowtan/applets/trend/trend.html

  80. Entropic man says:

    Salvatore Del Prete

    Arctic Summer sea ice extent data for the last 1450 years from Kinnard et al 2011.

    https://www.nature.com/articles/nature10581

    https://static.skepticalscience.com/graphics/Kinnard_2011_sea_ice_med.jpg

    I don’t see the low ice extent periods you claim.

  81. Entropic man says:

    Co2islife

    “UAh Data doesnt show an uptrend in temperatures: ”

    That turns out not to be the case.

    https://www.woodfortrees.org/plot/uah6/from:1978/to:2021/every/plot/uah6/from:1978/to:2021/every/trend

    • CO2isLife says:

      ET says: Co2islife

      UAh Data doesnt show an uptrend in temperatures:

      That turns out not to be the case.

      It does not show an uptrend, as I explained above:
      1) It shows variability, not a trend
      2) It starts during the Coming Ice Age Era of 1979
      3) Current temperatures are not 2 or 3 standard deviations above the mean
      4) 1980 had the same temperature as 2008, if CO2 traps heat, then it trapped no heat between those two dates
      5) There is no continual series of higher highs and higher lows, only volitility
      6) Current temperatures are below the level of 1986, and headed south
      7) LWIR and radiation remove energy from the atmosphere in a matter of seconds, in other words, if you don’t have continually increasing temperatures, CO2 isn’t “trapping” any heat for an extended period of time
      8) El Ninos clearly are causing the spikes in temperatures, not CO2
      9) CO2 and LWIR won’t warm the oceans
      10) Oceans control the atmospheric temperature
      11) The R-Squared of a regression on that data would be close to 0.00

      • bdgwx says:

        CO2isLife said: It does not show an uptrend

        The UAH trend is +0.1374C/decade +/- 0.006 with an R^2 of 0.46.

        1) It shows variability, not a trend

        It shows both. The standard deviation is 0.25 and the trend is +0.1374C/decade.

        2) It starts during the Coming Ice Age Era of 1979

        Peterson 2008: https://tinyurl.com/edkagni8

        3) Current temperatures are not 2 or 3 standard deviations above the mean

        Kaufmann 2020: https://tinyurl.com/5ji0otpn

        4) 1980 had the same temperature as 2008, if CO2 traps heat, then it trapped no heat between those two dates

        The annual mean for 1980 was -0.228C vs 2008 of -0.160. However, keep in mind that this is only for the atmosphere at around 700mb. The ocean took up 199 ZJ during this period. That comes out to an average uptake of +0.44 W/m^2 and that doesn’t include the land and cryosphere uptake.

        5) There is no continual series of higher highs and higher lows, only volitility

        Using the 13m average you can clearly see a sequence of higher highs and higher lows.

        6) Current temperatures are below the level of 1986, and headed south

        The 13m average in 1986/7 was -0.33 vs 2020/7 of 0.34.

        7) LWIR and radiation remove energy from the atmosphere in a matter of seconds, in other words, if you don’t have continually increasing temperatures, CO2 isn’t “trapping” any heat for an extended period of time

        There is a very steady increase in heat in the whole climate system. Using just the ocean as a proxy for the thermal mass of the climate system (a good approximation since it is 90%) is 8.5 ZJ/year +/- 0.1 (or 0.527 W/m^2 +/- 0.004). That also has an R^2 of 0.96 which tells us that it is very steady and continuous uptake.

        8) El Ninos clearly are causing the spikes in temperatures, not CO2

        Yes they do. Likewise La Ninas clearly are causing sharp drops in temperature as well. Note however that ENSO is cyclic with a net zero effect over long periods. It also does not create heat. It just moves around.

        9) CO2 and LWIR won’t warm the oceans

        Wong 2018: https://tinyurl.com/5blefomb

        10) Oceans control the atmospheric temperature

        There are certainly a contributing factor. It’s actually one of the main reason why atmospheric temperatures are increasing on a global scale and over long periods of time. As the ocean takes up heat and warms so to must the atmosphere warm as well.

        11) The R-Squared of a regression on that data would be close to 0.00

        The UAH trend has an R^2 of 0.46.

        The OHC trend has an R^2 of 0.96.

  82. Adelaida says:

    Dear Dr. Spencer and all fellow forum members:

    I would like to raise some reflections:

    There is no doubt that there have been and are many people honestly investigating the phenomena concerning climate change.

    It also seems to me undoubted that today in our societies the IPCC models are decisive when predicting the future climate …

    I read the brochure on Predictor Models of Climate that Dr. Spencer uploaded in January, which talks about how at one point Saltzman sought to decouple weather predictions on extreme scales of time and space from weather predictions to short term
    and that this is done through the property called “closure” used in the field of quantum mechanics with the standard model of particles …

    The following article beautifully explains this property for the standard model:
    https://www.investigacionyciencia.es/noticias/el-abracadabra-matemtico-que-salv-a-la-fsica-de-partulares-19085

    Quantum mechanics has garnered 14 Nobel Prizes between 1932 and 1999, the result of tremendous experimental and predictive success.

    I started searching for Barry Saltzman and came across a lengthy article describing his ambitious scientific career in some detail:
    https://www.encyclopedia.com/science/dictionaries-thesauruses-pictures-and-press-releases/saltzman-barry

    Of course, Saltzman seems to be the father and designer of the current IPCC computer model climate prediction system …

    However, neither the studies and investigations of Barry Saltzman, nor of any other scientist that is his successor or related to climate change, have had to be sufficiently successful in their experimental approaches, to obtain a Nobel Prize in physics or chemistry, since the 1960s. until now.

    And it seems that the will on the part of the Nobel Foundation is not lacking …, since they have awarded the Nobel Peace Prize to the IPCC in 2007
    and the Nobel Prize in economics in 2018 to William Nordhaus for the “development of an economic model on the impact of climate change”

    So:

    Is the parallelism between the field of weather and quantum mechanics in terms of closure real?

    Isn’t the faith placed in the predictions of the IPCC climate models by governments and institutions inconsistent?

    • gbaikie says:

      “Isn’t the faith placed in the predictions of the IPCC climate models by governments and institutions inconsistent?”
      IPCC doesn’t make predictions, it makes projections.

      Projections have various uses, but a use could said to be political/economical or practical value for the IPCC institution.

  83. Dan Pangburn says:

    A chart for non-condensing greenhouse gases would be meaningful if water vapor (WV) increase was actually a result of only temperature increase (feedback). It is not.

    Water vapor is driven into the atmosphere by its vapor pressure. Vapor pressure depends only on the temperature of the liquid water. Data showing vapor pressure vs temperature of the liquid water is widely available. Evaporation is slowed by the partial pressure of WV in the atmosphere and when the partial pressure gets to be as high as the vapor pressure, net evaporation stops.

    The figure at https://drive.google.com/file/d/1_2m02r30FmvtgSnOEZunFRpUJwTUFU_V/view?usp=sharing shows the measured WV (Total Precipitable Water (TPW) measured globally by NASA/RSS using satellite instruments) and what the WV would be if calculated only on the basis of temperature of the liquid water. The graph shows that the trend for the measured WV is greater than the trend for WV calculated from temperature increase (feedback). Because the partial pressure of WV in the atmosphere is ignored, the calculated temperature increase is somewhat higher than it would be.

    This demonstrates that increasing WV is NOT a result of increasing non-condensing greenhouse gases. All of the average global temperature increase attributable to human activity is from increasing WV. Most (about 90%) of the WV increase attributed to humanity is from increased irrigation. Increasing CO2 does not now, never has, and never will have a significant effect on climate.

    The temperature increase from WV increase is self-limiting. More WV indicates an increase of the rate of transport of energy from the surface to an elevation where the energy can be radiated to space and also will result in increased cloud cover which reflects more solar radiation energy away and provides more area for broad-spectrum radiation to space. Lower cloud altitude and thus warmer temperature also increases broad band radiation from clouds to space. Therefore, the average global temperature increase is also self-limiting.

    • Bindidon says:

      Pangburn

      ” More WV indicates an increase of the rate of transport of energy from the surface to an elevation where the energy can be radiated to space… ”

      Sorry, this is simply wrong.

      Exactly the inverse is the case: the less WV you have in the air

      – the more can be directly radiated to space
      and above all
      – the most efficient the energy output to space will be, because the radiation occurs at an altitude giving a higher temperature than at an altitude of 5 km.

      But your meaning perfectly fits into the idea propagated by some top experts in this blog, who simply state that the more CO2 you have in the atmosphere, the more is radiated to space.

      Incredible, but true.

      J.-P. D.

      • Dan Pangburn says:

        Bin,
        No, its not wrong. You understand it too quickly. It means that the hydrologic cycle, which pumps latent heat up from the surface, is increased. Of course the added WV impedes the flow of radiant heat up to where the energy can be radiated to space (like you said). More WV means clouds form at lower altitude where it is warmer. Clouds radiate essentially full spectrum so a large part of the radiation from clouds is at wavelengths that can go through the atmospheric window out to space. The net result is that temperature increase from increasing WV is self limiting. A simple observation corroborates this. We and all other life are here as a result of billions of years of planet temperature actually not varying much.

        • gbaikie says:

          “A simple observation corroborates this. We and all other life are here as a result of billions of years of planet temperature actually not varying much.”

          I would say in terms of a billion years, Earth temperature has varied a lot.
          But I think of earth temperature as the average temperature of ocean and variation in Earth’s ocean temperature has been about from 1 to over 20 C.
          But in icebox climate within last few tens of million years, it been about 1 to 6 to 7 C. And cold ocean is presently about 3.5 C.
          And a change of 1 C in terms warming or cooling makes a big difference in Earth’s air temperature. Or ours is presently about 15 and would change to about 10 to 20 C air temperature with minus or plus ocean temperature of 1 K.

          But also the ocean surface temperature is limited to about 30 C to ice temperature {and surface of ice is like the land surface which does not have particular lower temperature limit, but one could say somewhere around minus 90 C. And one can’t have thick uniform global cloud cover, nor global cloudless skies.

          It seems once ocean gets much warmer than average temperature of 5 to 10 C, it doesn’t have much amplification of global air temperature. But ocean which which 20 C or more is very warm world- or global tropical conditions, though tropical climate in polar regions will colder then our present tropics- there is just a lot less sunlight. But world without it close to freezing at sea level is much warmer world, then the Ice Age we have been living in for millions of years.

          • Dan Pangburn says:

            Gba,
            I don’t disagree. What you are calling “varied a lot” is IMO about the same as what I called “not varying much” My only point being there was always an acceptable temperature someplace for life as we know it to have evolved.

  84. Gordon Robertson says:

    barry…”CO2isLife made demonstrably false claims. Your pitiful attempt to spin that is quite transparent”.

    Problem is Barry, you can’t supply a coherent argument to rebut CO2isLife. In the past, when I have supplied proof to rebut a comment you have made, you move the goalposts rather than admit you are wrong.

    Example 1…I gave you a link to NOAA’s admission they had slashed global surface stations from 6000 to less than 1500. You replied, inferring that’s not what they meant. Binny replied that the article was old, having been printed in 2015.

    Example 2…when I linked you to an admission from the IPCC that the 15 year period from 1998 – 2012 showed insignificant warming, calling it a warming hiatus, you argued that 15 years was not long enough to be considered significant.

    Good grief, 15 years of a flat trend is an eternity in the range from which it was taken considering temps were supposed to increase annually due to the alleged CO2 warming.

    • Bindidon says:

      Robertson the eternal liar and cheating SOB

      1. ” Example 1 I gave you a link to NOAA’s admission they had slashed global surface stations from 6000 to less than 1500. You replied, inferring that’s not what they meant. ”

      Yes you liar, barry was right.

      YOU were the one who misrepresented NOAA’s page during years and years.

      Because you kept silent the fact that

      – all stations NOAA gave up were stations for which there was no possibility for electronic communication;
      – at the same time, NOAA was acquiring THOUSANDS of new stations.

      2. “Binny replied that the article was old, having been printed in 2015. ”

      No you liar. YOU were telling it was printed in 2015.

      I told that according to the Wayback machine, the NOAA page was already present in… 2010.

      3. And YOU Robertson are the liar who pretends that the currently 40,000 GHCN daily stations (35,000 3 years ago) either do not exist, or are never used.

      Your are of such incredible stupidity that you write on this blog that NOAA uses only ONE station in the Canadian Arctic!

      I can’t recall anybody being so dumb, and lying so brazen as you do.

      And you are not even able to correctly read Newton’s original text!

      J.-P. D.

    • barry says:

      Gordon,

      “Example 1… I gave you a link to NOAA’s admission they had slashed global surface stations from 6000 to less than 1500. You replied, inferring thats not what they meant.”

      There was no inferring. The text is very clear:

      Q. Why is NOAA using fewer weather stations to measure surface temperature around the globe from 6,000 to less than 1,500?

      The physical number of weather stations has shrunk as modern technology improved and some of the older outposts were no longer accessible in real time.

      However, over time, the data record for surface temperatures has actually grown, thanks to the digitization of historical books and logs, as well as international data contributions.”

      https://web.archive.org/web/20100826063929/http://www.noaa.gov:80/features/02_monitoring/weather_stations.html

      Where in that does it say that stations were deliberately removed, deleted, or slashed by NOAA?

      None of the language in this page you cite says that NOAA deliberately deleted weather stations from their list?

      nope, it doesn’t say what you say it does.

      Furthermore, I have shown you (nearly 20 times, I’d guess) the paper that explains why there are more stations in the mid 80s than more recently.

      https://tinyurl.com/gp6z3qp

      It explains that 1200 stations updated to NOAA in real-time, while many other station data were collected and hand digitisaed from old logs to add to the historical record.

      Stations weren’t slashed. They were added retropspectively, and because they were not part of the regularly updating 1200 stations, that was that. Many of those old stations no longer operate, so it’s not even possible to seek permission to get regular updates from them.

      You’ve been shown this multiple times.

      You continue to lie.

  85. One thing which is apparent you have those that believe in AGW theory and those that don’t and we will continue to agree to disagree forever!

    • studentb says:

      Wrong ! (again)
      AGW theory is proving correct as each month goes by.
      You and your dinosaur fellow travellers are on the wrong side of history (again).

      • Of course you will say it is correct because the temperature trend has been up for the past 50 so odd years.

        The trend should have ben up due to solar up to the year 2005 which would be the inflection point. Now 2021 is just 16 years beyond that point and lag times are involved. I don’t know what the lag times are, so it is wait and see.

        Each year that goes by with a further temperature increase looms bad for the solar/climate connection but I think not quite enough time has gone by to give in.

        As far as being on the wrong side of history aside from the climate I have just about no common ground with conservative positions especially when it comes to the virus and Trump.

  86. Gordon Robertson says:

    adelaida…”Quantum mechanics has garnered 14 Nobel Prizes between 1932 and 1999, the result of tremendous experimental and predictive success”.

    Nobel prizes have been awarded and the work for which they were awarded was later proved to be wrong. Quantum mechanics theory took a wrong turn circa 1930 when Niels Bohr decided to explore the less scientific aspects, the aspects that could not be proved and have never been proved, like action at a distance.

    At the time, both Schroding.er, who wrote out the equations explaining Bohr’s theory of 1913, and Einstein, would have nothing to do with Bohr’s new speculations circa 1930.

    Some important theories have developed from quantum theory, like the theoretical explanation of the actions of electrons in electronics and chemistry, but none of the more esoteric theory have been proved. The idea of quantum computing has gone nowhere.

    “Is the parallelism between the field of weather and quantum mechanics in terms of closure real?”

    Eben posted a link to an interesting article the other days by a Canadian mathematician, Christopher Essex, who specializes in the question you are asking. Essex, an expert in models and the math underlying them, claimed that no solutions for the Navier-Stokes equations underlying climate models have been found to explain a complex system like the atmosphere/surface interface. The equations adress only radiation and offer a Mickey Mouse coverag.e of surface conduction and convection.

    G.erlich and Tscheuschner, experts in thermodynamics, with G.erlich being an expert in the related math, claimed there is no computer on the planet with sufficient power to model the equations, even if solutions could be found. Climate models g.et around that by using primitive solutions that are totally g.eneralized. They also introduce concepts like positive feedback and a warming factor for CO2 that have never been established in physics.

    https://www.youtube.com/watch?v=19q1i-wAUpY&feature=youtu.be

    If that link does not work, try:

    https://youtu.be/19q1i-wAUpY

    Thanks to Eben.

    • Gordon Robertson says:

      Here’s an hour long audio pod-cast featuring Christopher Essex:

      https://industrialprogress.com/wp-content/uploads/2015/11/PH-120-Chris-Essex.mp3

      In this pod-cast he claims there is no rigourous definition of climate. Near where I live in Vancouver, BC, the weather can be different within a few miles due to altitude alone. Since climate is loosely claimed to be the averag.e of weather, there is simply no way to pin climate down to a universal model such as global climate. Therefore, climate models are nothing more than expensive toys.

      • Michael Jackson says:

        Christopher Essex ! ha ha ha.
        Is that all you have ?
        Bottom of the barrel on my opinion.

        • professor P says:

          MJ, please dont mock.
          Christopher Essex is the only mathematician they have in Canada.

        • bobdroege says:

          Dr Essex doesn’t know a lot of things, or he is deliberately lying.

          He doesn’t understand what the statement “long term prediction of future climate states is not possible” means.

          And he should.

          Anomalies, Temperatures, model are other things he is rather light on.

      • gbaikie says:

        I am still listening, but we do have climate, our climate is an Icehouse climate.
        Though say something like California could change it’s climate within the icehouse global climate. It hasn’t changed it’s climate recently, but it could become more tropical, or wetter mediterranean climate or have more desert condition, much drier mediterranean climate. And could other changes, it could rain more uniformly, or all rain occurs in couple months, etc. But simply having one year be drier or wetter, is not climate change, it’s variation of a climate- or just the randomness of weather.

        But since we in global icehouse climate there is predictably aspect in regards to all many climates on Earth. And generally globally one has more deserts in icehouse climate.

        • gbaikie says:

          He saying no heat.
          But ocean temperature is heat.
          He might right that no heat in sense the ocean is cold.
          Anyways everyone agree that at least recently, 90% of global warming is heating {raising temperature of ocean- and some [wrongly claim} it’s been around .2 C in last few decades}.
          Or if ocean warms by 1 C, the heat added is equal 1000 K added to atmosphere. Or ocean cooled 1 C, it’s equal to minus 1000 K to atmosphere. Or that just expresses the amount heat involved, or ocean has a lot specific heat and is massive and as compared the entire atmosphere, the atmosphere require 1/1000th of the heat/energy to warm or cool by 1 C.

          • gbaikie says:

            Ok, finished it. It was pretty good.

            Near end of it:
            Re: inflation analogy and indexes = global average temperature
            What I say is most predictive is entire ocean temperature and it takes a long time to change it.
            Global warming has been insignificant {entire ocean has warmed a small amount within last couple of centuries} and ocean could warm in future, but not within decades, more like centuries. And if it warms it will be good, just last couple centuries of warming has been good.
            Or our cold ocean is why we in Icehouse climate and ocean could warm and be warm as interglacial in past have been or ocean might warm as much has it has in past interglacial period. But warmest in been in past interglacials would require at least 1000 years.

  87. ren says:

    Bindidon
    ‘The predicted snowstorm is currently sweeping across a wide strip of the northern center of the country on Sunday morning. From the Münsterland to Hanover to the Harz Mountains, over 15 centimeters of fresh snow has already come together overnight. With a stormy east wind with gusts of up to 80 kilometers per hour, there are already strong snow drifts.’
    https://www.wetteronline.de/wetterticker/2c4c6c02-0115-4ba0-8947-d7bf336e4132

  88. ren says:

    ‘This includes London, which is forecast to pick up as much as 1-3 inches (3-8 cm) of snow. Should snow accumulate in London this weekend, it would be the second snowfall in two weeks for the U.K. capital. This storm could also produce the city’s biggest snowfall so far this winter.’
    https://cms.accuweather.com/wp-content/uploads/2021/02/page-18.jpg?w=632

  89. Adelaida says:

    Gordon,

    Thank you. You write very well and in general you are very polite, which is something that is really appreciated!

    But your opinions on quantum mechanics and relativity, …. They take away your credibility!

    The standard model as well as Einstein’s relativity are being used with enormous experimental and predictive success in day-to-day particle physics and astrophysics (which does not mean that they have solved everything since a theory has not yet been achieved unified physics ..)
    An experimental example:
    http://hyperphysics.phy-astr.gsu.edu/hbasees/Relativ/muon.html

    The article on renormalization that I submitted in my previous post is very interesting.

    • studentb says:

      GR .. “polite”….”credibility” …..!
      Oxymorons.

    • Bindidon says:

      Adelaida

      You seem to have a rather naive view on some people.

      Because naming a guy like Robertson ‘polite’: that is a bit hard.

      Apart from the fact that, like his brothers-in-denial nicknamed ClintR, Swenson etc, he names everybody an idiot who disagrees with him, he really managed to name Andrew Motte, one of the great translators of Newton’s Principia Scientifica (together with the French mathematician Gabrielle Emilie du Chatelet), “a cheating SOB”.

      This is not only impolite: it is really disgusting, and is also the reason why I myself do name him so since then.

      As for his opinion on Einstein and his work, or viruses and some similar things … so what.

      J.-P. D.

      • Clint R says:

        JD, I don’t mind being grouped with Gordon and Swenson. They both seem unaffected by the constant slurs from your type. They seem to be quite secure, and able to think for themselves.

        But, you continue to try to hide the fact that you have been tested positive for idiot. That is NOT “name-calling”. You deny reality. Worse yet, you attempt to pervert reality. That makes you an idiot.

        Of course, in your case, there may be some evidence of inherited DNA contributing to your problems….

        • nurse ratchet says:

          “They seem to be quite secure, and able to think for themselves.”
          Yes, we have them securely locked up each night.
          As for thinking – yes, we have detected some neurological activity. Not much mind you.

  90. ren says:

    It seems that in Europe the temperature anomaly in February will not be positive.
    https://i.ibb.co/FBtWrn7/gfs-T2ma-eu-61.png

  91. ren says:

    Will there be a positive temperature anomaly in the Arctic in February?
    https://i.ibb.co/HNQ0SPt/ecmwf-mslpa-nhem-11.png

  92. ren says:

    In Australia, the temperature anomaly will remain negative in February.
    https://www.tropicaltidbits.com/analysis/ocean/nino4.png

  93. CO2isLife says:

    Over 15% of stations show no defined uptrend in temperatures and counting.

    Steveston (49.1333N, 123.1833W) ID:CA001107710
    Maiduguri (11.8500N, 13.0830E) ID:NIM00065082
    Zanzibar (6.222S, 39.2250E) ID:TZM00063870
    Laghouat (33.7997N, 2.8900E) ID:AGE00147719
    Luqa (35.8500N, 14.4831E) ID:MT000016597
    Ponta Delgada (37.7410N, 25.698W) ID:POM00008512
    Wauseon Wtp (41.5183N, 84.1453W) ID:USC00338822
    Valentia Observatory (51.9394N, 10.2219W) ID:EI000003953
    Dombaas (62.0830N, 9.1170E) ID:NOM00001233
    Okecie (52.1660N, 20.9670E) ID:PLM00012375
    Vilnius (54.6331N, 25.1000E) ID:LH000026730
    Vardo (70.3670N, 31.1000E) ID:NO000098550
    Port Blair (11.6670N, 92.7170E) ID:IN099999901
    Nagpur Sonegaon (21.1000N, 79.0500E) ID:IN012141800
    Indore (22.7170N, 75.8000E) ID:IN011170400
    Enisejsk (58.4500N, 92.1500E) ID:RSM00029263
    Vladivostok (43.8000N, 131.9331E) ID:RSM00031960
    Nikolaevsk Na Amure (53.1500N, 140.7164E) ID:RSM00031369
    Nemuro (43.3330N, 145.5830E) ID:JA000047420
    York (31.8997S, 116.7650E) ID:ASN00010311
    Albany (35.0289S, 117.8808E) ID:ASN00009500
    Adelaide West Terrace (34.9254S, 138.5869E) ID:ASN00023000
    Yamba Pilot Station (29.4333S, 153.3633E) ID:ASN00058012
    Wilsons Promontory Lighthouse (39.1297S, 146.4244E) ID:ASN00085096
    Mount Gambier Post Office (37.8333S, 140.7833E) ID:ASN00026020
    Cape Otway Lighthouse (38.8556S, 143.5128E) ID:ASN00090015
    Lencois (12.567S, 41.383W) ID:BR047571250
    Eagle (64.7856N, 141.2036W) ID:USC00502607
    Orland (39.7458N, 122.1997W) ID:USC00046506
    Bahia Blanca Aero (38.733S, 62.167W) ID:AR000877500
    Punta Arenas (53.0S, 70.967W) ID:CI000085934
    Brazzaville (4.25S, 15.2500E) ID:CF000004450
    Durban Intl (29.97S, 30.9510E) ID:SFM00068588
    Port Elizabeth Intl (33.985S, 25.6170E) ID:SFM00068842
    Sandakan (5.9000N, 118.0670E) ID:MY000096491
    Aparri (18.3670N, 121.6330E) ID:RP000098232
    Darwin Airport (12.4239S, 130.8925E) ID:ASN00014015
    Palmerville (16.0008S, 144.0758E) ID:ASN00028004
    Coonabarabran Namoi Street (31.2712S, 149.2714E) ID:ASN00064008
    Newcastle Nobbys Signal Stati (32.9185S, 151.7985E) ID:ASN00061055
    Moruya Heads Pilot Station (35.9093S, 150.1532E) ID:ASN00069018
    Omeo (37.1017S, 147.6008E) ID:ASN00083090
    Gabo Island Lighthouse (37.5679S, 149.9158E) ID:ASN00084016
    Echucaaerodrome (36.1647S, 144.7642E) ID:ASN00080015
    Maryborough (37.056S, 143.7320E) ID:ASN00088043
    Longerenong (36.6722S, 142.2991E) ID:ASN00079028
    Christchurch Intl (43.489S, 172.5320E) ID:NZM00093780
    Hokitika Aerodrome (42.717S, 170.9830E) ID:NZ000936150
    Auckland Aero Aws (37.0S, 174.8000E) ID:NZM00093110
    St Paul Island Ap (57.1553N, 170.2222W) ID:USW00025713
    Nome Muni Ap (64.5111N, 165.44W) ID:USW00026617
    Kodiak Ap (57.7511N, 152.4856W) ID:USW00025501
    Dawson A (64.0500N, 139.1333W) ID:CA002100402
    Atlin (59.5667N, 133.7W) ID:CA001200560
    Juneau Intl Ap (58.3567N, 134.5639W) ID:USW00025309
    Skagway (59.4547N, 135.3136W) ID:USC00508525
    Hay River A (60.8333N, 115.7833W) ID:CA002202400
    Prince Albert A (53.2167N, 105.6667W) ID:CA004056240
    Kamloops A (50.7000N, 120.45W) ID:CA001163780
    Banff (51.1833N, 115.5667W) ID:CA003050520
    Mina (38.3844N, 118.1056W) ID:USC00265168
    Merced Muni Ap (37.2847N, 120.5128W) ID:USW00023257
    So Entr Yosemite Np (37.5122N, 119.6331W) ID:USC00048380
    Santa Maria (34.9500N, 120.4333W) ID:USC00047940
    Maricopa (35.0833N, 119.3833W) ID:USC00045338
    Ojai (34.4478N, 119.2275W) ID:USC00046399
    Death Valley (36.4622N, 116.8669W) ID:USC00042319
    Rio Grande City (26.3769N, 98.8117W) ID:USC00417622
    Beeville 5 Ne (28.4575N, 97.7061W) ID:USC00410639
    Carlsbad (32.3478N, 104.2225W) ID:USC00291469
    Burnet (30.7586N, 98.2339W) ID:USC00411250
    Mtn Park (32.9539N, 105.8225W) ID:USC00295960
    Williams (35.2414N, 112.1928W) ID:USC00029359
    Needles Ap (34.7675N, 114.6189W) ID:USW00023179
    Loa (38.4058N, 111.6433W) ID:USC00425148
    Priest River Exp Stn (48.3511N, 116.8353W) ID:USC00107386
    Republic (48.6469N, 118.7314W) ID:USC00456974
    Rangely 1E (40.0892N, 108.7722W) ID:USC00056832
    Lovelock (40.1906N, 118.4767W) ID:USC00264698
    Pendleton (45.6906N, 118.8528W) ID:USW00024155
    Nevada City (39.2467N, 121.0008W) ID:USC00046136
    Culbertson (48.1503N, 104.5089W) ID:USC00242122
    Indian Head Cda (50.5500N, 103.65W) ID:CA004013480
    Sherman (33.7033N, 96.6419W) ID:USC00418274
    Ballinger 2 Nw (31.7414N, 99.9764W) ID:USC00410493
    Ocala (29.1639N, 82.0778W) ID:USC00086414
    Akron 4 E (40.1550N, 103.1417W) ID:USC00050109
    Yates Ctr (37.8786N, 95.7292W) ID:USC00149080
    Alfred (42.2497N, 77.7583W) ID:USC00300085
    Georgetown (6.8000N, 58.15W) ID:GYM00081001
    Casa Blancala Habana (23.1670N, 82.35W) ID:CUM00078325
    Ft Kent (47.2386N, 68.6136W) ID:USC00172878
    Moosonee (51.2833N, 80.6W) ID:CA006075420
    Jackman (45.6275N, 70.2583W) ID:USC00174086
    Columbia Rgnl Ap (38.8169N, 92.2183W) ID:USW00003945
    Srinagar (34.0830N, 74.8330E) ID:IN008010200
    Olekminsk (60.4000N, 120.4167E) ID:RSM00024944
    Turkestan (43.2700N, 68.2200E) ID:KZ000038198
    Shimla (31.1000N, 77.1670E) ID:IN007101600
    Silvio Pettirossi Intl (25.24S, 57.519W) ID:PAM00086218
    El Golea (30.5667N, 2.8667E) ID:AG000060590
    Salamanca Aeropuerto (40.9592N, 5.4981W) ID:SP000008202
    Kahler Asten Wst (51.1817N, 8.4900E) ID:GME00111457
    Coloso (18.3808N, 67.1569W) ID:RQC00662801
    Nassau Airport New (25.0500N, 77.467W) ID:BF000078073
    Tarpon Spgs Sewage Pl (28.1522N, 82.7539W) ID:USC00088824
    Cape Hatteras Ap (35.2325N, 75.6219W) ID:USW00093729
    Hamburg (40.5511N, 75.9914W) ID:USC00363632
    Charlottetown A (46.2833N, 63.1167W) ID:CA008300301
    Saint Johnsbury (44.4200N, 72.0194W) ID:USC00437054
    Lake Placid 2 S (44.2489N, 73.985W) ID:USC00304555
    Elmira (42.0997N, 76.8358W) ID:USC00302610
    Franklin (41.4003N, 79.8306W) ID:USC00363028
    Sparta (43.9364N, 90.8164W) ID:USC00477997
    La Harpe (40.5839N, 90.9686W) ID:USC00114823
    Ashley (46.0406N, 99.3742W) ID:USC00320382
    Tooele (40.5353N, 112.3217W) ID:USC00428771
    Lander Hunt Fld Ap (42.8153N, 108.7261W) ID:USW00024021
    Green River (41.5167N, 109.4703W) ID:USC00484065
    Kennebec (43.9072N, 99.8628W) ID:USC00394516
    Cooperstown (42.7167N, 74.9267W) ID:USC00301752
    Marshall (39.1342N, 93.2225W) ID:USW00013991
    Imperial (40.5208N, 101.655W) ID:USC00254110
    Milan 1 Nw (45.1219N, 95.9269W) ID:USC00215400
    Grundy Ctr (42.3647N, 92.7594W) ID:USC00133487
    Laramie Rgnl Ap (41.3119N, 105.6747W) ID:USW00024022
    Curtis 3Nne (40.6742N, 100.4936W) ID:USC00252100
    Laketown (41.8250N, 111.3208W) ID:USC00424856
    Springview (42.8222N, 99.7467W) ID:USC00258090
    Culbertson (40.2333N, 100.8292W) ID:USC00252065
    Deseret (39.2872N, 112.6519W) ID:USC00422101
    Lamoni (40.6233N, 93.9508W) ID:USC00134585
    Vestmannaeyjar (63.4000N, 20.2831W) ID:IC000004048
    Akureyri (65.6800N, 18.0794W) ID:IC000004063
    Maliye Karmakuly (72.3794N, 52.7300E) ID:RSM00020744
    Torshavn (62.0170N, 6.767W) ID:DAM00006011
    Oestersund (63.1831N, 14.4831E) ID:SWE00100026
    Karlstad (59.3500N, 13.4667E) ID:SW000024180
    Linkoeping (58.4000N, 15.5331E) ID:SW000008525
    Torungen Fyr (58.3831N, 8.7917E) ID:NO000001465
    Oksoey Fyr (58.0667N, 8.0506E) ID:NOE00105483
    Brockport (43.2000N, 77.9333W) ID:USC00300937
    Pana (39.3686N, 89.0867W) ID:USC00116579
    Susanville 2Sw (40.4167N, 120.6631W) ID:USC00048702
    Choteau (47.8206N, 112.1919W) ID:USC00241737
    North Platte Rgnl Ap (41.1214N, 100.6694W) ID:USW00024023
    Billings Wtp (45.7717N, 108.4811W) ID:USC00240802
    White Hall 1 E (39.4411N, 90.3789W) ID:USC00119241
    Helena Montana (46.7186N, 112.0017W) ID:USR0000MHEL
    Miles City F Wiley Fld (46.4267N, 105.8825W) ID:USW00024037
    Ipswich (45.4478N, 99.0383W) ID:USC00394206
    Wilbur (47.7681N, 118.7239W) ID:USC00459238
    Wamsutter (41.6717N, 107.9786W) ID:USC00489459
    Elko Rgnl Ap (40.8289N, 115.7886W) ID:USW00024121
    Cascade Locks (45.6778N, 121.8736W) ID:USC00351407
    Canon City (38.4600N, 105.2256W) ID:USC00051294
    Missoula Intl Ap (46.9208N, 114.0925W) ID:USW00024153
    Pipestone (44.0139N, 96.3258W) ID:USC00216565
    Ketchum Rs (43.6842N, 114.3603W) ID:USC00104845
    Ely Yelland Fld Ap (39.2953N, 114.8467W) ID:USW00023154
    Faulkton 1 Nw (45.0364N, 99.1342W) ID:USC00392927
    Albia 3 Nne (41.0656N, 92.7867W) ID:USC00130112
    Medford (45.1308N, 90.3439W) ID:USC00475255
    Minonk (40.9125N, 89.0339W) ID:USC00115712
    Chicago Midway Ap (41.7861N, 87.7522W) ID:USW00014819
    Crawfordsville 6 Se (40.0028N, 86.8011W) ID:USC00121873
    Clarinda (40.7244N, 95.0192W) ID:USC00131533
    Melilla (35.2778N, 2.9553W) ID:SP000060338
    Dublin Phoenix Park (53.3639N, 6.3192W) ID:EI000003969
    Hanty Mansijsk (61.0167N, 69.1167E) ID:RSM00023933
    Biser (58.5167N, 58.8500E) ID:RSM00028138
    Gyzylarbat (38.9800N, 56.2800E) ID:TX000038763
    Lahore City (31.5500N, 74.3330E) ID:PK000041640
    Hyderabad Airport (25.3830N, 68.4170E) ID:PKM00041764
    Mukteswar Kumaon (29.4667N, 79.6500E) ID:IN023420800

    • bdgwx says:

      Again…starting at the bottom of your list…Mukteswar Kumaon.

      From 1897-2020 the trend is +0.120C/decade +/- 0.012

      Not that it matters, but the R^2 on that one is 0.47 which means that station’s temperature trajectory was pretty straight with a smaller than usual variability and deviation from the trendline.

      And this was the very first station in your list that I checked.

      https://data.giss.nasa.gov/cgi-bin/gistemp/stdata_show_v4.cgi?id=IN023420800&ds=14&dt=1

      • CO2isLife says:

        bdgwx, once again, what is the relationnship we are trying to establish? CO2 slowly increases W/M^2 over time, and those whole show a continued increase over time. Not to identify spikes in temperatures, we are trying to identify trends. CO2 is claimed to “trap” heat, that means that if a temperature is the same or lower than a previous time period, CO2 did not “trap” any heat. Here is the link to the site you referenced.
        https://data.giss.nasa.gov/cgi-bin/gistemp/stdata_show_v4.cgi?id=IN023420800&dt=1&ds=15

        This does not represent an uptrend for these reasons:
        1) The lowest level is in 1995
        2) The current temperatures are within the range established between 1895 and 1995
        3) Only after 2000 do temperatures jump outide the established range…and it immediately drops back into the previous range
        4) 90% + of the temperatures fall within the range established between 1895 and 1995
        5) If you do your regression between 1895 and 1995, the slope will be negative (-), only when you included the outliers that occur after 1995 does the temperature increase
        6) CO2 can’t cause the sudden bump in temperatures post 1995, if they can, please explain why temperatures only increase post-1995 if CO2 is the cause? Why was there no warming between 1985 and 1995?

        Your own data shows that the R-Squared in 0.47, which is very low for science standards anyway, but to make my point, I removed the data post 1995, and this is exactly what you get: 0.00, literally 0.00, and that is copied exactly from my Excel Spreadsheet.

        Using the Slope function you get 0.000182911, in other words, 0.00, there in no relationship, between 1895 and 1995.

        100% of your case requires data between 1995 and 2020, data which by the end of the period is back into the normal range. In other words you rely on data outliers to make your case. That is junk science.

        • Ball4 says:

          “CO2 is claimed to “trap” heat, that means that if a temperature is the same or lower than a previous time period, CO2 did not “trap” any heat.”

          It is not a claim. Added ppm CO2 gas at room temperature trapped (a layman’s term) some heat in Prof. Tyndall’s apparatus (reported in 1861 about 5 degrees in temperature terms) until he closed the lab for the night & let the heat escape. Others have also shown CO2isLife how to trap some heat. In the instrumental and satellite period, some heat has been observed constantly trapped near Earth’s surface (about 33K in temperature terms).

          Apparently CO2isLife “will probably share the astonishment with which I witnessed the foregoing effects” – Prof. Tyndall 1861 who then related his result to Earth’s atmosphere in general. See also for more observational history:

          https://www.sciencedirect.com/science/article/pii/S0160932716300308

          Even Dr. Spencer has trapped some heat in temperature terms from added DWIR of icy cirrus clouds in a small container of outdoor ambient water at night time!.

          …explain why temperatures only increase post-1995 if CO2 is the cause?”

          CO2 is not the ONLY cause of global median temperature change in that period, there are at least 8 more causes reasonably well observed & tracked. In addition to those, naturally occurring ocean temperature cycles add more temperature change to the mix.

          The black line in Dr. Spencer’s top post just moved up a change amount consistent with added PPM CO2 between the two periods. The same consistency with added CO2 ppm as was observed as happened to the black line between 1938 and 1993. The blue and red lines represent weather changes in shorter time frames.

          • CO2isLife says:

            Apparently CO2isLife “will probably share the astonishment with which I witnessed the foregoing effects” – Prof. Tyndall 1861 who then related his result to Earth’s atmosphere in general. See also for more observational history:

            No one denies the GHG Effect. The GHG Effect for CO2 however is limited largely to 0.00 PPM to 300 PPM, afterwards is has very very little to contribute. The GHG Efffect gets saturated way before we reached 300 PPM.

            Simply look at the marginal impact of CO2 on the W/M^2, it shows a log decay.

            A single cloudy day can negate months if not years of W/M^2 attributed to CO2, and a single El Nino can wipe out years if not decades of W/M^2 attributed to CO2, and lastly, CO2 and 13 to 15 Micron LWIR won’t warm water.

          • bdgwx says:

            CO2isLife said: The GHG Efffect gets saturated way before we reached 300 PPM.

            No it doesn’t. See Myhre 1998 and make sure you read each of the citations in the reference list as well. https://tinyurl.com/1nby46ch

            CO2isLife said: Simply look at the marginal impact of CO2 on the W/M^2, it shows a log decay.

            From 280 to 410 it is 5.35 * ln(410/280) = +2.0 W/m^2

            From 410 to 560 it is 5.35 * ln(560/410) = +1.7 W/m^2

            From 560 to 1120 it is 5.35 * ln(1120/560) = +3.7 W/m^2

            CO2isLife said: CO2 and 13 to 15 Micron LWIR wont warm water.

            Yes it does. Water so greedily takes LWIR of all wavelengths including 13-17 um that it is almost entirely taken up right on the skin. Refer to Wong 2018 for details regarding the microphysics of how LWIR warms the oceans. https://tinyurl.com/5blefomb

          • Ball4 says:

            “a single El Nino can wipe out years if not decades of W/M^2 attributed to CO2”

            El Nino is an ocean surface temperature change from water currents independent of CO2 IR opacity which remains & is not wiped out, at all. El Nino cycles near surface temperatures while atm. CO2 IR opacity is consistent with CO2 ppm observed monotonic in the measurement period.

            Sure, all the non-CO2 temperature cycles/causes can synch up independently and cause the red/blue weather lines to go below the black climate line as shown & even in the near future while observationally the black climate line has consistently moved up in modern observational times.

            Paleo climate analytical estimates though show black line probably CAN move down in certain lengthy periods from various causes/cycles.

        • bdgwx says:

          Not to identify spikes in temperatures, we are trying to identify trends.

          Agreed. And you use Excel’s LINEST function to do this.

          CO2 is claimed to “trap” heat, that means that if a temperature is the same or lower than a previous time period, CO2 did not “trap” any heat.

          Right. But the test for that is to measure ALL heat in the climate system. This includes the hydrosphere, cryosphere, atmosphere, and land. Your test of only the atmosphere at only 2 meters and only at one site is insufficient to measure this trapped heat. See Schuckmann 2020 https://tinyurl.com/34pjx4hj for a measurement of this trapped heat and estimates for how it is distributed through the various heat reservoirs in the climate system.

          If you do your regression between 1895 and 1995, the slope will be negative (-), only when you included the outliers that occur after 1995 does the temperature increase

          From 1897 to 1995 the trend is +0.106C/decade +/- 0.015 with an R^2 of 0.33. Note that I am using the adjusted data for these calculations because I want to know the unbiased trend. I’m not interested in knowing the trend that is biased by station moves, time of observation effects, urban effects, instrumentation changes, etc.

          100% of your case requires data between 1995 and 2020, data which by the end of the period is back into the normal range. In other words you rely on data outliers to make your case.

          On the contrary I’m feeding ALL of the data into Excel’s LINEST function.

  94. Adelaida says:

    Bindidon,

    I think that in general we are or follow the forum to get to the truth about climate change fundamentally, and we also outline that search in other matters … And I hope we help each other without insulting each other! …

    It really is that seen outside who insults another of the forum loses credibility!
    Well, it seems that you lack arguments and reasoning to defend your thesis and it becomes exhausting to follow the comments. Also, insulting your opponent does not serve to convince him of anything but quite the opposite …

    Even so, I am very interested in all the interventions and I follow the comments of the forum as much as I can.

    • Bindidon says:

      Adelaida

      ” Also, insulting your opponent does not serve to convince him of anything but quite the opposite… ”

      Sorry, but when you write that, it seems to me that you can’t have followed the insulting I have been here since years the target.

      Where nobody insults me, there is no need for me to insult back.

      And ABOVE ALL, Adelaida, I do not accept that dumb Ignoramusses feel free to insult historically relevant persons jsut because no moderation occurs on the blog.

      J.-P. D.

  95. tonyM says:

    Bindidon
    You say:
    “Their reconstruction was based on a proxy
    And… what was that proxy? OMG. ”

    The Conolly et al 2017 paper says:

    “.. we develop a new estimate of Arctic sea ice extent trends for the period, 1901–2015. was constructed by individually re-calibrating sea ice data sources from the three Arctic regions (North American, Nordic and Siberian) using the corresponding surface air temperature trends for the pre-satellite era (1901–1978), ”

    You claim that the DMI is a far better “proxy.”

    DMI is covered in some depth including the dependent “Walsh” dataset and dependent Hadley data. DMI data is actually quite sparse (incl problems with Russian ice) but has certainly been used for the areas it covered!! It is incomplete! So how could it be a better substitute when their their work includes a lot of extra actual data.

    The same applies to the Walsh dataset

    They issue this caveat re satellite:

    “However, because the Alekseev et al. (2016) reconstruction is essentially an inverse Arctic summer temperature index, it cannot be used for studying the relationship between Arctic sea ice extent and surface air temperatures outside the satellite era (as that would lead to circular logic).

     For this reason, the satellite-derived estimates of total and regional sea ice extents are probably more consistent and reliable than those from the pre-satellite era, which were derived from spatially incomplete and intermittent observations. ”

    Further snipits:
    ” As a result, for the pre-satellite era, the American-based Walsh group had very few observations for the Russian Arctic, and in their dataset most of the estimates for these regions were based on (often crude) extrapolations and inferences.
     
    …and the Hadley Centre’s HadISST dataset (see Section 3.5), which is based on the Walsh dataset. Version 1 of the Walsh dataset was one of our main sources for pre-satellite ice extents,

    … Up until 1953, the spring and summer estimates in the Walsh dataset are predominantly based on Arctic sea ice charts compiled by the Danish Meteorological Institute (DMI)

    So, in this paper, we will combine the Russian dataset with the western datasets, to provide a new pan-Arctic estimate for the pre-satellite era.

    … we take an intermediate approach which preserves useful information provided by the pre-satellite era Arctic sea ice datasets, but also uses information from Arctic surface air temperature trends to reduce the problems arising from changes in data sources.

    …..we used these relationships to convert our regional and seasonal temperature reconstructions into proxies for the corresponding sea ice extents. However, these sea ice extent proxies do not contain any of the information from the actual pre-satellite era sea ice observations. So, unlike Alekseev et al. (2016), we only used these proxies as an additional dataset for recalibrating the pre-satellite era datasets, or when direct observations are unavailable. ”

    Perhaps you should read the paper in full. There is a lot more thought, coverage, inclusion and reliance on other references than you wish to make out. This is hardly a simple proxy reconstruction of the past as you suggested but a more comprehensive integration of all existing data which was not very complete. DMI is only one component and has its own limitations.

    • Bindidon says:

      tonyM

      1. I have read the paper.

      2. You perfectly know what I mean, namely that if anybody outside of the ‘Skeptic’ corner had done the same job, you would have seen the reaction at WUWT.

      That’s all, there was no need to write so many lines about it.

      J.-P. D.

      • tonyM says:

        Bindidon
        You say:
        “You perfectly know what I mean..”

        I only know what you stated not what you wish to assert that I “perfectly know.” You were critical of their re-calibration claiming:
        “And… what was that proxy? OMG.
        It was… the inverse of the Arctic temperature!”

        You then doubled down by stating:
        “A far better proxy would be the sequence of observations collected by DMI since 1900,  …”

        Had you clearly recalled the content of the Connolly paper you could never make such a silly claim for the DMI data had severe spatial and temporal limitations clearly discussed at length in the paper. I asked you to tell me why you thought you were right but you choose to ignore that question.

        I am aware that English is not your first language but you cannot write as you have and expect people to read what may be in your mind

  96. What must not be forgotten is until year 2005 Natural Climatic factors including solar all were in a warming mode, going back over a 100 years.

    The inflection point was year 2005, now 16 years later we are still warming which leads to the question are Natural Climatic factors going to be dominant as we move forward and the only reason why this has not been the case thus far is due to lag times?

    I honestly do not know the answer yet but I think the answer one way or the other will be known in the not to distant future.

    I still think lag times have not been fully appreciated. The oceans are vast and do not respond quickly it can take several years.

    Only time will tell but I will admit as each year goes by with continued warming it makes Natural Climatic factors not look very strong in the determination of the climate, but then again the climate has been shown to turn on a time even during the Holocene period of time.

    • ren says:

      Perhaps in a few days the Thames will start to freeze?

    • Entropic man says:

      If you put a saucepan of water on a job set to 1) it might settle at 40C. Increase the incoming energy by increasing the setting to 2) and it might settle to 60C. Not instantly, but after ten minutes or so.That is lag.

      Similarly the temperature of the surface layers of the ocean take time to increase after the incoming energy increases.

      How big is the lag? The shortest estimate I’ve seen is 15 years.

      I once used my favourite CO2 forcing equation to calculate the expected temperature curve with no lag. I plotted my expected temperatures onto a printout graph of the observed temperature curve and compared them.

      The observed temperatures lagged 25 years behind the no-lag expected temperatures.

      This means that todays temperature reflects the full warming effect of the 360ppm CO2 level in the mid-1990s. The full effect of today’s 411ppm CO2 won’t show until 2045.

  97. dp says:

    In the news today – the Earth warmed because of cleaner air caused by the pandemic-induced lockdown. This seems speculative, and suggests clean air is a positive feedback the more people die the cleaner the air gets. Or somebody is wrong about the warming or its cause.

    • Entropic man says:

      Lockdown reduces activity, from transport to industry.

      CO2_emissions were down 15% in 2020 and particulates probably reduced by a similar amount.

      Fewer particulates, less reflection of visible light to space.

      Less reflection, more energy reaching the surface.

      More energy reaching the ground, warmer temperatures.

      He careful not to confuse correlation and causation. Clearer air and more deaths are both directly or indirectly caused by the presence of Covid-19, but more deaths did not cause clearer air.

      • dp says:

        Population control is bandied about by the alarmists as a necessity to saving the planet, not that any of them are willing to go first.

        • Entropic man says:

          Biologists like myself are familiar with the concept of overshoot and it’s ecological consequences.

          “https://en.m.wikipedia.org/wiki/Overshoot_(population) ”

          The planet will survive whatever we do to it, but our civilization will probably not and our species might not.

          • Entropic man says:

            To paraphrase Bill Bryson.

            70% of the planet is water. Of the remaining 30%, half is too hot, cold, wet, dry, steep or lofty to live on.

            If you divide the remaining land by the current population you get about 1.25 football pitches per person for all purposes.

            I would be interested to hear your estimate of how many people per football pitch the Earth can support, how long it can do it for and what measures you would suggest to stop us overwhelming that carrying capacity.

          • Clint R says:

            Ent, according to such nonsense the planet was supposed to be without oil and food by now.

            But, be as scared as you want.

  98. CO2isLife says:

    I’m sorry, did I miss the answer to this question? I’ve published 175 Stations that show no uptrend in temperatures.
    http://www.drroyspencer.com/2021/02/uah-global-temperature-update-for-january-2021-0-12-deg-c-new-base-period/#comment-609730

    Has someone explained why these stations are showing no warming even though CO2 has increased from 300 to 415 PPM?

    People keep posting distractions like meaningless trend coefficients when the R-Sqr makes them meaningless. Facts are there are plenty of stations that show no warming, and some even show clear downtrends in temperatures. How is that possible? Those stations are chosen from all contents where they were available.

    Once again, why are these sites not showing no warming? More importantly, none show dramatic Dog-Legs that start in 1902 like the Hockeystick. None.

    • bdgwx says:

      CO2isLife said: Has someone explained why these stations are showing no warming even though CO2 has increased from 300 to 415 PPM?

      First…of the stations I randomly selected ALL showed statistically significant warming trends.

      Second…we’ve already explain to you multiple times why there is some much variation in the temperature values on small spatial and temporal scales. What specifically are you not understanding?

      CO2isLife said: People keep posting distractions like meaningless trend coefficients when the R-Sqr makes them meaningless.

      These trends are meaningful. They are statistically significant. And I’ve already explained to you the difference between the R^2 metric and trend uncertainty metric. R^2 is a measure of the variance between the linear regression value and the actual value. The higher the variance the lower the R^2. That is NOT to be conflated with the standard error on the slope of the trend itself. That is a different metric.

      For example…Mukteswar Kumaon has a trend from 1897-2020 of +0.120C/decade +/- 0.012. That means with confidence we can eliminate trends lower than +0.108C/decade. The R^2 of 0.47 tells us that only a portion of the variance in the actual values can be explained by the regression values. It in no way takes away from the fact that +0.108C/decade is the lower bound on the trend.

      • Entropic man says:

        CO2isLife

        You are entirely correct that we are cooling, rather than warming.

        http://www.drroyspencer.com/wp-content/uploads/UAH_LT_1979_thru_January_2021_v6.jpg

        The temperature has cooled from anomaly 0.62C in January 2016 to 0.12C in January 2020. -0.5C in four years, a cooling rate of 0.125C/year.

        We will be back at 1880 temperatures in nine years and into the next glacial period in forty years.

      • CO2isLife says:

        bdgwx:

        “First…of the stations I randomly selected ALL showed statistically significant warming trends.”

        1) Please define Staristically Significant Trend. If you have a trend calculated off a regression with an R-Sqr of 0.00, a statically significant coefficient is meaningless. If you have a “trend” defined by LINEST, and temperatures within the past 10 years are below the level set in 1880, then you don’t have an uptrend. No matter how much you want to believe it, you don’t have an uptrend.

        2) If temperatures in the last 10 years are below the levels set in the early period of the 1900s, do you consider that an uptrend. If you do, you are simply wrong.

        “Second…we’ve already explain to you multiple times why there is some much variation in the temperature values on small spatial and temporal scales. What specifically are you not understanding?

        1) Using your analysis and this statement, how are you deriving what warming is due to CO2 and what warming is due to natural factors?

        2) How is CO2 and its small marginal continually increasing contribution to W/M^2 responsible for such high variation in temperatures?

        3) How do you know that the warming isn’t due to natural variation and not related to CO2?

        “These trends are meaningful. They are statistically significant. And I’ve already explained to you the difference between the R^2 metric and trend uncertainty metric. R^2 is a measure of the variance between the linear regression value and the actual value. The higher the variance the lower the R^2. That is NOT to be conflated with the standard error on the slope of the trend itself. That is a different metric.”

        1) Your analysis it totally dependent upon the outilers
        2) OK, you have a statistically significant coefficient, what evidence do you have that it is due to CO2?
        3) What % of that variation is due to CO2? Certainly 0.00% of any doentrend, or can adding W/M^2 to a system magically cause it to cool?
        4) Let me run the regression. What chart are you referring to? I’m pretty sure that if I eliminate the end point outliers they will show 0.00 warming.
        5) Your analysis is totally dependent upon the selected time period, and I will demonstrate that if we ran your analysis 10 years ago, you would get the opposite outome. CO2 can’t cause the recent spikes. You are dependent upon recent spikes in temperatures, something that can’t be attributed to CO2, to make your case.

        For example…Mukteswar Kumaon has a trend from 1897-2020 of +0.120C/decade +/- 0.012. That means with confidence we can eliminate trends lower than +0.108C/decade. The R^2 of 0.47 tells us that only a portion of the variance in the actual values can be explained by the regression values. It in no way takes away from the fact that +0.108C/decade is the lower bound on the trend.

        1) That is nonsense, and I’ll demonstrate it.
        2) If something stays in a range over 140 years, and occasionally pokes out the top or bottom of that range, only to fall back into it, you can’t claim that something that continually adds W/M^2 to the system could be the cause of the warming. Evidence of warming isn’t evidence CO2 is causing that warming.

        • Entropic man says:

          “Please define Staristically Significant Trend.”

          I presume you already know, but for the benefit of the lurkers:-

          All temperature averages are sample means, the average of a number of measurements.

          Call each measurement X, the mean Xbar and the number of measurements or samples n.

          Xbar = sumX/n

          Individual samples spread above or below the mean. The amount of spread is called the standard deviation SD.

          SD = sum (X-Xbar)^2 / n

          (Note-there are several equivalent ways to calculate SD. This is the formula I was taught in school)

          About half the samples are less than 1SD from the mean and 95% of them closer than 2SD.

          When discussing uncertainty, it is customary to quote the mean +/- 2SD, known as the 95% confidence limits.

          There is a 95% chance that the mean of whatever you were sampling is between those limits.

          For temperature averages the SD is usually below 0.05C and 95% confidence limits less than +/-0.1C.

          Are two means different? There will be small differences due to random chance, or larger differences due to some cause.

          There are various tests, but one of the simplest ways to decide if two means are similar or different is to calculate the difference between them measured in SDs. If the difference is less than 4SDs, there is a real chance that any difference is due to chance.If the difference is greater than 4SD (ie the 95% confidence limits do not overlap) then the probability that the difference is due to some cause is greater than 95%.

          This is a Statistically Significant difference.

          As a rule of thumb, if two temperature averages are more than 0.2C apart, there is probably a real difference between them.

          • Tim Folkerts says:

            “SD = sum (X-Xbar)^2 / n”
            Actually, that is the SD squared. I assume you simply left that off accidentally.

            “There is a 95% chance that the mean of whatever you were sampling is between those limits.”
            There is a 95% chance that a new data point would fall within that range (making a few basic assumptions).
            The uncertainty of the the mean is actually much smaller — by a factor of 1/n^0.5.
            https://en.wikipedia.org/wiki/Standard_error

            With enough data, two distributions that overlap greatly can still be told apart. For example, one distribution could be a normal distribution with mean = 0 and SD = 1. The other could be SD = 0.1 and SD = 1. If you pick 100 from each distribution, you would not be able to tell which was which, because the uncertainty of the means would be +/- 1/(100^0.5) = 0.1. But if you draw 10000 from each, the uncertainty of each mean is only 1/(10000^0.5) = 0.01. Now the difference is quite clear.

            Uncertainties of slopes ALSO depend on the number of points. If R^2 = 0.47 and you only have 10 points, you would have a huge uncertainly in the slope. If R^2 = 0.47 and you have 1000 points, you would have a a MUCH smaller uncertainty in the slope.

          • bdgwx says:

            If R^2 = 0.47 and you only have 10 points, you would have a huge uncertainly in the slope. If R^2 = 0.47 and you have 1000 points, you would have a a MUCH smaller uncertainty in the slope.

            +1.

          • Entropic man says:

            Senility beckons. I forgot the square root sign. Rueful smile emoji.

        • bdgwx says:

          Set 1…

          1) A statistically significant trend is one in which the standard error of the slope is less than the slope itself. +0.120C/decade +/- 0.012 is statistically significant because 0.012 is way smaller than 0.120. In fact, it is 10x smaller. We know that the trend is at least +0.096C/decade with 97.9% confidence.

          2) It depends on the entirety of the data. If the slope (b) minus the standard error (s) is greater than 0 such that s-b > 0 than we say the entirety of the data has a positive trend with statistical significance regardless of the trends of any of the subsets of that data. In fact, you can even have several of the subsets with negative trends even though the entirety of the data has a positive trend. This is known as Simpson’s Paradox. Anyway, the point is that a set of data has a trend defined by the linear regression analysis. It is completely objective approach.

          Set 2…

          1) I’m not trying to here. First…I wouldn’t attempt this from a single station alone. Second…even with global mean temperature data you must removed the contribution to the trend from non-CO2 sources. The difference between the non-CO2 trend and the actual trend is the CO2 contribution. That is very difficult analysis to do.

          2) It’s not responsible for the variability.

          3) On a global scale scientists identify and quantify all forcing agents. The net effect of the natural component is for a slight cooling trend.

          Set 3…

          1. No it isn’t. The analysis uses ALL data. I literally plugin ALL values into Excel’s LINEST function.

          2. I have no evidence to present for or against the linear regression trend on a single site.

          3. I don’t know what % of the variability of annual mean temperatures at a single site are due to CO2. I will say that it is likely VERY low.

          4. Download the CSV file from the GISTEMP station data page. The link is underneath the graph.

          5. No it isn’t. The analysis uses ALL data. I literally plugin ALL values into Excel’s LINEST function.

          Set 4…

          1. You are more than welcome to double check my work. Download the CSV file and enter =LINEST(R2:RXXX,,true,true) into a 3×2 matrix of cells. R1C1 is the slope, R2C1 is the standard error, and R3C1 is the R^2 value.

          2. No one is claiming that CO2 can explain the temperature variability at select sites. The only thing being claimed is that CO2 creates a positive slope on the linear regression trend on global mean temperatures as measured over long periods of time.

      • barry says:

        bdgwx has provided the trends plus the uncertainties for a few of the stations you say show no warming trend. The work has been done. These stations show statistically significant warming trends.

        From where I’m sitting it looks like your eyes must glaze over each time bdgwx presents these trends with their statistical significane to you.

  99. Stephen Paul Anderson says:

    Robert E. Lee, owner of hundreds of slaves. Lee was smart enough to know he couldn’t say… I’m joining Virginia because I support slavery… Like most Confederates, it was about state’s rights. Balderdash.

  100. Adelaida says:

    Bindidon,

    Sorry if I have bothered you because it was not my intention. When one insults, he loses the ability to reason with the other and it is a shame.

    I say it in general. Hopefully whoever has this habit will realize and change …

    And thank God it’s not all the time or all of it !!

  101. Adelaida says:

    Barry And everyone,

    I have done a search in Google scholar, putting “coronavirus vaccine ADE Risk” year 2021, and these two publications have seemed particularly interesting:

    ADE: Antibody-dependent enhancement
    It is a mechanism of exacerbation of inflammatory symptoms that could occur after reinfection with the coronavirus.

    https://www.sciencedirect.com/science/article/pii/S2667325821000200
    “Since the COVID-19 pandemic emerged and spread on a large scale, scientists around the world continue to engage relentless efforts to develop SARS-CoV-2 vaccines, including spike-based DNA/RNA vaccines, inactivated virus vaccines, live attenuated virus vaccines, recombinant viral-vectored vaccines, and protein subunit vaccines. Vaccine design considerations include the selection of antigens, vaccine platforms, and vaccination routes and regimens. The main purpose of developing a SARS-CoV-2 vaccine is to generate a sustained memory humoral immune response and to produce specific NAbs to prevent the entry of SARS-CoV-2 into host cells. We propose that vaccines designed to elicit specific NAbs will be effective in preventing SARS-CoV-2 infections.

    The potential risk of vaccine-induced ADE cannot be ignored in the course of vaccine development and use. Regarding SARS-CoV, MERS-CoV, and dengue virus infection, it has been found that the presence of sub-neutralizing or cross-reactive non-NAbs has a theoretical potential to enhance infection and to trigger harmful immuno-pathology. Considering these cases, anti-SARS-CoV-2-specific antibodies may fail to protect the body and, instead, exacerbate the disease severity. Although there is no proof available on the occurrence of ADE in SARS-CoV-2 infection, it should be considered a general concern for formulating antibody therapy strategies for SARS-CoV-2 vaccine development.”

    https://scholar.google.es/scholar?as_ylo=2021&q=+coronavirus+vaccine++ADE+risk&hl=es&as_sdt=0,5#d=gs_qabs&u=%23p%3D_a4r4a-0qLUJ
    “mRNA based and adenovirus vectored vaccines, types of nucleic acid-based vaccination, were first ever or first commercially ever approved for the public, respectively. However, these new types possess a potential risk to induce auto-immune diseases more possibly in the short yet potentially the long term as well. On the other hand, all SARS CoV-2 types of vaccines, depending on the spike protein, including the conventional ones might increase the likelihood of COVID-19 severity upon re-infection through antibody dependent enhancement. Thus, a moral, legal, and constitutional public right to know and decide basing on a personalized risk benefit ratio must be secured. In this manuscript, we analyze the theoretical autoimmunity potential of SARS CoV-2 adenovirus vectored vaccines, after we have previously discussed the same potential for mRNA-based ones. Further, we explore the vulnerable groups of vaccines recipients who are generally more liable to develop autoimmune diseases and how might these groups modify the risk if decided to receive the vaccines.”

    • Bindidon says:

      Adelaida

      ” Thus, a moral, legal, and constitutional public right to know and decide basing on a personalized risk benefit ratio must be secured. ”

      *
      Germany has sent to Portugal, on their demand, personnel and devices to help this country in its fight against SARS-COV-2:

      ” The Air Force Airbus A400M with 26 soldiers from the German Armed Forces and several dozen ventilators and infusion devices from Germany landed at the Figo Maduro military airport in Lisbon on Wednesday afternoon. ”

      The Germans do that each year since decades for the seasonal flu, don’t they?

      J.-P. D.

    • Entropic man says:

      I read the preprint.

      https://osf.io/s8c2e/

      “Thus, a moral, legal, and constitutional public right to know and decide basing on a personalized risk benefit ratio must be secured.”

      There is nothing in the paper to quantify the risk.

      One in ten?

      One in 100?

      One in 1000?

      One in 1 million?

      One in 1 billion?

      Having some slight acquaintance with these issues, I would expect the proportion of autoimmunity cases to be in the one in 10,000 to one in 100,000 range. The probability of dying of Covid is 0.1% to 1%.

      People are very poor at making risk/benefit calculations. Without clear numbers, all that publicising this paper would achieve would be to put people off the vaccine.

      The result would be to lose more people from lack of vaccination than you would save from autoimmunity.

      Perhaps better to leave this piece of alarmist speculation in obscurity.

  102. Adelaida says:

    Bindidon,

    What I have posted about vaccines is for you and everyone in the forum.

    If you can wait to get the vaccine, wait. Right now and in the coming months, whoever receives the vaccine is still a guinea pig …

    Also, you will not get rid of continuing to carry out all the security measures that we have carried out so far …

    So it seems that It is better not to run to get the vaccine and instead continue to take care of ourselves as best as possible attentive to the evolution of the pandemic …

  103. Bindidon says:

    For commenters interested in temperature time series processing

    Take it please as it is: as what Frogs love to name “un petit exercice de style dominical”.

    *
    A few days ago, Roy Spencer’s monthly LT report was, as is usual, reblogged at WUWT.

    And as happened some times already, there was a restart of a recurring discussion concerning the accuracy of 30 years long reference periods.

    The argument is always the same: when you compute anomalies wrt the mean of 30 years, you have at best 50% of the AMO, what for WUWT aficionados automatically invalidates the resulting time series.

    No wonder: AMO is at WUWT something like a sacrosanct institution.

    A typical reaction:

    With a 60 year base line none of their claims are true.

    (The commenter very probably had AGW or any similar warming in mind.)

    *
    But these claims unfortunately are not correct.

    Years ago I compared anomalies out of a source (GHCN V3): wrt a 30 year period versus those wrt a 100 year period as done by NOAA.

    The differences existed, but were by no means a high as some would have expected.

    Today I thus eliminated possible sources for potential discrepancies, by
    – using GHCN daily instead (over 40000 stations worldwide instead of 7280)
    – restricting the comparison to a subset of stations with at least 105 years of activity; there were a bit over 2500.

    Here is the comparison of anomaly time series out of these stations’ data
    – wrt 1981-2010 as usual
    and
    – wrt 1951-2010, thus encompassing now 60 years, i.e. a full cycle of the (detrended!) AMO.

    1. Comparison of original results

    https://drive.google.com/file/d/1IH1m1unvpo8Cu4TKq5GE5lE2AIskRpKP/view

    Sure you know such pictures from experiences with WordForTrees: that happens each time you compare UAH with e.g. GISS

    https://www.woodfortrees.org/graph/uah6/plot/gistemp/from:1979

    without knowing/thinking that anomalies wrt 1981-2010 can’t be compared with anomalies wrt 1951-1980.

    BUT: coming back to the GHCN daily example, you already will imagine, due to the displacement’s regularity, that the trends for the two time series can’t be so very different.

    Trends in C / decade for 1880-2020
    – 1951-2010: 0.12
    – 1981-2010: 0.12

    .. for 1979-2020
    – 1951-2010: 0.12
    – 1981-2010: 0.12

    Yes: you’ve to go down to 3 places after the decimal point to see a difference.

    *
    2. Comparison with the anomalies wrt 1951-2010 displaced by the anomaly offset wrt 1981-2010

    https://drive.google.com/file/d/1-M5WoZikeua8ouP1QpthxJLmgGbtOKcM/view

    Now you see it really: the difference is minimal, 0.02 C on average for the deviations in either direction.

    *
    3. Finally, I recalled having been attacked when presenting, e.g. through use of WFT, comparisons of time series generated out of different reference periods. That would be wrong!

    So, why not do a more elaborate comparison, by displacing the time series on a monthly basis, instead of displacing it by the 360 month average?

    https://drive.google.com/file/d/18tRMTvOYMglBpmRQI-m-iTL6neciIY8i/view

    Yeah. When switching between the two graphs, we can see some very tiny difference, there is a bit less red in the chart, he he.

    But to see a difference in the trends, we must go down to the fourth place after the decimal point.

    *
    Conclusions:

    – the claim that a 30 year baseline is not sufficient for valuable anomaly generation, is really insubstantial;

    – the claim that a trivial displacing anomalies by the average over a reference period would lead to wrong results, is insubstantial too.

    Thus, if you know that the GISS anomaly displacement for the period 1981-2010 is -0.423, feel free to use it.

    But that of course won’t you get rid of the difference between the two, even wrt the dame reference period.

    J.-P. D.

  104. CO2isLife says:

    bdgwx says:

    For exampleMukteswar Kumaon has a trend from 1897-2020 of +0.120C/decade +/- 0.012. That means with confidence we can eliminate trends lower than +0.108C/decade. The R^2 of 0.47 tells us that only a portion of the variance in the actual values can be explained by the regression values. It in no way takes away from the fact that +0.108C/decade is the lower bound on the trend.

    Mukteswar Kumaon (29.4667N, 79.6500E) ID:IN023420800
    https://data.giss.nasa.gov/cgi-bin/gistemp/stdata_show_v4.cgi?id=IN023420800&dt=1&ds=15

    1) I encourage everyone to look at the stations I posted, and look at the one bdgwx selected. It is the outlier of all outliers and I hesitated selecting it because I was afraid it would trigger the exact conversation bdgwx is generating.
    2) SImply look at the chart, my initial thought was an instrument error because after a gap in the data temperatures step up to a new range. CO2 can’t cause temperatures jumping from 12 to 15.5 in a year or 2. That is my point. bdgwx identifies a chart where an outlier is clearly what drives his statistics. In other words, jusnk science. A real scientist would have an answer as to how CO2 causes temps to increase from 12 to 15.5 in one or two years. bdgwx won’t even attempt to explain that. If he can’t explain that, he can’t explain why his regression stats are meaningful.
    3) The lowest temperature level is set in 1995, yet bdgwx claims there is an uptrend. How can CO2 possibly be causing a warming trend when it continually adds W/M^2? What physics support that claim? None.
    4) The upper range set in 1905 is rarely broken for 100 years, and current temperatures are below the level set in 1905
    5) 90%+ of the data is below the level set in 1905, eliminate the outliers set post 1995 and you are likely up near 99%.

    If you consider that an “uptrend” you have no idea what an uptrend is. Once again, show me a continuous string of higher highs and higher lows for the entirely of the period. That is what CO2 would do.

    This is what an UpTrend looks like: There is no confusion.
    Madrid Cuatrovientos (40.3778N, 3.7892W) ID:SPE00120287
    https://data.giss.nasa.gov/cgi-bin/gistemp/stdata_show_v4.cgi?id=SPE00120287&dt=1&ds=15

    Buenos Aires Observ (34.583S, 58.483W) ID:AR000875850
    https://data.giss.nasa.gov/cgi-bin/gistemp/stdata_show_v4.cgi?id=AR000875850&ds=14&dt=1

    Ekaterinburg (56.8331N, 60.6331E) ID:RSM00028440
    https://data.giss.nasa.gov/cgi-bin/gistemp/stdata_show_v4.cgi?id=RSM00028440&dt=1&ds=15

    Innsbruck (47.2667N, 11.4000E) ID:AU000011801
    https://data.giss.nasa.gov/cgi-bin/gistemp/stdata_show_v4.cgi?id=AU000011801&dt=1&ds=15

  105. CO2isLife says:

    This is what an UpTrend Looks Like. It is due to building a huge number of building, roads, and other heat absorbing structures. It has nothing to do with CO2.

    Honolulu Intl Ap (21.3239N, 157.9294W) ID:USW00022521
    https://data.giss.nasa.gov/cgi-bin/gistemp/stdata_show_v4.cgi?id=USW00022521&dt=1&ds=15

    How do I know that warming isn’t due to CO2? Because if you go right next door, away from the Airport to Waialua, you get no warming.
    Waialua 847 (21.5750N, 158.1203W) ID:USC00519195
    https://data.giss.nasa.gov/cgi-bin/gistemp/stdata_show_v4.cgi?id=USC00519195&ds=15&dt=1

    How can two stations very close to each other, exposed to identical CO2 have such dramatically different temperatures trends? Simple, CO2 isn’t causing the warming.

    Here are two other sites to review:

    La Estanzuela Eele (34.45S, 57.85W) ID:UY000086562 https://data.giss.nasa.gov/cgi-bin/gistemp/stdata_show_v4.cgi?id=UY000086562&ds=14&dt=1

    Buenos Aires Observ (34.583S, 58.483W) ID:AR000875850 https://data.giss.nasa.gov/cgi-bin/gistemp/stdata_show_v4.cgi?id=AR000875850&ds=14&dt=1

    How can CO2 cause warming in one location but not the other? Answer? It can’t.

  106. Bindidon says:

    Why do people religiously believe that there can be any valuable relation between
    – surface temperatures, be it at land or on sea
    and
    – CO2’s effect or its contrary?

    How is it possible to make such trivial assumptions?

    Reminds me ‘race horse’, ‘ball-on-a-string’, ‘merry-go-round’, ‘two-coins’ and the like.

    J.-P. D.

  107. Entropic man says:

    For a time series like UAH a significant warming trend would be expected to produce a difference of at least 0.2C between the beginning and the end.

    UAH is noisy. To simplify the calculation you can use linear regression to smooth the graph to a straight line and compare the ends of the line.

    https://www.woodfortrees.org/plot/uah6/from:1978/to:2021/every/plot/uah6/from:1978/to:2021/every/trend

    As you see, the end of the green linear trend line is about 0.6C warmer than the start, well above the 0.2C threshold.

    • Entropic man says:

      Curses.
      This was a continuation of my response to CO2isLife’s February 7th 4.01pm post, discussing statistical significance.

      It is still apposite. CO2is Life keeps publishing station data and claiming that they show no significant warming. Unfortunately he includes no statistical support for his claims.

      • Bindidon says:

        Entropic man

        ” Unfortunately he includes no statistical support for his claims. ”

        I generated yesterday a time series of the average of all these staions, and of course there was no trend.

        No wonder: the absence of any trend was the primary criterion for CO2isLife’s station selection.

        *
        But… that is not the problem.

        The problem is: what does a list of weather stations whose data doesn’t show a trend have to do with CO2’s activity?

        NOTHING.

        CO2’s activity starts above the tropopause, where water vapor’s activity begins to end, because it is a condensing gas.

        J.-P. D.

        • Entropic man says:

          “No wonder: the absence of any trend was the primary criterion for CO2isLifes station selection. ”

          Always a problem with cherrypicked data.

          CO2isLife is fixated on the straw man that CO2 is the only variable affecting surface temperature.

          I don’t know what he’d make of Northern Ireland. The growing season is getting longer as shown by my gardener, who cut a customer’s lawn in December 2019 for the first time in 20 years of invoices. The Castlederg station 18 miles from my home recorded a new NI record low of -18C in 2010.

          We’re simultaneously being affected by global warming and a weakening Gulf Stream. The result is a small change in annual average, but warmer Summers and cooler, more variable Winters.

          • CO2isLife says:

            “CO2isLife is fixated on the straw man that CO2 is the only variable affecting surface temperature.”

            I’m fixated? This entire field of based upon proving CO2 is the cause. That is the only way to justify totalitarian socialist control of society and a crippling Carbon Tax. If CO2 isn’t the cause and everything is due to natural causes, why the key focus by everyone? There is nothing that can be done about it.

            EY Man: I dont know what hed make of Northern Ireland. The growing season is getting longer as shown by my gardener, who cut a customers lawn in December 2019 for the first time in 20 years of invoices. The Castlederg station 18 miles from my home recorded a new NI record low of -18C in 2010.

            Simple, the same thing happened during the Roman Warming Period. Vikings inhabited Greenland. Troy, and ancient coastal city is now miles inland, so is Thermolyle. Just look at the Carthage Harbor. Hanibal crossed the ALps with Elephants.

            Facts are, things were much much warmer during the Holocene, and there are far more archilogical evidence of a warmer Holocene than the one example you gave.

          • bdgwx says:

            CO2isLife said: Im fixated?

            Yes. The vast majority of your posts contain claims that CO2 is the only thing that determines temperatures changes at specific locations.

            CO2isLife said: This entire field of based upon proving CO2 is the cause.

            False. This statement tells me you do not yet understand which hypothesis are support by the field and which ones have been long ago rejected.

          • Ball4 says:

            “This entire field of based upon proving CO2 is the cause.”

            Good points bdgwx 8:22am. In the field of climate studies “the cause” is meant the predominate cause of the black climate line moving up from just the earlier period. CO2isLife is looking for CO2 to be the cause of the meandering of the red/blue weather lines in the top post which have many causes/cycles including atm. opacity changes.

            This is a climate blog not so much a weather blog so to contribute CO2isLife should concentrate on finding processes meaningful & useful causing the black climate line to rise from the earlier period. Concentrating on red/blue line weather meanderings is not especially meaningful or useful on a climate blog but comments related to such weather have proved entertaining around here and do motivate some enlightening experiments & posts by Dr. Spencer.

        • CO2isLife says:

          Bindidion Says: I generated yesterday a time series of the average of all these staions, and of course there was no trend.

          No wonder: the absence of any trend was the primary criterion for CO2isLifes station selection.

          Wrong, first, regressions aren’t the appropriate way to determine a trend of a data set with such voliotiliy. The Chart you referenced had the lowest temperature in 1995, and the data started back near 1900. How could CO2 cause a low temperature in 1995 when CO2 is 30% higher?

          Do your regression between 1880 and 1995 of that exact same data set and you get the complete opposite conclusion.

          I’ve published links to charts that show a true uptrend, and you complete ignore them.

          Buenos Aires Observ (34.583S, 58.483W) ID:AR000875850 https://data.giss.nasa.gov/cgi-bin/gistemp/stdata_show_v4.cgi?id=AR000875850&ds=14&dt=1