An unusually warm and dry spring has led to widespread wildfire activity in Alaska, with over 260 wildfires now reported and evacuations (some by boat) in progress. Fire crews are currently working only about 15% (three dozen) of those fires.
The NASA MODIS satellite imagery from yesterday shows the infrared satellite-indicated locations of fires, with pale blue smoke covering nearly half the state (click image for full size):

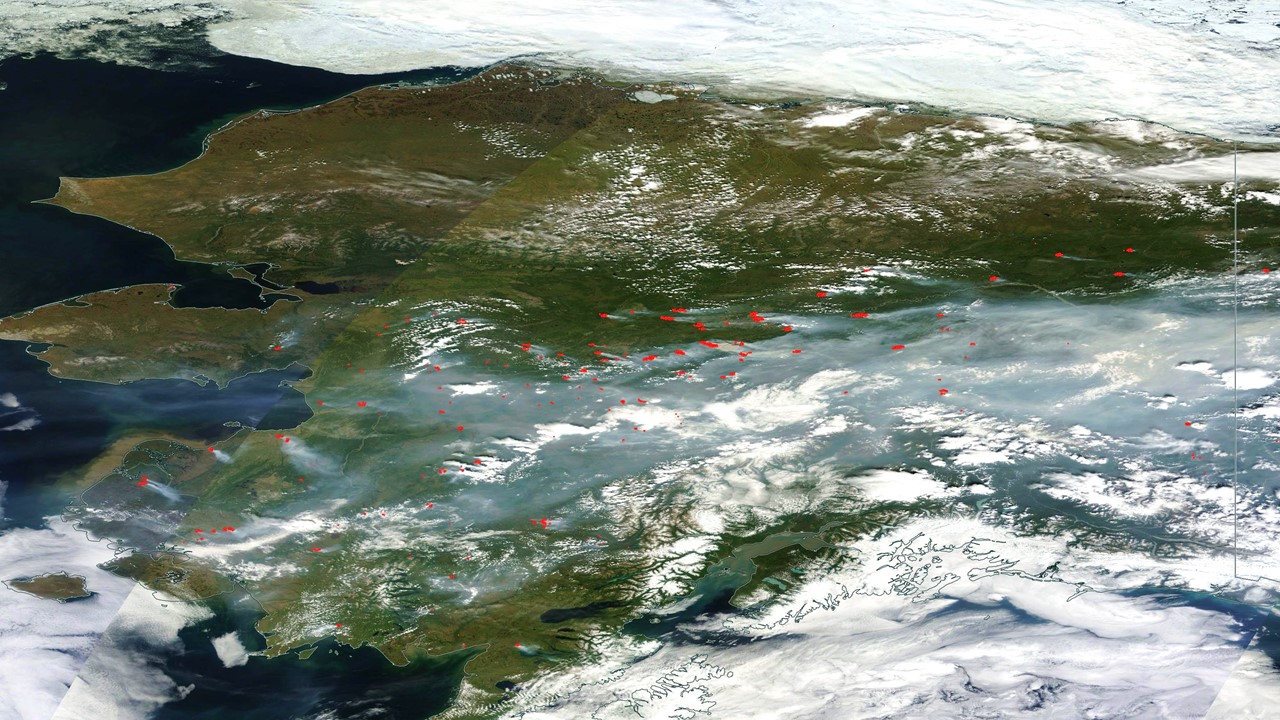
NASA MODIS satellite imagery of Alaska from 23 June 2015 showing infrared-sensed fire hotspots (red) dots from 260+ wildfires.
The warm dry weather is due to atmospheric high pressure anchored over the state, likely influenced by the strengthening El Nino and the persistent “warm blob” of water in the eastern North Pacific.
How many people actually live in those areas?
Many of these fires surround small town and or plenty of villages. They currently are working on evacuating many villges and small town
All of those aerosols and unquantifiable. Such fine cloud condensation nuclei. These wildfires are a snippet from the past when there was no fire control and forests and grasslands burnt over periodically. Now we have a reduction in natural burning, becauseof modern fire control efforts. It could very well be that the modern era has fewer aerosols, but we will never get past speculation on the topic.
I was a child in western Pennsylvania and remember the smoke from this fire in Canada.
https://en.wikipedia.org/wiki/Chinchaga_fire
OT, but something I think you might want to be aware of it not already. Should be interesting in the next week when they make the move to lower altitude observation. My bet is comet impact remnants. Ice in particular.
http://www.businessinsider.com/ceres-dwarf-planet-spots-water-salt-photos-2015-6
I, too, await better resolution images of the spots, although I’m more inclined to think that the bright spots are ice patches that have been exposed by impacts. Ceres is believed to have a fair amount of ice in its mantle.
Wonder how long that blob of warm water is going to hang around? Seems like it has been there quite awhile.
The blob doesn’t really exist. Clearly, this is data manipulation by the AGW alarmist cabal. A rise in temperature would require that heat is being absorbed in the subsurface ocean and that hasn’t happened in nearly two decades, as proven by my “only the extrema count” trend analysis technique. What is actually happening is that the ocean around the “blob” area is cooling due to the magical mystery cooling quasi-cycle, which has a period of t +/- 0.9 t. Everybody knows water cools things. Oh, and there’s some kind of solar effect, but I haven’t been able to manipulate the coefficients to make it work yet.
For those who like to say we don’t know how much of the warming is natural…
http://www.bloomberg.com/graphics/2015-whats-warming-the-world/
Models demonstrate nothing except how scientists interpret and/or manipulate data according to their theories.
Moreover, I quote IPCC’s AR5 (2013), WG1, Chapter 9 (“Evaluation of Climate Models”), page 743:
“Most simulations of the historical period do not reproduce the observed reduction in global-mean surface warming trend over the last 10–15 years. There is medium confidence that the trend difference between models and observations during 1998–2012 is to a substantial degree caused by internal variability, with possible contributions from forcing inadequacies in models and some models overestimating the response to increasing greenhouse-gas forcing. Most, though not all, models overestimate the observed warming trend in the tropical troposphere over the last 30 years, and tend to underestimate the long-term lower-stratospheric cooling trend.”
David Burton has a takedown of the Bloomberg article at WUWT, showing it to be slick deceptive propaganda. And I’d bet there’s a lot more wrong with it than Burton noticed.
http://wattsupwiththat.com/2015/06/27/bloombergs-made-up-climate-widget/
To help to forestall getting fooled again, repeat this until it’s burned into your brain:
“Computer models are not evidence for the validity of a scientific theory. They are evidence of how the scientists interpret or manipulate data according to their theory.”
The AGW types will cling to their models because that is all they have left of their vanishing world. You will never make them understand that the product of their models does not constitute valid observations or evidence.
Where did the CO2 data come from, Bill? From the advertising dept?
The references for the data are linked at the bottom of the article.
Slipstick,
Where, exactly, is the CO2 data, assuming you know how to distinguish data from model products.
This is so well established, I can’t believe anyone would question it. Mauna Loa goes back to when it was just above the 280 found in ice cores going back thousands of years.
http://blog.ucsusa.org/400ppm-co2-mauna-loa-455
Yes Bill, thousands of years, and that is exactly why I look at ice core data with a leery eye.
Way back, a couple of decades ago I saw the results on an experiment that took a very thick container that was completely evacuated to the extent possible at that time. A sample of what was left inside the container was obtained and analyzed. A number of years later that container’s contents was analyzed again and they found quite a lot of hydrogen inside that was absent in the original analysis. There were many possible explanations raised for this difference, virtual photons, cosmic/solar rays, diffusivity, etc but i don’t remember any conclusive agreement. Where did all of that hydrogen come from?
So if they are going to analyse tiny bubbles in millennia old ice I always feel they should not merely take the concentration of carbon dioxide but should have been taking analysis of all carbon atoms present within those samples. Besides carbon dioxide show the carbon monoxide, carbonate radicals, elementary carbon, etc. So I search out for such detailed results and so far I have found none but I don’t have pay-wall free access either.
Could the analysis of ice cores possibly be incomplete? Sure. It is always in my mind. From what I gather is chemical reactions still occur over time even in the most isolated environments due to atomic level energy fluctuations from inside and out and it seems logical that some equalization would be reached over time. Is that what we ar3e seein beig so level? So just measuring carbon dioxide, I don’t buy that without question. Then there is the diffusivity but that is yet another matter of uncertainty involved.
Try
http://scrippsco2.ucsd.edu/data/atmospheric_co2
Bill:
You need a different source, if you do not wish to wallow in abyssal misinformation.
Mauna Loa goes back to March, 1958, and that first reading was 313 ppm.
Slipstick, your link is not the Bloomberg source. Your usual diversionary tactic. I have not forgot.
Why do you use the blognomen Slipstick? Is a takeoff on slapstick?
No point arguing with calcified neurons.
Bye.
Mpainter: “The data does not fit my beliefs, therefore I am free to ignore it” is not valid. The Mauna Loa data have been confirmed by multiple studies using readings from other sites. The number Bill cited was from paleoclimatological studies, much of it from ice core samples, and refers to the last 450,000 years prior to the industrial revolution. I offered a direct link to source data; how is that “diversionary”, unless it’s a diversion to deal with actual data reflecting reality. Search for slipstick on Wikipedia.
Slipstick or slapstick or whoever,
Please do not attribute to me your own invented expressions, which you put as a quote. Such a practice is more of your despicable tactics.
I note you also presume to speak for Bill. His comment speaks for itself.
I was not quoting you, just labeling your actions.
Large areas of Alaska (and the neighboring Yukon Territory) are covered in a moss blanket that quite often will exceed a metre (3 ft) in thickness and a lightning strike is the most common cause of these wildfires. These moss blankets can burn for years, even under snow.
In Arizona, we have much less fire activity than usual this season. I suspect this is true of many other areas as well. What doesn’t fit the narrative goes unreported?
John Hultquist
Thanks for the interesting link on the Chinchaga fire. The smoke pall was a climate event of quasi hemispheric proportions.
This illustrates my comment above concerning the modern era of fire control versus untrammeled nature.
Not ONE “baked Alaska” joke?
Let’s get with the program, folks!
https://en.wikipedia.org/wiki/Baked_Alaska
Very hot it gets in the west of the US and southern Europe. This slowdown in circulation related to low solar activity.
http://www.cpc.ncep.noaa.gov/products/stratosphere/strat_a_f/gif_files/gfs_z100_nh_f00.gif
In Alaska it cools down. Weak winds over the oceans it less water vapor over continents.
That is the forecast.
http://www.cpc.ncep.noaa.gov/products/stratosphere/strat_a_f/gif_files/gfs_z100_nh_f120.gif
The heat gets to southern England.
http://www.cpc.ncep.noaa.gov/products/stratosphere/strat_a_f/gif_files/gfs_z100_nh_f120.gif