UAH Global Temperature Update for February, 2013: +0.18 deg. C

March 4th, 2013 by Roy W. Spencer, Ph. D.

Our Version 5.5 global average lower tropospheric temperature (LT) anomaly for February, 2013 is +0.18 deg. C, a large decrease from January’s +0.50 deg. C. (click for large version):
UAH_LT_1979_thru_Feb_2013_v5.5

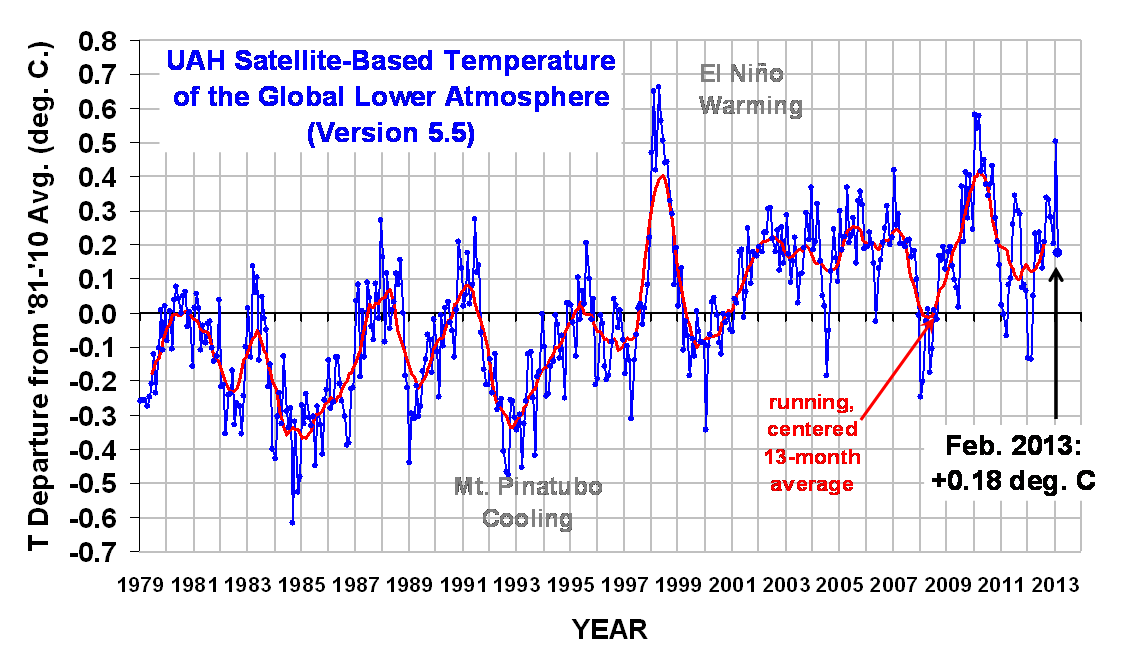
These large month-to-month changes are not that uncommon, especially during Southern Hemisphere summer, and are due to small variations (several percent) in the convective heat flux from the ocean surface to the atmosphere.

The global, hemispheric, and tropical LT anomalies from the 30-year (1981-2010) average for the last 14 months are:

YR MON GLOBAL NH SH TROPICS
2012 1 -0.134 -0.065 -0.203 -0.256
2012 2 -0.135 +0.018 -0.289 -0.320
2012 3 +0.051 +0.119 -0.017 -0.238
2012 4 +0.232 +0.351 +0.114 -0.242
2012 5 +0.179 +0.337 +0.021 -0.098
2012 6 +0.235 +0.370 +0.101 -0.019
2012 7 +0.130 +0.256 +0.003 +0.142
2012 8 +0.208 +0.214 +0.202 +0.062
2012 9 +0.339 +0.350 +0.327 +0.153
2012 10 +0.333 +0.306 +0.361 +0.109
2012 11 +0.282 +0.299 +0.265 +0.172
2012 12 +0.206 +0.148 +0.264 +0.138
2013 1 +0.504 +0.555 +0.453 +0.371
2013 2 +0.176 +0.369 -0.016 +0.169


29 Responses to “UAH Global Temperature Update for February, 2013: +0.18 deg. C”

Toggle Trackbacks

  1. Daniel Reppion says:

    The raw values on the discover site suggest an anomaly value of ~ .4. A rather large downward adjustment this month.

  2. DABbio says:

    I still miss my 3rd order polynomial 🙁

  3. MikeB says:

    I thought that the polynominal was a waste of space, a distraction with no justification. I am glad it’s gone. Please don’t bring it back.

  4. HaroldW says:

    Dr. Spencer —
    You post a figure to three digits here, but the file only shows two digits of precision, and doesn’t always match the rounded-off three-digit value. E.g., you show January 2013 as +0.504 but the file has 0.51. I’m curious about this small discrepancy.

  5. Greg says:

    Some sort of spline would help visualise longer term tendancies. The “just for fun” thing attracted derission, so perhaps in a more serious comment of what the spline is for. Plus the usual, not a model no predictive value.

    More important would be a better low pass filter. I hate seening so-called “smoothers” that go the wrong way and peak when the data has a trough, as your runny mean does for the last few years.

    Gaussian , binomial…? If you really can’t be bothered to code that and wish a drag and drop solution in excel how about at least a triple running mean : 12m; 9m ; 7m : nearest approximation to 1.3371 ratio where the messy negative lobe is on a simple running mean.

    • Dikran Marsupial says:

      Greg, the observations over the course of less than around 17 years don’t even adequately support a linear model, so a spline model (or a polynomial for that matter) is likely to over-fit the data and instead of a useful visualisation of long term noise, you will get a misleading visualisation of short term variability. There is enough bad science in the climate debate already, and there is no point adding to it with some dodgy statistics. If a spline is to be fitted to the data, then at least it should be fit with a smoothnes penalty (see the excellent book by Silverman) in order to try to avoid the over-fitting.

  6. Greg says:

    In fact a even shorter 5:4:3 would be more accurate than the 13m RM, looks smoother because it has a half way decent freq response and has a similar window size.

    http://woodfortrees.org/plot/uah/mean:5/mean:4/mean:3/plot/uah

    😉

  7. Greg says:

    http://woodfortrees.org/plot/uah/mean:13/plot/uah/mean:12/mean:9/mean:7

    12;9;7 R3M , compared to 13m RM

    The 13m looks pretty rough in comparison.

    the R3M actually has a zero at 12m so is marginally better than a gaussian at eliminating the annual cycle (and it’s quick and easy to do).

  8. Newbie question: is this the same data shown at http://nsstc.uah.edu/climate/ ?

    If so, why different presentation graphics?

    Great material, very helpful that you make this available!

  9. john parsons says:

    Nice work Greg. Looking at either of those two plots leads any honest observer to only one conclusion. JP

  10. Werner Brozek says:

    The anomaly for February was 0.176, down from 0.504 in January. The 0.504 would be ranked first if it had stayed this way. The 0.176 would be ranked 9th if it stays this way. The average of the two is 0.34. So if the anomaly averaged 0.34 for the rest of the year, it would come in third. As for the longest time the slope is not positive, the numbers are not on WFT yet, however I do not expect a huge change other than raising the 4 years and 7 months to 4 years and 8 months.

    If you would like to see my usual comparison of UAH compared to five others to the end of January, see my article at:

    http://wattsupwiththat.com/2013/03/05/has-global-warming-stalled-now-includes-january-data/

    P.S. Dr. Spencer,
    Thank you for a previous article of yours which I referenced in my article when I wrote:

  11. Werner Brozek says:

    P.S. Dr. Spencer,
    Thank you for a previous article of yours which I referenced in my article when I wrote:

  12. Werner Brozek says:

    Sorry! Something is not working! I will try again!

    Relative to December, the January anomalies have changed as follows: UAH up 0.30, RSS up 0.34, Hadcrut4 up 0.17, Hadcrut3 up 0.13, Hadsst2 down 0.06, and GISS up 0.17.

    Dr. Spencer explains why the satellite anomalies are up but the sea surface anomaly is down at:
    http://www.drroyspencer.com/2013/02/apparent-reason-for-january-2013-tropospheric-warmth/

  13. We’re a gaggle of volunteers and starting a new scheme in our community. Your site provided us with valuable info to paintings on. You’ve done an impressive job and our whole community will likely be grateful to you.

  14. AJ says:

    A “winning” month for Armstrong vs. Gore: http://www.theclimatebet.com/gore.png

  15. Again as each month passes by, temperatures fail to increase, the sun continues in a slumber, two predictins I had made years ago.

    Going forward the days for AGW remaining a viable theory are on their death count. By post 2014, like I have been saying, the temp. decline will become firmly established.

    What has held temperatures up or delayed the decline are essentially three factors.

    1. solar cycle 24 max

    2. ocean heat content lag

    3. sub-solar activity accumulatin factor

    1. Solar cycle 24 max. will be behind us in the very near future,although weak ,it is still a maximum and has the solar flux average around 115.

    That reading will be declining to probably sub 72 by 2015, along with solar irradiance dropping off by .2%, while EUV light should subside upwards of 50%. Solar wind should get down to around the 300 km/sec. area.

    2. Ocean heat content is high due to the long strech of above average solar activity from the period 1820-2005. That will wain as the accumulation of years of sub -solar activity keep lengthening.

    3. Sub- solar activity did not start in earnest until Oct. 2005,which had followed over a century of above solar activity. Lag times have have to be appreciated.

    Even so despite all the above and with co2 still increasing the tmperatures have been flat for 17 years.

    Then the secondary effects from sustained weak solar activity have to be taken into account which will be an increase in cosmic rays/more clouds, a more meridional atmospheric circulation/more clouds and snow cover,more volcanic activty /more so2,a cold pdo /more La Ninas, with the AMO soon to be in it’s cold phase.

    Antarctic ice ever increasing ,while Arctic ice will be on on the increase.

    Put the above all together and global cooling is coming post 2014. The only question is not if we have global cooling but to what degree.

  16. I just added this webpage to my google reader, excellent stuff. Can not get enough+ACE-

  17. Hello, everything is going perfectly here and ofcourse every one is sharing data, thats in fact good, keep up writing.

Leave a Reply