New Satellite Temperature Trends Page

March 22nd, 2013 by Roy W. Spencer, Ph. D.

AMSU-temp-trends-website-example

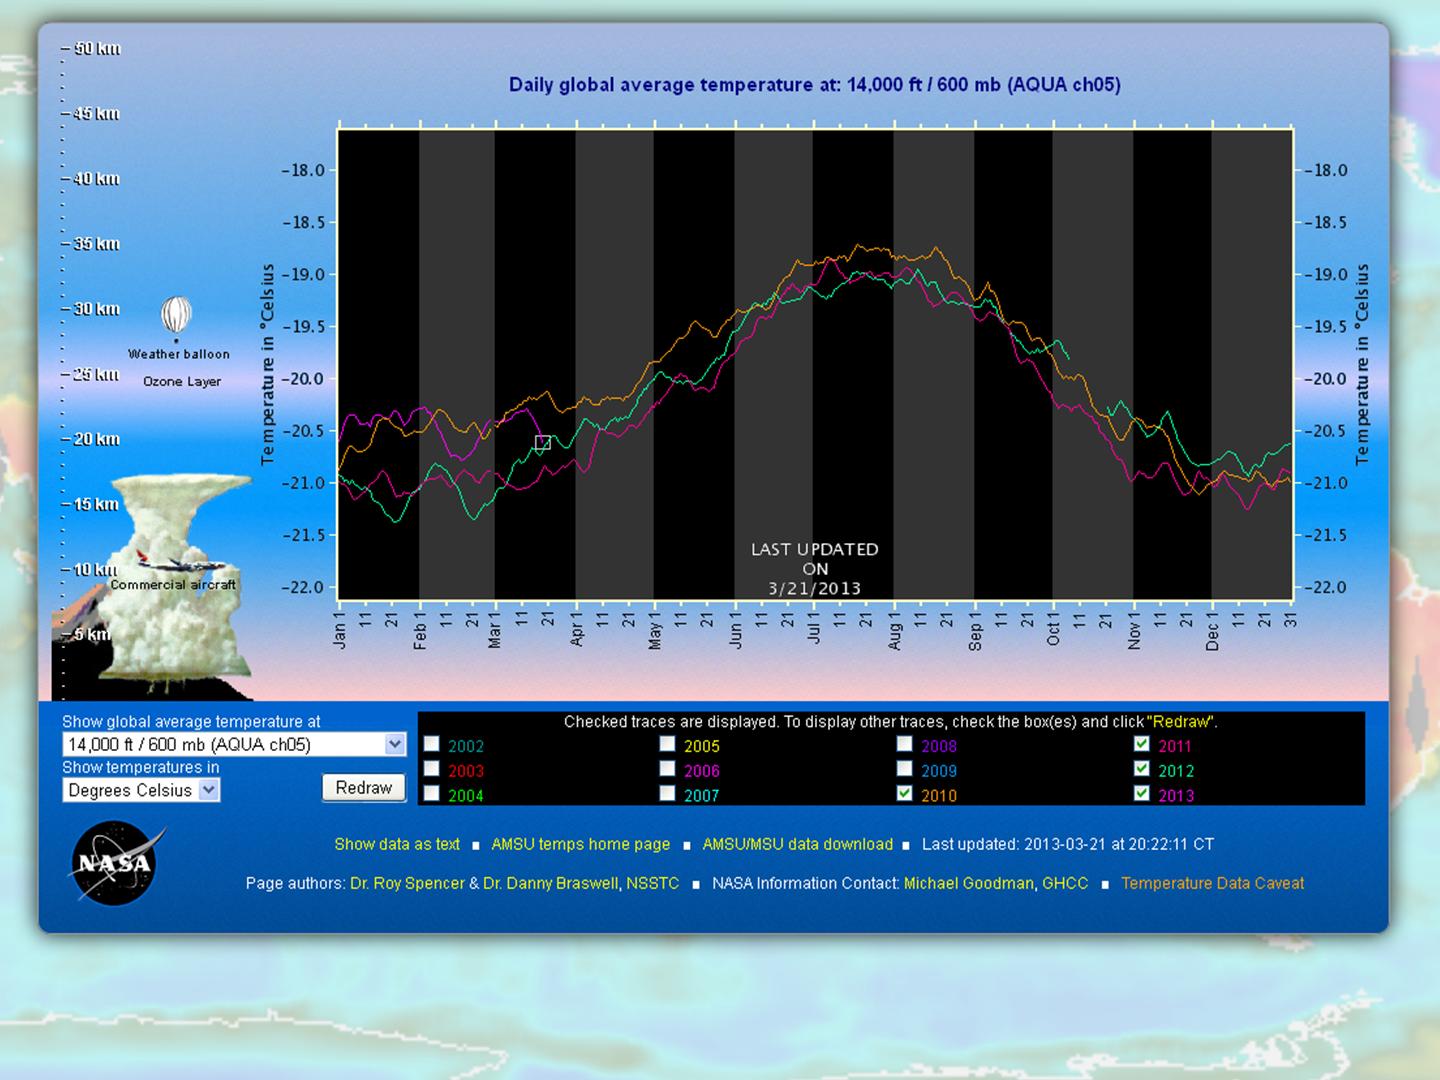
There is a new location for the daily global satellite temperature page:

http://ghrc.nsstc.nasa.gov/amsutemps/

Choose “ch. 5” to get the channel closest to our (UAH) lower tropospheric (LT) product that we update once a month. Use “ch. 9” if you are interested in the lower stratosphere.

As a reminder…this page shows data from the AMSU instrument flying on the Aqua satellite, which we don’t use anymore because it is drifting warm relative to other satellites. For ch. 5, it is currently running about 0.2 deg. C too warm, so keep that in mind when estimating how the current month is shaping up compared to the same calendar month in previous years.


12 Responses to “New Satellite Temperature Trends Page”

Toggle Trackbacks

  1. Gras Albert says:

    Ok, Aqua channel 5 is warm, are we still justified in the assumption that trends remain significant?

    If so, is not the decline in Aqua 4 GAT ‘unprecedented’ in magnitude and delta for March, currently 0.4degC in just 7 days, only March 2004 is remotely comparable.

    Given a similar though not quite so dramatic decline in channel 6 & channel 7, are we witnessing a ‘super tropospheric cooling’ event? 🙂

  2. Gras Albert says:

    Make that > 0.5degC in 8 days, at this rate, Snowball Earth will be here before Easter!

  3. Sven says:

    What’s happening with Aqua? Is there another problem in addition to running too warm? It’s now dropping like a stone and that does not seem to be a normal behavior…

    • coturnix says:

      judging by what’s happening in eastern europe now, I guess the satellite has just stuck above that very spot… aliens, antigravity anyone?

  4. Daniel Reppion says:

    The lurching temperature in part can be explained by shifts in the SOI – which headed positive early march ( http://www.bom.gov.au/climate/enso/monitoring/soi30.png ). This typically brings on a cool shift in the weeks following the event, but similar to heat waves derived from those oscillations,it tend to be short lived.

    • Gras Albert says:

      As of March 24th, the Nino 3.4 index, although negative, has remained in the neutral range +0.5 through -0.5 degC for the last 4 months.

      As this is roughly the lag for Nino driven warming to leave the system, was it not likely that a fall in GAT was due about now?

      The issue is the size and speed of the 600mb fall, if not an artifact of hardware failure or processing, this cooling is extraordinary. 0.8degC in 9 days is an event not repeated anywhere in the satellite record, let alone in March, which is typically a warming month

      • Daniel Reppion says:

        And on that graph – it shows an SOI lurch from ~ -8 to +13, which is big shift. If you look at the data, you will see other shifts in the UAH record that are also reflected in the SOI figures.

        For example, in mid January on the SOI graph ( http://www.bom.gov.au/climate/enso/monitoring/soi30.png ) there appears a rise in values from -8 to +3, which then dips back to -8 ~ 3 weeks later. A temperature response to this in UAH which appears to correspond is the dip in temperature values mid febuary (with a monthly anomaly drop accordingly). Similarly a shift down from around +5 to -9 in early December 2012 is a likely candidate for the rise in temperatures in January ’13, and if you look on the monthly temperature anomaly graphs here you can see the affect it appears to have had.

        I’m not saying it isn’t very interesting, but short terms shifts in the SOI seem to have corresponding temperatures changes a month or so later. This is without the regime as a whole shifting from la nina to el nino or vice versa. It’s quite possible that this temperature change, will stop over the next week or so, and behave according to the SOI values.

  5. Roy Spencer says:

    We won’t know till we compare the recent drop to the other 2 satellites. It looks suspicious to me. The noise in that channel has been rising for a couple years now, and it could be it’s close to failure.

    • Dr. Doom says:

      The behavior of channel 5 reminds me a little bit of channel 4 before it failed in 2008. A 0,14 drop is unprecedented, but a 0,26 drop is not even close to rational behavior, so I’m pretty sure it is game over for channel 5.

      R.I.P.

  6. Nabil Swedan says:

    Dear Dr. Spencer,

    These are very educational curves and it would be wonderful if more like this curve are posted for different elevations. Is the curve a global average or for a given latitude? Are you sure that 15-35 Km correspond to 600 mb, or the Km ordinate is an inadvertent error?

  7. I truly enjoy looking through on this internet site, it holds superb posts.

  8. James Hood says:

    Its now dropping like a stone and that does not seem to be normal behavior.
    Basement Repair Palmdale, CA

Leave a Reply