
 Home/Blog
This is the third in my (never-ending, it appears) series on measuring the effect of Urban Heat Islands (UHI) on land surface temperature trends.
In Parts I and II I emphasized the Landsat-based “built-up” structure dataset as a proxy for urbanization, which I’m sure we will continue to examine as part of our Department of Energy grant to examine (mostly) satellite-based methods and datasets for testing climate models and their predictions of global warming.
Much of the original research on the UHI effect (e.g. T.R. Oke, 1973 and later) related warming to the total population of towns and cities. Since population datasets extend back in time much further than the satellite period, they can provide information on the UHI effect going back well before 1900. In the last few weeks I’ve taken a detour from using the Landsat-based diagnoses of human settlement built-up structures as a proxy for urbanization, to population density (PD). Along the way I’ve had to investigate issues related to low correlations, and linear regression (specifically, regression dilution). I decided not to cover that here because it’s a little too technical.
The deeper I dig into this project, the more I learn.
Urbanization Effects from 1880 to 2015
I have a lot of results I could show, but I think I will introduce just one plot that should be of interest. Using tens (in the early years) to hundreds of thousands of 2-station pairs of temperature differences and PD differences, I sort those from the smallest to largest 2-station average PD. Then I perform regressions in separate PD intervals (12 to 19 of them) to get the change in temperature with population density (dT/dPD). These coefficients are, in effect, tangents to the non-linear function relating PD to the UHI warming effect. The data shown below are from the month of June in 20-year intervals from 1880 to 2015, in the latitude band 20N to 80N.
Then, by summing those regression coefficients up (integrating them, in calculus terms) from zero PD to the maximum 2-station average PD value, I construct curves of PD vs. UHI effect. I have looked at quite a few published UHI papers, and I cannot find a similar approach to the UHI problem.
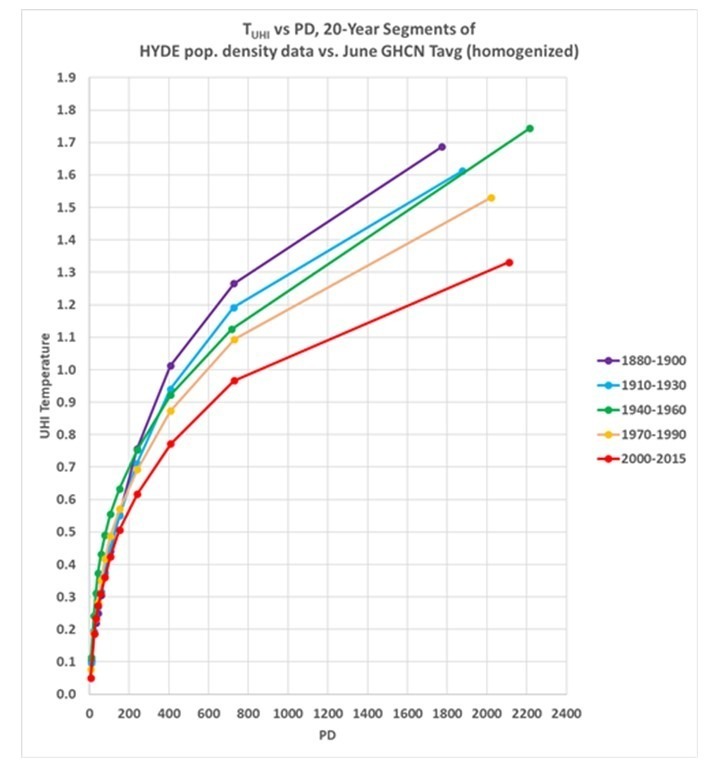
I have to admit, the results in Fig. 1 are not what I expected. They show the total UHI effect being stronger in the late 19th Century, and weakening somewhat since then. (Remember, because these results are based upon 2-station differences, these are spatial relationships, that is, for the 1880, 1890, 1900 period there is a greater temperature difference between rural and heavily populated locations than in later decades.)
I do not have a ready explanation for this, and ideas are welcome.
If the results were reversed, I would guess it is due to larger errors in early population estimates, since errors in the independent variable (PD) reduces the regression slope (dT/dPD) below the “true” relationship (regression dilution). But just the opposite is happening. And, it cannot be due to much lower numbers of stations in the early periods because that leads to only noise in regression coefficients, not systematic bias.
Some Thoughts
From reading the literature, I think this is rather novel approach that avoids a common problem: the usual separation of stations into “rural” versus “urban” categories. Because the curves in Fig. 1 are non-linear, a nearly rural station will experience much more warming from a given increase in population than will very urban site. Thus, previous investigations that found little difference in temperature trends between urban and rural sites don’t really prove anything. My methodology avoids that problem by constructing curves that start at zero population density (truly rural conditions).
Eventually, all of this will lead to an estimation of how much of the land warming (say, since 1880) has been spurious due to the Urban Heat Island effect. As I have mentioned previously, I don’t believe it will be large. But it needs to be documented.


Is the reason the difference is less now than 100 years ago that it is because rural living is much closer to urban living today? There is much more sprawl, etc.?
People overlook the obvious. In Australia most of the weather stations used to support the warmists view are located at airports.
I looked at the data for Alice Springs in the centre of Australia and you can see the climate started a warming trend about 1977. About that time the airlines stopped using Foker F27 prop jets and started using Boeing 727’s etc. The warming matched the uptake of bigger and more frequent jets while other remote weater stations, in northern Western Australia and the Northern territory, showed a slight cooling trend.
All this can be seen on the Australian BOM web site and by googling flight departures form Alice Springs airport. The weather station is at the north eastern end of the airport runway.
Correction – the met station at Allice Springs is at the north western end of the airport. The picture of the site on the BOM was of a site in the wilderness. If the site was pictured from the other direction there might have been jets taking off in the background.
Most Australian long range rural stations have been moved from the town post offices to the airports. An example is Onslow in WA, where they moved the station from the coastal town location (post office) to the inland airport. However, there is a decent overlap (a rarity) of 10 years. The overlap shows a near constant 1.5 deg C difference. The ABC in January last year trumpeted a new daily temperature record of 50.7 deg and implied that this was due to global warming. However, they failed to mention the station change and the previous daily temperature record of 50.6 deg C in 1896 was observed at the Onslow Post Office coastal location.
Perhaps it is a siting issue and overall the urban siting of stations has actually improved compared to the early 1900s. I know many stations today are woefully sited but back then without anyone really thinking about UHI effect I could see a station being pretty much anywhere and likely closer to buildings for convenience. Some of the other comments make sense too.
**I was wondering this also. -Roy
I would vote for this explanation. Measurement skill seems underappreciated as a changing systematic effect.
Isn’t the relationship between the time periods consistent with your observation that a given population increase will have a larger temperature effect on a sparsely populated region than on a densely populated region? The U.S., on the whole, has become more densely populated over time.
Hats off to you for the elegant approach to the problem.
Yes, and efficiency increases over time. Its about what I would expect. Improvements in efficiency over time and with density. Later, the trend is probably due in good part from the greenhouse effect and feedbacks (increased plant respiration from CO2 fertilization, increased nighttime humidity from increasing transpiration in rural areas, dew and fog releasing latent heat near the surface at night). More service driven economy in populated areas.
I always thought economic heat island was a better name, but type of economic activity is crucial.
“They show the total UHI effect being stronger in the late 19th Century, and weakening somewhat since then.”
More evidence of broadscale ecosystem desiccation and loss of biodiversity. Progressive soil death, not only on agricultural lands. The wildlife biodigesters and associated biosequestration very slow now in the countryside, compared to late 19th century. Rural areas catching up to the perturbed urban zones. The hinterlands gaining urban-like heat properties. Man made climate change everywhere; unrelated, or in addition to, the trace gas emission effect. Northern mid-latitude continental heat islands; massive ecosystem change.
Yep. I wholeheartedly believe in anthopogenic climate change. But fossil fuels are the patsy!
The science is settled because most climate scientists were happy with the right answer but for the wrong reasons!
All the data says the opposite. Land water, soil moisture, etc. are increasing. The trend is probably due in good part from the greenhouse effect and feedbacks (increased plant respiration from CO2 fertilization, increased nighttime humidity from increasing transpiration in rural areas, dew and fog releasing latent heat near the surface at night). More service driven economy in populated areas.
‘All the data’. That’s bold!
Where is the data to support your claim of land water increase? Not in land ice that I know of.
I’m mostly skeptical of CO2-caused AGW precisely because I haven’t seen that warmer wetter world that was forecast so I am genuinely interested, not having a go at you.
On the other hand, humans have been cutting down immense amounts of forest over the past 500 years, and draining swamps for a couple of thousand. Now THAT I do expect to alter regional weather patterns and so climate…
CO2, especially from fossil fuels, is a patsy.
My initial reaction is to ask if there has been any change in the accuracy of temperature measurement over time? In the early days, did they have well designed measurement systems that shield against sunlight effects and nighttime radiant loss effects? I will assume calibration is not a big issue. The other issue that might be worth looking at is the effect of deforestation and farming practices. It seems to me that genuinely rural would require natural plant density.
Tim S. The other side of that. And I’m just wondering. If the Measurement instruments were set in areas where the closely surrounding vegetation is influenced by man – ie, cut, let grow freely etc, what effect would that have, if any.
Forested land stays green longer or possibly year-round. Farmed land has periods of plowing which exposed raw earth, and then only partial coverage of the planted crop.
“I do not have a ready explanation for this, and ideas are welcome.”
Well, I heard the UHI effects in India cause more fog [rather than temperature difference]. And generally, I would guess that if have more global warming, you get less UHI effects [in terms of temperature differences].
Higher warming could be related to gradually diminishing positive feedback from the end of the LIA where glacial retreat was faster in the 19th century and in the 20th century which probably has contributed significantly to industrial age warming.
Interesting is how 1940-1960 stands out. This was the beginning of urban infill and suburbia with much building occurring post war. Typical of pre suburbia was an urban center surrounded by low density towns that relied primarily on agriculture. With larger corporate farms, less need for workers and working animals, and far better transportation farm workers live in Fresno and commute to work or get trucked in as opposed to living in a bunk house next to the barn.
I remember one of your very first looks at UHI on WUWT many years ago.
Then you identified it was the early increases that had the most effect on UHI, ie the first 1000 people had more effect than the next 1000 people.
Could it be a “saturation” effect, that as population increases we build Upwards (flats/skyscrapers etc) rather than more densely?
That would mean most of the additional heat soak would be way above the 2 metre Station height.
It is not saturation, it is a logarithmic effect.
So a concentration effect. It makes sense that you are moving from one UHI regime (non-urban, no UHI) to another (urbanised, with UHI).
Once an urbanised state is achieved where most of the ground is buildings and roads, not vegetation, one would expect the UHI to not add any more heating.
So I think you are both right: you are seeing a logarithmic effect because of saturation but we are looking at two additive effects: background UHI and natural climate.
The UHI fingerprint would be confounded in the historical record by recent cleaner air in cities making UHI much, much more impactful in US and European cities for the same reason a sunny day is hotter than a cloudy day (unless the cloudy day follows a sunny day prior – which is the stupidity of arguing about climate influence of clouds. A cloud cannot trap heat that had not arrived there prior to it’s formation and the incident heat is greater than the outgoing heat so clouds MUST be a cooling effect, so too fogs and smogs. We know that early population growth in cities was accompanied by atrocious air quality.
I think you are onto something, here Roy, but as so often in Climate, the averaging is masking the true picture. It might be insightful to cherry pick a couple of cities as ‘case studies’ and contrast them. Perth, Australia, where I am has strong sea-breezes that mean we don’t really suffer from air pollution, but those same sea-breezes add in an ocean temperature influence that would completely distort any UHI until you filter the temp data to remove the seabreeze cooling (in summer) and warming (in winter). Temp and wind are so inter-related (especially for UHI effects), that I’m not convinced any temperature analysis tells you much if not do not account for wind. Could you do this analysis just for temperature data when wind speed is less than a threshold defined on how long thermal equilibrium is reached during advection?
I guess that now there are much more areas covered in concrete and asphalt where the population density is low but the UHI-effect is the same?
The heat island effect wouldn’t be directly proportionate to population density because roads, rooftops, parking lots etc. are not directly proportionate to population. A rooftop over a house might be over 4 persons whereas the similar area over an apartment building might be over 50 persons and so on as efficiencies in construction allow less asphalt, roof shingles etc. to manage populations.
Also ghost towns do have an UHI, it’s the buildings not the people.
Hans,
Do you have some ghost town data to share? I have been studying about 30 Australian ghost towns or towns that never grew and am finding a lot of noise. Geoff S
A typical trend is that ever less people are living in family homes. Consider the 1900’s when you had large families in small houses and presently suburbia has one to four people living in a detached house.
Population densities are often “binned”. Given the very steep UHI curve at low population densities, could a more significant “rural UHI” be introducing temperature bias by a small change affecting much larger area (or many more weather stations?)? Especially given Hans Errens observation about housing densities.
https://edepot.wur.nl/171621
Here is a neat dutch study with uhi observations
Thanks, interesting.
Fantastic paper.
Their Figure 1 can be seen for Perth, Australia in realtime in our 128km radar imagery when a weak frontal system crosses the city. The urban area will have little to no rainfall compared to the fringes. I’d always wondered if it’s because of a lack of Cloud Condensation Nuclei from vegetation, or because radiated heat simply evaporates the rainfall.
It seems more likely it’s the latter.
Of course, our rainfall has dropped significantly over past 110 years.
Winter weather on the 18th of March in the US.
https://i.ibb.co/FVzq5Fv/Zrzut-ekranu-2023-03-18-213359.png
https://earth.nullschool.net/#2023/03/19/1300Z/wind/isobaric/500hPa/orthographic=-105.19,53.75,893
How much more snow will fall in the Sierra Nevada?
https://earth.nullschool.net/#2023/03/21/2200Z/wind/isobaric/850hPa/overlay=temp/orthographic=-118.99,43.81,893
Polar Vortex continues to organize at South Pole, as Mar 20 nears.
It should be a real beauty.
I like martinitony’s idea.
At low population densities urban ground cover such as tarmac and buildings increases as a proportion of total ground cover faster than population density. The albedo decreases (and UHI increases) in proportion to increased urban ground cover rather than increased population density so you get a high UHI ∆T per extra person.
At higher population density people start to live in blocks of flats rather than houses. Population density is increasing faster than albedo is decreasing so the ∆T per person decreases.
Roy and others have admirably pointed out how climate models are useful but imprecise b/c earths coupled ocean/atmosphere/terrestrial systems are so complex.
Sulfate aerosols, clouds, water vapor, parameterization, etc., etc., etc.
We agreed with all these technical criticisms (atmospheric physics, chemistry, thermodynamics, residence times, etc.).
But under all that we were watching birth rates at a high resolution level. We saw mistakes that were far more fundamental.
And looking back and tearing apart the population assumptions in the original IS92, SRES, RCP, SSP and all emissions scenarios from then until now, it appears our original assumptions were at least partly correct.
As we stated in our new Substack environMENTAL, this a.m. See > https://envmental.substack.com/p/the-population-bombing
Bloody hell! You are the first person I’ve found who thinks like me. Great article on your link.
Just a guess, but I think cities were greening over time. If you look up older pictures, there apparently were little ambitions to plant some trees.
What you really need is not population density, but percentage of mature tree canopy cover. A large tree prevents the heat even getting to the ground in the first place.
An IR camera shows the massive temperature differences in the way vegetation and building materials reflect and store heat and energy, but the spatio-temporal averaging elements of UHI make it a fiendishly difficult proposition to look at as a global timeseries.
We have lots of old maps (back to roman times in Britain) and a fair idea of architecture from then until now. A better way to do this might be to do some 3 dimensional heat loading simulations for actual locations and buildings over time. Pretty sure architects do that now for building design. You’d have to assume solar input had been constant over that time?
I will now run away…
🙂
Good point, I grew up in suburbia in the 70’s that was constructed in the 60’s without trees, when I visited the area last year there were big trees everywhere, obviously reducing the UHI dramatically.
The frost wave is reaching Alabama and Georgia.
https://i.ibb.co/18QzGnj/Zrzut-ekranu-2023-03-19-075738.png
“I have to admit, the results in Fig. 1 are not what I expected”.
In my opinion the results were exactly as I would expect.
With the same population density (number of houses etc), the heat from each house would depend on the house insulation and the energy used inside for heating. Modern houses are much better insulated than houses long ago. Maybe the use of energy inside was lower, but I would expect that the the net energy lost to the environment would be reduced with time. Therefore: urban heat is reduced with time.
Sounds correct at a first glance.
That was my first thought too. There are several other ideas here that seem likely. I don’t know how one would evaluate the relative contributions of these possibilities.
Sunspot number: 35
Updated 19 Mar 2023
https://i.ibb.co/pdkwSFV/hmi1898.gif
2023 03 15 2023.201 106 9.6 27 33
2023 03 16 2023.204 96 13.3 25 29
2023 03 17 2023.207 72 12.6 19 24
2023 03 18 2023.210 44 7.3 23 28
2023 03 19 2023.212 72 8.5 16 20
NASA Sun Science
26 min
Happy #SunDay! This weeks space weather report includes 3 notable solar flares, 26 coronal mass ejections, and no geomagnetic storms.
If you would plot against temperatures and not temperature difference you could check if the UHI is just maxing out.
There is only so much change on the surface that creates a difference, but no matter what, the change will not be a runaway effect. It will rather max out with the surface condition that controls temperature the most.
One thing, I can think of is moisture, water run off, which has a profound effect.
Other effects will play a role.
But all you really see, is that there is another control on surface temperatures, that is independent of surface conditions, which will limit temperatures and the UHI.
A series of fronts with precipitation is heading to California.
https://i.ibb.co/nQSB33q/Zrzut-ekranu-2023-03-19-194817.png
Very low temperatures in the upper stratosphere above the equator.
https://www.cpc.ncep.noaa.gov/products/stratosphere/strat-trop/gif_files/time_pres_TEMP_ANOM_JFM_EQ_2023.png
In three days, a very cold front will bring a lot of precipitation to California.
https://i.ibb.co/94kWSB0/gfs-hgt-trop-NA-f072.png
First the UHI effect.
Then the realisation that this leads to a continental HI effect? Here’s one “Beyond intensity of urban heat island effect: A continental scale analysis on land surface temperature in major Chinese cities”
Maybe a global HI effect?
I wonder if a correlation shows up between increased human energy production and useage between say 1850 and the present, on a global scale?
If it does, it can be explained without having to invoke a “greenhouse effect” which even its most ardent supporters cannot describe!
Does it really matter? Does anybody seriously believe that retreating to the Stone Age will really stop weather extremes? I suppose some might be deranged enough to take to the streets waving “Stop Climate Change!” banners.
Oh well.
“I wonder if a correlation shows up between increased human energy production and useage between say 1850 and the present, on a global scale? ”
There is a correalation between human heat production and global warming. However,when you do the maths, the human heat production only accounts for 1% of the observed planetary heat gain.
There is also a correlation between human CO2 production and global warming. When you do the maths, the reduction in OLR due to the increased CO2 neatly explains the observed global warming.
EM,
You might care to demonstrate that CO2 in the atmosphere makes thermometers hotter, rather than the heat which is involved when producing the CO2.
There is no “planetary heat gain”. The Earth has cooled for four and a half billion years, and unless your GHE description provides for this inconvenient fact, you are obviously dreaming, and disconnected from reality.
You can do all the “maths” you like, but if your calculations do not accord with observed fact, they are completely specious.
You don’t seem to have the faintest idea of what you are talking about. For example, you can’t even describe the “greenhouse effect”, can you?
Feel free to prove me wrong. I won’t hold my breath while I’m waiting.
ent…”There is a correalation between human heat production and global warming”.
***
Alarmist mathematicians might find a correlation but honest people can’t.
Surface UWIR / LWR as measured across the USA SURFRAD stations between 1996 and 2022 has been increasing by 6.49w/m2 / decade. That does not reconcile with your statement ” the reduction in OLR due to increased CO2 neatly explains observed global warming”
It could maybe partly explain the average SURFRAD stations temperature declines of -0.164 deg C / decade? But how do we explain the difference between SURFRAD stations temperature decline vs GISSTv4 increase of 0.21 deg C / decade? UHI difference between SURFRAD and “the whole of the USA”?
It will not be a warm start to spring in the US, especially in the north and west.
https://i.ibb.co/Sc9pXr2/gfs-T2ma-us-41.png
It is probably past the peak of solar activity in the 25th cycle.
https://www.iup.uni-bremen.de/gome/solar/mgii_composite_2.png
Peak’s not due for another year yet. Bet you an ice cream this is just short term variation.
Entropic man
” It is probably past the peak of solar activity in the 25th cycle. ”
*
No one knows what pushes Palmowski to make GSM-like forecasts every time the Sunny Boy takes a break.
Here are three of the top corners for daily observation of solar activity, updated through March 19th (the 4th being Oulu’s Neutron Count, inverted):
SILSO SSN
https://drive.google.com/file/d/1Yu9G_SqfDMF3upJnOh_EmW6RLjHeuA5a/view
Space Weather CA, solar URSI Flux
https://drive.google.com/file/d/10QX3O6JIK3RIhUJgiqdhim4yUaG9ZwfR/view
Bremen MG II composite index
https://drive.google.com/file/d/1JFtgIkD5w5bhCvOwrf3i74S0pLKEVCeO/view
Be careful when comparing Bremen to the rest, their cycle starts and lengths are very different from the others.
*
And now let’s see in Bremen’s Mg II how the comparison looks when SC 24 is fully represented:
https://drive.google.com/file/d/1UlzcmgnspfsL8mNeHcGgdwZH8hxXbywy/view
Yeah. Ice cream is a good idea.
binny van der Klown…”Here are three of the top corners for daily observation of solar activity…”
***
More faked graphs from Binny.
A beautiful high in the northeast of the US on the first day of spring.
https://i.ibb.co/9T59xMj/Zrzut-ekranu-2023-03-20-102951.png
An atmospheric bomb is falling into California from the northwest.
https://i.ibb.co/KFrhbDG/mimictpw-namer-latest.gif
The magnetic activity of the 25th solar cycle is very weak.
The solar wind exceeded 600 km/s only in late February and early March. Now the solar wind speed is decreasing again.
https://i.ibb.co/MnF5jFh/plot-image.png
Column: The Humanitarian Horror That Electrify Everything Would Unleash
“The cheerful Calgary Transit voice comes over the speaker system to tell us the temperature, and that its cloudy. Shut up. We know. Were waiting outside. For YOUR train.
The next message emanating from the loudspeaker shed the cheerfulness for slightly nervous solemnity. Northbound trains were not operating because of an electrical outage. Not running late not running at all. A few hundred red-cheeked and startled faces crammed on the platform turned to each other in search of guidance, of which there was none, then began moving in tiny circles as they weighed the absence of good alternatives with the prospect of freezing their feet to blackened stumps by standing still out there for too long.
You think Im exaggerating, you try it.”
https://wattsupwiththat.com/2023/03/20/column-the-humanitarian-horror-that-electrify-everything-would-unleash/
The Calgary rapid transit is one of the worst designs I have ever seen. In the downtown phase, the trains run on rails in the street, like the old tramcar systems.
https://www.prepareforcanada.com/choosing-a-city/public-transport-in-calgary-tips-for-newcomers/
https://www.flickr.com/photos/volvob12b/9575196728
The system is deadly.
https://www.cbc.ca/news/canada/calgary/calgary-transit-ctrain-death-fatality-councillor-safety-pedestrian-1.4866441
Dixon
” I think you are onto something, here Roy, but as so often in Climate, the averaging is masking the true picture. It might be insightful to cherry pick a couple of cities as case studies and contrast them. ”
*
Did you read Roy Spencer’s previous posts, starting with a comparison of Nevada’s UHI bomb Las Vegas to its extreme UHI antithesis Winnemucca?
I did a lot of such comparisons, using Roy Spencer’s period: 1973-2022, and the pretty raw data from GHCN daily.
Cities of a size similar to Las Vegas but located in quite different environmental contexts can behave quite differently wrt the UHI suspected high minima at night; not only those at sea like Seattle or Boston, but also inland cities like Oklahoma or Nashville.
What could we say when comparing e.g. Milwaukee, Wisconsin, located at a Great Lake and in the middle of an extremely built-up region
https://tinyurl.com/3rvcfkj4
to this isolated Tucson, Arizona, half in the desert?
https://tinyurl.com/mrjrb6kn
They show the same TMIN trend: ~ 0.45 C / decade.
Conversely, some of the selected stations that are located ‘in the middle of nowhere’ have shown a higher increase in temperature minimums than those located in supposedly ‘UHI-suspicious’ corners.
*
Here are a few TMIN trends for cities of Las Vegas’ size, together with the trends for small corners located up to 150 km away, and at a similar altitude. I spare us the SEs.
USW00014739 42.3606 -71.0106 3.7 MA BOSTON LOGAN INTL AP: 0.21
vs.
USC00274399 42.9389 -72.3247 155.8 NH KEENE: 0.09
USW00023169 36.0719 -115.1633 649.5 NV LAS VEGAS MCCARRAN AP: 0.97
vs.
USC00262243 36.4381 -115.3600 888.2 NV DESERT NWR: 0.43
USW00014839 42.9550 -87.9044 204.2 WI MILWAUKEE MITCHELL AP: 0.45
vs.
USC00116661 41.6653 -88.9781 271.0 IL PAW PAW 2S: 0.14
USW00013897 36.1189 -86.6892 182.9 TN NASHVILLE INTL AP: 0.33
vs.
USC00150422 36.8978 -86.1247 187.5 KY BARREN RVR LAKE: 0.29
USW00013967 35.3889 -97.6006 391.7 OK OKLAHOMA CITY WILL ROGERS AP: 0.27
vs.
USC00344001 34.2333 -97.4203 274.9 OK HEALDTON 3 E: -0.14
USW00024233 47.4444 -122.3139 112.8 WA SEATTLE TACOMA INTL AP: 0.22
vs.
USC00456846 47.8092 -122.9136 37.5 WA QUILCENE 2 SW: 0.10
USW00023160 32.1314 -110.9553 776.9 AZ TUCSON INTL AP: 0.44
vs.
USC00021330 32.2617 -110.3481 973.5 AZ CASCABEL: -0.07
*
Interesting was Dallas:
USW00013960 32.8519 -96.8556 134.1 TX DALLAS LOVE FLD: 0.26
vs.
USC00344001 34.2333 -97.4203 274.9 OK HEALDTON 3 E: -0.14
because that city is with over 2.5 M inhabs way bigger than all those I listed above.
*
Thus, imho: in the sum, averaging doesn’t mask the ‘true picture’.
Rather, it seems to me that a few individual, very different trees manage to hide the entire forest quite well. The remark applies to both the big cities and their small counterparts nearby.
*
Personally – this is of course a layman’s opinion – I’m convinced that the averaging path followed by Roy Spencer is the better one.
Where you made a big point, however, is when you write that wind should be taken into consideration in addition to temperature.
I would add that precipitation, and vegetation in and around the observed cities, might matter as well.
As would any change in drainage locally.
Another comparison of GHCN daily stations:
– the USCRN stations available on ‘GHCN daily’
with
– all ‘GHCN daily’ stations located in the near of each USCRN station, within a cell of e.g. 1 degree of latitude and longitude and having sufficient data for anomaly construction wrt 2016-2020, the period in which a maximum of USCRN stations were active.
{ There are other anomaly construction methods, allowing all stations to be used even if they don’t have sufficient data to construct an own baseline wrt the reference period, e.g. alignment techniques based on ordinary least squares. I suspect them to generate time series however containing exactly those automatic correlations among stations which I want to avoid. }
*
We compare 133 pristine USCRN stations (with the probably least UHI factor of all stations in the US), with 920 arbitrarily selected stations, of which 92 are located in airports.
{ Unfortunately, the comparison is limited to the period for which sufficient USCRN data is available: 2007-2022. It’s a pity that the USCRN network was built after 2000 and not since e.g. 1979. }
*
The comparison charts
TMIN
https://drive.google.com/file/d/13LI1iSprcVKHaayCuzKWSI0bT6_RayAC/view
TMAX
https://drive.google.com/file/d/1___NSInXjjJ7vXT5rzcCsGF6iGccaH9U/view
The trends in C / decade, TMIN / TMAX:
USCRN stations: 0.47 / 0.49
Nearby stations: 0.60 / 0.43
Nearby stations without the 92 airports: 0.55 / 0.36
The 92 airports alone: 0.62 / 0.58
All that isn’t very surprising.
” All that isnt very surprising. ”
Except the fact of course that the TMAX average for the nearby stations is lower than that for the USCRN locations.
Does anyone have an explaining idea?
“Another comparison of GHCN daily stations:”
***
You are the only one using GHCN station data. NOAA, GISS, and Had-crut don’t use it.
Robertson
” You are the only one using GHCN station data. NOAA, GISS, and Had-crut dont use it. ”
*
Of course they do, you ignoramus. You wouldn’t even be able to look at their common source because you totally ignore where it is.
Let alone would you be able to understand that I don’t use the same GHCN data they do use.
You behave exactly like the bulls in the Spanish corridas: what is for them the red muleta is in your case ‘GHCN’.
*
You are so ignorant and inexperienced that you understand nothing of what you are trumpeting about.
But alas, you can’t stop trumpeting about all that you ignore and will ignore forever – because you never learn.
Winter will not end soon in western Canada and the US, as well as in the Midwest.
https://i.ibb.co/rcyTtyp/gfs-hgt-trop-NA-f120.png
Winter has officially ended in the Vancouver area. The weather is definitely Spring-like. We usually have a transition month in March where the weather can remain cool, but there is a big difference between that and the worst of Winter weather.
The flowers are coming out but the fruit tree buds are not out yet. Definitely Spring, albeit a cooler than normal Spring.
Yesterday I went for a lengthy walk with my jacket open and no toque (wool hat). Did not feel cold at all whereas in Winter I cannot dress like that. In fact, I felt a bit too warm since under my jacket I was still dress in multi-layers for the Winter cold.
How is the weather in Poland?
The same as in Vancouver.
Glad to hear that. Thought it might be a bit colder, being inland.
Just a random thought to add to the pot, but there havTHEY’D. massive improvements in our ability to insulate residential,commercial and municipal buildings which might play a role in reducing the UHI when plotted against the PD.
To set against higher average internal temperature in the last 100 years.
Yes, better insulation, tighter construction, but also use of more efficient fuels.
I don’t think insulation or heat transfer has anything to do with UHI. I think it is artificial surfaces versus natural surfaces. Cities are hotter because of concrete and asphalt and less shade versus grass, water, and soil and more shade. That’s why I think the less difference now is due to urban sprawl. The rural areas look more like the urban areas now than in the past.
Any analysis that excludes energy inputs to drive cars, heat homes, light streets at night, etc., falls short of comprehensive IMHO. All of these depend on population density.
stephen,
As far as I know, a good absorber is also a good emitter. It makes no difference to the fact that all heat received during the day is lost during the night.
It makes no difference whether buildings are insulated or not, all heat generated within by any means, is eventually radiated to space, but may take longer than one night. For example, the heat from a steel smelting works may persist for some time, after the works is closed down, and the occupants leave.
However, in a fairly short space of time, all the equipment will be in equilibrium with the surrounding environment – no hotter, no colder.
If the human race suddenly vanished, all the works of man would reach temperature parity with the rest of the world which surrounds them. That’s my assumption, anyway.
Nothing to do with CO2, or other mad SkyDragon cult beliefs.
swenson…”As far as I know, a good absorber is also a good emitter”.
***
Claes Johnson wrote a good article on that re blackbodies. I can dig it up if you’re interested.
Swenson,
Yeah, I agree. Mathematics says CO2 follows temperature, not the other way. However, if they had a temperature station in a field 40 years ago and now it is adjacent to a parking lot, you have UHI. UHI has nothing to do with GHE. It just means they’re not doing a good job of comparing temperature historically.
With better insulation it will take less heat to heat the living or work spaces, and thus less heat to ultimately dissipate into the environment. With insulation techniques improving greatly over recent decades this could be a partial explanation so to diminution in Dr. Spencer’s chart over time.
OK, Don.
Don’t what happened above but the second line should read ” there have been massive improvements “.
I wish the was a way to make corrections to comments after submission and one finds out that autocorrect reared its ugly head!!!
dan…whereas insulation is better and we are now using metal foils to block radiation, the heat has to escape eventually. For example, radiation blocked by metal foil will warm the foil and it will conduct heat albeit more slowly. That’s the secret with insulation, it can slow heat dissipation but it can’t stop it.
The insulation makes our heating sources more efficient since the homes don’t cool as quickly and the furnace is not needed as often. However, Newton’s law of cooling tells us the rate of heat dissipation is proportional to the difference in temperature between the interior walls and the exterior walls. In regions where that differential is larger, heat will escape faster despite the insulation.
I don’t know how that will affect the UHI effect.
Don’t what happened above but the second line should read ” there have been massive improvements “.
I wish there was a way to make corrections to comments after submission and one finds out that autocorrect reared its ugly head!!!
Is this the end of La Nina?
https://www.tropicaltidbits.com/analysis/ocean/nino34.png
Maybe…but as Arnold said in The Terminator…Ah’ll be back”. And there’s no reason to think the current LN will be replace by an EN.
It seems that for some extremely fixated people, NOAA is only good at ENSO when it shows La Nina:
https://www.cpc.ncep.noaa.gov/products/CFSv2/imagesInd3/nino34Mon.gif
Thus, the data and, of course, the forecast based on it are 100 % faked.
Snowstorm in the Dakotas.
https://i.ibb.co/qBFfVxM/Zrzut-ekranu-2023-03-21-192015.png
My immediate impulse upon seeing this graph was to plot the logarithm of the population density change, giving a picture of what happens with percentage change. When you do this, you do NOT get a linear function. Then the relationship is reversed and you get a greater increase in temperature with constant percentage increase in population for high population densities.
Worth looking closer at.
Onar m,
There are many non-linear variables involved. Apparent correlation may exist for a period, and then vanish, to the researcher’s consternation.
A very minor example may be an industrial plant such as a steelworks, producing vast amounts of waste heat, and serviced by a substantial population who exist on the edge of poverty, using little energy themselves. A similar number of people elsewhere in a city, may consume vastly more energy, resulting in greater per capita waste heat production.
Over time, a concentration of say, steel plants, may close or relocate, and the socio-economic circumstances of cities, states, or countries may wax and wane, with consequent impacts of on the various “heat island” effects.
Dissecting the past may lead to scientific illumination, or it may not. It all depends on who does the dissecting, I guess. I support the efforts of people like Dr Spencer, who seem to be capable of asking “I wonder why that is?”, and changing their views if they find new facts.
Heavy rainfall in central California.
https://i.ibb.co/qnx2KMx/Zrzut-ekranu-2023-03-21-222502.png
https://i.ibb.co/sRYry5D/Zrzut-ekranu-2023-03-21-223326.png
Risk of Giant Asteroids Hitting Earth Could Be Worse Than We Realized
https://www.sciencealert.com/risk-of-giant-asteroids-hitting-earth-could-be-worse-than-we-realized
“Our planet hides its scars well. It’s a shame, actually, as evidence of previous asteroid strikes might help us better plan for the next catastrophic impact.
In fact, NASA’s Goddard Space Flight Center chief scientist, James Garvin, thinks we might have been misreading traces of some of the more serious asteroid strikes that have occurred within the past million years.”
https://www.mammothmountain.com/on-the-mountain/mammoth-webcam
What people like Palmowski never tell you:
” Mammoth Mountain Ski Area is a large ski resort in the western United States, located in eastern California along the east side of the Sierra Nevada mountain range in the Inyo National Forest.
Mammoth has more than 3,500 acres (1,420 ha) of ski-able terrain, serviced by 28 lifts. The area has 3,100 ft (940 m) of vertical, rising to an elevation of 11,059 ft (3,371 m), and enjoys a long ski season. ”
No wonder.
The pot is calling the kettle black.
What you alarmists never tell us is that no thermometer record exists for the mountains in California. There are 3 reporting stations in California used by NOAA and all of them are on the Pacific Ocean where it’s toasty and warm.
” There are 3 reporting stations in California used by NOAA and all of them are on the Pacific Ocean where its toasty and warm. ”
*
Robertson is so incredibly stupid and ignorant that he endlessly and gullibly replicates the blog notes of his authority E.M. Smith aka chiefio, one of the most incompetent ‘climate’ bloggers known up to date.
Robertson should ask John Christy how many ‘reporting stations in California used by NOAA’ he himself uses when performing his accurate jobs like e.g. that described in
https://www.drroyspencer.com/wp-content/uploads/Record-Temperatures-in-the-United-States.pdf
*
It’s simply impossible to be as dumb as is Robertson.
Apos: I pasted the wrong link. This one is a bit better:
https://web.archive.org/web/20210112005636/https://www.drroyspencer.com/wp-content/uploads/Record-Temperatures-in-the-United-States.pdf
Here is a list of USHCN stations located in California, and which reported data from 1895 till 2020/1/2:
USC00044259 33.7086 -116.2153 -6.4 CA INDIO FIRE STN HCN
USC00047902 34.4167 -119.6844 4.9 CA SANTA BARBARA HCN
USC00046826 38.2578 -122.6078 6.1 CA PETALUMA AP HCN
USC00046074 38.2778 -122.2647 10.7 CA NAPA STATE HOSPITAL HCN
USC00042294 38.5350 -121.7761 18.3 CA DAVIS 2 WSW EXP FARM HCN
USC00047916 36.9878 -121.9994 21.3 CA SANTA CRUZ HCN
USC00043161 39.5092 -123.7567 37.5 CA FT BRAGG 5 N HCN
USC00040693 37.8744 -122.2606 94.5 CA BERKELEY HCN
USC00046730 35.6278 -120.6856 222.5 CA PASO ROBLES HCN
USC00046719 34.1483 -118.1447 263.3 CA PASADENA HCN
Here it is very certainly toasty and warm during the winters:
USC00049490 40.7367 -122.9403 627.3 CA WEAVERVILLE HCN
USC00049866 41.7031 -122.6414 825.7 CA YREKA HCN
USC00047195 39.9367 -120.9475 1042.4 CA QUINCY HCN
USC00048702 40.4167 -120.6631 1283.8 CA SUSANVILLE 2SW HCN
USC00041614 41.5300 -120.1792 1428.9 CA CEDARVILLE HCN
Especially in Cedarville:
USC00041614 52-23 1990 12 22 -33.3
USC00041614 52-23 1962 1 23 -30.6
USC00041614 52-23 1990 12 23 -30.0
USC00041614 52-23 1932 12 12 -28.9
USC00041614 52-23 1937 1 8 -28.9
USC00041614 52-23 1949 1 25 -28.9
USC00041614 52-23 1972 12 9 -28.9
USC00041614 52-23 1990 12 24 -28.9
USC00041614 52-23 1932 12 11 -27.8
USC00041614 52-23 1937 1 21 -27.8
*
Robertson est vraiment le mec le plus bête et le plus incompétent que l’on puisse imaginer.
This is not the end of the rainfall in California.
https://i.ibb.co/1MP4jCB/mimictpw-epac-latest.gif
test
An interesting video with Mark Steyn, the Mann slayer, speaking at the Heartland Institute. Thought Swenson in particular might enjoy it.
Roy gets mentioned by Steyn.
https://www.youtube.com/watch?v=6bARjABDqok&ab_channel=TheHeartlandInstitute
Also, an interesting article revealing the complexity of the case. Don’t know if the Steyn v. Mann case has been settled but certainly, Mann lost his case against the Canadian newspaper for whom Steyn writes. Maybe someone could fill me in on the case status.
https://reason.com/volokh/2021/07/27/judge-strikes-all-of-michael-manns-expert-witnesses-from-libel-suit/
To show what a ninny Mann is, he called Naomi Oreskes as an expert witness. She is a historian who think consensus is a valid form of science. When the judge asked her for her credentials, she claimed she reads and thinks about what is presented.
Duh!!!!
Its a problem. Too many don’t read or think about what is presented.
An hipothesis to explain the evolution of the curves over time may be the following:
Assuming June is a month with little heating being used, the energy that warms urban areas basically comes from losses in different machinery, whatever kind it is (termic, electric, vehicles, industrial machines, chemical processes, etc.). If that is the case, as the different machines become more efficient by design, lowering energy consumption, (think about cars, for instance), the curves may look similar but with the logical lower energy being lost due to better efficiency in the machinery.
What I find shocking is that the extension of use of Air Conditioning should show in the last decades, in my opinion, but apparently it lools to be overshadowed by the improvements of energy efficiency after the oil crisis of the last 40-50 years.
The same comparaison in winter months may provide food for thought by comparaison, although heating demand in populated areas should be inversely proportional to global temperatures.
Is California ready for more fronts from the northwest?
https://i.ibb.co/Lvt2fxK/mimictpw-namer-latest.gif
Solar activity is inversely proportional to galactic radiation. A graph of galactic radiation from Oulu allows comparison of solar activity in the 24th and 25th solar cycles.
https://i.ibb.co/vmVRMYr/onlinequery.png
… and what exactly are you trying to tell us about SC25 vs. SC24 with this Oulu NC chart?
Speak for yourself alarmist troll, there is no ‘us’, unless you’re a skeptic.
A disgusting Russia and Putin sucker like the ignorant Robertson supertroll, who intentionally misrepresents the Russian aggression against Ukraine – like do thousands of ultraright wing pro-Russian posters everywhere in the world – doesn’t impress me at all.
Binny,
You wrote –
“A disgusting Russia and Putin sucker like the ignorant Robertson supertroll, who intentionally misrepresents the Russian aggression against Ukraine like do thousands of ultraright wing pro-Russian posters everywhere in the world doesnt impress me at all.”
Don’t you believe in freedom of speech? Are people only allowed to say things which “impress” you?
Good luck with enforcing your views. I’m laughing at you, because I think you are delusional – what are you going to do about it?
“…who intentionally misrepresents the Russian aggression against Ukraine …”
***
As opposed to the abysmally ignorant Binny, who has not the slightest idea about how the Ukrainians, claiming to be a democracy, allowed armed thugs to run off a democratically-elected president.
Why don’t you talk about that?
In five days, another cold low over California and more snow in the mountains.
https://i.ibb.co/YhQxSdD/gfs-o3mr-250-NA-f120.png
El Nino’s poor development prospects.
http://www.bom.gov.au/cgi-bin/oceanography/wrap_ocean_analysis.pl?id=IDYOC006&year=2023&month=03
Horribly poor, indeed, every El Nino fan will be disappointed.
http://www.bom.gov.au/climate/enso/#overview-section=Sea-surface
https://i.postimg.cc/L8Bg5mdV/sst-forecast-anom-glb-month3-20230311-hr.png
https://www.tropicaltidbits.com/analysis/ocean/cdas-sflux_ssta7diff_global_1.png
Blindsley Hood
What are seven little days?
Is this information
https://www.cpc.ncep.noaa.gov/products/CFSv2/imagesInd3/nino34Mon.gif
no longer of interest for you, because it no longer fits your opinionated narrative?
“What are seven little days?”
A week (or 1/52 of a year).
Thank you for answering my question with a 100% ‘yes’.
A week is a long time in …. climate.
Bunny,
You wrote –
“Is this information
https://www.cpc.ncep.noaa.gov/products/CFSv2/imagesInd3/nino34Mon.gif
no longer of interest for you, because it no longer fits your opinionated narrative?”
When you didnt receive an answer to your gotcha (you presupposed an answer, showing that you were not interested in anybody elses), you wrote –
“Thank you for answering my question with a 100% yes.”
You are obviously a fanatical SkyDragon cultist. Do you wonder why some people seem to be laughing at you?
#2
And Flynnson cant stop boring others with his eternal blah blah blah.
Dementia, Flynnson?
Bunny,
You wrote –
“#2
And Flynnson cant stop boring others with his eternal blah blah blah.
Dementia, Flynnson?”
No idea of the role of the GHE in four and a half billion years of planetary cooling, I surmise?
Tut, tut. You might as well resort to blaming others for your boredom, and inability to accept reality!
Carry on.
I read upthread:
” Solar activity is inversely proportional to galactic radiation. ”
*
Absolutely correct. Conversely, galactic radiation is inversely proportional to solar activity.
Easily shown by the following comparisons of Sun’s SC25 to its predecessor SC24.
1. SILSO’s Sun Spot Number
https://drive.google.com/file/d/1j0FYKSiGeJqs8aGnxvaGTbLqB5xyY8a_/view
2. Space Weather CA Solar flux F10.7cm
https://drive.google.com/file/d/1TyxS7QLEugwgpo0v1Kqinxn6UxndLAif/view
and…
3. Inverted Oulu Neutron Count
https://drive.google.com/file/d/11D3DJ_SPs7rwrnKFa-OHXCMxxirAwBe-/view
Sources
https://tinyurl.com/2p8646z6 (d~c syndrome)
https://www.spaceweather.gc.ca/forecast-prevision/solar-solaire/solarflux/sx-en.php
https://cosmicrays.oulu.fi/
Bindidon,
What is the relationship to UHIs?
Or maybe weather in general? I’m sure you had a reason for your comment, but I can’t see what it is.
Do you fell like being helpful, or not?
Flynnson
” Do you fell like being helpful, or not? ”
That’s the best question you’ve ever asked.
Why don’t you idiot ask Palmowski the same thing? He was the origin of my comment.
*
What does your endless, megastoopid ‘4.5 billion years’ blah blah have to do with all what is discussed here, Flynnson?
You are exactly of the same vein as Robertson: a poorish mixture of boasting arrogance and ignorance.
Vous êtes, après Robertson, le deuxième crétin du village: de grosses chaussures, et une tête comme un petit pois.
Arrêtez enfin de m'emmerder, Flynnson!
Binny,
I take it that you have no interest in being helpful, then. Colour me unsurprised.
As to your annoyance that the Earth has cooled for four and a half billion years, GHE notwithstanding, don’t blame me for pointing out that you cannot even describe this “greenhouse effect” which seems to simultaneously cool and heat the planet!
As you indicate, you are not prepared to explain this seeming contradiction, and characterise anybody seeking your help as being “exactly of the same vein as Robertson: a poorish mixture of boasting arrogance and ignorance.”
Not terribly helpful, but you aren’t interested in actually helping anybody to understand anything at all, are? Or maybe you can’t help anyway, being completely bereft of understanding about both facts and the physics involved.
If you feel “bothered” by me, you might need a self-esteem transfusion. Maybe you have a fragile personality, and feel threatened by reality? You could always get some pacifying psychobabble from a fellow delusional SkyDragon cultist. They will reassure you that fantasy is to be preferred to fact, and the the models show indisputably that the Earth has not cooled for four and a half billion years, that the average of weather (climate) controls weather, and that you are wise, powerful, and respected.
[laughing at dimwit who imagines that I care about him being “bothered”]
Once again, Flynnson’s 100 % redundant, egomaniacal trash.
You are such an incompetent boaster, and above all, one of those who would never contribute in a constructive way to anything scientific on this blog.
All what interests you is to permanently distort, disturb, destroy and discredit any discussion that doesn’t fit your dumb old man ego.
Feel free to continue posting your arrogant, posh, smugly 5 o’clock tea time English nonsense! Some even might secretly enjoy.
Binny,
Well, that was informative, wasn’t it?
I rather like your “Feel free to continue posting your arrogant, posh, smugly 5 oclock tea time English nonsense!”
I don’t need your permission – but you already know that, I guess.
Presumably, you have some shatteringly insightful contribution to make about Dr Spencer’s curiosity about the extents and causes of temperature increases which seem to be unrelated to any supposed “greenhouse effect”?
I don’t blame you for keeping your knowledge to yourself – you definitely wouldn’t want any arrogant, posh, 5 o’clock tea tine English speaker stealing your intellectual property, would you?
Only joking – you know nothing helpful, but feel terrified that people might realise that you are just another clueless SkyDragon cultist, who can’t even describe the “greenhouse effect”!
So carry on exercising your freedom to say anything you like. I do.
And Flynnson can’t stop boring others with his eternal blah blah blah.
Dementia, Flynnson?
Bunny,
You wrote –
“And Flynnson cant stop boring others with his eternal blah blah blah.
Dementia, Flynnson?”
Is that really the best you can do?
Try harder, fool.
U.S. temperatures (C) as of March 26, 2023.
https://i.ibb.co/v4zrgVF/Zrzut-ekranu-2023-03-26-161353.png
That night, Arctic air will begin to flow into the UK, France and Germany, bringing severe cooling and snowfall. The beginning of April in central Europe will bring below-average temperatures.
Minus 1 C in Berlin last night! Our fingers almost froze. But only almost :-{)
The strong ripple of the solar wind helps explain what is happening now with the circulation in the northern hemisphere. After a prolonged period of weaker solar wind (large increase in galactic radiation), the circulation is blocked. Of course, the wave in the troposphere is shifted by about two weeks. Now the strength of the solar wind has increased again, so the western circulation will unlock in about two weeks.
https://i.ibb.co/ncR9Rrf/onlinequery.png
The north Pacific low is again dropping toward California.
https://i.ibb.co/J5WGnC0/Zrzut-ekranu-2023-03-27-090313.png
rlh…re 7 days being 1/52 of a year.
Do you realize that is a repeating fraction of a sort?
1/52 = 0.019 230769 230769 230769 230769 23077
The calculator rounded it off to a repeating 23077.
Who’da thunk?
It gets stranger. There are 52 weeks in a year @ 7 days a week, or so I’ve been told all my life. So, 7 x 32 = 364 days and that’s a repeater too. 1/364 = 0.00 274725 274725 274725 274725 274725
Hmmmm. Seems they mislead us since there are 365.2425 days in a year which is actually a mean over 400 years.
They normally use 365 days which is a repeater too…
1/365 = 0.00 27397260 27397260 27397260 273973 (rounded off)
The Julian year of 365.25 days is used in astronomy, according to wiki. Not a repeater.
365.25 days is just a close approximation.
“The tropical year is the period of time required by the sun to pass from vernal equinox to vernal equinox. It is equal to 365 days, 5 hours, 48 minutes, and 46 seconds, or 365.2422 days. The tropical year is used to keep track of seasons, planting, and harvesting.” and climate.
https://www.grc.nasa.gov/www/k-12/Numbers/Math/Mathematical_Thinking/calendar_calculations.htm
richard…the conundrum I was pointing out, besides the repeating decimals, is that we have 7 day weeks and 52 weeks. That adds up to 7 x 52 = 364 days. During leap years we should have 365 days.
So, what’s the reality and what’s the mathematical inference? Do we have a full 52 weeks/year or not? I don’t recall any weeks being cut short.
Actually, I just counted them. There are 52 weeks in 2023 plus an extra day in December. The 52nd week ends on December 30th and the 31st is an extra day.
https://www.betacalendars.com/yearly-calendar
Therefore it should be 7 x 52 + 1.
But that should mean 2024 begins on the 31st of December. but it doesn’t, it always begins January 1st. Who created that extra day?
Look up the tropical year (see above).
Surely the obvious reason is that the biggest cooling in rural areas is not from IR Radiation, but from transpiration and the subsequent removal of watery convection currents.
Plants remove water from deep under the soil, something concrete does not have the ability to do.
The conversion of rural to urban usually starts off by removing trees, which have a bigger ability to suck up water than other plants. This explains the initial effect on temperature.
Hence any local change in drainage has a BIG effect.
So growing trees in old urbanized areas (as observed) increases evapotranspiration cooling again.
Maps show how Californias snowfall compares with past winters
https://www.sfchronicle.com/projects/2023/california-snowfall-maps/?fbclid=IwAR2GRZRpZg1kzetFgtv14jtL3-M0ZYQr1uTXKreA2w35HR_hpsCZP49ycTs
Winter in the Midwest.
https://i.ibb.co/RBJk5Tz/Zrzut-ekranu-2023-03-27-230847.png
I can suggest these not very often known facts.
For the first periods, there was a lot more real rural. As you know, the temperature in summer are lower within an area with a lot of trees. It is due to the fact that the trees are evaporating water pumped in the soil. Depending the size of the trees, it can be hundreds of liter per day. But, contrary to what is usually believed, the role of this evaporation is not to be the engine of the pump, but is to concentrate sugar from photosynthesis and minerals from the soil. When the CO2 increase, the need to evaporate to concentrate decrease (more sugar produced) and the trees are closing a bit their stomates to reduce evaporation. Some kind of trees are reducing the number of stomates. This is well known : the more CO2, the less the water needed.
Thus, a century ago, with less CO2 in the atmosphere, the evaporation needed to obtain the good concentration of sugar was higher. More water evaporated, = lower temperature in rural zones. And thus, a bigger difference of temperature between the 2 different zones.
Thank you for your comment, I never really thought of the fact you describe.
But, as we say in my native tongue:
” Cela coule de source. “
More snow in California.
https://i.ibb.co/x1ShZmG/Zrzut-ekranu-2023-03-28-083549.png
Threat of flooding in Northern California.
https://i.ibb.co/SVHSGnM/Zrzut-ekranu-2023-03-28-170454.png
Autumn in Australia.
https://i.ibb.co/MfsvyqS/Zrzut-ekranu-2023-03-28-174756.png
Another foots of snow in the Sierra Nevada.
https://i.ibb.co/M88F8zb/Zrzut-ekranu-2023-03-28-224421.png
Roy Spencer
In your previous thread
” Urbanization Effects on GHCN Temperature Trends, Part II: Evidence that Homogenization Spuriously Warms Trends ”
you mentioned a GHCN station subset consisting of 881 stations:
” In Fig. 5 we see that the 881 stations with no trend in urbanization during 1975-2014 have an average 0.011 C/decade warmer trend in the adjusted (homogenized) data than in the unadjusted data. ”
Would it be possible to obtain a link to a text or pdf file containing this station list?
I suppose that Mr Christy and you used GHCN V4
https://www.ncei.noaa.gov/pub/data/ghcn/v4/
By using the station ids, e.g. of
FRM00007181 48.5830 5.9550 337.1 OCHEY
I could easily find all the 881 stations in the GHCN daily station set.
*
The reason for asking about the list is that I would like to replicate the same thing I did for the USCRN stations recently, but now using your 881 stations instead: to compare their TMIN and TMAX anomaly time series with those of all stations that are within the same 1 degree grid cell.
I would enjoy this being possible.
Merci d’avance.
The stationary upper low is located off the northern coast of California. Secondary lows form on its periphery and operate off the west coast of the US and into California.
https://i.ibb.co/cyyC9hX/Zrzut-ekranu-2023-03-29-084428.png
My skier buddy told me there are 63 feet of snow in California. He has a video from when he was out there recently diving from a third-floor balcony of their condo into the snow.
Snow cover in the northern hemisphere as of March 29, 2023.
https://i.ibb.co/QfbMzpj/gfs-npole-sat-seaice-snowc-d1.png
ren…the map is a bit misleading. I think they may be showing higher elevation along the coastal mountains near Vancouver, there is absolutely no snow at sea level anywhere in the vicinity of Vancouver. That extends at least 100 miles inland along the US border.
If you play with this site you can get all the road conditions in the province of BC. Using the Legend, turn on the camera and you can watch the snow conditions over a full day. In Kamloops, which is 250 km inland, there is barely any snow on the ground. I doubt if you’ll see any snow between Vancouver and Kamloops at lower levels.
You can check the elevation of each point on the map.
https://drivebc.ca/directions.html?a=Vancouver,%20BC,%20Canada&b=Kamloops,%20BC,%20Canada&sr=1
Winter tires or chains are required on most routes in British Columbia from October 1 to April 30. For select highways not located through mountain passes and/or high snowfall areas, tire and chain requirements end March 31.
https://images.drivebc.ca/bchighwaycam/pub/html/dbc/109.html
Sorry.
https://earth.nullschool.net/#2023/04/01/2300Z/wind/isobaric/850hPa/overlay=temp/orthographic=-124.52,48.66,709
500 hPa.
https://earth.nullschool.net/#2023/04/01/2300Z/wind/isobaric/500hPa/overlay=temp/orthographic=-124.52,48.66,709
SOLAR MINIMUM UPDATE
In the early hours of 11 March, pummeling rains wore down a levee on the Pajaro River, unleashing a torrent. Barajas, 50, had escaped with her daughter and grandson under the blare of sirens. But the floods swallowed the town and perhaps their future here.
https://www.theguardian.com/us-news/2023/mar/27/california-farm-workers-pajaro-california-flooding
https://www.latimes.com/california/story/2023-03-20/a-long-history-of-racism-set-the-stage-for-pajaro-flooding
Thanks.
You’re welcome.
That river has been flooding for millions of years, and that is why the farm fields are so rich. Other news outlets have correctly reported that the levee did receive some maintenance work recently. Nobody is forced to live where the property is cheap, or prevented from buying more expensive property in the hill areas. The county and the Red Cross have provided assistance to the people who were displaced. News outlets often leave out relevant facts by incompetence, but intentionally distorting the story is something called propaganda.
“Nobody is forced to live where the property is cheap, or prevented from buying more expensive property in the hill areas.”
If money is no object of course.
Let them eat cake!
> Other news outlets have correctly reported that the levee did receive some maintenance work recently.
You can thank Richard for having preempted that canard, TimS:
https://www.latimes.com/california/story/2023-03-20/a-long-history-of-racism-set-the-stage-for-pajaro-flooding
This is pay-walled from Jan. 10, but it clearly states that repairs where made.
https://lookout.co/santacruz/watsonville/story/2023-01-10/watsonville-residents-watch-nervously-as-pajaro-river-continues-rising
“The work, known as a seepage berm, is a temporary fix to add support and structure to the levee system until planned a $400-million levee replacement starts construction, which is not expected until 2025…
…Rodriguez lives just a couple of blocks away in the town of Pajaro. He was there, in fact, in 1995, when a ruinous flood from a breach in the river levee struck Pajaro.”
You forgot this bit:
I wonder why.
Wondering Wee Willy,
You wrote “I wonder why.”
Too much water, perhaps? Are you a complete fool, or still aiming for completeness?
Mike Flynn,
I doubt TimS forgot the relevant bit because of too much water.
Please be kind to him.
Wondering Wee Willy,
You wrote –
“Mike Flynn,
I doubt TimS forgot the relevant bit because of too much water.
Please be kind to him.”
Who cares what you “doubt”? Nobody that you can put a name to, obviously.
Do you think that anybody really values the opinions of idiotic SkyDragon cultist like you? I doubt it, but feel free to provide evidence to the contrary, dimwit.
Carry on.
Still playing dumb, Mike Flynn?
This one is more than 2 years old, emphasized the need for repairs and the money allocated, and leaves out the racism garbage.
https://santacruzlocal.org/2021/01/26/long-awaited-flood-control-project-to-start-in-watsonville-pajaro/
We should focus on peoples lives first before some of the other considerations, Supervisor Zach Friend said during the meeting. These levees protect a lot more than agricultural land. They protect two federally disadvantaged communities in Watsonville and Pajaro that rely on the lowest level of flood protection of any federally funded project in the state and one of the lowest in the United States. Friend also mentioned historic inequity in levee projects across areas with different income levels. Federal money bolstered Santa Cruz levee projects on the San Lorenzo River since the 1970s.
We should recognize that this project preserves the life and safety of the most disadvantaged within our respective two county communities, not to mention their lifelines through the economic component of agriculture, Friend said.”
[Supervisor Zach Friend] We should focus on peoples lives first
[TimS] Nobody is forced to live where the property is cheap
Woebegone Wee Willy,
Rather than trying to troll, why don’t you put some effort into explaining the role of the indescribable “greenhouse effect” in the four and a half billion years of planetary cooling, rather than whining about the reality of weather?
I presume it’s because you can’t or won’t. Why so coy, Wee Willy? Has the cat got your tongue, or are you just another delusional SkyDragon cultist?
Do tell.
I tried. We now return to your regularly scheduled trolling.
“racism garbage”
Thus speaks a Trump supporter.
Mike Flynn,
Here you go –
https://youtu.be/oqu5DjzOBF8
Keep denying you have been spoon fed.
Cheers.
Worthless willard, you keep linking to that same nonsense. Why do you believe hiding behind a “skirt” is going to make you appear smarter?
She promises NO gobbledygook, but proceeds to wrap blah-blah around “arm-waving”. THAT is gobbledygook.
I doubt you can identify the “arm-waving”. Prove me wrong.
Pupupupupipupup,
I got a description of the greenhouse effect.
You got NOTHING.
Except perhaps a bunch of banned sock puppets.
Next.
I knew you couldn’t identify the “arm-waving”, Pup. Thanks for the verification.
Reality triumphs over WOKE every time.
And remember, the more childishness in your upcoming comment, the more likely I will not respond.
Puppynoceros,
Here’s you:
https://www.drroyspencer.com/2014/04/skeptical-arguments-that-dont-hold-water/#comment-111700
That was in 2014, silly sock puppet.
Why haven’t you developed better material?
Weird Wee Willy,
Even you are not stupid enough to claim that the silly Sabine Hossenfelder (content creator, musician, and wannabe world-class physicist) has described the “greenhouse effect” in any way that accords with reality, are you?
Go on, tell me how your favourite face-pulling musician explains the role of the “greenhouse effect” In four and a half billion years of planetary cooling? That noise you can hear is me being derisive, you braindead wanker.
You wrote “I got a description of the greenhouse effect.”
And then, presumably, the Chinese or the Russians stole it, and you ain’t got it no more, is that it?
Even Dr Spencer is investigating other reasons for hotter thermometers – involving heat, rather than CO2, it seems. Gee, Willard, even the IPCC seems to be realising that nobody really cares about the rantings of imminent doom, climate catastrophes, and all the rest of the delusional SkyDragon cult nonsense.
You need to pray harder for your miracle.
Mike Flynn,
Are you asking for another sammich?
Try again.
More Nonsense About Greenland
Dave Burton,
CNBC and the Potsdam Institute (PIK) report that:
“Were halfway to a tipping point that would trigger 6 feet of sea level rise from melting of the Greenland Ice Sheet”
https://wattsupwiththat.com/2023/03/31/more-nonsense-about-greenland/
Well, let’s pause, here. Why are we “halfway”.
China. What caused China? Western governments saying they want to reduce CO2 emission.
All they did was increase Global CO2 emissions and more importantly threw away trillions of dollars of the public’s money.
And have opposed nuclear energy and energy from natural gas.
And paid to burn a lot wood. {which is not competitive with Coal, and is dirtier than Coal}.
But to continue:
“Yet weve only gotten an estimated 1.02 to 1.27 C of warming from all that CO2, and its been accompanied by negligible acceleration in sea-level trends:”
This allows for rising CO2 as being the entire cause of warming- which is unlikely. But doesn’t “allow” for CO2 levels from preventing
global average from getting even colder than it was during the Little Ice Age- though unlikely that coldest time in last 5000 years was going to get even colder without the CO2 added. Though might make argument that land changes due to human activity would caused cooling- despite common claim that land changes causes warming- though I would think cutting down forests would cause cooling more than warming- of course using fossil fuel reduced the need to burn
wood and modern home which make wood and use fiberglass insulation
are more energy efficent. Later does mentions:
“Whats more, we know that Southern Greenland was considerably warmer, 1000 years ago, during the Medieval Warm Period. We know that because Norse settlers successfully grew barley there,”
And MWP was not caused CO2 emission. But argument is couldn’t have been more “1.02 to 1.27 C”.
And I would say it was less than .5 C and there natural recovery from LIA. And idea that LIA could have naturally got significantly colder would been too much cooling to expect from the natural gradual cooling which typical when entering a glaciation period.
gbaikie
I do not intend at all to support any alarmism.
But the sentence in your post
” Whats more, we know that Southern Greenland was considerably warmer, 1000 years ago, during the Medieval Warm Period. We know that because Norse settlers successfully grew barley there… ”
is simply wrong. All Nordic people knowing about their Viking past can’t stop laughing at such nonsense.
Please read e.g.
Study Undercuts Idea That ‘Medieval Warm Period’ Was Global
https://www.earth.columbia.edu/articles/view/3266
and therein
Glacier maxima in Baffin Bay during the Medieval Warm Period coeval with Norse settlement
Nicolás E. Young & alii (2015)
https://www.science.org/doi/10.1126/sciadv.1500806
It’s not the first article I read about this.
*
I anticipate that some guys will once more blather about ‘appeal to authority’. Let them do!
“Study Undercuts Idea That Medieval Warm Period Was Global
https://www.earth.columbia.edu/articles/view/3266 ”
It was at one time, also said, LIA was not global.
And one could also claim, today’s global warming is not global.
But Greenland was warmer, and post was all about Greenland.
I think get some agreement, an increase in the average temperature of
the ocean {which about 3.5 C} is global, and average temperature ocean is thought/considered to increased slightly, so, therefore we can say, we had some global warming.
And if don’t count LIA, it was about 1 C in global average surface
temperature- which I think is agreement with slight increase in average ocean temperature- which was measured.
gbaikie
It seems you haven’t read much more than the article’s summary, have you?
You mean the links in the More Nonsense About Greenland article.
https://www.cnbc.com/2023/03/29/were-halfway-to-a-tipping-point-for-melting-the-greenland-ice-sheet.html
“Key Points
Once people have cumulatively emitted approximately 1,000 gigatons of carbon in total, then the southern part of the Greenland Ice Sheet will melt eventually causing the sea level to rise by almost six feet.
Once humans have cumulatively emitted approximately 2,500 gigatons of carbon in total, the whole Greenland Ice Sheet will eventually melt and the sea level rise would rise by 6.9 meters, or 22.6 feet.
And right now, now we are at approximately 500 gigatons of carbon emissions released.
And other link:
And/or other one:
https://agupubs.onlinelibrary.wiley.com/doi/10.1029/2022GL101827
— Abstract
Understanding the future fate of the Greenland Ice Sheet (GIS) in the context of anthropogenic CO2 emissions is crucial to predict sea level rise. With the fully coupled Earth system model of intermediate complexity CLIMBER-X, we study the stability of the GIS and its transient response to CO2 emissions over the next 10 Kyr. Bifurcation points exist at global temperature anomalies of 0.6 and 1.6 K relative to pre-industrial. For system states in the vicinity of the equilibrium ice volumes corresponding to these temperature anomalies, mass loss rate and sensitivity of mass loss to cumulative CO2 emission peak. These critical ice volumes are crossed for cumulative emissions of 1,000 and 2,500 GtC, which would cause long-term sea level rise by 1.8 and 6.9 m respectively. In summary, we find tipping of the GIS within the range of the temperature limits of the Paris agreement.–
This part:
“Bifurcation points exist at global temperature anomalies of 0.6 and 1.6 K relative to pre-industrial. ”
This is a interesting bit of nonsense.
Is this the reason we are already doomed over next 10,000 years?
gb,
You may have noticed at the end that the authors simply dismiss the fact that their model does not even agree with observed reality ism places. Of course, they then claim that a model which doesnt even model the recent past is to be believed in respect to the unknown future!
Delusional SkyDragon cult nonsense – of no use whatsoever.
Binny,
You wrote –
“I anticipate that some guys will once more blather about “appeal to authority”. Let them do!”
Rather than “Let them do!”, you could write “Let them!”, or maybe “Let them do it!”
“Let them do!” seems grammatically incorrect to me, without explaining my reasons in detail.
You don’t need to thank me – I feel obliged to help out those less gifted than myself, when I can.
Mike Flynn,
You say –
“seems grammatically incorrect to me, without explaining my reasons in detail.”
Are you sure that’s what you wanted to write?
Perhaps you’re just drunk typing.
Cheers.
Whining Wee Willy,
You idiot. If I wanted to write something else, I would have written it.
Were you born stupid, or did you have to be taught?
Try harder – with a little effort, you could achieve complete stupidity.
> If I wanted to write something else, I would have written it.
Are you sure you thought this through, Mike?
That would imply inerrancy.
Revise and resubmit.
Cheers.
Flynnson
Vous tes vraiment le pire crtin au sein de ce blog, un vrai cancre, et un onaniste en plus.
Vous n’tes pas capable de vous exprimer ni dans ma langue maternelle, le franais, ni dans ma langue du quotidien, l’allemand; mais vous avez nanmoins le toupet de me reprocher une minuscule faute lorsque je m’exprime en anglais!
Casse-toi, pauvre con, et va éjecter ton sperme ailleurs, par exemple sur Truth Social. Trump appréciera sans nul doute le degré de ta stupidité, qui n'a d'égal que la sienne.
Oh dear… I forgot the blog’s wonderful scanner.
Binny,
What’s the matter? Too scared to express your thoughts in English?
I try to help someone whose first language is obviously not English, suggesting alternate forms of expression, and what reward do I receive for my selfless effort?
An outpouring of vituperative invective – in a foreign language to boot! Just use something like Google translate, if you find yourself unable to express yourself in English.
Once again, I’ll help you. Here’s the Google translation of your comment –
“Flynnson
You are really the worst crtin in this blog, a real cancre, and an onanist in addition.
You are not able to express yourself either in my mother tongue, French, or in my everyday language, German; but you nevertheless have the stupid thing to blame me for a tiny mistake when I speak in English!
Break up, poor idiot, and go eject your sperm elsewhere, for example on Truth Social. Trump will undoubtedly appreciate the degree of your stupidity, which is matched only by his own.”
You seem to have become rather upset when I made a suggestion before, so I assume you might like to correct the translation – unless you are happy with it. For example, you can no doubt tell me what a “crtin” is. I wouldn’t want you to think I am “denigrating” either you or Google for using a word that I think is just incorrectly spelled.
Maybe you can’t spell “cretin” in French – or English?
I’m curious as to your reasons for thinking I cannot express myself in German or French? Is it because I use English on this blog? Do you believe that command of a particular language demonstrates superior intelligence? I don’t, of course.
If you don’t want any help with your English expression, just say so. I wouldn’t want to be accused of casting pearls before swine, would I?
Have you tried using Google to find a description of the GHE which accords with fact. Maybe you can find one in German or French. There doesn’t seem to be one in English.
Off you go, now. Help me out.
#4
Ah, that stupid, opinionated fake German elementary school teacher, who never has anything to say but keeps all the time pushing for something irrelevant to say.
Always the same boring stuff, along with an increase in aggressiveness: clear signs of a neurodegenerative disease.
I know Flynnson: you will never stop disturbing. As with Robertson, your egomaniacal behavior is beyond your own control, it is too late for you to correct yourself.
#6
Ah, that stupid, opinionated fake German elementary school teacher, who never has anything to say but keeps all the time pushing for something irrelevant to say.
Always the same boring stuff, along with an increase in aggressiveness: clear signs of a neurodegenerative disease.
I know Flynnson: you will never stop disturbing. As with Robertson, your egomaniacal behavior is beyond your own control, it is too late for you to correct yourself.
Does this look like the end of La Nia?
https://earth.nullschool.net/#2023/03/30/0000Z/ocean/isobaric/1000hPa/overlay=sea_surface_temp_anomaly/orthographic=-152.23,8.81,446
Will we be surprised by a polar vortex in the lower stratosphere in the South Pacific?
https://earth.nullschool.net/#2023/04/04/0200Z/wind/isobaric/70hPa/orthographic=-99.29,-33.39,446
When will spring arrive in the North American West and the snowstorms over the Great Lakes end?
https://i.ibb.co/VDXZLQp/mimictpw-namer-latest.gif
Will the drought finally end in California?
https://i.ibb.co/BqwL4cz/gfs-o3mr-200-NA-f072.png
SOLAR MINIMUM UPDATE
In 2023, a mild heatwave had already arrived in parts of Bangladesh by mid-March. Last year, temperatures reached 39C in areas of Rajshahi and Syedpur in July, raising concerns over risk to the countrys agriculture. Along with health implications, extreme heatwaves are driving losses in labour productivity worth around USD 6 billion to Dhakas economy every year.
Those who suffer the most from heatwaves in South Asia are often vulnerable and low-income groups, who may have less access to cooling, and be less able to withstand the impacts of extreme heat on their health and livelihoods. Many people across Bangladesh, India and Pakistan, who share similarities in climate, society and culture, are in the same boat when it comes to battling heatwaves. And while government guidelines may aim to offer help and guidance, support for the hardest hit is far from enough.
https://www.thethirdpole.net/en/climate/surviving-south-asias-heatwaves-part-1-bangladesh/
https://i.ibb.co/4wLNQMm/wolfjmms.png
https://i.ibb.co/x2Vjt5B/EISNcurrent.png
Noice.
Palmowski has an incurable GSM fixation.
This fixation is so strong that he might be able to order Sunny Boy to come back to the CM prediction
https://i.ibb.co/4wLNQMm/wolfjmms.png
and finally marry his beloved Valentina.
Ils vécurent heureux et eurent beacoup d’enfants.
‘beaucoup’ sounds definitely better.
Nous sommes dans le domaine des cyclophiles, Binny.
Pas trop le choix de faire mieux et de laisser braire.
Cest une course, pas un combat de boxe.
https://i.ibb.co/xq5zjTW/onlinequery.gif
Would you want to live in America?
https://twitter.com/jburnmurdoch/status/1641799627128143873?s=20
Americans are fat and getting fatter.
Eighty-five winters ago, skiers were first drawn to Alta by the promise of powder days. Eighty-five years later we are experiencing a special winterone that has delivered storm after storm and the continued promise of powder days. As of March 31st, Alta Ski Area has received 803 inches of snow on the seasonthe snowiest season in the 43-year history of the Collins study plot.
SNOWIEST SEASONS (OCTOBERAPRIL 30TH) SINCE 1980
202223: 803″
198182: 748″
201011: 724″
198384: 708.5″
200708: 702″
200405: 697.5″
200809: 696.5″
198283: 687″
199293: 681.5″
199798: 659.5″
https://www.alta.com/stories/rolling-in-the-deep?fbclid=IwAR1znNsboBuxcRok-GfJbPHYXWeGHfCkoqKhpF23Z32aSRWPe6klogoU0Pc
From April 3, night frost will return to central Europe.
https://i.ibb.co/8ccWJ57/hgt300.webp
I have to admit, the results in Fig. 1 are not what I expected. They show the total UHI effect being stronger in the late 19th Century, and weakening somewhat since then. (Remember, because these results are based upon 2-station differences, these are spatial relationships, that is, for the 1880, 1890, 1900 period there is a greater temperature difference between rural and heavily populated locations than in later decades.)
Its about what I would expect. Improvements in efficiency over time and with density. Later, the trend is probably due in good part from the greenhouse effect and feedbacks (increased plant respiration, dew and fog releasing latent heat near the surface at night).
All the data says the opposite. Land water, soil moisture, etc. are increasing. The trend is probably due in good part from the greenhouse effect and feedbacks (increased plant respiration from CO2 fertilization, increased nighttime humidity from increasing transpiration in rural areas, dew and fog releasing latent heat near the surface at night). More service driven economy in populated areas.
In other news”
https://coloradosun.com/2023/03/30/colorado-snowpack-reservoirs-drought/
Still the drought-strapped Colorado River system will see little storage recovery this year, according to Reclamation, which is forecasting that Lake Powell will see storage at just 32% of capacity by the end of the year. It had dropped to just 23% of capacity last year, prompting ongoing emergency releases from Utahs Flaming Gorge Reservoir to help keep the system from crashing.
122.6 sunspot average for March:
https://www.swpc.noaa.gov/products/solar-cycle-progression
Up from 110.9 for month of Feb. I think April will higher
than March, but not as Jan at 142.3 average for Month.
Feb 1 sunspot is low, should continue being low for awhile,
but by mid April I think will be quite active.
Solar wind
speed: 554.6 km/sec
density: 0.25 protons/cm3
Sunspot number: 61
The Radio Sun
10.7 cm flux: 129 sfu
Updated 01 Apr 2023
Thermosphere Climate Index
today: 22.20×10^10 W Warm
Oulu Neutron Counts
Percentages of the Space Age average:
today: -1.7% Below Average
48-hr change: -0.1%
https://www.spaceweather.com/
“QUIET WEEKEND: Solar activity is low this weekend as multiple sunspots are in decay and pose no threat for strong solar flares. NOAA forecasters say the chance of M- or X-class flares is no more than 1%.”
https://www.swpc.noaa.gov/products/weekly-highlights-and-27-day-forecast
Weekly Highlights and 27-Day Forecast
They are saying:
“Forecast of Solar and Geomagnetic Activity
27 March – 22 April 2023
Solar activity is expected to be at low levels with a slight chance
for (R1-R2, Minor-Moderate) events.”
Solar wind
speed: 582.5 km/sec
density: 1.12 protons/cm3
Sunspot number: 23
The Radio Sun
10.7 cm flux: 125 sfu
Updated 02 Apr 2023
Thermosphere Climate Index
today: 22.20×10^10 W Warm
Oulu Neutron Counts
Percentages of the Space Age average:
today: -1.0% Below Average
48-hr change: +0.8%
A couple smallish coronal holes, with smallest
near equator. Wondering if/when going to have spots
at equator- all little spots now on the sun are currently
not very close to equator- looking/expecting/guessing will get
new spots much closer.
Solar wind
speed: 478.2 km/sec
density: 1.76 protons/cm3
Sunspot number: 54
“New sunspot AR3270 has increased in size 10-fold
since yesterday.”
The Radio Sun
10.7 cm flux: 127 sfu
Updated 03 Apr 2023
Thermosphere Climate Index
today: 22.20×10^10 W Warm
Oulu Neutron Counts
Percentages of the Space Age average:
today: -0.9% Below Average
48-hr change: +0.6%
Arctic air is flowing into central Europe from Scandinavia. Another blockage of circulation in the Atlantic is visible.
Solar activity has decreased (continuation of zonal circulation blockage), which will further lower Pacific temperatures in the California Current region. Cold water will reach the central equatorial Pacific….
https://i.ibb.co/929fWxS/mimictpw-alaska-latest.gif
Sunspot number: 23
Updated 01 Apr 2023
https://spaceweather.com/
There is no chance for El Nino.
https://i.ibb.co/8xQpQb9/IDYOC007-202304.gif
Earth’s atmosphere greenhouse effect is some
+0,4 oC.
–
Earth’s atmosphere greenhouse effect was very mistakenly estimated as being
+33 oC which is very much wrong !
–
The +1,5 oC rise is due to orbital forcing, the additional CO2 cannot be considered as warming Earth’s surface by +1,5 oC, because the entire atmosphere warms surface only by some
+0,4 oC !
–
https://www.cristos-vournas.com
Thus, the current observed GLOBAL WARMING cannot be attributed to the fossil fuels burning.
–
https://www.cristos-vournas.com
No chance for El Nino…
Aha.
So far, NOAA’s CFSv2 forecast for ENSO has been considered on the blog fairly reliable (but possibly because it has been showing a strong La Nina for years, which most Coolistas like to interpret as increasing global cooling).
Now we see that ENSO crossed the La Nina threshold (-0.5) in February and entered neutral territory in March:
https://www.cpc.ncep.noaa.gov/products/CFSv2/imagesInd3/nino34Mon.gif
We will see in June whether the forecast was correct; if this is the case, ENSO might exceed the El Nio threshold (+0.5).
And if we look at the end of the forecast, we even see that this new El Nino phase could reach +2.0 in October, which according to the ONI index hasn’t happened since fall 2015:
https://origin.cpc.ncep.noaa.gov/products/analysis_monitoring/ensostuff/ONI_v5.php
*
Wait and see!
The last 7 days have been cooling in the tropics. Wait and see indeed.
https://www.tropicaltidbits.com/analysis/ocean/cdas-sflux_ssta7diff_global_1.png
And how did the last seven hours behave, Blindsley Hood?
People like you seem to ignore that NOAA’s forecast evidently integrates such very recent information.
You confirm my papargraph ahead with an amazing precision:
” So far, NOAAs CFSv2 forecast for ENSO has been considered on the blog fairly reliable (but possibly because it has been showing a strong La Nina for years, which most Coolistas like to interpret as increasing global cooling). ”
I don’t recall you ever pointing out a slight warming of the Nino3+4 area during periods of very strong La Nina, which perfectly reflects your opinionated Coolista mentality.
Binny,
Are you gullible enough to believe that it is possible to predict future states of a chaotic atmosphere?
The IPCC doesn’t believe so, nor does anybody else who has experience with non-linear systems. If you don’t care for chaos, you might believe Richard Feynman, who pointed out that applying the uncertainty principle at the quantum level, future states of the atmosphere are impossible to predict.
Others may decide for themselves whether you can predict the future or not.
In any case, you can’t describe the GHE, nor explain its role in four and a half billion years of planetary cooling, so your predictive abilities are definitely based on the GHE.
Do you have a crystal ball, or do you just guess?
#3
Ah, that stupid, opinionated fake German elementary school teacher, who never has anything to say but keeps all the time pushing for something irrelevant to say.
Always the same boring stuff, along with an increase in aggressiveness: clear signs of a neurodegenerative disease.
I know Flynnson: you will never stop disturbing. As with Robertson, your egomaniacal behavior is beyond your own control, it is too late for you to correct yourself.
“how did the last seven hours behave”
Do you know of hourly data for this region and type?
Blinny says data which shows recent cooling does not have any import.
“NOAAs forecast evidently integrates such very recent information”
Is NOAA’s forecast based on history or a model?
Flynnson’s stupidity best shown again:
” In any case, you cant describe the GHE, nor explain its role in four and a half billion years of planetary cooling… ”
He is manifestly unable to talk about anything else than his GHE, 4.5 billion years of cooling.
*
And this is the very best:
” … so your predictive abilities are definitely based on the GHE. ”
You must be completely dense to write such a nonsense.
*
This poor Flynnson is reminding me more and more of all those horrible retired German elementary school teachers I’ve met occasionally for the last 50 years, endlessly repeating their stubborn, boring blah-blah.
La btise opinitre est, comme on le voit, vritablement internationale.
Excuse-moi, scanneur: je t’avais oublié.
La bêtise opiniâtre est, comme on le voit, véritablement internationale.
Binny,
In any case, you cant describe the GHE, nor explain its role in four and a half billion years of planetary cooling, so your predictive abilities are definitely based on the GHE.
Do you have a crystal ball, or do you just guess?
You fool, you can run but you cannot hide.
All you can do is demonstrate that you can be incompetent in at least three languages.
You can’t even explain the past – why would anybody believe you can do better in relation to the future.
By the way, you seem to be showing your bigotry – the aged, elementary school teachers, National Socialists, anybody who dares to disagree with you by pointing out facts which you don’t like – you really are a nasty, bitter, discriminatory type of idiot, aren’t you.
It’s a good thing you have no power at all, and that nobody values your SkyDragon cult opinions, isn’t it?
Carry on burbling in your language of choice. Pay more attention to your spelling – before you post a comment, preferably. That will save you the embarrassment of admitting that you are just a little bit sloppy.
#2
Ah, that stupid, opinionated fake German elementary school teacher, who never has anything to say but keeps all the time pushing for something irrelevant to say.
Always the same boring stuff, along with an increase in aggressiveness: clear signs of a neurodegenerative disease.
I know Flynnson: you will never stop disturbing. As with Robertson, your egomaniacal behavior is beyond your own control, it is too late for you to correct yourself.
And as usual, Blindsley Hood intentionally distorts what I wrote:
“Blinny says data which shows recent cooling does not have any import. ”
*
Nowhere did I suggest let alone did I wrote the nonsense he claims I have.
How is it possible to write such childish lies when you are at least 75 years old?
And such an arrogant person calls me an idiot, sometimes even an arrogant twat!
Now Blinny claims that recent data HAS contributed to the recent decline. You couldn’t make this sort of stuff up.
https://www.tropicaltidbits.com/analysis/ocean/cdas-sflux_ssta7diff_global_1.png
https://www.tropicaltidbits.com/analysis/ocean/nino3.png
http://www.bom.gov.au/archive/oceanography/ocean_anals/IDYOC006/IDYOC006.202304.gif
The temperature of the South Pacific will now drop rapidly.
Year Perihelion Aphelion
2023 January 4 16:17 July 6 20:07
https://climatereanalyzer.org/wx/todays-weather/input/gfs_spole-sat_t2anom_d1.png
What is the greenhouse effect?
https://climate.nasa.gov/faq/19/what-is-the-greenhouse-effect/
“Scientists have determined that carbon dioxide’s warming effect helps stabilize Earth’s atmosphere. Remove carbon dioxide, and the terrestrial greenhouse effect would collapse. Without carbon dioxide, Earth’s surface would be some 33C (59F) cooler.”
“Remove carbon dioxide, and the terrestrial greenhouse effect would collapse.”
Life needs CO2- remove it, life dies.
Christos Vournas
” Remove carbon dioxide, and the terrestrial greenhouse effect would collapse. ”
No idea how this trash was born. Sounds like written by those who wrote also similar trash like ‘CO2 traps heat’.
I would suggest to modify their document as follows:
g/carbon dioxide/s//water vapor and carbon dioxide/g
That might be a bit near to what I actually expect to read.
Binny,
NASA are apparently taking no notice of what you “actually expect to read”.
Have you tried berating NASA in French and German?
I probably agree with you that whatever idiot was silly enough to claim that removing carbon dioxide (or anything else) from a sample of air would result in the temperature of the sample dropping by 33C is a few sandwiches short of a picnic, so to speak.
Do you really think that adding any gas, in any quantity, to air will make it get 33 C hotter?
Gee, free heating and cooling – brought to you by the miracle of SkyDragon cultism!
You might as well go back to bed, turn your face to the wall, and be bored and bitter. I won’t care at all.
Ah, that stupid, opinionated fake German elementary school teacher, who never has anything to say but keeps all the time pushing for something irrelevant to say.
Always the same boring stuff, along with an increase in aggressiveness: clear signs of a neurodegenerative disease.
I know Flynnson: you will never stop disturbing. As with Robertson, your egomaniacal behavior is beyond your own control, it is too late for you to correct yourself.
Binny,
You still haven’t managed to describe the GHE, so you might as well whine about stupid fake opinionated German elementary school teachers.
I guess you’re not happy that you can’t explain how the Earth managed to cool for four and a half billion years. Don’t blame me, I didn’t do it! If you want to deny reality, go your hardest.
You might find others doing more laughing than applauding, though.
Off you go now, try to convince other deluded SkyDragon cultists that you can explain the future, but the past is a complete mystery to you. Maybe you could draw some brightly colored graphs?
#6 I guess
Ah, that stupid, opinionated fake German elementary school teacher, who never has anything to say but keeps all the time pushing for something irrelevant to say.
Always the same boring stuff, along with an increase in aggressiveness: clear signs of a neurodegenerative disease.
I know Flynnson: you will never stop disturbing. As with Robertson, your egomaniacal behavior is beyond your own control, it is too late for you to correct yourself.
SOLAR MINIMUM UPDATE
> This idiot country is sheathed in ice seven months of the year and the trans Canada highway (an underdeveloped national disgrace) is 5000 miles long. Is there nothing so stupid you won’t do it @JustinTrudeau?
https://twitter.com/jordanbpeterson/status/1642294421180776450
Our Son of Lobster was reacting to this:
https://www.westernstandard.news/news/federal-budget-commits-funding-to-convert-one-lane-of-transcanada-highway-for-bicycles/article_fd569356-ce77-11ed-99ff-ffbfc5f0777e.html
He might have forgotten the date.
Willard
I am stunned when I read one of the dumbest sentences I have ever read (only Robertson, Flynnson and Clint R do better):
” There is really no reason if you have to visit your la grandmother in the hospital in Vancouver, and you live in Calgary, that you can’t bike it in a couple of days. ”
I’m not entirely sure that this dear Justin would do that at any later point in his life.
*
And he should say that especially to a mother of three young children who lives alone and works hard at least 40 hours a week in a hospital in Calgary.
The way many politicians look down from their ivory towers at the ‘world outside’ is unbelievably condescending and clueless – regardless of which party they belong to.
I blame apple cider.
Weepy Wee Willy,
I assumed you may have been repeatedly dropped on your head as a baby.
I guess fetal alcohol syndrome disorder as a result of excessive consumption of apple cider is another explanation.
I suppose you have to blame something for your retardation.
Mike Flynn,
What are you braying about?
If you do not know why I mention apple cider, just say so.
Or continue to waste your sabbatical.
Long live and prosper.
Weepy Wee Willy,
I assumed you may have been repeatedly dropped on your head as a baby.
I guess fetal alcohol syndrome disorder as a result of excessive consumption of apple cider is another explanation.
I suppose you have to blame something for your retardation.
That’s probably why you want me to repeat everything. Is your problem attention deficit disorder or inability to comprehend?
You said you blame apple cider for your deficiencies. Why would you expect me to waste my time asking you to repeat yourself?
You are a funny wee laddie, aren’t you?
I assume that you will keep braying, Mike.
Weepy Wee Willy,
I assumed you may have been repeatedly dropped on your head as a baby.
I guess fetal alcohol syndrome disorder as a result of excessive consumption of apple cider is another explanation.
I suppose you have to blame something for your retardation.
That’s probably why you want me to repeat everything. Is your problem attention deficit disorder or inability to comprehend?
You said you blame apple cider for your deficiencies. Why would you expect me to waste my time asking you to repeat yourself?
You are a funny wee laddie, aren’t you?
I assume that you already brayed that comment, Mike.
It’s amusing to see that while Sunny Boy’s activity tends to go unnoticed on this blog as they move up, it becomes worth mentioning again once it drops below a certain level, say 50 spots per day.
This is exactly the same behavior as wrt the ENSO statistic.
*
Here is the (raw, unsmoothed) monthly number of sunspots, including March:
https://drive.google.com/file/d/1hR2WPoQZlvdLCXwhpG8ffbJqTgNSdVBU/view
The current cycle, SC25, is still only a little ~20% higher than the predecessor SC24 within the same period (~1200 days), a cycle which was the fourth weakest cycle since measurements began.
And SC25 is currently a paltry 15% of SC23, SC 22, SC20, 13% of SC21, and 11% of SC19 (the Modern Maximum) when summing the daily SSNs of these cycles (again: within the same period).
So even if it’s above the low predictions (NASA, NOAA, Zharkova), SC25 is still a weak cycle and we’ll have to wait a long time to see if the predictions of a strong SC25 (National Center for Atmospheric Research, Scott Mcintosh) materialize at all.
Comme toujours: time will tell.
Source
https://tinyurl.com/sty4ur5z
There will be more snow in the western US.
https://i.ibb.co/PYYHK8k/mimictpw-namer-latest.gif
Happy #SunDay! This weeks space weather report includes 4 notable solar flares, 15 coronal mass ejections, and 1 geomagnetic storm.
Global sea ice report after March 23
1. Absolute values, first 180 days
https://drive.google.com/file/d/17Wc-b_OZhrzorLsE_ZibKU82F1w1U-_g/view
2. Anomalies
https://drive.google.com/file/d/1DnrnCfQjICj21o1gOeFMbMI1xsF0nZoj/view
Source
https://tinyurl.com/s6d98by4 (d~c)
Currently, there is a strong decline in solar activity. Three faint spots are now visible on the solar disk.
https://i.ibb.co/mT96Ksc/SDO-HMIIF-1024.jpg
Greenland ice sheet: daily accumulated surface mass balance, 2012-2023
https://drive.google.com/file/d/1hp59N2gopJ_0DYEcgH-XNWM0LsYO8b6E/view
Source
https://dataverse.geus.dk/api/datasets/:persistentId/dirindex?persistentId=doi:10.22008/FK2/OHI23Z
DANIEL MCCARTHY: Climate Science Makes A Bad Religion
CONTRIBUTOR
“What does it take to avert the end of the world?
For most of human history this has been a question for religion. And the answer has usually been that human beings must repent of their sins. They must surrender some comfort and luxury to appease angry gods. In primitive times worshippers might sacrifice a bull or even a human being.
Today climate science provides an end-times prophecy that works in much the same way as the religious apocalypticism of old. Religion enchants the world, lending spiritual significance to every part of life. Climate change makes everything from charging your iPhone to skipping beef for dinner a potentially salvific act.”
https://wattsupwiththat.com/2023/04/02/daniel-mccarthy-climate-science-makes-a-bad-religion/
According to Torah worshipping anything other than the God of universe, is bad.
People worship all kinds of things, including silly rock stars.
The general idea that a government can save the world- is insane.
One could hope doesn’t start wars, but it’s not a very rational hope.
Ending wars, has general govt policy, is having enough people die,
that people are more eager to have peace, which also aligns with
idea of human sacrifice [mostly children and old people].
As I have said, the Jews animal sacrifice, basically having sacred
barbecue. And doing things to remember that God free them for slavery
in order them, to them to encourage, everyone on the world to just worship the one god. In theory Christian and Muslims worship one god- but generally, Jews, Christian, and Muslims, don’t just worship one god.
A lot of global warming cargo cult, worship Gaia {but not very seriously] mostly it’s worship of some kind of non existent idealized government.
Heavy snowfall over Great Salt Lake.
https://i.ibb.co/zGXztYJ/Zrzut-ekranu-2023-04-03-085202.png
Endless winter in the Midwest.
https://i.ibb.co/R9sRDmd/Zrzut-ekranu-2023-04-03-105304.png
Just for fun, here’s a bit from the US Govt National Institute of Standards, published in 1907,
“This thermopile consists of 20 junctions of iron and constantan wires about 0.1 mm to 0.15 mm diameter (resistance 3.5 ohms), and when used with a galvanometer, having a figure of merit of [ . . . ](resistance =3 ohms, period =14 seconds) a deflection of one scale division indicated a temperature change of 1.1 x 10^-6.”
Of course, the scientist has to build an instrument himself, (or supervise the actual technicians), unlike modern experimenters.
How many scientists these days contemplate reproducible measurements to this level, using quite primitive hand-made instruments? Precious few, I would imagine.
My point is that “climatological” temperature measurements are a bit of a joke, really, and unfit for any serious scientific investigation. Rather like the obverse – “climatologists” claiming to measure sea levels to an accuracy better than the thickness of a human hair – from a few hundred kilometers away, with a vague footprint moving across the sea at around 7 km/sec.
Anybody who makes any decisions based on this nonsense deserves everything they get! Only joking, nobody could possibly be that silly, could they?
I think the AI they will take seriously, when AI will declare there is NOT any +33 oC greenhouse warming effect on Earth’s surface!
–
***
https://www.cristos-vournas.com
I do not have a hard science or mathematical background, but I wonder if the unexpected results have something to do with the logarithmic nature of carbon as a greenhouse gas. In other words,in dense urban areas, there is more co2,and this is even more pronounced as population density has increased as a whole. Therefore, because of diminishing returns, the discrepancy is less compared to earlier periods. I realize I could be wildly off with my logic, so go gentle, mathematicians and scientist. I am just thinking out loud. I have no issues with being corrected, just please educate, not excoriate.
CO2 is suppose to a warming effect at lower elevation- 1000 meter above the ground and there can bubbles or dome of higher CO2 in urban areas. Plants/trees also remove CO2 and at night burn sugar and make CO2.
They measure global CO2 at higher elevation where it’s uniform in terms global levels- or they measure at low elevation because there is regional difference which can quite varied, or due wind varies in terms of minutes of time.
Gary
You are certainly not ‘wildly off with [your] logic’.
But other posters have proposed imho more accurate explanations, e.g.
Didier Galvez
https://www.drroyspencer.com/2023/03/urbanization-effects-on-ghcn-temperature-trends-part-iii-using-population-density-1880-2015/#comment-1465835
That idea I found really convincing.
I am a new poster, who has been looking at all aspects of climate change for the last few years, originally motivated by information on your site.
In answer to the question about why the UHI curves are dropping, can it be because of the transition from unfiltered, dirty coal for heating and power in the late 19th century, both in Western Europe and in the USA, to fuel oil, and then to natural gas (and filtered, cleaner coal in power plants)?
The cooling effect of sulfates from coal burning would be counterbalanced by the heating effect of black particulates. Oil emits less carbon particulates, natural gas even less.
Another line of reasoning, Dr Spencer, that I have not seen widely publicized, also shows that CO2 as the cause of recent warming has been exaggerated: Since about 1980 reductions in particulates have been adding to global warming, perhaps, in my opinion, by 0.2C or more. This is documented in several studies and it has a huge effect. It seems to be assumed by everyone that particulates are still subtracting from warming. Isn’t this important?
The sulfate effect wouldnt be so localized.
I suspect the main effect is increasing technical efficiency and economic efficiency. Also the shift toward service economy in urban areas.
I think the explanation of your somewhat strange results can be found in human behaviour. In the colder parts of the world, we like to live where the local climate is warm. This means that we prefer to have our home close to water, on the sunny side of the hill and so no. However these places are not infinite in number and thus colder places become populated when the best are occupied.
-10 for not showing units on graph.
+20 for the innovative approach.
+10 for spurting and supporting some excellent substantive discussion.
This site rocks.
Gah! Spurring not spurting!
Proximity to large bodies of water, or still bodies versus rivers? Earlier urbanization occurred nearer large bays and lakes. Post development of interstates urbanization more supported in more landlocked areas. Also, wouldn’t cities of bays be warmer than cities on rivers? With cities on rivers nearer mountain fed headwaters be cooler still? Spitballing. Great site.