Global Microwave SST Update for April, 2013: -0.04 deg. C

May 7th, 2013 by Roy W. Spencer, Ph. D.

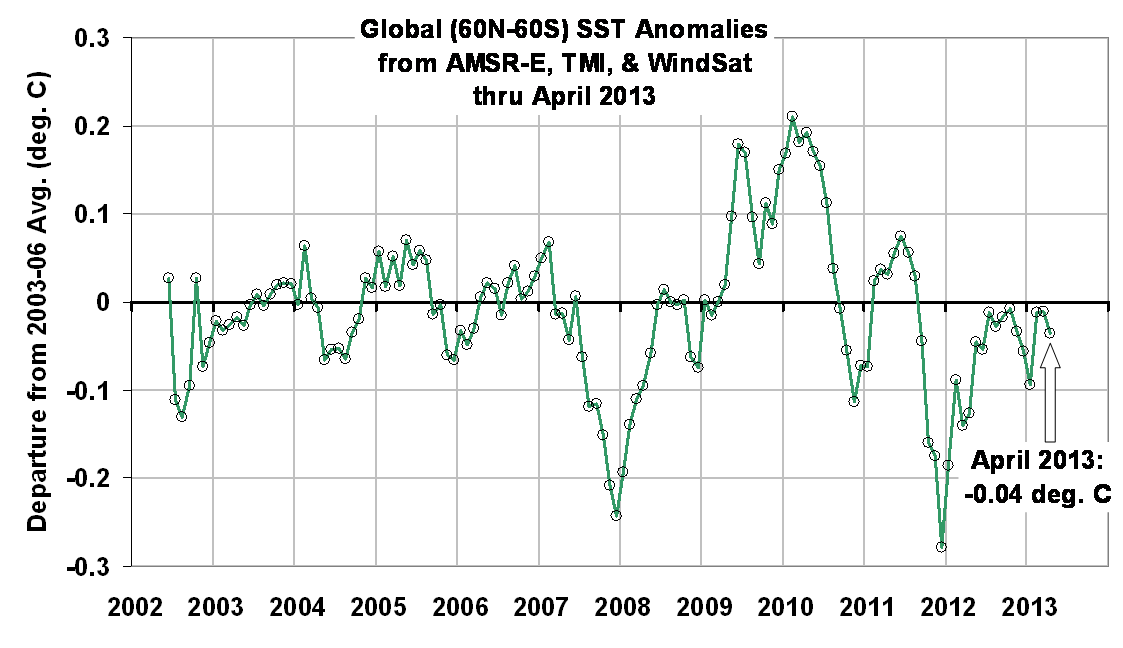
The satellite-based microwave global average sea surface temperature (SST) update for April 2013 is -0.04 deg. C, relative to the 2003-2006 average (click for large version):
RSS_mwSST_2002_thru_Apr_2013

The anomalies are computed relative to only 2003-2006 because those years were relatively free of El Nino and La Nina activity, which if included would cause temperature anomaly artifacts in other years. Thus, these anomalies cannot be directly compared to, say, the Reynolds anomalies which extend back to the early 1980s. Nevertheless, they should be useful for monitoring signs of recent ocean surface warming, which appears to have stalled since at least the early 2000’s. (For those who also track our lower tropospheric temperature [“LT”] anomalies, these SST anomalies average about 0.20 deg. C cooler than LT since mid-2002).

The SST retrievals come from Remote Sensing Systems (RSS), and are based upon passive microwave observations of the ocean surface from AMSR-E on NASA’s Aqua satellite, the TRMM satellite Microwave Imager (TMI), and WindSat. While TMI has operated continuously through the time period (but only over the tropics and subtropics), AMSR-E stopped nominal operation in October 2011, after which Remote Sensing Systems patched in SST data from WindSat. These various satellite SST datasets have been carefully intercalibrated by RSS.

Despite the relatively short period of record, I consider this dataset to be the most accurate depiction of SST variability over the last 10+ years due to these instruments’ relative insensitivity to contamination by clouds and aerosols at 6.9 GHz and 10.7 GHz.


35 Responses to “Global Microwave SST Update for April, 2013: -0.04 deg. C”

Toggle Trackbacks

  1. Very useful data.

    Are you able to post updated ocean heat content info. similar to this chart you just posted? thanks

  2. Scott Scarborough says:

    What about ARGO? Does that system show similar results? Why do you think satillites are better?

  3. I don’t routinely monitor ocean heat content, check Bob Tisdale’s stuff. I think it’s updated every 3 months.

  4. AnsgarJohn says:

    Does this make sense to you? http://twitpic.com/co166j Sun -> temp going down.

  5. John if solar conditions get to the quiet levels i think for the balance of this decade I feel the temp. trend downward will be much more substancial then that forecasted on that chart.

  6. Dan Pangburn says:

    Mixing causes the top 110 meters or so of the oceans to participate in average global temperature change. This results in a time constant of about 5 years. Thus the rapid temperature changes of the SST measurements are unphysical as a contributor to true global temperature change. They must be artifacts of the measurement process. Several web sites such as http://www.ospo.noaa.gov/Products/ocean/sst/anomaly/anim.html have animations showing the roiling. Non-homogeneity also exists for ‘land’ measurements. The trend, including both SST and land, averages the random fluctuations and reveals the flat to declining average global temperatures since before 2002.

  7. Ned Nikolov says:

    Yes, the hiatus of SST since early 2000s is in agreement with the leveling-off of the global near-surface air temperature. These two trends are fully explainable by the increase in low-level clouds that occurred sharply (over a period of 7 months) in year 2000. Low-level clouds remained relatively high compared to 1990s ever since 2001…

    The real reason for the moderate warming of 0.7 C during the 20th Century is the overall decrease of cloud albedo due to increasing solar magnetic activity over this period. The Sun is now going quite (after 350 years of rising activity!), and this will increase cloud cover and cloud albedo leading to a gradual cooling at the surface. The long-term warming trend is over and will not likely return at least for 100 years. A negative temperature trend will become evident over the next 10 years ….

    • Dan Pangburn says:

      The interest in albedo change is obvious but misleading. Albedo doesn’t change much in the long haul (average over decades).

      Often overlooked is that clouds consist of bits of liquid or solid water and thus radiate per SB. Average emissivity for clouds is about 0.5.

      A rather simple heat-transfer analysis for the planet shows that an increase in average cloud altitude of about 100 meters equates to a decrease in average cloud temperature and associated decrease in SB radiation to space that would account for half of the temperature increase (0.74 °C) that has been mistakenly attributed by many to CO2 increase.

  8. Dan Pangburn says:

    An entirely different analysis, which uses a corrected version of the Trenberth graphic is at http://tallbloke.wordpress.com/2011/06/29/dan-pangburn-cloud-altitude-change-causes-global-temperature-change/

    This analysis corroborates the 100 meter determination.

  9. Dan Pangburn says:

    Further analysis reveals that an albedo increase of 1.2% would reduce the surface temperature by the same amount as a 93 meter decrease in average cloud altitude. Both of these result from an increase in low altitude clouds caused by decrease in sunspots, reduced solar magnetic shielding from cosmic rays, increased low altitude clouds. Thus some, as yet undetermined, combination of the two is indicated.

    The determining proxy metric is the time-integral of sunspot numbers (properly reduced by radiation from the planet. This is employed in a simple equation that calculates average global temperature anomalies since before 1900 with an R2 of 0.9 with or without considering the influence of CO2. The equation and resulting graph are presented at http://climatechange90.blogspot.com/2013/05/natural-climate-change-has-been.html

  10. Douglas J. Cotton says:

    Dan, Roy and others

    The reason why climate is determined by natural variations in effective insolation (which is itself affected by albedo variations) is explained in my paper linked in the articles mentioned in this comment on the previous thread.

    Although back radiation does slow that component of radiative cooling which is itself by radiation, the non-radiative cooling processes account for about two-thirds of all cooling. These non-radiative processes are slowed by mostly oxygen and nitrogen because it is well known in physics that the rates of evaporation and conduction are reduced as the temperature gap narrows. At the boundary of the surface and the atmosphere this temperature gap is usually less than 3 degrees.

    Furthermore, it is obvious from observations that the rate of cooling slows down in the early pre-dawn hours, at least in calm conditions. This is because there is an underlying supporting thermal plot which runs fairly steadily upwards from the tropopause to the surface, then more steeply in the outer crust and much less steeply by the time it gets to the inner mantle.

    At every point along this plot the thermal gradient (aka lapse rate) may be determined from the quotient of the acceleration due to gravity and the mean specific heat -g/Cp.

    A minor reduction in the magnitude of the gradient of up to about a third is thought to be due to inter-molecular radiation. For example, the moist rate is about 6.5C/Km in the atmosphere, compared with the -g/Cp value which is about 9.8C/Km. Climatologists think this is due to the release of latent heat, but physics does not support that, especially in the crust and mantle of course, or in the atmospheres of Venus or Uranus.

    The -g/Cp gradient can be determined with just two lines of computations based on the same Kinetic Theory used by Einstein and physicists ever since. Pressure does not enter into the calculations, because we are talking about something which happens at the molecular level, due to gravity acting upon molecules in free flight between collisions. It does not require convection for this diffusion of kinetic energy, which can happen even in still air.

    Now, this is all based on the maximum entropy conditions of the thermodynamic equilibrium which must result in accord with the Second Law of Thermodynamic. If you read my paper “Planetary Core and Surface Temperatures” on the Principia Scientific International website (PROM menu) you will learn about the consequent “heat creep” which then results when the thermodynamic equilibrium is disturbed by the absorption of new thermal energy, such as when night becomes day.

    The fact that this hypothesis appears to provide the only feasible explanation for the temperatures of 320K at the gaseous base of the troposphere of Uranus, and over 720K at the solid surface of Venus, even at its poles, I suggest strongly supports the very valid physics used to derive the hypothesis. Surface temperatures on all planets are predetermined by effective insolation warming the atmosphere, and then thermal energy “creeping” towards the surface in keeping with the Second law of Thermodynamics.

  11. Kristian says:

    Roy,

    I would be very interested to hear your take on the rather conspicuous disparity, especially post 2007/08, shown here:

    http://i1172.photobucket.com/albums/r565/Keyell/RSSSSTvsOIv2SST_zpsbeb1364f.png

    between this dataset and the also satellite-based NOAA (Reynolds) OI.v2 dataset. Is it all about the cloud/aerosol issue that you mentioned? As I understand it, the OI.v2 incorporates both microwave and infrared readings.

    Cheers.

    • That IS a rather large disparity, I agree. Assuming you recomputed anomalies relative to the 2003-2006 period, I would guess it’s thin cirrus cloud contamination in the IR measurements, since the disparity is greatest during warm periods, which have more deep convection.

      • Kristian says:

        “Assuming you recomputed anomalies relative to the 2003-2006 period (…)”

        Whoops! No, I didn’t actually. I also realised that my OI.v2 curve represented 90N-90S, not 60N-60S. A bit too quick off the mark there …

        Well, here’s the apple/apple comparison:

        http://i1172.photobucket.com/albums/r565/Keyell/RSSSSTvsOIv2SSTb_zpsce4c99f8.png

        Looks a lot better, actually, the divergence now mainly occurring around (before and after) the big 2009/10 El Niño. So you might be right in your suspicions …

        There still seems to be a trend issue, though, between 2006 and 2013 comparing the two datasets. The mean microwave SSTa level i 2006/07 is distinctly higher than the one in 2012/13, while the OI.v2 SSTa shows (almost) the opposite.

        Well, we might simply need more time to see if they will once again converge.

  12. Kristian says:

    Further relating to clouds and SST measurements, Roy,

    Do you still update your ‘AMSR-E Estimate of Global Oceanic Reflected Sunlight (SW) Anomaly’ data?

    http://www.drroyspencer.com/2011/07/global-sst-update-still-no-sign-of-resumed-warming/

    It would be interesting to have that presented as well …

    Thanks.

  13. Doug and others that don’t want to accept the fact that a GHG effect exist really hurt the cause for those of us who believe global cooling is now taking place and don’t believe in global man made warming due to the GHG EFFECT having a bigger role in the climate system of the earth going forward from this point in time.

    • Douglas J. Cotton says:

      No Salvatore.

      I don’t think long term global cooling is taking place. There will be net natural warming for up to another 200 years, raising temperatures by up to 1 degree more, before 500 years of natural cooling sets in. What I don’t just think, but know from physics, is that carbon dioxide actually cools by about 0.002 degree, and water vapour also cools as my study of real world data reveals.

      Where’s your study of real world data that shows, as the IPCC claims, that water vapour warms? Where’s Roy’s study that shows the exact opposite of mine, which is now being extended to many more cities and locations?

      Non-radiative processes dominate radiative processes. The whole atmosphere (not just GHG) provides a net blanket effect by night and a net umbrella effect by day, and neither sets the level of surface temperatures. The Sun does that, in combination with the autonomous thermal gradient which the Second Law of Thermodynamics makes essential for thermodynamic equilibrium in a gravitational field. If you sleep under a greenhouse, then fine, call it that – but only at night. Sure we don’t get as cold as the Moon at night, or as hot by day. But it’s the whole atmosphere (mostly nitrogen and oxygen) which protects us.

      It is those who perpetuate the hoax that carbon dioxide has any warming effect whatsoever who are effectively killing people in developing companies by digging into aid money which, rather than being totally wasted on carbon dioxide aid, could have built hospitals, provided clean water supplies, treated blindness and a host of other things for the benefit of mankind. Even those in developed countries are suffering financially with unknown consequences.

      Do you, or Roy, want to continue to be a part of this killing of people by propagating a conjecture which has absolutely no foundation in valid physics, just because you think it might, and the wishy-washy arguments of IPCC et al “sound OK” to your physically-untrained ears? Think!

    • Douglas J. Cotton says:

      Yes, Brian and you’ll find some comments of mine there. It’s interesting to note how many commenters on “American Thinker” are saying the whole thing is a hoax, which of course I agree with, though I appreciate that many like Roy have been misled to the point that they believe it. I give solid physics and empirical evidence as to why there is no warming due to carbon dioxide in this paper.

  14. doug as usual we disagree.

  15. doug your studies your coclusions make no sense. zero sense.

    • Douglas J. Cotton says:

      When are you going to stop talking in the Royal plural, Salvatore, or give any sound physics that supports your mere opinion? It is people like you who spread wild opinions on blogs like this who are so far removed from appropriate scientific method that it would be laughable, if it weren’t so serious.

      I produce empirical evidence for what I write. My physics explains temperatures at the base of the tropospheres of not only Earth, but Uranus and Venus – does any GHE? No. My physics explains why we observe that more moist cities have lower daily maximum and minimum temperatures? The GHE conjecture expects the opposite. My physics also explains temperatures in Earth’s crust and mantle. Climatologists wouldn’t even delve that deep, or have any idea why it is important to do so.

  16. doug the temp. projections will go a long way into proving who is correct and who is not in all aspects of this debate. let us see who is most correct. take care

  17. Douglas J. Cotton says:

    I have been saying for nearly two years now that the 60 year cycle is acting against the long-term cycle and thus the net effect is level or very slight net cooling until about 2028. Then 30 years of warming should eventuate, but unless the advanced supplements that I take which slow aging work even better than I expect, being now at age 67 I may not be around to see much of that warming.

    • Mack says:

      There might also be a few folk around here who wished those supplements didn’t work so damn well Doug. 😉

  18. Douglas J. Cotton says:

    Below is a copy of my projections on a copy of a page on my website which was archived on 22 August 2011, even though I knew that 2010 has been particularly hot:

    From 2003 the effect of El Niño had passed and a slightly declining trend has been observed. This is the net effect of the 60-year cycle starting to decline whilst the 934 year cycle is still rising. By 2014 the decline should be steeper and continue until at least 2027. (This statement was archived 22 August 2011 here)

  19. Douglas J. Cotton says:

    I wonder why it never occurs to GH advocates that their conjecture says that water vapour (the main GHG) causes the surface and lower troposphere to be warmer. Hence, in order to maintain radiative equilibrium with the Sun, the upper troposphere would have to be cooler.

    So the GHE conjecture implies the lapse rate would be steeper due to water vapour. Strange don’t you think?

  20. Thanks, Dr. Spencer. Much better graphic.
    I think that global SST will prove useful to have.

  21. Dan Pangburn says:

    Find out at http://lowaltitudeclouds.blogspot.com/ what caused the warming that ended over a decade ago.

    A link is included to a site that presents a simple science-based equation that calculates temperatures since before 1900 with an R2 of 0.9 using only one widely available variable.

  22. How do I switch between the html and visual editor? Right now it seems that I only have access to the html editor.

  23. I truly enjoy looking through on this internet site, it holds superb posts.

  24. Please share more meaningful things, I would like to share your article

Leave a Reply