Home/Blog
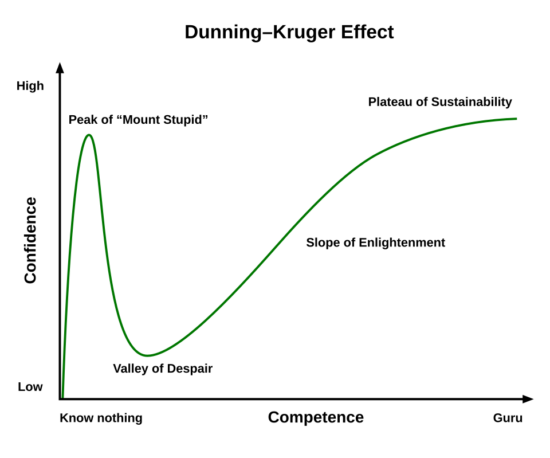
There was a recent weeks-long exchange of emails between many climate people — professional and amateur — regarding the idea that air pressure (in combination with absorbed solar energy) is what causes temperature. There were insults launched at those who refused to believe what a certain physics-trained person says should be a revolution in our understanding of planetary temperatures. That person even managed to get a paper published in a journal that (in my opinion) used reviewers who were in over their heads on the subject.
The whole ordeal makes me think of the Dunning-Kruger Effect, which is the tendency for people who start to understand a complex subject to overestimate their level of understanding. This then leads to a point of peak overconfidence (climbing “Mount Stupid”), which then gradually relaxes as more is learned and the person increasingly realizes that the subject is more complicated and nuanced than they originally thought.
I claim that the person in question who thinks [pressure + absorbed solar energy = temperature] is still stuck on Mount Stupid.
The reason I bring this up again (I’ve preached on it before) is that many have been misled into believing the “theory”. As a result, I have spent many years responding to questions from the public (including science-savvy citizens) regarding the issue. Many have been convinced by the “theory”, and have joined the proponent of the theory on Mount Stupid.
After lurking in the weeks-long email discussion, I finally responded with the following summary of the issue. I have removed the person’s name to protect the not-so-innocent.
SUBJECT: Where <NAME REDACTED> Is Right… and Where <PRONOUN REDACTED> Is Wrong
All:
After working in meteorology and then climate during my 40+ year career, I think I can offer some insight into the issues being discussed in these emails. Like <NAME REDACTED>, I have always been skeptical of what I have been told until I could fully understand an issue for myself.
I’m sure the following explanations will be of help to many of you. (I suspect <NAME REDACTED> is too invested in theories to change <PRONOUN REDACTED> mind.) Many of the concepts are not trivial, and I will admit it wasn’t until many years after all of my education (PhD Meteorology) that I finally understood a few of them, because they were not taught in school. Dick Lindzen helped me in this in the early climate research years.
Most of what follows is fundamental atmospheric thermodynamics, and I question whether <NAME REDACTED> really did take a university-level Atmospheric Thermodynamics course. If he did, I’d like to know where.
And if <PRONOUN REDACTED> shows me <PRONOUN REDACTED> grades, I’ll show <PRONOUN REDACTED> mine.
A THOUGHT EXPERIMENT
Imagine you could suddenly dump an extra 1 atmosphere of air on top of the existing atmosphere, what would happen to air temperature in the 1 ATM below? Just as <NAME REDACTED> would predict, the temperature of the original atmosphere below would increase greatly through adiabatic compression.
But what would happen NEXT?….
The high [hot] atmospheric temperatures in the lower atmosphere would then be far out of energy balance compared to what existed before. The result would be cooling of all of that air that was heated through adiabatic (or nearly so) compression (work done on the lower atmosphere) until a new state of energy equilibrium was reached. The energy loss would be through infrared radiation of the hotter air.
In fact is it always ENERGY BALANCE that determines temperature, through the 1st Law of Thermodynamics. A change in temperature is proportional to the rate of energy input minus the energy output (which includes any work done in the process).
In contrast, the Ideal Gas Law (PV=nRT) cannot tell you what the temperature “should be”. It only says how the variables P, V, and T are interrelated during the process of re-equilibration and in the final equilibrium state. What <NAME REDACTED> misses in <PRONOUN REDACTED> theory is the “n” part of the equation (the number of moles, or mass… which is in the density form of the equation, P = rho RT). In my hypothetical 2-atmosphere thought experiment, as the lower atmosphere cools to reach a new state of energy equilibrium with the solar input, the decreasing temperature causes an increase in the air density (“shrinkage”), and the pressure remains the same… even while the temperature is changing.
Specifically, following the 1st Law, the internal temperature of a volume of atmosphere exposed to an energy INPUT will increase until the temperature-dependent energy OUTPUT processes equal the rate of energy gain. This is true of every physical system… the atmosphere, a pot of water on the stove, a car’s engine, the human body, the interior of the sun, etc. That energy equilibrium is what determines the final temperature. (In the real atmosphere, there are constant energy imbalances and thus changes in temperature; Trenberth’s global-average energy balance diagram is only useful to gain a conceptual understanding of the relative role of the major energy flows in the global-average climate system.)
THE IDEAL GAS LAW
Again, the Ideal Gas Law equation (PV=nRT) cannot tell you what the temperature of a gas should be, only energy flows in and out can do that. The gas law just tells you how the P, n, and T are interrelated for a given volume (V) of air. Yes, <NAME REDACTED>, on short time scales, ascending air cools and descending air warms, but if all of that motion was to stop, energy flow processes would then determine what the final temperature would be… not what the air pressure is.
For a given surface air pressure, a huge range of temperatures is possible, and that huge range is all due to energy flow processes. Again, if the near-surface air temperature over the whole planet is much higher than local energy flow processes can support, the temperature falls, and the air’s volume shrinks (or density, rho, increases, according to the equivalent Ideal Gas Law equation, P=rhoRT). The surface air pressure remains the same because the total mass of the atmosphere is unchanged.
SO WHY MIGHT THERE BE A CLOSE RELATIONSHIP BETWEEN DIFFERENT PLANET’S LOWER ATMOSPHERIC TEMPERATURE AND PRESSURE?
I haven’t studied the atmospheres of other planets, because I don’t care. Even if those other planets did not exist, they are not necessary for understanding our own atmosphere. But if indeed <NAME REDACTED> is correct about a close statistical relationship between different planets’ surface air pressure and temperature, after adjusting for solar input, then I suspect it’s because the more atmosphere there is, the more greenhouse gases there are.
On the subject of GHGs, I’ve forgotten… does <NAME REDACTED> believe that air absorbs and emits IR energy? Because the greenhouse effect is a necessary consequence of that absorption/emission. Energetically, the GHE is a radiative insulator. It’s analogous to adding insulation to a heated building’s walls in winter. For a given energy input into the building, the air temperature inside will rise, and the outside of the walls will experience a temperature fall. This is exactly what the GHE does to the atmospheric temperature profile (in an energetic sense.. clearly involving radiation rather than conduction as a heat transfer mechanism).
If <NAME REDACTED> doesn’t believe air absorbs IR energy, how does <PRONOUN REDACTED> explain all of the thousands of spectroscopic measurements of CO2, water vapor, and methane as a function of temperature and pressure? And if <PRONOUN REDACTED> does believe the atmosphere absorbs and emits IR energy, then <PRONOUN REDACTED> must also believe in a greenhouse effect, because it is a necessary consequence…. the greenhouse effect in planetary atmospheres always causes warming of the lower atmosphere and cooling of the upper atmosphere.
(BTW, it is a common misconception that air which absorbs IR energy immediately loses that energy through emission of IR. Not true. Look up the “kinetic theory of gases” and related concepts. When CO2 or H2O vapor molecules absorb IR photons they extremely rapidly lose their extra energy to other air molecules through collisions. This happens much faster [by a factor of ~50,000] than the time it takes to re-emit energy through IR photons. This is how IR absorption immediately leads to “thermalization” [a term I hate].
Furthermore, it is crucial to understand that since IR absorption is largely independent of temperature, but IR loss is VERY dependent upon temperature, almost all air in the atmosphere is in a continual state of IR energy imbalance. Much of that imbalance is what [is balanced by] convective overturning.
WHAT IS THE ROLE OF THE ADIABATIC LAPSE RATE?
The adiabatic lapse rate in the troposphere (9.8 deg C per km without moisture condensation) is the RESULT OF convective overturning. If condensation of moisture is involved in updrafts, then the lapse rate is lower. Like the Ideal Gas Law, it doesn’t tell you what the temperature “should” be. It just tells you how the temperature of an air parcel changes during ascent or descent, if there is no energy gain or loss (“a-diabatic”). [But there are energy gains and losses occurring everywhere, all the time, and those determine what the absolute temperature will be — not pressure.]
HOW DOES THE GREENHOUSE EFFECT PLAY INTO THE LAPSE RATE?
This is a very interesting subject. It is something that even many atmospheric scientists and climate researchers don’t really understand. The combination of solar heating of the surface and IR absorption and emission by the surface and atmosphere ALONE, WITHOUT ANY CONVECTIVE OVERTURNING would result in an extremely steep tropospheric lapse rate, with very high surface temperatures and exceedingly cold upper tropospheric temperatures. This was first demonstrated by Manabe & Strickler (1964), and it’s called the “pure radiative equilibrium” case. It is sort of what makes the term “greenhouse effect” technically correct; like a real greenhouse inhibiting convective heat loss [because it has a roof], the greenhouse effect is, by definition, what happens WITHOUT the resulting convective overturning.
But in the real world, convective overturning is the RESPONSE to this GHE destabilization! So, that 33 deg. GHE warming people talk about? That’s not the GHE. It’s the GHE + CONVECTION. Without convection, that 33 deg. C figure would be more like 65 or 75 deg. C. Which then leads to another fascinating question…
WHAT WOULD HAPPEN IF THE ATMOSPHERE DID NOT ABSORB AND EMIT IR ENERGY?
Imagine a cold planetary atmosphere with no energy input. Then, turn on the sun. Solar heating of the surface would warm the atmosphere through convective overturning. But the [deep] atmosphere would have no way to shed that energy to cool in the presence of all of that energy input. The temperature of the [deep] atmosphere would then continue to rise until it had the same temperature as the surface, through its entire depth. Long before that process finished convective overturning would have stopped, because the atmosphere would be too stable to support convection. The atmosphere would eventually become isothermal (or nearly so, since there might be some planetary scale overturning between the tropics and the poles, due to their different rates of solar input), with the same temperature as the surface. Interestingly, as a result all weather activity would cease. All clouds would probably disappear, resulting in higher temperatures. Any [remaining] circulation systems would have a planetary scale, because the horizontal scale of those systems are related to the lapse rate (through the “Rossby radius of deformation”), which is also why the stratosphere only has planetary-scale circulations.
-Roy