Texas Major Hurricane Intensity Not Related to Gulf Water Temperatures

August 29th, 2017 by Roy W. Spencer, Ph. D.

As the Houston flood disaster is unfolding, there is considerable debate about whether Hurricane Harvey was influenced by “global warming”. While such an issue matters little to the people of Houston, it does matter for our future infrastructure planning and energy policy.

Let’s review the two basic reasons why the Houston area is experiencing what now looks like a new record amount of total rainfall, at least for a 2-3 day period over an area of tens of thousands of square miles.

1) A strong tropical cyclone, with access to abundant moisture evaporated off the Gulf of Mexico, and

2) Little movement by the cyclone.

These two factors have conspired to create the current flooding catastrophe in Houston. Now let’s look at them in the context of global warming theory.

1. Are Texas major hurricanes dependent on an unusually warm Gulf?

I examined all of the major hurricane (Cat 3+) strikes in Texas since 1870 and plotted them as red dots on the time series of sea surface temperature variations over the western Gulf of Mexico. As can be seen, major hurricanes don’t really care whether the Gulf is above average or below average in temperature:

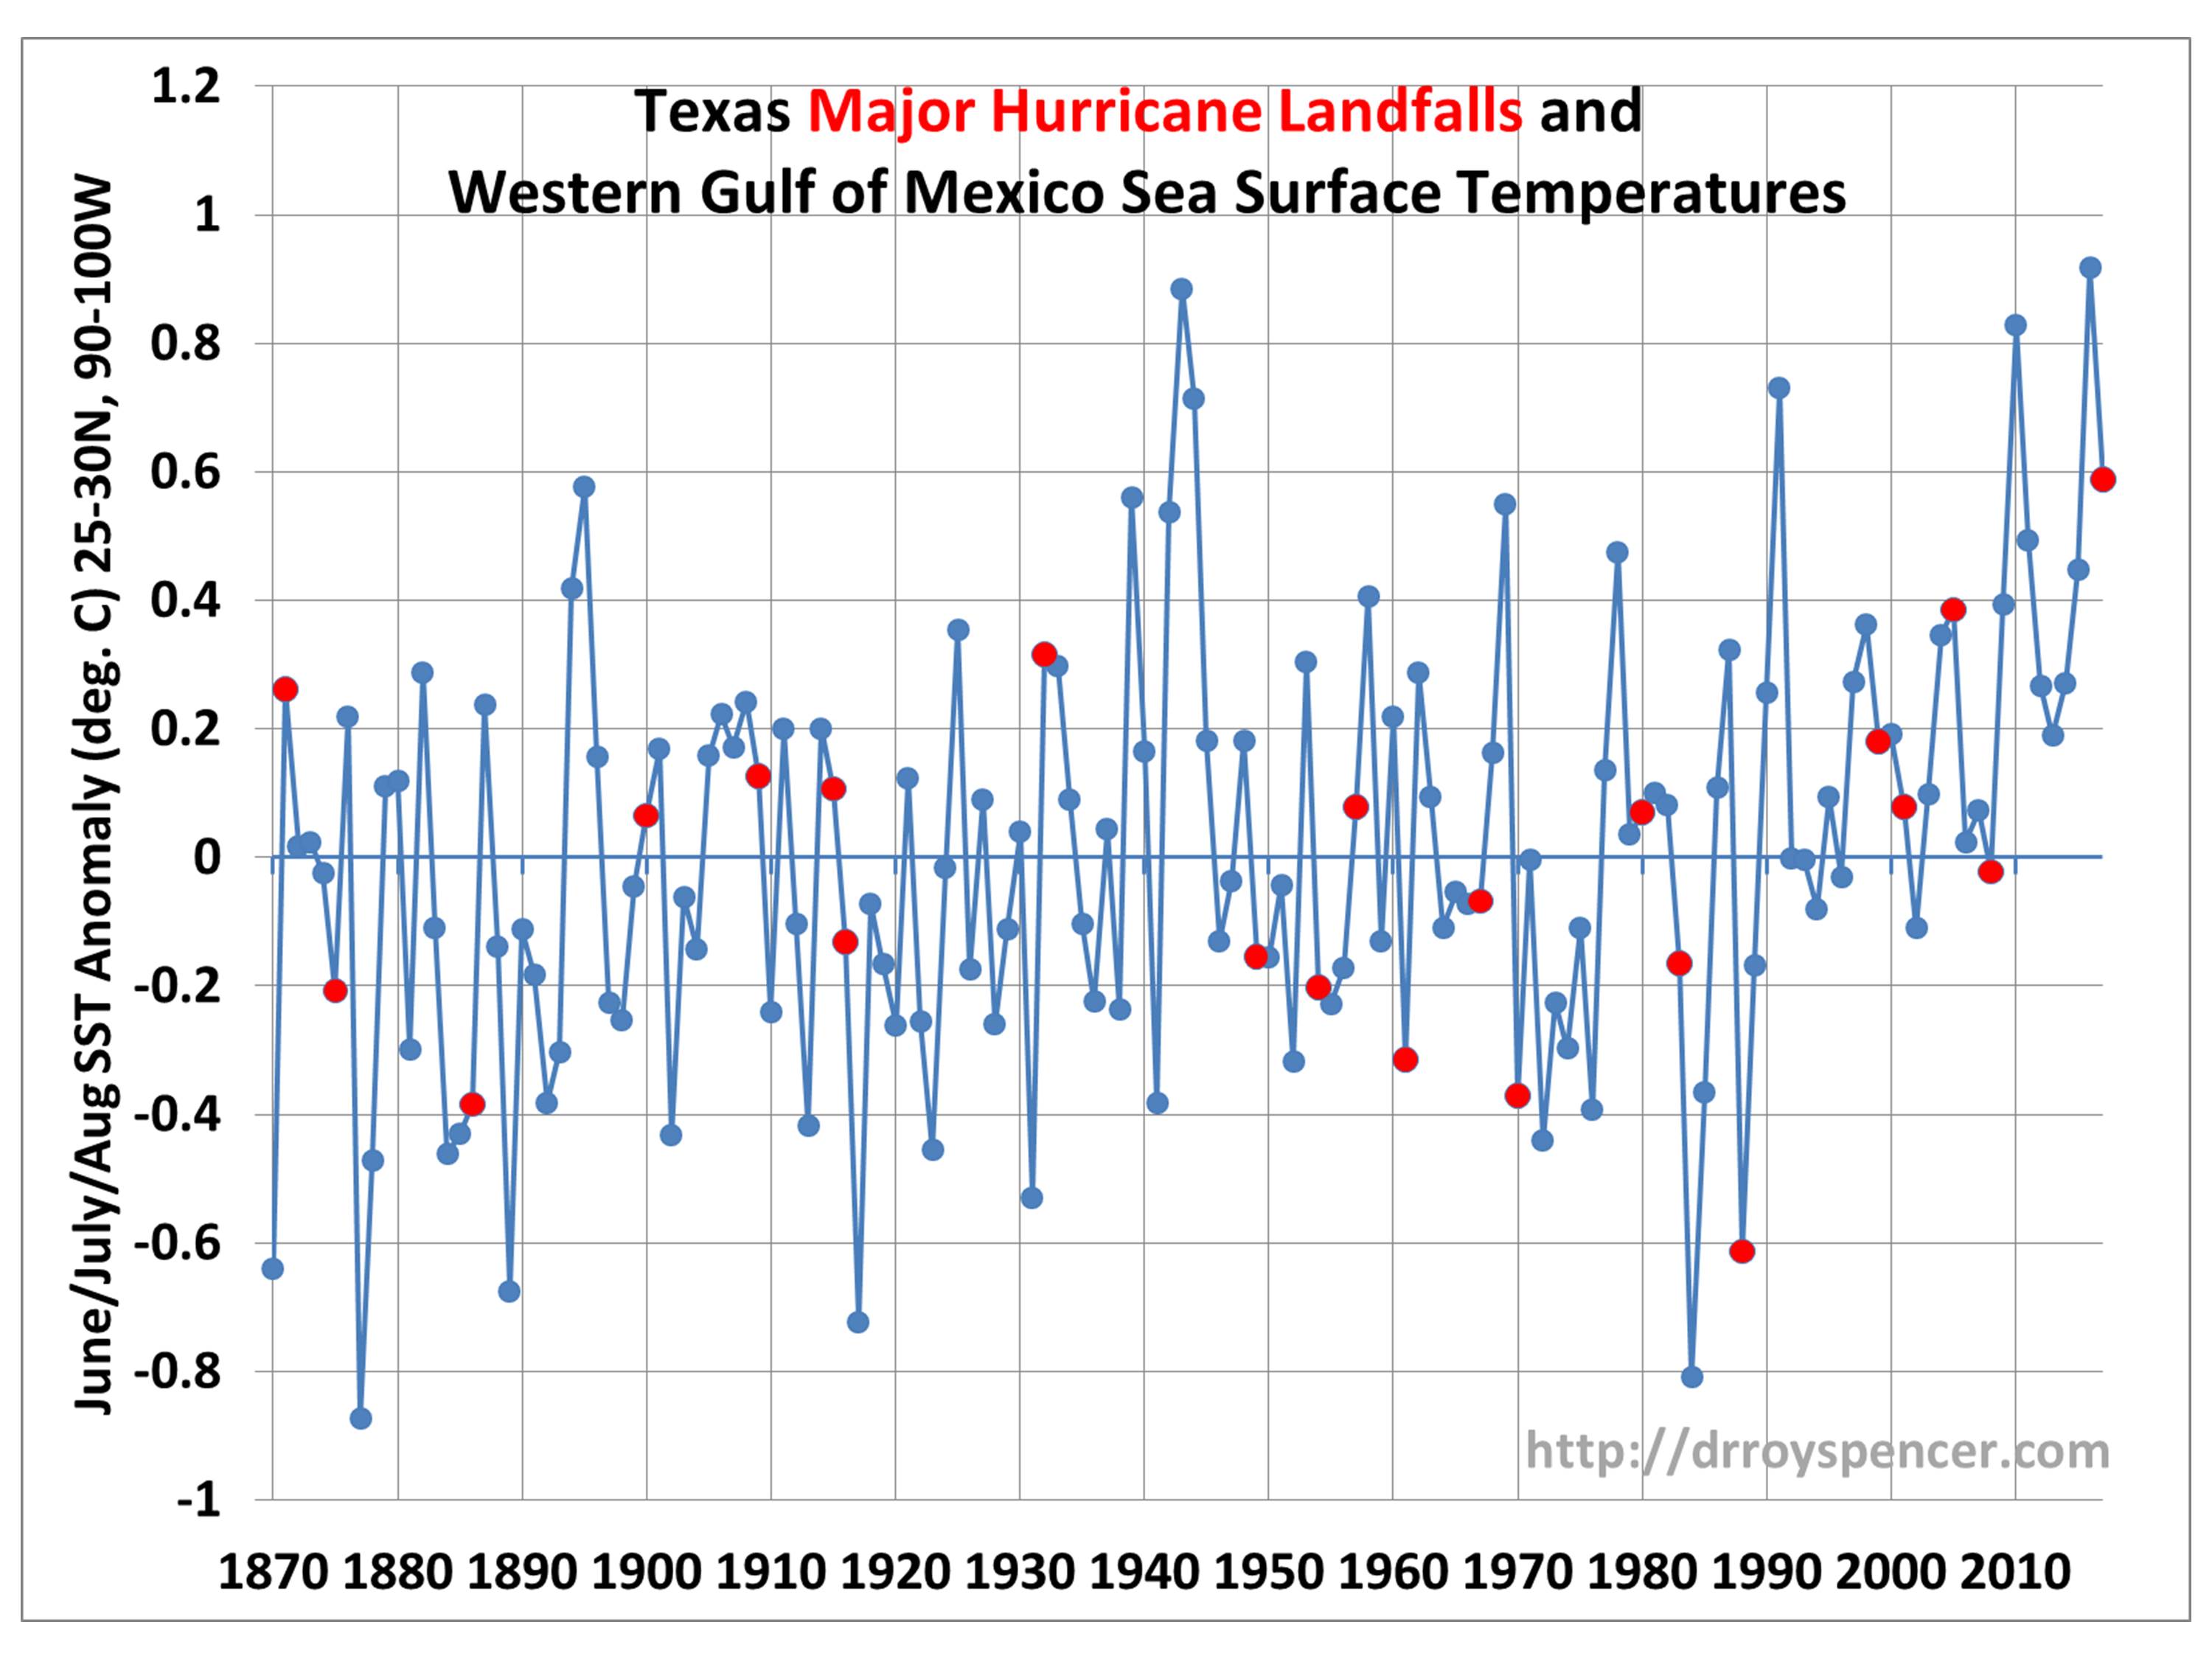
Red dots indicate years of major hurricane strikes in Texas, plotted on average SST departures from normal by year over the western Gulf of Mexico (25-30N, 90-100W). Note I included Hurricane Ike in 2008, which was barely below Cat3, but had a severe impact.

Why is that? It’s because hurricanes require a unique set of circumstances to occur, and sufficiently warm SSTs is only one. (I did my Ph.D. dissertation on the structure and energetics of incipient tropical cyclones, and have published a method for monitoring their strength from satellites).

The Gulf of Mexico is warm enough every summer to produce a major hurricane. But you also usually need a pre-existing cyclonic circulation or wave, which almost always can be traced back to the coast of Africa. Also, the reasons why some systems intensify and others don’t are not well understood. This is why the National Hurricane Center admits their predictions of intensity change are not that accurate. Lots of thunderstorm complexes form over warm tropical waters, and we still don’t understand why some of them will spontaneously form a cyclonic circulation.

2. Does global warming cause landfalling hurricanes to stall?

I don’t know of any portion of global warming theory that would explain why Harvey stalled over southeast Texas. Michael Mann’s claim in The Guardian that it’s due to the jet stream being pushed farther north from global warming makes me think he doesn’t actually follow weather like those of us who have actual schooling in meteorology (my degree is a Ph.D. in Meteorology). We didn’t have a warm August in the U.S. pushing the jet stream farther north.

In fact, I dare anyone to look at the August temperature anomalies to date in the U.S. (courtesy of Weatherbell.com) and tell me, exactly what pattern here is due to global warming?

August 2017 (through Aug. 28) surface temperature anomalies around North America (NCEP CFSv2, courtesy of Weatherbell.com).

The flooding disaster in Houston is the chance occurrence of several factors which can be explained naturally, without having to invoke human-caused climate change. We already know that major landfalling hurricanes in the U.S. have been less frequent in recent decades. But once one forms, if it stalls near the coast (a rarity), it can be expected to cause a flooding disaster…especially in a flood-prone area like Houston.

NOTE: If you like my writing on this subject, please check out my new e-book, An Inconvenient Deception: How Al Gore Distorts Climate Science and Energy Policy.

Posted by Rush Limbaugh’s “artificial climatologist”. Ha-ha.


319 Responses to “Texas Major Hurricane Intensity Not Related to Gulf Water Temperatures”

Toggle Trackbacks

  1. garyH845 says:

    I’d imagine – guess – that if the Western Gulf SST’s had been 1 C less warm than they were when Harvey formed and came ashore, everything would have been exactly the same.

    I am curious – some out there are reporting that SST’s here are 4 degrees above normal (suspect that’s in F). They were quoting Martin Hoerling, a research meteorologist with the National Oceanic and Atmospheric Administration in Boulder, Colo.

    Also, caught this:

    “The water in the Gulf of Mexico is the heat reservoir to support these hurricanes,” says Ben Kirtman, an atmospheric scientist at the University of Miami. The warm water and air above the Gulf means there’s more energy to drive a storm such as Harvey.

    Kirtman says that doesn’t mean Harvey was directly caused by climate change. Rather, climate change is shaping conditions for storms like this one. So if Harvey was a 1-in-100-year storm, for example, “maybe it becomes a storm that could happen one in 50 years, or one in 20 years, or one in 10 years,” Kirtman says.

    “directly caused . .” — Unbelievable!

  2. ren says:

    Let’s see that the pressure pattern is visible even at a height of over twenty kilometers in the stratosphere.
    http://images.tinypic.pl/i/00928/i8vvighgqw6o.png
    http://images.tinypic.pl/i/00928/1zkuu15g936n.png

  3. garyH845 says:

    Interestingly, Roy, I’m counting 11 red dots above the line, and 11 red dots below the line.

    These are all majors, cat 3-4 correct? Don’t believe that TX has a cat 5 in it’s history.

  4. ossqss says:

    Here is the TCHP from the 23rd in the Gulf. Nothing special there either.

    http://www.aoml.noaa.gov/phod/dataphod1/work/HHP/NEW/2017235go.jpg

  5. ren says:

    Global warming is not visible in Australia.
    http://files.tinypic.pl/i/00928/szuvgkrvwxnl.png

  6. sunsettommy says:

    Weather Research Center

    Here is a long list of flooding in the Houston area starting in 1837,

    Significant Houston Area Floods

    http://www.wxresearch.com/almanac/houflood.html

    There have been many huge floods there over the last 180 years. Trying to single out Harvey for propaganda purpose is silly.

    • AaronS says:

      Great list!

      Here is a paper showing tree ring O isotipe data as a proxy for Hurricane activity. Its not that popular and guess what? It shows a decrease in storms during industrialized times.

      http://m.pnas.org/content/103/39/14294.full#F3

    • Nate says:

      Nice list. Makes you wonder why any homes built near bayous.

      I believe they did some development of large catchments, that would have avoided some of those past floods. This storm still looks tops for rainfall.

  7. Jay Alt says:

    I wonder what hurricane model would ever use the metric you plot? None, naturually. Because local water temperatures control hurricane strength, not 3 month averages.

  8. Scott says:

    How exactly would Harvey have behaved differently if the government had confiscated more of my money in a carbon tax and forced me to buy uneconomical renewable energy?

    • lewis says:

      Why Scott, if the government had taken all your money, and left you no Carbon to use, there would have been no hurricane, EVER!

      • DHR says:

        Also Scott, if the government had taken all your money, you would not have a house, therefore, “your” house would not have flooded. See how well that works?

        • David Appell says:

          People want nice roads, nice airports and hospitals, nice military carnage on demand, clean sewage systems and ample water supplies and security in their old age, and health care whenever they need it, and disability benefits, and skillful government employees and street drains and cheap electricity and irrigation for their crops and rockets that go to the moon and scientific research and govt sponsorship of medical research and cheap leases for oil and gas and coal and so on and so on…

          …but they don’t want to pay for any of it.

          • barry k says:

            I think most reasonable people are willing to pay for what they want. But many folks would rather not have money taken from them (i.e. by force) by a government who does such things ineffectively or at least inefficiently.

          • Nate says:

            barry k,

            I think Texas politicians generally agree with you. Except this week, they want all the federal assistance and $ they can get.

          • David Appell says:

            If you don’t like taxes taken “by force,” go live in Ethiopia. Tell us how well you get along.

            They are the price of civilization. Most modern countries understand that. Many in the US do not.

          • David A says:

            What simplistic nonsense, a rational balance of power of government, (international, fed, state, local, balanced with individuals liberty is worthy of great discussion, not the 6th grade simplistic triviality Appell articulates.

          • barry k says:

            Nate, I would certainly put natural disasters, like hurricanes, in the category where federal spending is necessary.

            David, I see you fixated on one word and completely blew past my point. I’m sure when you pay for something you appreciate value or getting more for your money. The point is when government does things that typically isn’t the case.

    • David Appell says:

      Why do you think renewable energy is “uneconomical?”

      • AaronS says:

        Dave, I look at the real data from Germany and see their coal bailout of what would be energy shortages. Nuclear is green and economic, but I assume you mean wind and solar since they are the nost popular today. Also it may become economic for electricity but not cars, planes, and ships that all need fossil fuels.

        • David Appell says:

          But did you factor in all the (huge) economic damage done by FF poll ution?

        • alphagruis says:

          There is also agriculture that needs fossil fuels (or synthetic fuels) too and there is definitely no alternative way to power agriculture and feed as much as 7+ billions people with renewable wind and sun. At least not yet and most likely there will never be.

  9. JontheTechnologist says:

    Dr. Roy,

    Please correct me if I am wrong, isn’t the formation of a Hurricane
    dependent on the difference in temperature between the SST and the atmosphere above regardless of the SST. How much of a difference and at what altitude, if that is available?

    • Good question. Actually, no. I remember having a discussion in my office with one of the NHC forecasters on that very subject.

    • Nate says:

      Discussion of that here:

      http://www.aoml.noaa.gov/hrd/hrd_sub/dynamics.html

      they say 16 km and -70C.

      Notice that temp difference between a sea surface temp (SST) at 26 C (Hurricane not sustainable) and atm is SST-atmT = 96C.

      Whereas SST-atmT = 99C for a strong hurricane @ SST 29C.

      This suggests, IMO, that SST-atmT is a not very important factor in determining hurricane strength.

      Whereas, slight changes in SST seem to matter a great deal.

  10. JontheTechnologist says:

    Dr. Roy,

    Also, the map shows that recent temps for North America going all the way to the coast of Texas are quite low.

  11. Nate says:

    By limiting your data to only Texas ‘major’ hurricanes that make landfall you are looking at very few data points. This gives a statistically meaningless result. And you should know this.

    Why not look at all Atlantic hurricanes?

    • Norman says:

      Nate

      I do not believe Dr. Spencer was trying to make a statistical result. From my reading it was a rational attempt to head of the media frenzy to use a terrible disaster as a propaganda tool to herd unscientific people into a fear fence and fleece them of their incomes.

      It does seem to be a standard process of the MainStream Media to use natural disasters as a means to generate fear and unease in the general public. The scientists may not say Harvey was the result of Climate Change but if they lump the two in the same thought the general Public will hear that Harvey was caused by Climate Change. Also it is a record setting storm (the 24 hour record was in Alvin, Texas in 1979 at 42″). This storm is generating the largest rainfall for a single storm.

      For media. A large fire somewhere (climate change disaster), tornado (climate change disaster), flood (climate change disaster).

      Even assigning probability to increases in disasters is poor science based a lot on what you posted. We have a few decades of good coverage and measurements of severe weather events. This is such a small sample size to predict how rare or exceptional such storms are or if there are cycles to such patterns where you have no major landfalls then you have a cycle where you have numerous. Just not enough information to determine anything about patterns of extreme weather. There are some theories floating around but none can be substantiated with valid data covering large areas over long periods of time.

      All we can know is that the sea level is rising at a small rate and that global temperatures seem to be rising (but not nearly as fast as some speculate they will).

      I do not mind the theories and ideas, I do not like using fear and ignorance as a tool to achieve some political aim. I like reason and logic, facts and evidence. What is wrong with those?

      • Ross says:

        HE CHERRY picks to satisfy his own conservative IDEOLOGY. He is a contrarian Climate Scientist based in meaningless 7 day creationism. Yes – he should understand that Old Day Earth is scientifically validated. Choosing cherry picked statistics that re-enforce his hypothesis is his forte. That is his “science” at work. It is selective and deaf to other parameters and data.

      • lewis says:

        Norman,

        The purpose of the media is to agitate the people, and to keep them agitated. Read Hitler and Alinsky on this subject.

        The press is complicit, and gets good advertising dollars to encourage them.

        I don’t watch TV, period. Suggest you give it up. You will find yourself calmer.

        • spalding craft says:

          “The purpose of the media is to agitate the people…” This may be true in a totalitarian state, where government controls the media. This is not so in a free state. Media may emphasize the sensational story to sell newspapers and boost ratings, and may push a certain agenda. That’s why you should read more than one newspaper, and why you should not restrict your TV viewing to Fox News, for example.

          • DaveR says:

            It’s certainly mighty difficult within UK for instance given legislated requirement to annualy cough up 147 for the right to even own a TV/’net/text capable receiving device, irrespective of whether the owner watches the persistent guff persistently outpoured by the Beeb’s own climerati. Under penalty of jailtime, too, no less. Generations worth of successive political administrations refuse to become actively engaged despite increasingly acknowledged founded concerns.

            Get a grip here – we’re actually trying to do you a favour. Lots of them, in fact.

        • David Appell says:

          lewis says:
          “The purpose of the media is to agitate the people, and to keep them agitated. Read Hitler and Alinsky on this subject.”

          As if anyone cares what Hitler thought on the subject — in an extremely different time and country — or Alinsky, whom no one has ever heard of except for paranoid right-wing extremists.

          • David A says:

            Tying Clinton to Alinsky is pretty easy; she wrote her undergraduate thesis at Wellesley College about him and even interviewed him. BLM and antifa are straight from the playbook, as are the DNC tactics revealed by the Veritas videos.

      • David Appell says:

        Norman wrote:
        “For media. A large fire somewhere (climate change disaster), tornado (climate change disaster), flood (climate change disaster).”

        And you have a large number of media dedicated to dismissing manmade climate change. The WSJ, 3rd largest newspaper in the country. Fox News. National Review. Brietbart. Daily Caller. Drudge — the most widely read Web site in the US.

        You’re not looking at the whole picture.

    • Nate says:

      Norman,

      I agree with much of what you say. The media can hype things, they do it in both directions. Good media, NYT, has articles with proper caveats.

      At the same time this blog tends to present things in this way, that are misleading.

      He attempts to answer a question:

      ‘Are Texas major hurricanes dependent on an unusually warm Gulf?’

      It portrays it as if he answered this question. He didnt. Not with any statistical significance.

      Readers who dont have critical thinking skills will be misinformed, once again. (PS when I search for Roy, the 3rd entry is Climate Misinformer)

      Why choose such a small sample? He perhaps should have cited literature that has more stat significance. These show an effect of temperature, at least the ones I know about. So that is probably why.

      • Norman says:

        Nate

        I like the tone of your posts. A more refreshing approach than the mindless deniers who loathe reading any physics books.

        I found this link to EPA data and it really does not show much change in anything in several years. Droughts show no upward trend and we still have not seen anything comparable to the 1930’s for drought severity. With floods, some area of the US are seeing more flooding rivers but other areas are seeing less. No overall trend in overall increased flooding.

        https://www.epa.gov/climate-indicators/climate-change-indicators-tropical-cyclone-activity

        This sight also has a hurricane Power Dissipation Index based upon ocean surface temperature. It shows some correlation but then none at all in the later years. With this type of data I would think it hard to form a positive statement that warmer water will lead to more powerful hurricanes.

        https://www.epa.gov/climate-indicators/climate-change-indicators-tropical-cyclone-activity

      • Mathius says:

        “Are Texas major hurricanes dependent on an unusually warm Gulf?

        It portrays it as if he answered this question. He didnt. Not with any statistical significance.”

        Nate, actually, Dr. Roy answered it perfectly! Dr. Roy stated, “As can be seen, major hurricanes dont really care whether the Gulf is above average or below average in temperature”.

        The usual hypothesis is: Warmer temperature are more conducive for major hurricane development

        However, as you correctly pointed out, for the western Gulf of Mexico, this is an unprovable claim!

        It’s clear that major hurricanes can develop with positive and negative SST anomalies. More than likely the main reason is because the Gulf of Mexico is ALWAYS warm enough to support major hurricane development at this time of the year.

        • David Appell says:

          Stretching the anomaly out over 3 months is not convincing. Since Roy obviously has such data, I’d like to see a comparison to the SST of the month the hurricane occurred in. Or, say, 14 days before it occurred.

          • Mathius says:

            I agree, I think it would be better shown that way too. Maybe another graph showing the absolute temperature (seeing normals would be different per month).

            SSTs are not known to change a rapid pace like air temperatures are though, so this graph likely gets the main story down well!

          • David Appell says:

            Globally maybe. That doesn’t mean the same is necessarily true for local or regional conditions.

        • Nate says:

          ‘Nate, actually, Dr. Roy answered it perfectly! Dr. Roy stated, As can be seen, major hurricanes dont really care whether the Gulf is above average or below average in temperature.’

          Are smokers more likely to have heart disease?

          To answer that lets look at my deceased, extended family members who’ve had heart disease. 3 nonsmokers had heart disease, 2 smokers had heart disease. So no, smokers not more likely to get heart disease.

          Did I answer the question?

          • Mathius says:

            An attempt at a good analogy was made. Except you’re missing something… The burden of proof that climate change makes western Gulf of Mexico hurricanes is on you, you’re thinking about this backwards!

            As Roy has shown, and as you have pointed out, the case cannot be made.

          • David Appell says:

            The case is on everyone. Everyone on the coast suffers, whether the science is all tied up in a nice pretty bow or not.

            The basics of AGW are settled science. The reprecussions are difficult to work out, but you don’t get to sit back and smirk while those who accept the science prove it to the 95.000001% level. That’s way too dangerous.

            You’re viewing this as a competition, and not as how it affects and destroys people’s lives.

          • Nate says:

            ‘Burden on of proof on you’

            Not me, the research community. They havevfound supporting evidence when looking at ALL hurricanes.

            Just as with smoking and heart disease, evidence is clear when looking at large populations.

          • George says:

            Appell says,

            “The basics of AGW are settled science.”

            That is pure BS! NO IT ISN’T. Stop peddling that crap. Dr. Berry has already demonstrated to you that humans aren’t the main reason for CO2 increases. YOU have not been able to refute him. How come? Stick to Chemistry because you have no clue when it comes to climate dynamics.

            Why Dr. Spencer allows you to troll this site is a mystery. You are a PHD speaking out of your field and it is obvious.

          • George says:

            Sorry Appell, your PHD isn’t Chemistry it is in Physics. Still you can’t refute Dr. Berry. I had you confused with another failed gadfly on Dr. Berry’s website, Eric what’s-his-name.

          • aaron says:

            “They have found supporting evidence when looking at ALL hurricanes.”

            Kerry Emanual disagrees.

            There was no change in cyclone activity up though the start of the decade. There was a slight increase in hurricane activity up until early 2000s which was offset by decline in rest of world. That correlated with rising GAT, but I’ll speculate it probably had more to do with AO or AMO than GAT.

    • barry says:

      Why not look at all Atlantic hurricanes?

      Indeed. Or even global.

      The results would likely be different. While cyclones generally show no long-term trend, intense hurricanes (Cat 3+) globally have increased, especially in the Atlantic.

      WRT global warming, Dr Spencer’s posts on hurricanes consistently cherry-pick location. He lives in the US, so one could understand a particularly US focus, but when stuff about global warming is implied that focus is way too narrow.

      • MikeN says:

        ACE index shows no trend globally.

        • David Appell says:

          Actually annual global ACE has a trend since 1970 of +2.4% +/- 4.7% per decade (2-sigma). Statistically significant at the 70% level.

          ACE Source:
          http://models.weatherbell.com/global_ace_monthly.dat

          • Mathius says:

            David, that’s very low confidence from a statistical standpoint. Also, as you can tell, ACE values on average peaked in the 1990s, so imposing a linear trend does no justice as the fluctuations have been large.

            No trend globally in ACE.

          • David Appell says:

            Would you bet your life against only a 70% chance you might be killed?

            No, neither would I.

            And, as everyone knows, or should know, you can’t judge a time series by when its maximum value occurred.

          • Mathius says:

            Appell, the margin of error is larger than the trend itself. Calm down.

            Anyone who has taken statistics knows a result like this means “Low confidence”

          • David Appell says:

            You don’t understand statistics.

            If your life depended on a flip of a coin, and one side was 70% likely, would you bet against that?

          • Mathius says:

            2 sigma is the standard for statistical significance. Your trend barely scrapes past 1. You’re getting pretty boring with this futile defense.

          • David Appell says:

            Actually physics uses 5- or 6-sigma. But other sciences almost never can obtain that.

            There’s nothing magical and 2-sigma or 1-sigma or any other sigma. It’s always a matter of interpretation.

            If a doctor said you had a 70% chance of dying from your cancer, you’d take that VERY seriously, instead of telling him you’ll wait until he’s 95% sure.

          • Mathius says:

            2 sigma is pretty standard in climate science. But don’t let standards and common sense get in the way of a horrible analogy as has been presented.

          • David Appell says:

            Common sense is exactly what I’m talking about.

            If a doctor said you had a 94% chance of dying from your cancer, would youd take that seriously, or tell him you’ll continue smoking until hes 95% sure.

          • mlf says:

            Appell, people have more cancer than 100 years ago, and people take more baths than 100 years ago. Since it’s statistically proven that bathing causes cancer, bathtubs should be heavily taxed and the money used for government-issued Wetwipes.

      • Mathius says:

        barry, I agree with you, results would likely be different with a global analysis. However, in this specific instance, many scientists, and much of the MSM are jumping to conclusions on this hurricane.

        The Gulf of Mexico this time of year is very, VERY warm. So much so that negative SST anomalies are still warm enough to support major hurricane development. Therefore in this sense, it is not possible to conclude warmer anomalies contributed to Harvey’s development. I believe that is the main point here.

        • Nate says:

          The anomalies were positive, about 1C.

        • barry says:

          barry, I agree with you, results would likely be different with a global analysis. However, in this specific instance, many scientists, and much of the MSM are jumping to conclusions on this hurricane.

          I don’t agree it’s “much of the MSM.” I’ve read a lot of reporting on it and the only over-interpreting I’ve seen has been linked by skeptics. I guess that the notion this kind of reporting is widespread is an echo-chamber effect.

          But I’m not that interested in the MSM, just getting the science right. I don’t think Dr Spencer’s cherry-picking is an appropriate response to bad reporting. Two-sided misinformation does not cancel out and reveal the truth.

          • Mathius says:

            Doing a quick google search of “hurricane harvey climate change” reveals I’m more or less accurate in my statement.

            Harvey was the subject, so I don’t see why it’s absurd to do an analysis on where Harvey developed, as Dr. Spencer did. This analysis is meant to tackle the arguments of a “climate change fueled storm”, as has been reported.

          • barry says:

            I did a quick google search for Hurricane Harvey with and without “climate change.”

            3 million hits with “climate change.”

            85 million hits without “climate change.”

            3.5% of articles (possibly) link Hurricane Harvey with climate change.

            Caveats:

            “Climate change” and Hurricane Harvey can be on the same page but not in the same article. So the ratio is too high.

            The first article was The Conversation (an Australian not-for-profit, academic website), and it de-linked Harvey from climate change. This is a website that accepts AGW, so that suggests the ratio is even lower.

            Articles included skeptic websites de-linking Harvey from climate change. So the ratio is lower still.

            In accord with my reading, the ratio of articles linking climate change to Harvey is probably on the order of 1-2% of all articles on the topic. And the idea that it is otherwise is a result of the skeptic echo-chamber.

            Please, feel free to replicate my quick google. You’ll probably get a different bunch of links at the top, depending on your reading habits.

            Harvey was the subject, so I dont see why its absurd to do an analysis on where Harvey developed, as Dr. Spencer did. This analysis is meant to tackle the arguments of a climate change fueled storm, as has been reported.

            I maintain that few media outlets have made the link, and that Dr Spencer’s response is misleading WRT global warming. Borrowing an unsound premise from bad reporting, it lacks context, the bigger picture, etc. To unearth the truth, neither over-interpretive reporting nor Dr Spencer’s article(s) will get you there.

            Egregious reporting pops up on both ‘sides’ of the debate. Clear vision doesn’t come from putting that crap front and centre.

            Dr Spencer has for some years been counting the days since at Cat 3+ hurricane made landfall in the US. This is another example of his penchant for cherry-picking on the subject WRT to global warming. There is form on this. Isn’t it better to seek the unbiased truth?

          • David Appell says:

            barry, this kind of methodology is ridiculous. Almost comical. It proves nothing whatsoever.

          • barry says:

            What are you talking about? A google search?

          • David Appell says:

            Yes, a Google search. Completely unscientific, loaded with biases.

          • barry says:

            Of course it’s not rigorous.

            How would you go about determining the ratio of MSM articles connecting Harvey to global warming, to all MSM articles on the event?

      • barry says:

        For total cyclones/hurricanes that’s true. For Cat 3 and above, there has been an increase world wide, as I said, and for the Atlantic region the trend in total cyclonic intensity (all categories) there has been an upward trend since 1970.

        Please take note of the specifics. Dr Spencer tends to focus on Cat 3 and higher hurricanes.

        • barry says:

          Sorry, that was a reply to Mike above:

          ACE index shows no trend globally.

          • David Appell says:

            No true, as I wrote elsewhere here.

            Since 1970, trend in annual global ACE = 2.4% +/- 4.7% per decade (2-sigma statistical uncertainty).

          • barry says:

            I don’t buy that, David. The uncertainty is too large.

            We use fine points of statistical uncertainty (95% confidence) to rebut ‘skeptic’ analysis. There’s no reason to lower that bar just because it’s convenient to an opinion.

            Furthermore, no trend for total ACE is consistent with the weight of mainstream expert opinion on the matter. It’s also consistent with projections.

            Mainstream and skeptic opinion agrees that there has been a positive trend in ACE since 1970 for Cat3 hurricanes/cyclones and above. Also consistent with projections, although a strong link there is not yet determined.

            Though this mainstream list of key points is a decade old, little has changed in the outlook. Take note of the uncertainty.

            1. Though there is evidence both for and against the existence of a detectable anthropogenic signal in the tropical cyclone climate record to date, no firm conclusion can be made on this point.

            2. No individual tropical cyclone can be directly attributed to climate change.

            3. The recent increase in societal impact from tropical cyclones has largely been caused by rising concentrations of population and infrastructure in coastal regions.

            4. Tropical cyclone wind-speed monitoring has changed dramatically over the last few decades, leading to difficulties in determining accurate trends.

            5. There is an observed multi-decadal variability of tropical cyclones in some regions whose causes, whether natural, anthropogenic or a combination, are currently being debated. This variability makes detecting any long-term trends in tropical cyclone activity difficult.

            http://www.aoml.noaa.gov/hrd/tcfaq/G3.html

          • David Appell says:

            barry, there’s nothing magical about p=0.05.

            Would you ignore a medical test just because it says you have a 70% chance of having a serious disease, and only believe it if and when further tests show 95%? Of course not.

          • barry says:

            The rise could be a statistical artefact rather than an actual trend considering the variability. I apply the same reasoning when talking about the global temperature ‘pause’.

            And you don’t have to take my word for it, you could read the advice provided (above) by a workshop of a global community of hurricane experts.

            4. Tropical cyclone wind-speed monitoring has changed dramatically over the last few decades, leading to difficulties in determining accurate trends.

            5. There is an observed multi-decadal variability of tropical cyclones in some regions whose causes, whether natural, anthropogenic or a combination, are currently being debated. This variability makes detecting any long-term trends in tropical cyclone activity difficult.

          • David Appell says:

            barry says:
            “The rise could be a statistical artefact rather than an actual trend considering the variability.”

            Of course it could be — that’s always a possibility, no matter what the p value.

            If you doctor said you had a 70% chance of dying from your cancer, would you avoid treatment until she was sure at the p=0.05 level?

          • barry says:

            The analogy isn’t convincing, either. Here’s a better one for what what the experts are saying about hurricanes (and it avoids rhetorical hyperbole).

            My doctor notices I have an irregular heartbeat. It seems to beat faster occasionally and over the week-long course of ECG monitoring there was a 2.4% increase, but not statistically significant.

            She tells me that my heart may be speeding up, but it’s not definite, and to keep monitoring it.

            Exactly the conclusion reached by the global community of hurricane experts re global ACE trends.

  12. SNOWREADY says:

    Houston is prone to floods wether warm ocean temperatures or agw has anything to do with it or not. It would be wise to rebuild Houston using better flood resistant code. That would save tax payers and businesses more money in the long run.

  13. SNOWREADY says:

    Ren the satellite temperature for the arctic has been running near normal sense spring.

  14. Tom Morrison says:

    Quick question – you indicate a Cat 3 or worse landfall in 2009. Which hurricane was this? Why documented at Cat 3 or higher at landfall. Confused because of hurricane drought – no Cat 3 or higher landfall in USA since 2005.

  15. Laura says:

    Alarmists are excited with this latest bit of climate porn. It’s been long coming. After all, a hurricane during hurricane season in a hurricane zone? Alarmist don’t care. Weather is climate for them and if they can profit from it, they rush like ghouls to sell corpses.

    The likes of Appell, Nate, and similar creatures don’t care about scientific facts. This is tribalism to them. If you are an alarmist, you can make any absurd, outrageous claim (see Gore) and they will get out of their way to defend you. If you are a normal human being and claim the sky is blue, they will try to vilify you, jail you, have you fired, or shoot at you.

    Will there be more natural disasters in the future? Evidently so. Will the alarmists try to cash on them? Inevitably so. It is who they are, climate ghouls.

    • Svante says:

      It think they do care about scientific facts, but they rarely get any. They usually get hand-waving, slander and abuse.

    • dr No says:

      Try and deny these facts :
      Tropical Storm Harvey has set a preliminary Lower 48 U.S. rainfall record for any tropical storm or hurricane as it continues to soak the upper Texas coast and Louisiana, worsening record-breaking, catastrophic flooding.

      The Cedar Bayou gauge near Highlands, Texas, has reported a preliminary 51.88 inches through 3 p.m. CDT Tuesday. This total will likely climb higher as Harvey’s rainfall continues.

      A Harris County Flood Warning System rain gauge near Friendswood, Texas, reported a four-day storm total of 49.32 inches through 9 a.m. CDT Tuesday.

      If either of these are confirmed, it would be the heaviest storm-total rainfall from any tropical cyclone in the continental U.S. in records dating to 1950, topping the 48-inch storm total in Medina, Texas, from Tropical Storm Amelia in 1978.

      I will be interested to hear all you nincompoops explain it all away as nothing unusual.

      • gbaikie says:

        I think the oceans in last century or so has warmed by about 3 inches. I believe in our last interglacial period, the oceans warmed by about 1 meter higher than current ocean level due to thermal expansion of warmer ocean.

        When a ocean warms it increases global air temperature and in the last interglacial period one had warmer ocean and a higher average global temperature. The result is more tropical condition outside of the tropical zone.

        In a tropical climate there is higher humidity, more rain fall and it and lacks air temperature extremes- at sea level temperature never drops below freezing and lacks the high temperatures commonly found in temperate regions during the summer.

        So having more tropical condition outside the tropics, having higher humidity [or higher average humidity] less temperature extremes [less periods high air temperature and less or no freezing temperatures if near sea level.

        Or Earth’s atmosphere is always warmed by the temperature of the ocean and when ocean temperatures increase the ocean will increase then amount it warms the Earth’s atmosphere.

        The ocean warms the atmosphere by evaporating and can only warm the air to the temperature of the ocean surface.
        Or ocean only can reach about 35 C, and 35 C is the highest temperature it can warm the air.

        Land surfaces don’t warm the world, rather 70% of earth surface covered by ocean warms the world.
        Dry land surface can reach 70 C, and air above can reach 50 C or more.

        Earth average temperature is 15 C, the ocean global average surface [water and air above] is 17 C.
        The ocean absorbs more sunlight energy than the land does- per square meter.
        The average ocean temperature 17 C and the Earth’s temperature of 15 C, is due to the tropical average temperature of about 28 C, and this is 40% of of the total surface area of earth. Or 60% portion outside the tropics has average temperature well below 15 C.
        Or 40% of class of 100 has score of 28, and average class score is 15, what average of 60% of the class:
        1500 – 1120 is 380 / 60 and their average score [or temperature] of 6.34. Of course in the 60 students one has quite a number of Antarctica [-50] and Russian and Canada [-4 ]. Continental US is 13 C. Africa is hottest continent but it’s largely in the tropical zone [very small part of the 40 students- or 40% of 510 million km is 204- and make simple, the entire continent of Africa is 30 so 6 students. Got about 8 land students and 32 ocean students [and ocean students have highest scores- and ocean students or tropical ocean heats the rest world.

      • Laura says:

        Climate ghoul “dr No” attacks. We are in the way of his grave-robbing.

        How about if you prove your motivations are not tribal by providing links to your hearty exchanges with the likes of Gore.

      • lewis says:

        As a nincompoop it will be easy.
        You’re cherry picking. Go back 2000 years and give me the records for that period. As it is you only give 66 years, a blip.
        If, during the 2000 year period you find the 2 storms you cite as the only ones of more than 40 inch rainfall in a short period of time, say, less than 4 days, then, and only then, will I pay attention to you.

      • David A says:

        Harvey was not more intense.
        Harvey hovered.

    • Nate says:

      Weather porn is what Ive watched, but i didnt enjoy it.

      Science facts are among my favorite things..

    • David Appell says:

      Laura says:
      “The likes of Appell, Nate, and similar creatures dont care about scientific facts.”

      Laura – I have yet to see you present a single fact on this blog. Not even one.

      Nate, I and others like barry present them constantly. Shame on you for lying about that.

      • Laura says:

        Like I said several times, please post links to your exchanges with alarmist like Gore where you question and challenge their blatantly absurd claims.

        Until then, you lot are no more than tribal climate ghouls that only care about affiliation and don’t give a hoot about facts unless you can use them to bludgeon those you consider to be your enemies.

  16. dr No says:

    And, by the way, climate scientists have been predicting for quite some time that one effect of global warming would be that wet events and regions will get wetter, while dry events and regions will become drier. Harvey is consistent with this prescience.

    • RealOldOne2 says:

      dr No said: “climate scientists have been predicting for quite some time that one effect of global warming would be that wet events and regions will get wetter, while dry events and regions will become drier.”

      BS. Just a few years ago climatologists claimed that Texas was a dry region and that the 21st century weather for Texas would be like the 2011 drought stricken conditions. https://realclimatescience.com/wp-content/uploads/2017/08/Image655_shadow.png & https://realclimatescience.com/2016/06/the-official-and-authoritative-obama-texas-drought/

      Of course that alarmist scare propaganda was in 2011 when there were drought conditions throughout Texas. Now that Texas is getting above normal precipitation, the flimflam snake oil peddlers of your climate cult religion have reversed 100% and are claiming that their flawed, faulty, falsified, failed models were predicting more precipitation.

      They’re doing exactly what doomsday cult leaders do, deny reality, lie with impunity and blame everything on their CO2 god, which causes everything, higher temperatures, lower temperatures, more precip, less precip, more snow, less snow, more hurricanes, fewer hurricanes. Quite pathetic.

      • dr No says:

        OldOne, I like your use of alliteration.
        Let me try a simple analogy for what may be happening.

        Imagine a morning train picking up passengers from stations along the line and depositing them at the end of the line.

        The train company decides to double the size of the carriages, but halve the number of trains.( Doubling the size of the carriages could be regarded as analogous to warming parcels of air and increasing their moisture-holding capacity.)

        1. The same number of people get delivered each morning.
        (the hydrological cycle is preserved)

        2. The trains are less frequent. The number of trains arriving at the end of the line are fewer.
        (rainfall events are fewer, dry conditions last longer)

        3. But the number of passengers exiting at the end of the line each time a train arrives is doubled.
        (rainfall events are more intense).

        • sunsettommy says:

          DR. No, you didn’t even address what RealOldOne2 article stated about Texas drought going to be long lasting.

          • mlf says:

            Dr. No, the company decided to double the size of carriages (warmer atmosphere), but they were never able to halve the number of trips because when people (water) saw the extra room, they immediately boarded and headed to various destinations up north. Then one day, unfortunately when the train was packed because of a big ocean tour (hurricane), there was snow across the tracks (high pressure) and since the train could proceed no further, all the passengers deboarded at the first stop.

            Well, they didn’t really double the size of the carriages, that was just advertising hype. They just added two extra seats.

        • barry says:

          And you didn’t read the links either, or you will have noticed that the US report also mentioned hurricanes events in Texas with heavy rainfall.

          Not that “Realclimatescience” reported that – it headlined “permanent drought” in Texas, which appeared nowhere in the article it referenced.

          Crap websites muddy the waters. That one is notoriously bad.

        • RealOldOne2 says:

          More BS. Sad.

    • ossqss says:

      Perhaps it would be easier to tell us something that climate scientists, whatever that acually means, have not predicted?

    • TedM says:

      Actually Texas was supposed to get dryer.

    • sunsettommy says:

      Dr, No,

      A real full time Meteorologist exposed and destroyed Dr, Mann’s incorrect explanation of the storm.

      Bastardi: No Michael Mann Climate change did not cause Hurricane Harvey

      By Joe Bastardi
      August 29, 2017, Reprinted with the permission of Weatherbell.com

      Dr. Mann at PSU has outdone himself. Back when New England had their famed February with snow and cold, he made the claim a warm eddy some 350 miles ESE of New England was enhancing water vapor and leading to extra snow. But:

      If he plotted trajectories from the storms he would see that the air from that source could not get back over New England since the mean flow would lead to enhanced snows in the Canadian Maritimes.

      Convective feedback from such warm eddies would act to PULL STORMS OUT TO SEA.

      The mean water vapor surface to 700 mb was BELOW NORMAL in New England in Feb 2015. The extra snow was high ratio snow with great crystal growth soundings because of the cold!

      This is why climatologists should be forced to forecast for a year, so they can get an appreciation of what the weather does, not what they think it does based on their research.

      But he may have outdone himself here.

      I was emailed this quote, supposedly from him. Its making the rounds in the skeptic community. It was in the Guardian

      The stalling is due to very weak prevailing winds, which are failing to steer the storm off to sea, allowing it to spin around and wobble back and forth. This pattern, in turn, is associated with a greatly expanded subtropical high pressure system over much of the US at the moment, with the jet stream pushed well to the north. This pattern of subtropical expansion is predicted in model simulations of human-caused climate change.

      He unwittingly describes THE EXACT OPPOSITE EFFECT to what is going on. He could not have even looked at the 5 day means! There was no expansive subtropical high. Quite the contrary there was a well forecast MJO phase 2, with a major cool trough in the 5 day means trapping the hurricane. Out to sea? In August? In Texas? When does anyone see that? They move northwest or west through the state. BECAUSE NORMALLY THERE IS NOT A MAJOR TROUGH THAT FAR SOUTH TO STOP THE STORM! When has anyone given the coast of Texas seen a storm move out to sea what does it turn around and head back southeast? Look at the 500 mb means and 5k temps, This is what is a ridge? There is a major ridge in the west like we see when there are a lot of storms. Its warm in the west cool in the east, but there is no subtropical ridge trapping this storm. Its caught in trough.

      https://junkscience.com/2017/08/bastardi-no-michael-mann-climate-change-did-not-cause-hurricane-harvey/

      ========================================
      It was a WEATHER event!

  17. dr No says:

    Even President Trump can acknowledge what is happening:
    Probably there has never been anything so expensive in our countrys history, weve never done anything so historic in terms of damage and in terms of ferocity as what weve witnessed with Harvey. ”

    However, he ruined the moment (again) by saying:
    “It sounds like such an innocent name, Ben, right, but its not innocent. !!!!

  18. dr No says:

    Despite the tragedy of the hurricane-related deaths, I still wonder:
    Does the overall number of deaths increase or decrease during such an event?
    By overall I mean the number of deaths including car accidents, homicides, heat stress, suicides etc etc.
    Does anybody have any statistics on this?

  19. John says:

    Ace index shows no global trend. I imagine he chose Texas to try and create a like for like situation. Why don’t you do the research, if you think he is cherry picking? Picking a fight with a meteorologist, with a speciality in hurricanes, likely isn’t going to end well.

    For your reference, the pattern that caused the stalling is consistent with MJO phase 2. The circumstances that brought this to Texas are well known.

  20. Mickey Prumt says:

    The five day drought of landfalling Harvey is over.

    Harvey made its second landfall near the Louisiana-Texas border.

  21. Martin says:

    I am not a meteorologist but wouldnt the high pressure system that currently is in place over much of the US mainland prevent the storm from moving north as would have been its natural path?

    In the guardian article you cite the following section is what you critizise I guess:
    This pattern, in turn, is associated with a greatly expanded subtropical high pressure system over much of the US at the moment, with the jet stream pushed well to the north. This pattern of subtropical expansion is predicted in model simulations of human-caused climate change.

    Havent they just got the origin of the high-pressure wrong? To me it seems like the lower than average temperatures is due to that the high-pressure system comes from the north, or am I wrong? You show a map of temperatures but isnt it the pressure at the surface that determines if the storm can advance north?

    The meandering and increased waviness of the jet stream is now thought to be a consequence of global warming since the polar regions (at least the arctic) is warming much faster than the rest of the globe. So high pressure systems from the north can penetrate further south and then potentially block low pressure systems coming from the south. Seems reasonable to me although I am definitely not an expert.

    The meandering also explains the extreme winter weather and storms that you Dr Spencer have highlighted on this blog several times. It would be interesting to hear your thoughts on the science behind this.

    • gbaikie says:

      “Havent they just got the origin of the high-pressure wrong? To me it seems like the lower than average temperatures is due to that the high-pressure system comes from the north, or am I wrong? You show a map of temperatures but isnt it the pressure at the surface that determines if the storm can advance north?”

      Cold air can not hold much water vapor.
      Cold air is dense. Cold dry air is densest.
      Warm air is less dense. Warm wet air is least dense.

      Having billions of tons of water as droplet of clouds in terms
      air density is not much different than having the billion of tons of water covering the ground. Clouds are like billions of tonnes of balloons in the air, but are more like heavier than air aircraft flying- like billion tonnes of drones in the air.

      Anyhow, weathermen often describe high pressure system blocking wet weather. Or clear weather of high pressure system being a force that tends to make the coming days continue to have clear skies.
      Or I would say high pressure system acts as fence but low pressure “army” can walk basically unhindered thru the fence.

      But if map had pressure rather than just temperature it might be useful. It also seems that if north is warmer one has less cold air for the jet stream.

    • Norman says:

      Martin

      YOU: “The meandering and increased waviness of the jet stream is now thought to be a consequence of global warming since the polar regions (at least the arctic) is warming much faster than the rest of the globe. So high pressure systems from the north can penetrate further south and then potentially block low pressure systems coming from the south. Seems reasonable to me although I am definitely not an expert.”

      This was a hypothesis that is currently being challenged. It is far from an established fact or even a theory.

      It also does not make sense to what I have studied. The amplitude of cold air and how far south it extends would seem to have to depend upon the amount of cold air. Cold air is heavier and pushes on the surrounding air continuously. In winter you have a lot more cold heavy air so you can cover much larger regions when it moves south of the poles.

      Here are some articles on the topic to see what you think.
      https://eos.org/research-spotlights/polar-warming-makes-jet-stream-stable-not-wavy-blocked

      http://barnes.atmos.colostate.edu/FILES/MANUSCRIPTS/Barnes_Screen_2015_WIREsCC.pdf

      https://books.google.com/books?id=vx9lAwAAQBAJ&pg=RA2-PA35&lpg=RA2-PA35&dq=jet+stream+amplitude+summer+vs+winter&source=bl&ots=VAtEByAUEF&sig=ZxDMI5c9vVF7uZkwyjcLglh4gJA&hl=en&sa=X&ved=0ahUKEwjn2dralIDWAhVrilQKHcnYAVE4ChDoAQgoMAE#v=onepage&q=jet%20stream%20amplitude%20summer%20vs%20winter&f=false

      • Martin says:

        Thank you Norman for the articles! Especially the WIREsCC article was useful reading. It seems like the matter is far from settled.

        Still find it strange that Dr Spencer tried to argue based on temperature rather than pressure. My sense of it is that you can have a high-pressure system with cold or hot air.

        Isnt the pressure more related to if the air is rising or descending in a particular area? This can of course be related to surface temperature but in the mid-latitudes isnt it often just related to the vertical atmospheric circulation? The circulation in the Ferrel cell lying at mid-latitudes is, by my understanding, driven by the circulation in the Hadley and polar cells that in turn are driven by temperature differentials around the equator and the poles. So it is not temperature at mid-latitudes that determines if it is high- or low-pressure in a particular area.

  22. Ace Index tells the story no real trend in tropical cyclones.

  23. MikeN says:

    How about that warmer water would make a hurricane stronger, dropping more rain?

  24. ren says:

    Currently, there are very strong thunderstorms in the south of Alabama.
    Now the geomagnetic activity in the north is growing again. The stream current will continue to push strongly in the east.

  25. ren says:

    “Pen Hadow in his quest to sail to the North Pole, has reached 80N and appears to have got stuck in the ice pack. Latest report:
    30/Aug/2017 14:00:04 UTC
    80 09.362N, 148 50.777W
    Course: 117 @ 0.0 knots
    -5C at 0 m above sea level”
    http://www.arcticmission.com/follow-arctic-mission/

  26. Roy,

    Indeed, Harvey stalled along a stationary front, the leading edge of a polar air mass, uncharacteristically on the Gulf Coast in August.

    If anything, Harvey stalled because of more intense, not less intense polar circulation.

  27. Ken in Idaho says:

    One thing I found “different” (by looking at a few Cat 4 hurricane tracks, with intensity) about this hurricane was how much Harvey grew in intensity close to shore. If you look at some of the other Cat 4 storm tracks on wikipedia, they have the storms gaining strength in the middle of the Gulf of Mexico over that warm water and then as part of the storm hit land, the intensity starts to fall. But Harvey went from Cat 2 to Cat 4 rather quickly, right before landfall.

    Thanks,

    Ken

  28. David Appell says:

    Why not plot landfalling hurricanes vs the SST of just the month they landed, instead of a 3-month average? Or even the week they landed.

  29. Gunga Din says:

    It’s almost amusing how Mann “et al” are trying to tie the effects of Harvey to caGW while conveniently forgetting that, from what they had been projecting, we should have been having strings of worsening “Harveys” each year for at least a decade.

    I said “almost amusing” because there are real people being harmed by this natural event. That’s nothing to laugh about.

  30. David Appell says:

    {THIS BLOG DID NOT PERMIT A REPLY HERE.}

    • Bindidon says:

      Check for occurences of Delta Charlie in you comments before claiming.

      • David Appell says:

        I don’t get what you’re trying to say.

      • barry says:

        If the 2 letters D and C are adjacent in any text, the blogsite will reject it.

        That means

        H.a.d.c.r.u
        N.C.D.C
        N.S.I.D.C

        for example. Links containing those will prevent the post getting through.

        The reason is the banning of Coug Dotton, who spammed this site religiously with his sky-dragon slayer bollocks. Those are his initials.

        Site also rejects

        a.b.s.o.r.p.t.i.o.n
        t.u.t.o.r

        Dunno why they are rejected.

        • barry says:

          The banning wasn’t dumb. Mr C.o.t.t.o.n used various sock puppets to regain entry, including using his initials. He was like a virus. Roy was forced to blacklist certain words and letter combinations to bar him. Trust me, you wouldn’t like to see a return of D.C.

          As for the other words, they are possibly a result of the same attempts to keep him out. He used so many sock puppets it’s hard to know.

    • g*e*r*a*n says:

      Whiner.

  31. ren says:

    Jetstream is still high in the north. It will facilitate the formation of tropical storms in the Caribbean Sea.
    http://virga.sfsu.edu/gif/17083100_jetstream_h84.gif

  32. ren says:

    On the fifth of September the hurricane will be close to the Caribbean.
    https://earth.nullschool.net/#2017/09/05/0000Z/wind/isobaric/700hPa/orthographic=-78.11,19.18,903

  33. lewis says:

    Gentlemen and ladies,

    Harvey was a very large storm dropping, for whatever reason, lots of rain, causing untold suffering to the humans who reside in the area.

    In this blog people are arguing about whether or not AGW caused/influenced the formation of such a large storm. That is immaterial, except to those interested in such arguments. The fact is, as Dr. Spencer pointed out, such rainfall has occurred in Houston before and, in lots of other places.

    The problem, if there is one, is man’s penchant for building where floods are going to occur. Pretending that by lessening our co2 footprint would have reduced the amount of rain to some lesser number, which could be tolerated by Houston, is farcical.

    The fact is, flood waters are going to occur. Build and rebuild with that in mind.

    In the meantime, do what you can to assist the people of Houston.

  34. Martin says:

    Lewis, you wrote:
    The fact is, as Dr. Spencer pointed out, such rainfall has occurred in Houston before and, in lots of other places.

    Indeed, he showed a photo in his previous post showing worse flooding in Huston city centre and then argued that due to the city development the flooding should be worse now for the same amount of rain due to more concrete etc.

    Unfortunately he did nothing to highlight that development also means developing protection against flooding. Check out this article: https://www.wunderground.com/cat6/harvey-houston-most-extreme-rains-ever-major-us-city

    From the article:
    The biggest concern for central Houston is now the dual Addicks and Barker Reservoir system, which was designed and built in the 1940s for water levels expected to occur on average once every 1,000 years. Water began flowing around the north side of the Addicks dam and onto an spillway on Tuesday morning, the first uncontrolled release of water in the reservoirs history.

    So it seems reasonable that the current flooding is worse than in 1935 since even these two reservoirs are now flooded and you still got 38 feet of water in the city centre. Floodings have and always will occur, but if they get worse we will have problems protecting ourselves from them.

  35. Bindidon ,again where is the global warming where is the uniqueness of the climate?

    • Bindidon says:

      Salvatore Del Prete on August 31, 2017 at 8:11/8:12 AM

      But… why do you ask me, Salvatore? I just pointed out that you always claim for cooling but always look at smallest time intervals to do that.

      …where is the global warming?

      That depends on what period you choose. For GISS, in C per century
      – 1901-2000: 0.06 (!!!)
      but
      – 1979-2017: 1.76

      So if there was no warming at all, UAH6.0 for example should report, for 1979-2017, something like 0.02 C per century (40 % of GISS for the whole 20th century) instead of 1.30 as it does actually.

      … where is the uniqueness of the climate?

      I can’t tell you anything about that: this debate’s scientific context is too complex for me.

      But I guess that there will not be so many many periods in the last 2000 years with a warming of the speed shown by UAH in less than 40 years.

      • But I guess that there will not be so many many periods in the last 2000 years with a warming of the speed shown by UAH in less than 40 years

        BUT THERE ARE MANY SUCH PERIODS.

      • Bindidon says:

        Let me add that the debate about the uniqueness of the actual climate conditions sometimes seems a bit strange to me:

        http://www.woodfortrees.org/graph/gistemp/from:1880/mean:12/plot/gistemp/from:1980/trend/plot/gistemp/from:1910/to:1945/trend

        OK, the recent trend is a bit higher than the one for 1910-1945. But the difference is way too tiny to allow a meaningful debate.

        • I have said year 2017 is transitional, let’s see if it is or isn’t.

          • David Appell says:

            Salvatore, you said the year 2002 was transitional:

            “Your conclusions are in a word wrong, and that will be proven over the coming years, as the temperatures of earth will start a more significant decline (which started in year 2002 by the way)….”
            – Salvatore del Prete, Reply to article: IC Joanna Haigh – Declining solar activity linked to recent warming, 10/8/2010
            http://climaterealists.com/index.php?id=6428

        • Gordon Robertson says:

          bindidon…”Let me add that the debate about the uniqueness of the actual climate conditions sometimes seems a bit strange to me:”

          Will you get off this nonsense from homemade graphs? No one is interested in home-brew online graphing that can switch from a declining trend to an inclining trend by changing one parameter.

          woodfortrees is for number crunchers who don’t understand science….like the climate modelers at NASA GISS.

          • David Appell says:

            Science is all about crunching numbers. Clearly you skipped a great deal of science in your (?) education.

          • Gordon Robertson says:

            DA…”Science is all about crunching numbers. Clearly you skipped a great deal of science in your (?) education”.

            Not at all. I got the warning in probability and statistics about trusting averages simply because crunched number gave you the average. That’s one of the first lessons we got as engineers in probability and statistics. Then again, if engineers trusted numbers directly, bridges would fall and buildings would collapse.

            When you work out equations you are not crunching numbers. That term refers to the manipulation of numbers while ignoring the underlying science and what it is telling you.

            Real number crunchers are accountants. If you gave an accountant the UAH data from 1979 – 2017 with an algorithm and asked him for a certain trend he would deliver a straight line trend from 1979 – 2017 without understanding the context of the data.

            That’s what you alarmists are doing, you are plugging numbers into an algorithm without have the slightest idea how the data was acquired and what it means.

            NOAA has become so arrogant they throw out 75% of their data and use a climate model to synthesize it from 25% of the data. Bindidon thinks that’s pretty cool. You can see the next phase….we don’t need thermometer data, just use a climate model.

            Roy and John at UAH knows what it means and they have supplied clues in the UAH 33 years report. You alarmists have obviously not read those clues because you continue to force trend lines where they don’t apply.

            John Christy has explained that a trend line from 1979 – 2017 is like a see saw with it’s pivot point on the baseline at a certain year. That is an accurate description of the data as it stands. However, in the 33 year report, UAH explains that anomalies below the baseline represent cooling and true warming is above the baseline.

            It’s very clear that the trend represents a transition from anomalies representing cooling to anomalies representing true warming. Such a trend line does not represent true global warming over the range. To get a true representation of that you cannot use a trend line over the range, you need to break it into at least three sections.

            One section represents warming that is a recovery from cooling and the other trend is flat from 1998 till around 2015. The third trend is the positive trend introduced by the 2016 El Nino.

            Drawing a straight line through the data suggests uniform global warming over the range and that is a blatant lie. A trend is an average and averages lie as often as not.

            The reason you don’t get that is the same reason you are an alarmist. Put simply, you don’t understand statistics, basic physics, or science in general because you are loathe to think for yourself and much too quick to accept stupidity from the likes of NASA GISS and NOAA.

            Bindidon has the appeal to authority illness so badly he freely admits he never questions an authority figure like NOAA. If NOAA told him he should jump off a bridge he’d do it.

          • David Appell says:

            Gordon Robertson says:
            “I got the warning in probability and statistics about trusting averages simply because crunched number gave you the average. Thats one of the first lessons we got as engineers in probability and statistics.”

            There is very very much more to statistics than calculating averages.

            “When you work out equations you are not crunching numbers. That term refers to the manipulation of numbers while ignoring the underlying science and what it is telling you.”

            Wrong. “Crunching numbers” is just doing calculations, especially with numerical models. Engineering uses numerical models all the time. It’s hard to see how you do not know that.

      • Gordon Robertson says:

        bindidon…”That depends on what period you choose. For GISS, in C per century
        1901-2000: 0.06 (!!!)
        but
        1979-2017: 1.76″

        GISS??? Tell me how the planet recovered from the Little Ice Age, where global temps were 1 to 2C below normal, with a 6/100ths of a degree warming over an entire century.

        Even the IPCC has warming of 0.75 C in that range.

        GISS was just bragging about how they track well with UAH. From 1979 – 2017, UAH is showing about 0.3C over that range while GISS shows 1.76 what’s? Don’t they use C or F in Germany?

        GISS lies anyway, whereas UAH shows a flat trend 1998 – 2015, GISS shows a relative whopping positive trend.

        • barry says:

          No one is interested in home-brew online graphing that can switch from a declining trend to an inclining trend by changing one parameter.

          The ‘switch’ comes from using too-short time periods and changing it by a year or 3. The resultant trends are more a product of the variability than any underlying signal.

          Over longer periods the variability has less influence, and the underlying signal becomes more prominent in trend analysis. Which is why the difference between UAH trend and all the other data sets is on the order of a few hundredths of a degree per decade over the full record.

          • Gordon Robertson says:

            barry…”Which is why the difference between UAH trend and all the other data sets is on the order of a few hundredths of a degree per decade over the full record”.

            The UAH graph shows a positive trend from 1979 to roughly 1998 and that trend represents a recovery from cooling. It’s marked right on the graph that volcanic aerosols cooled the plant in that range.

            From 1998 – 2015 approximately, the trend is flat. From early 2016 onward there is a positive trend.

            NOAA and GISS are showing a positive trend from 1979 – 2017. Neither claims temperatures in a negative anomaly region, in other words, they do not acknowledge the cooling. NOAA and GISS are bragging of record warming years since 2014 that UAH is not showing.

            There’s no comparison other than a fluke coincidence in the trend over the range.

            Anyone who compares two trend lines over a range from two different databases, one surface and one satellite, and finds a similarity is lost statistically.

          • barry says:

            You’re just saying the same thing.

            It’s no coincidence that over longer time periods the trends match up. Between GISS, NOAA, Had4, JMA, RSS, and UAH, the trend difference since 1979 is a few hundredths of a degree per decade since 1979.

            This isn’t a fluke. Shorter time periods give stronger emphasis to variability. So if one data set has a particularly warm anomaly for 1998, for example, that affects the following trend (by making it lower).

            Over longer periods the variability and methodology differences have less influence and the underlying (as in multidecadal) trend is revealed.

            Your fascination with short-term trends needs to be leavened with some understanding of the difference between variability and trend (noise/signal ratio).

            Even your interminable reference to the IPCC includes that enlightenment in the same paragraph you cherry-pick – something you seem to be filtered to exclude from your understanding.

            I listed 6 fairly well-known data sets that have this small trend difference over the long term. But there are more: reanalysis data sets for surface and a couple of other satellite data products. They are also similar to within a few hundredths of a degree per decade.

            That aint coincidence, bub.

        • David Appell says:

          Gordon Robertson wrote:
          “…whereas UAH shows a flat trend 1998 2015…”

          Notice how carefully you have to cherry pick your dates in order to find a near-zero trend.

          You’re doing numerology, not science.

  36. Where is all the global warming????

    • Gordon Robertson says:

      ren…”This is not the end of the rainfall in Texas”.

      ren…you sure know how to cheer Texans up. ☺

  37. ALERT: Southern hemisphere having one of its quietest cyclone seasons on record Is this due to climate change

  38. Tim Folkerts says:

    Roy, I know this is a little late here, but I recently read a comment on this topic elsewhere that I think is worth considering. I would appreciate your opinion.

    Paraphrasing slightly ….
    “The surface temperature last week was warm, but not warm enough to explain — on its own — the strength of Hurricane Harvey.

    The interesting question relates to energy, not simply to surface temperature. Back in the olden days, the Gulf would have a *thin* layer of warm water at the surface. This would feed storms, but as soon as the storm got going it would stir things up, mixing in cooler water from below, and the storm would effectively blow itself out. Nowadays, however, the warmth extends much deeper into the water column, so the storm can persist much longer.”

    • g*e*r*a*n says:

      Tim, you neglected to indicate your source. “Elsewhere” is not a very good source.

      But the claim that “in the olden days”…”the storm would effectively blow itself out”, makes no sense. It’s like the claim is: “in the olden days, there were no hurricanes”.

      Are you posing an “April Fools Day” joke about 5 months late?

    • Gordon Robertson says:

      tim folkerts…”The interesting question relates to energy, not simply to surface temperature”.

      What do you think temperature measures, if not energy? And what energy are you talking about if not thermal energy?

      “Nowadays, however, the warmth extends much deeper into the water column…”

      Prove it. Let’s see a comparison between 1950 and now.

      • David Appell says:

        P. J. Gleckler, B. D. Santer, C. M. Domingues, D. W. Pierce, T. P. Barnett, J. A. Church, K. E. Taylor, K. M. AchutaRao, T. P. Boyer, M. Ishii & P. M. Caldwell: 2012 Human-induced global ocean warming on multidecadal timescales. Nature Climate Change doi:10.1038/nclimate1553

    • Tim Folkerts says:

      The goal was to open a discussion. The hypothesis is interesting independent of any ‘authority’ of its source.

      Gordon says: “What do you think temperature measures, if not energy?”
      You miss the point. *Surface* temperature is a measure of *surface* energy, but not of TOTAL energy. Suppose a storm that stalls out — say along the TX coast. If only a thin layer of water is warm, then there is limited energy to maintain the stalled storm. But if the warm layer is deeper, then the stalled storm can continue to draw energy for a longer time, maintaining more strength.

      G* says: “Its like the claim is: in the olden days, there were no hurricanes.”
      No, it is saying there would not be storms that maintained so much strength for so long in one place. Moving hurricanes have access to warm surface water by continuously moving to new areas.

      Roy started with two conditions:
      “1) A strong tropical cyclone, with access to abundant moisture evaporated off the Gulf of Mexico, and
      2) Little movement by the cyclone.”

      The hypothesis that “warm water runs deeper” directly enhances “abundant moisture evaporated off the Gulf of Mexico” by keeping the surface warm to allow evaporation.

      I don’t claim to have the answers. I would love to see data about temperature profiles to see if there really has been a change. Even better would be correlations between temperature profiles and strength of stalled storms. *That* would be how to address this hypothesis. The objections so far have missed the mark.

      • gbaikie says:

        -The hypothesis that warm water runs deeper directly enhances abundant moisture evaporated off the Gulf of Mexico by keeping the surface warm to allow evaporation.

        I dont claim to have the answers. I would love to see data about temperature profiles to see if there really has been a change. Even better would be correlations between temperature profiles and strength of stalled storms. *That* would be how to address this hypothesis. The objections so far have missed the mark.-

        In tropics the top warmed ocean is about 200 meters, in terms hurricanes, a question could be how deep is the water which is 28 C- as this commonly cited temperature needed for hurricanes.

        So as I see it, you have two different things, clear water and murky water.
        I would say that clear water causes warmer global temperatures and with clear water it requires a long time to warm up.
        And tend to think one needs clear water to make a hurricane, though once made, the hurricane can pass over murkier water and could even intensify hurricanes.

        With murky water it take less time to warm the first say, 1 meter of water, but less energy of the sunlight is kept during the night.
        What helps in terms of retaining heat of the sunlight is mixing for both clear and murky water. Mixing in terms of mechanical wave motion and other kinds.

        If simplify it, and imagine a calm ocean [without any significant mechanical mixing] it seems clear water might get warm enough water for hurricanes. Warm enough and deep enough. With murky water it might get warm enough at warmest part of the day, but not very deep- I think not enough water depth to cause hurricanes.
        In real world [not simplified] with murky water one might get a hurricane but it shouldn’t have much energy.

        Hmm, I wonder about waterspouts [because they form on lakes and coastal regions]. Anyhow, hurricanes seem to form in open ocean or in clear water. And could have to do with time it needs to form. Or you have clouds forming which should cool the surface, but with enough retained heat, it doesn’t cool it enough to prevent the hurricane forming.

      • Norman says:

        Tim Folkerts

        These links might help your thoughts.

        One, there has been a drought in hurricanes in Gulf of Mexico

        https://weather.com/storms/hurricane/news/hurricane-drought-gulf-of-mexico

        This one says the Gulf is very warm and could lead to more storms (article came out in March, 2017)

        http://www.chicagotribune.com/news/nationworld/science/ct-gulf-of-mexico-warm-waters-20170323-story.html

        Finally, hurricanes act as a cooling mechanism for warm Gulf Water.
        So lack of hurricanes allows Gulf water to reach very warm temperatures. This could allow more number and intense hurricanes but the process would not need to be connected to AGW except for the slight increase in temperatures noted by a different data basis showing this.
        https://earthobservatory.nasa.gov/IOTD/view.php?id=6223

    • gbaikie says:

      –The interesting question relates to energy, not simply to surface temperature. Back in the olden days, the Gulf would have a *thin* layer of warm water at the surface. This would feed storms, but as soon as the storm got going it would stir things up, mixing in cooler water from below, and the storm would effectively blow itself out. Nowadays, however, the warmth extends much deeper into the water column, so the storm can persist much longer.–

      I would guess that clear ocean water, can’t warm to 28 C without first warming “a significant” depth of water.
      So searched a bit:
      “On a perfectly calm day, the ocean becomes like glass reflecting the world around it. Its as if an identically opposite secret world hides below the ocean surface. Those are my favorite days at sea.

      On those days, the ocean absorbs heat from the sun, creating a thin layer of warm, buoyant water, perhaps just a few feet thick.”
      Unfortunately no temperature given, but anyhow:
      “Scientists have assumed that under calm conditions, this surface layer stays relatively stable and doesnt mix with deeper waters. But new observations suggest that this may not be true. In this layer of warm water just below this apparently calm surface, a great deal is happening. The layer is swirling and churning, transferring energy to the deeper waters.”
      Hmm, can’t say I heard scientists say this. Anyhow:
      “By the time the sun sets, this thin surface layer of warm water disappears, because, in general, the atmosphere is cooler than the ocean. Without the sun to heat the ocean, water near the surface begins cooling.”
      http://www.whoi.edu/oceanus/feature/through-the-looking-glass-of-the-sea-surface
      So by thin layer I assume, means “few feet” which described above, as thin layer. But again no temperature or even a location mentioned that noticed- but I assume somewhere not in coastal water.
      Now with Gulf of Mexico and that slow moving hurricane, it seems it when Cat 4 it was in coastal waters.
      Or coastal waters, not clear open ocean waters.

      With murky water it seems possible to have thin layer of very warm water- regardless of temperature deeper. Or more of the sunlight is absorbed near the surface.

      So if you mean “the Gulf would have a *thin* layer of warm water at the surface” being thin in terms of less than 12 inches, it seems to me it would have be fairly murky water- as in can’t see your feet if knee deep in water.

    • Bart says:

      “…mixing in cooler water from below…”

      Silly. Ocean temps have (maybe) increased on the order of 100ths of degrees.

  39. Gordon Robertson says:

    Roy…”Michael Manns claim in The Guardian that its due to the jet stream being pushed farther north from global warming makes me think he doesnt actually follow weather like those of us who have actual schooling in meteorology (my degree is a Ph.D. in Meteorology)”.

    Mann’s arrogance knows no bounds, he’s a geologist for cripes sake. He’s also a legend in his own mind. He seems to think because he hangs out with mathematicians like Gavin Schmidt (NASA GISS) who dabbles in climatology as a climate modeler that he has been anointed an expert in climate science, and now meteorology.

    Mann has made a fool of himself and the IPCC over the hockey stick graph he co-authored. There are alarmists on this site who still support his pseudo-science even though NAS and a statistics expert pronounced the hockey stick dead. Even the IPCC has replaced the hockey stick graph and limited it from 1850 onward.

    One of Mann’s greatest gaffes, with Stieg, was claiming Antarctica had warmed since 1950. They used slight warming in the north of the Antarctic Peninsula and extrapolated it to the rest of Antarctica. Reminds me of current NOAA practices.

    The fact that Mann was consulted by the Guardian shows what a low-grade tabloid it has become. It’s now down there with the National Enquirer, although I don’t think the Enquirer quotes him.

    • David Appell says:

      And what are you, Gordon, a BS engineer? You are utterly unqualified to opine on climate science, yet you’re full of opinions and think you have it all figured out. You didn’t even recognize the equation for the definition of specific heat.

      Mann is qualified by the fact of his accomplishments. You are completely unqualified to say anything here.

      • PaulID says:

        And you have degree in journalism which means you lack even the basic Math that Gordon needed to become an engineer so since you are even more “utterly unqualified to opine on climate science” will you shut up for a change?

        • Mike Flynn says:

          From DA’s modest CV-

          “Graduate Program in Creative Writing (15 hours completed), Arizona State University.”

          Managed to complete 15 hours – not bad, I suppose.

          He claims –

          “Ph.D. in Physics, State University of New York (SUNY) at Stony Brook. Thesis research consisted of computational analysis of high-energy subnuclear structure. (Graduate advisor: George Sterman)

          M.A. in Physics, State University of New York (SUNY) at Stony Brook.

          B.S., double major in physics and mathematics, University of New Mexico.

          Graduate Program in Creative Writing (15 hours completed), Arizona State University.”

          I’m not sure what an M.A. In Physics is. Maybe DA could explain.

          All in all, completely deluded, just like his hero, the Mann who believes that the past predicts the future. Not doing too well so far. You or I can make wild guesses about the future at far less cost to the taxpayers. Ah, the mysteries of cultism! Logic or fact is not needed – just unshakable faith in the leaders.

          Cheers.

          • PaulID says:

            yes but the problem he has is that he has near as I can tell given up on science in favor of the green religion,

        • barry says:

          Im not sure what an M.A. In Physics is. Maybe DA could explain.

          Do you know how to use google? It can help people look less stupid.

          Type ‘MA physics’, hit enter and let the scales fall from your eyes.

          • Mike Flynn says:

            barry,

            Sorry, I should have been clearer. Either SUNY no longer offers an MA in physics, or it’s hidden away somewhere.

            I assume you can provide details, and avoid looking stupid, as you say. Or maybe not?

            Cheers.

          • barry says:

            You’re not being clearer, you’re changing the goalposts. Snake.

            Im not sure what an M.A. In Physics is. Maybe DA could explain.

            So you looked it up, found a ton of references and then decided you needed to win so you googled SUNY to see if you could find something to snark about and discovered parts of their website won’t load.

            But did you find out what an MA in Physics is? I bet you didn’t bother.

          • barry says:

            You could have used smart search terms and just looked at the list of google links, including:

            MA degree – Physics & Astronomy Graduate program – Stony Brook
            graduate.physics.sunysb.edu/ma-program/

            Mar 3, 2016 – The goal of the Master Degree Program is to offer a superb graduate education that prepares you for either the challenges of today’s workplace…

            So as of 17 months ago SUNY was offering an MA course in Physics…

          • Bindidon says:

            barry,

            sometimes (!) I ask me how stupid one is allowed to be. It was the very first link presented by Google:

            Ungefhr 1.950.000 Ergebnisse (0,43 Sekunden)
            Suchergebnisse
            Physics and Astronomy Graduate Program at Stony Brook University
            graduate.physics.sunysb.edu/
            Diese Seite bersetzen
            05.11.2016 – Stony Brook University – Physics and Astronomy Graduate Program.

            Flynn’s answers to you have – at some abstract level – much in common with the nonsense waste he regularly dumps out on this site concerning CO2.

            Cheers. (That’s often the most intelligible part of his ‘comments’)

          • Mike Flynn says:

            Thanks for your assistance.

            As I said, I couldn’t find much about the MA physics and how it fits in with the progression to PhD. I know the USA system sometimes differs from what I am used to.

            Hopefully, this explains why I thought DA might be able to assist. A US academic jokingly said that in in his case, his degrees were BS (Bull Sh**), MS (More of the Same), and PhD (Piled higher and Deeper).

            I apologise for my less than perfect knowledge of the US educational system. I’m not surprised that DA was disinclined to provide elucidation.

            In any case, still no GHE. No magical increase in a thermometer’s temperature by increasing the amount of GHG between the thermometer and its heat source.

            Regardless of how many PhDs claim it must be so.

            Cheers.

  40. ren says:

    When the geomagnetic activity is high jetstream moves north.
    http://files.tinypic.pl/i/00929/5uhnxbh6nmwi.gif
    http://files.tinypic.pl/i/00929/7iz88mk3brwj.gif
    Hurricanes can strengthen.

  41. The simple truth of the matter is satellite data and model initialization data do not show global temperatures as high as other sources and therefore are not accepted by those who embrace AGW.

    They go with other sources for global temperature data whose time is passing them by, instead of the state of the art technology.

    What could one do? For myself I will use the state of the art technology to determine what the global temperature situation is.

    • barry says:

      The simple truth of the matter is satellite data and model initialization data do not show global temperatures as high as other sources and therefore are not accepted by those who embrace AGW.

      Not true at all. I ‘accept’ satellite data (RSS and UAH), and know that all of the data sets are estimates, each with strengths and weaknesses.

      No, to my view it is the ‘skeptic’ community that prefers certain data sets to others. And, by astonishing coincidence, they happen to prefer those that show least warming.

      So I think you’ve got it the wrong way around here. Do I dismiss UAH? No. Do you dismiss NOAA and GISS? Yes. Yes, you do.

      And skeptics are ever-ready to describe what they perceive as short-comings with temp records they don’t like, but mysteriously absent on the shortcomings of satellite data sets and the challenges and adjustments they require.

      So, I’ve got a question for you Salvatore.

      What are the issues affecting satellite temperature data, and what do you think of the methods used to correct for them?

      • Bart says:

        That rabbit hole has no bottom. One can focus on multitudinous aspects of surface and satellite temperature sets and make a whole mountain range of molehills on either side of the valley.

        What is needed is an independent measurement for comparison. Here is one – the rate of change of atmospheric CO2:

        https://tinyurl.com/ycvd2k9o

        It shows much better correlation with the satellite data.

        • David Appell says:

          Why choose this model? What’s it’s justification, from known physical laws and understanding?

          • Bart says:

            Data do not need justification. That is the way science is supposed to work – you collect data, and form an hypothesis that explains the data, then look for evidence which either supports or contradicts the hypothesis. When it contradicts, you modify the hypothesis, not the data.

            AGW has been pursued in the opposite manner. When the data conflict, the data are modified. It is very sad for science.

    • Bindidon says:

      Salvatore Del Prete on September 1, 2017 at 4:26 AM

      The simple truth of the matter is satellite data and model initialization data do not show global temperatures as high as other sources…

      Per favore, Salvatore!
      Are you not exaggerating here?

      Firstly, let me tell you that for the period 1979-2017 during which Weatherbell publishes data, the linear trend estimate of the surface anomalies for Weatherbell’s NCEP CFSR/CDASv2 reanalysis

      http://models.weatherbell.com/climate/cfsr_monthly.php

      is 0.141 C / decade, whereas that of the surface anomalies for the Japanese JMA is 0.135 C / decade: thus JMA is even a little bit ‘cooler’ than is Weatherbell.

      Secondly, even if NOAA’s anomalies show, for the same period, a trend of 0.167 C / decade, the difference between NOAA and Weatherbell is no more than 0.026 C / decade.

      That’s 0.3 C per century! I would inderstand you if the difference was at e.g. 1.5 C level.

      Here is a graph showing you UAH6.0, Weatherbell, JMA and NOAA between 1979 and 2017:

      http://fs5.directupload.net/images/170901/nqfd4kjm.jpg

      You are imho exacerbating small discrepancies.

  42. Bindidon says:

    Roy Spencer (head post)

    In fact, I dare anyone to look at the August temperature anomalies to date in the U.S. (courtesy of Weatherbell.com)

    http://www.drroyspencer.com/wp-content/uploads/ncep_cfsr_noram_t2m_anom-550×413.png

    and tell me, exactly what pattern here is due to global warming?

    In comparison with you and Ryan Maue I’m no more than a simple layman.

    But please allow me nevertheless to ask you in turn: who in the world would search for any global warming pattern in a Weatherbell image showing anomaly average over Northern America for just one little month?

    If I had to search for possible (!!!) warming traces, I would think preferable to have a look at JMA’s surface anomaly distribution:

    http://ds.data.jma.go.jp/tcc/tcc/products/gwp/temp/map/temp_map.html

    and, starting e.g. 50 years ago with 1967, let all years pass along till 2016. (Though 3 GB and 2 x 2.5 GHz, it takes a while to get a year downloaded, and thus a second pass shows really interesting.)

    What is, for example, the somewhat obvious difference between El Nino’s 1972 resp. 1982/83 editions one the one hand, and 1997/98 resp. 2014/15/16 on the other hand due to?

    Isn’t it a bit hard to believe JMA’s 2016 red dominated picture due to El Nino only? I don’t know what to think about this.

    Btw: I would really enjoy UAH providing us with a similar tool.

    Best greetings from near Berlin,
    J.-P. D.

  43. barry says:

    Bindidon, it’s a good question. Hard to believe Dr Spencer attempted to correlate hurricanes only with landfall in Texas, which is essentially a random variable.

    A better test would be to compare hurricane intensity with Atlantic SSTs. Looks like there is a strong correlation over time.

    https://emanuel.mit.edu/papers-data-and-graphics-pertaining-tropical-cyclone-trends-and-variability

    This leaves Texas with random chances of hurricane landfall, but possibly with increased intensity if SSTs continue to rise.

    I found another good web page on the subject, with the caveat that it is a discussion from one expert.

    http://wind.mit.edu/~emanuel/anthro2.htm

  44. Dr. Mark H. Shapiro says:

    Climate change models have long predicted that increased sea and air temperatures would produce wetter storms not necessarily more frequent storms. It’s just basic atmospheric physics. This has, in fact, been happening across the globe. Hurricane Harvey is just one example of many major flooding events across the globe.

    The flooding in southeast Texas, while not directly caused by climate change, was made worse by climate change than it otherwise might have been.

    • Bindidon says:

      Do you have accurate data e.g. for the Houston 1935 flooding event with which you could underline your hypothesis?

      Without such a comparison, we stay in pure guessings.

    • barry says:

      Cyclone intensity connected to warming SSTs.

      https://emanuel.mit.edu/papers-data-and-graphics-pertaining-tropical-cyclone-trends-and-variability

      Warmer air holds more water vapour.

      Higher sea levels means greater storm surge and a shallower run-off gradient, worsening flooding.

      Climate change can not be connected to the cause of any storm, of course, but it could raise the intensity and water content of storms over time.

      It’s impossible to say for sure, but it could be that Hurricane Harvey rainfall and subsequent flooding was exacerbated by warmer temperatures. Ultimately, it’s a change in probability distribution, which cannot be determined by a single storm. However, the ingredients are there (rising trends n SSTs, atmospheric water vapour, sea level).

    • barry says:

      Amendment:

      “Cyclone intensity connected to warming SSTs”

      Higher cyclone intensity connected to warmer SSTs.

  45. Bindidon says:

    Today I read in the french newspaper ‘Le Monde’ that the Harvey bill might well approach 140 G$, i.e. 40 more than Katrina.

    Does anyone know about reliable numbers?

  46. Not to mention, seven months ago, skeptic David Dilley correctly predicted that “The upcoming 2017 hurricane season will be stronger than last year, and it will be the most dangerous and costliest in 12 years for the United States… with 1 or 2 [landfalls] having the potential for being a major impact hurricane.”

    In other words, there are multiple other factors that caused the severe hurricane, not “increased water vapor” as the climate scientists like to claim.
    Dilley explains the natural causes of this years’ intense hurricane season in this paragraph:
    “2017 will once again be influenced by a Climate Pulse Hurricane Enhancement Cycle – with very conducive conditions for hurricane development due to the lack of an El Nio, or La Nia conditions. In addition ocean water temperatures continue to run warmer than normal across most of the Atlantic Basin (red and orange in the graphic), and especially in the Caribbean region and the Atlantic near the United States. This warmer ocean water will be conducive for tropical storms and/or hurricanes forming and/or strengthening close to the United States. Mr. Dilley also expects the Bermuda-Azores High Pressure Center will be weaker this summer thus allowing more named storms to maintain strength – or strengthen as they move from east to west across the Atlantic toward the United States.”
    Here’s the capture from the Wayback Machine archive, so there can be no doubt about the authenticity of Dilley’s prediction. https://web.archive.org/web/20170205105431/http://www.prweb.com:80/releases/2017/02/prweb14025554.htm

  47. Jock Young says:

    The graph shows that intense storms can occur regardless of water temperatures, which isn’t really the question. The claim is that intense storms that DO occur will be stronger in warmer waters than they otherwise would have been. The graph does not refute that or even address it. I hope Spencer is not trying to deny that hurricanes get energy from warmer seas.

    • Svante says:

      And that last red dot in the diagram is higher than all the others. Higher temperature means the air can hold more moisture…

    • David A says:

      …and colder seas…
      “We find that trade wind speed over the Caribbean Sea and the tropical North Atlantic is the environmental field which individually replicates long-term hurricane activity the best. We identify a dropout in hurricane replication centered on the 1940s and show that this is likely due to a decrease in data quality which affects all data sets but Atlantic sea surface temperatures in particular.”

      • David A says:

        CAGW theory places more warming poleward, thus mitigating this difference.

        • Svante says:

          This can make hurricanes advance slower along it’s path. Hurricane power depends on water temperature beneath it.

          • Mickey says:

            Heat can only occur as a flow of energy from a higher potential energy to a lower one, (2nd law thermo). Convection is driven by contrast of temperature/humidity – not net sum temperature/humidity. Look at the storms on Jupiter occurring at temperatures below -250C.

  48. David A says:

    Ok, show the increasing trend.
    Does 4 U.S. Cat 4 land falls in the last 44 years vs. 14 in the prior 42 years make for an increasing trend?
    Harvey has the weakest ground based wind gusts of any U.S. Cat 4 in history.
    It rain intensity per hour and 24 hours has been exceeded many times. Put simply, Harvey hovered.

    This report specifies it takes a combination of T differential to drive hurricanes.
    ,We find that trade wind speed over the Caribbean Sea and the tropical North Atlantic is the environmental field which individually replicates long-term hurricane activity the best. We identify a dropout in hurricane replication centered on the 1940s and show that this is likely due to a decrease in data quality which affects all data sets but Atlantic sea surface temperatures in particular.”

  49. RAH says:

    Dr. Spencer

    It would be interesting to see how many megatons worth of energy is being released at the time that the highest average category number on the Saffir-Simpson scale is reached for Irma, Katia, and Jose.

    Earlier there was a discussion on the cooling effect of hurricanes. Well now we have three of them separated by about 45 deg. of longitude and 8 degrees of latitude. That’s a whole lot of energy being released in a relatively small segment of this globe. It would seem to me that the cooling effect from these storms would be discernable.

    • Bindidon says:

      It would be interesting to see how many megatons worth of energy is being released at the time that the highest average category number on the Saffir-Simpson scale is reached for Irma, Katia, and Jose.

      You do not seem to live in the near of their ‘energy being released’.

      • RAH says:

        Nope but I was referring to a previous post by Roy concerning the amount of energy being released by Harvey. I live in tornado country.

      • RAH says:

        I don’t “live there” but I do have family that does. And we have a vacation home in Port Charlotte.

  50. Mikey says:

    What are the blue dots?

  51. Guy Montag says:

    Hah! The most obvious take-away from the first graph are that the red dots or more frequent to the right side of more recent, increasing temperatures. Hmmm.

  52. Leo Morgan says:

    I wondered about the quip “Rush Limbaugh’s Artificial Climatologist. Haha”, so I skimmed back over blog posts, and through this article, and found nothing. So, Google helped me: https://www.rushlimbaugh.com/daily/2017/08/29/our-artificial-climatologists-official-book-is-doing-gangbusters/
    This might be useful information for those like me in non-US countries who hadn’t heard the story.
    Although I admit it’s unlikely to be found here at comment 320 or so 🙂

  53. Antonin Qwerty says:

    Test
    abc

Leave a Reply