
 Home/Blog
I was perusing Bob Tisdale’s analysis of global average sea surface temperatures (SST) through June 2014 and noticed that the OISST product (which has a heavy reliance on satellite infrared measurements) has been suggesting 2014 might be a record warm year, at least for SST.
So, I decided to update the satellite microwave-based SST data from RSS (comprised of the AMSR-E, TMI, and Windsat satellite datasets), and it tells a different story, with 2014 not quite as warm as the last time we were ramping into El Nino conditions (2009):
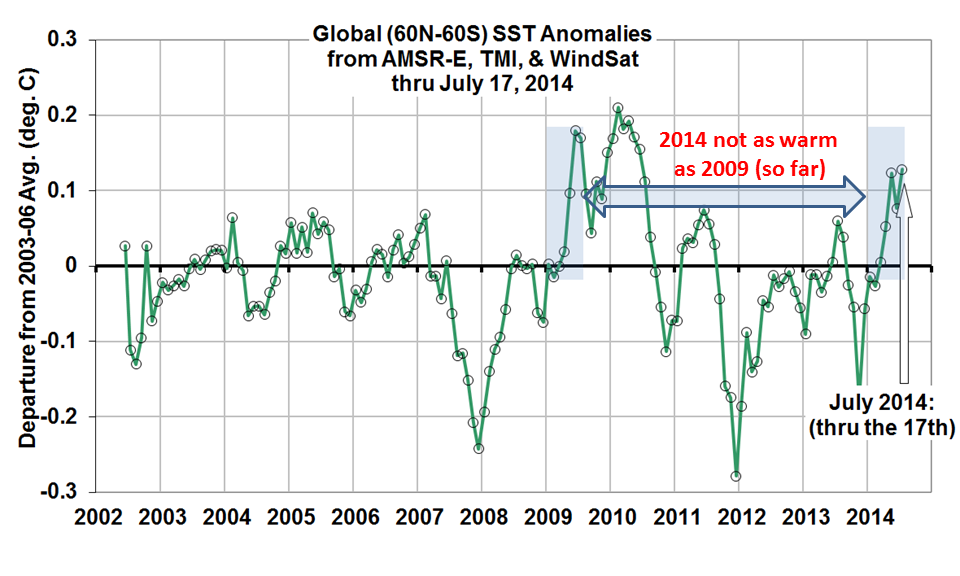
Satellite microwave SST anomalies (global) since mid-2002, updated through mid-July 2014.
I don’t have an obvious explanation for the discrepancy. There are a few possibilities…
1) The microwave measurements are much less susceptible to cloud and aerosol contamination, and have a better satellite diurnal drift adjustment.
2) I restrict the analysis to 60 deg. N latitude, to avoid sea ice issues, while the OISST product goes farther north….but I would think that this is such a small area that it would not affect the global averages substantially.
3) I also use a fairly short period to compute the anomalies relative to, but this has no effect when comparing the same calendar months (e.g. January thrugh June, 2014 versus 2009).
In any event, it appears there are some discrepancies regarding just how warm 2014 is shaping up to be. With a strong El Nino increasingly unlikely, I’m still betting that 2014 will not be a record warm year.


