UPDATED: 2:16 p.m. CST March 6, 2010: Added a plot of the differences between v5.3 and v5.2.
YR MON GLOBE NH SH TROPICS
2009 1 0.213 0.418 0.009 -0.119
2009 2 0.220 0.557 -0.117 -0.091
2009 3 0.174 0.335 0.013 -0.198
2009 4 0.135 0.290 -0.020 -0.013
2009 5 0.102 0.109 0.094 -0.112
2009 6 0.022 -0.039 0.084 0.074
2009 7 0.414 0.188 0.640 0.479
2009 8 0.245 0.243 0.247 0.426
2009 9 0.502 0.571 0.433 0.596
2009 10 0.353 0.295 0.410 0.374
2009 11 0.504 0.443 0.565 0.482
2009 12 0.262 0.331 0.190 0.482
2010 1 0.630 0.809 0.451 0.677
2010 2 0.613 0.720 0.506 0.789
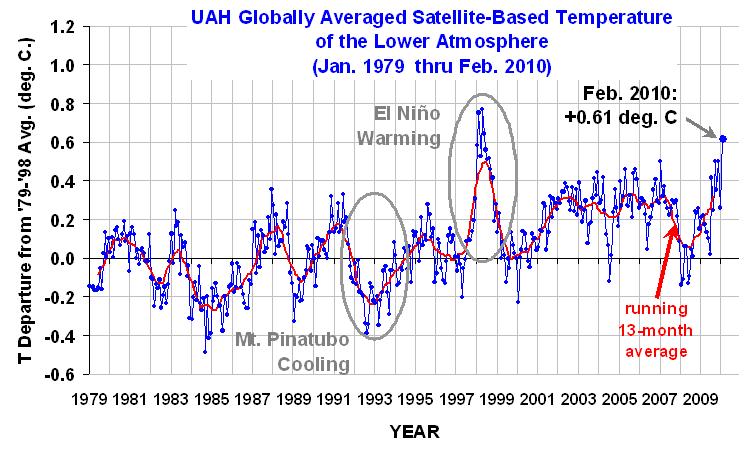
The global-average lower tropospheric temperature remained high, at +0.61 deg. C for February, 2010. This is about the same as January, which in our new Version 5.3 of the UAH dataset was +0.63 deg. C. February was second warmest in the 32-year record, behind Feb 1998 which was itself the second warmest of all months. The El Nino is still the dominant temperature signal; many people living in Northern Hemisphere temperate zones were still experiencing colder than average weather.
The new dataset version does not change the long-term trend in the dataset, nor does it yield revised record months; it does, however, reduce some of the month-to-month variability, which has been slowly increasing over time.
Version 5.3 accounts for the mismatch between the average seasonal cycle produced by the older MSU and the newer AMSU instruments. This affects the value of the individual monthly departures, but does not affect the year to year variations, and thus the overall trend remains the same.
Here is a comparison of v5.2 and v5.3 for global anomalies in lower tropospheric temperature.
YR MON v5.2 v5.3
2009 1 0.304 0.213
2009 2 0.347 0.220
2009 3 0.206 0.174
2009 4 0.090 0.135
2009 5 0.045 0.102
2009 6 0.003 0.022
2009 7 0.411 0.414
2009 8 0.229 0.245
2009 9 0.422 0.502
2009 10 0.286 0.353
2009 11 0.497 0.504
2009 12 0.288 0.262
2010 1 0.721 0.630
2010 2 0.740 0.613
trends since 11/78: +0.132 +0.132 deg. C per decade
The following discussion is provided by John Christy:
As discussed in our running technical comments last July, we have been looking at making an adjustment to the way the average seasonal cycle is removed from the newer AMSU instruments (since 1998) versus the older MSU instruments. At that time, others (e.g. Anthony Watts) brought to our attention the fact that UAH data tended to have some systematic peculiarities with specific months, e.g. February tended to be relatively warmer while September was relatively cooler in these comparisons with other datasets. In v5.2 of our dataset we relied considerably on the older MSUs to construct the average seasonal cycle used to calculated the monthly departures for the AMSU instruments. This created the peculiarities noted above. In v5.3 we have now limited this influence.
UPDATE: The following chart, which differences the v5.3 and v5.2 versions of the dataset clearly illustrates this spurious component to the seasonal cycle which has been removed:
TLT_GL_v.5.2_vs_v5.3
The adjustments are very minor in terms of climate as they impact the relative departures within the year, not the year-to-year variations. Since the errors are largest in February (almost 0.13 C), we believe that February is the appropriate month to introduce v5.3 where readers will see the differences most clearly. Note that there is no change in the long term trend as both v5.2 and v5.3 show +0.132 C/decade. All that happens is a redistribution of a fraction of the anomalies among the months. Indeed, with v5.3 as with v5.2, Jan 2010 is still the warmest January and February 2010 is the second warmest Feb behind Feb 1998 in the 32-year record.
For a more detailed discussion of this issue written last July, email John Christy at christy@nsstc.uah.edu for the document.
[NOTE: These satellite measurements are not calibrated to surface thermometer data in any way, but instead use on-board redundant precision platinum resistance thermometers (PRTs) carried on the satellite radiometers. The PRT’s are individually calibrated in a laboratory before being installed in the instruments.]

 Home/Blog


