Home/Blog
Carbon Dioxide Growth Rate at Mauna Loa
The atmospheric concentration of CO2 has been routinely measured near the summit of Mauna Loa, Hawaii since 1958. The location was originally chosen because it is so remote from major industrial sources of carbon dioxide, and so it is believed to be fairly representative of the Northern Hemisphere average.
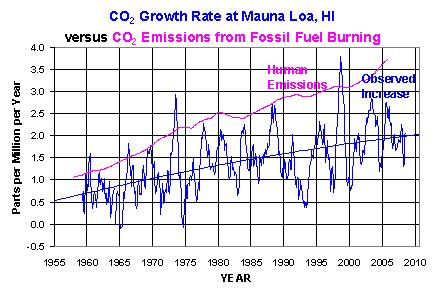
While you have probably seen graphs of the atmospheric carbon dioxide concentration slowly increasing over time, the graph above shows the yearly growth RATE, as well as the estimated yearly rate of emissions by humanity. It shows a couple of interesting things. First, the growth rate of atmospheric CO2 is, on average, only about 50% of what mankind emits. This means that Mother Nature takes out about 50% of the ‘excess’ CO2 that we pump into the atmosphere every year. And it seem like it doesn’t matter how much MORE we put in each year…nature still takes out an average of 50% of that amount.
Secondly, it shows that there are huge year-to-year fluctuations in the amount of extra CO2 that shows up at Mauna Loa. Most of these fluctuations are due to El Nino and La Nina events. During El Nino, the surface waters of the Pacific warm, partly due to less upwelling of cold, nutrient-rich waters of the west coasts of the Americas, and less carbon dioxide is absorbed by the ocean than is given up. This is mostly due to below average phytoplankton growth, as well as the soda-fizz effect (warm water can hold less carbon dioxide than cool water). Also, the dip in 1993 is believe to be due to cooler ocean waters from less sunlight reaching the surface after the 1991 eruption of Mt. Pinatubo volcano pumped millions of tons of sulfur into the stratosphere. (Don’t try this at home, the EPA will have you thrown in jail).
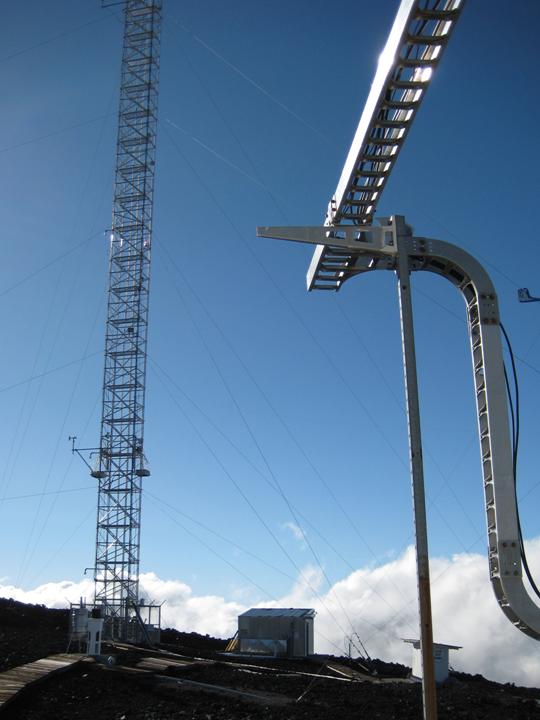
I took the next two pictures at the Mauna Loa Observatory on February 12, 2008. The first picture shows a metal railing which hold plastic tubes that run up the tower to the point where carbon dioxide is sampled. There are quality control procedures applied later to exclude data when the wind is coming from the volcano crater above, or from other anomalous sources.
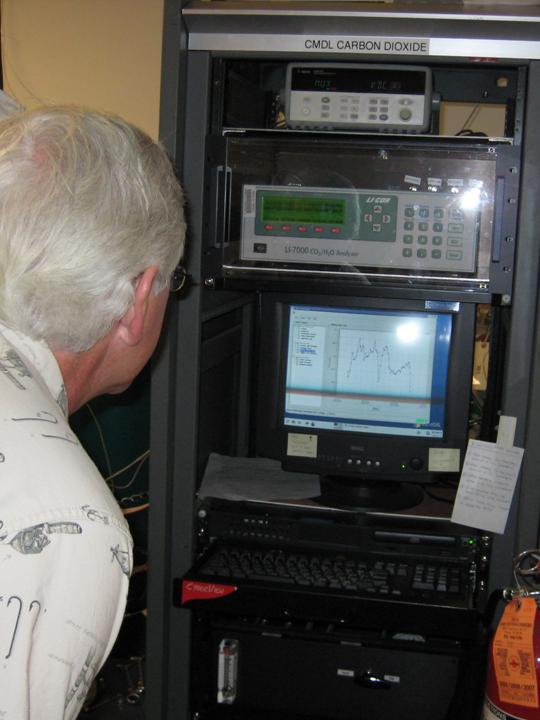
The second picture is of me looking at the rack of instruments that analyze, display, and store the data.