INTRODUCTION
Arguably the most important data used for documenting global warming are surface station observations of temperature, with some stations providing records back 100 years or more. By far the most complete data available are for Northern Hemisphere land areas; the Southern Hemisphere is chronically short of data since it is mostly oceans.
But few stations around the world have complete records extending back more than a century, and even some remote land areas are devoid of measurements. For these and other reasons, analysis of “global” temperatures has required some creative data massaging. Some of the necessary adjustments include: switching from one station to another as old stations are phased out and new ones come online; adjusting for station moves or changes in equipment types; and adjusting for the Urban Heat Island (UHI) effect. The last problem is particularly difficult since virtually all thermometer locations have experienced an increase in manmade structures replacing natural vegetation, which inevitably introduces a spurious warming trend over time of an unknown magnitude.
There has been a lot of criticism lately of the two most publicized surface temperature datsets: those from Phil Jones (CRU) and Jim Hansen (GISS). One summary of these criticisms can be found here. These two datasets are based upon station weather data included in the Global Historical Climate Network (GHCN) database archived at NOAA’s National Climatic Data Center (NCDC), a reduced-volume and quality-controlled dataset officially blessed by your government for climate work.
One of the most disturbing changes over time in the GHCN database is a rapid decrease in the number of stations over the last 30 years or so, after a peak in station number around 1973. This is shown in the following plot which I pilfered from this blog.

Given all of the uncertainties raised about these data, there is increasing concern that the magnitude of observed ‘global warming’ might have been overstated.
TOWARD A NEW SATELLITE-BASED SURFACE TEMPERATURE DATASET
We have started working on a new land surface temperature retrieval method based upon the Aqua satellite AMSU window channels and “dirty-window” channels. These passive microwave estimates of land surface temperature, unlike our deep-layer temperature products, will be empirically calibrated with several years of global surface thermometer data.
The satellite has the benefit of providing global coverage nearly every day. The primary disadvantages are (1) the best (Aqua) satellite data have been available only since mid-2002; and (2) the retrieval of surface temperature requires an accurate adjustment for the variable microwave emissivity of various land surfaces. Our method will be calibrated once, with no time-dependent changes, using all satellite-surface station data matchups during 2003 through 2007. Using this method, if there is any spurious drift in the surface station temperatures over time (say due to urbanization) this will not cause a drift in the satellite measurements.
Despite the shortcomings, such a dataset should provide some interesting insights into the ability of the surface thermometer network to monitor global land temperature variations. (Sea surface temperature estimates are already accurately monitored with the Aqua satellite, using data from AMSR-E).
THE INTERNATIONAL SURFACE HOURLY (ISH) DATASET
Our new satellite method requires hourly temperature data from surface stations to provide +/- 15 minute time matching between the station and the satellite observations. We are using the NOAA-merged International Surface Hourly (ISH) dataset for this purpose. While these data have not had the same level of climate quality tests the GHCN dataset has undergone, they include many more stations in recent years. And since I like to work from the original data, I can do my own quality control to see how my answers differ from the analyses performed by other groups using the GHCN data.
The ISH data include globally distributed surface weather stations since 1901, and are updated and archived at NCDC in near-real time. The data are available for free to .gov and .edu domains. (NOTE: You might get an error when you click on that link if you do not have free access. For instance, I cannot access the data from home.)
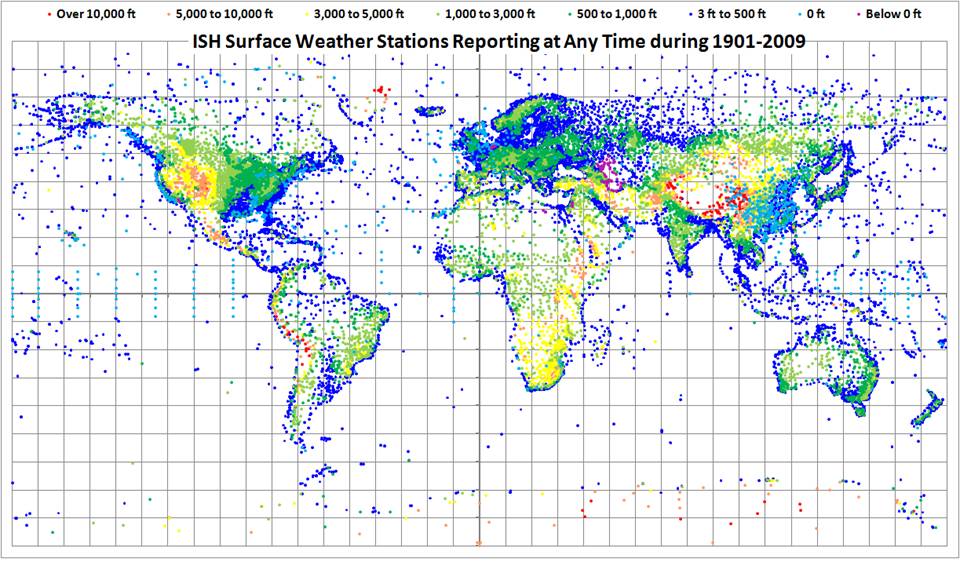
The following map shows all stations included in the ISH dataset. Note that many of these are no longer operating, so the current coverage is not nearly this complete. I have color-coded the stations by elevation (click on image for full version).

WARMING OF NORTHERN HEMISPHERIC LAND AREAS SINCE 1986
Since it is always good to immerse yourself into a dataset to get a feeling for its strengths and weaknesses, I decided I might as well do a Jones-style analysis of the Northern Hemisphere land area (where most of the stations are located). Jones’ version of this dataset, called “CRUTem3NH”, is available here.
I am used to analyzing large quantities of global satellite data, so writing a program to do the same with the surface station data was not that difficult. (I know it’s a little obscure and old-fashioned, but I always program in Fortran). I was particularly interested to see whether the ISH stations that have been available for the entire period of record would show a warming trend in recent years like that seen in the Jones dataset. Since the first graph (above) shows that the number of GHCN stations available has decreased rapidly in recent years, would a new analysis using the same number of stations throughout the record show the same level of warming?
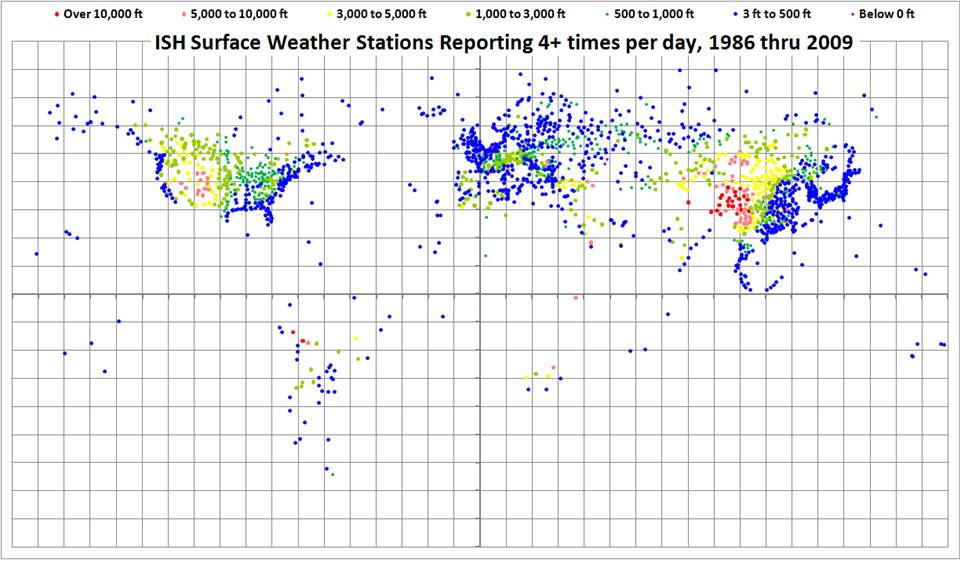
The ISH database is fairly large, organized in yearly files, and I have been downloading the most recent years first. So far, I have obtained data for the last 24 years, since 1986. The distribution of all stations providing fairly complete time coverage since 1986, having observations at least 4 times per day, is shown in the following map.

I computed daily average temperatures at each station from the observations at 00, 06, 12, and 18 UTC. For stations with at least 20 days of such averages per month, I then computed monthly averages throughout the 24 year period of record. I then computed an average annual cycle at each station separately, and then monthly anomalies (departures from the average annual cycle).
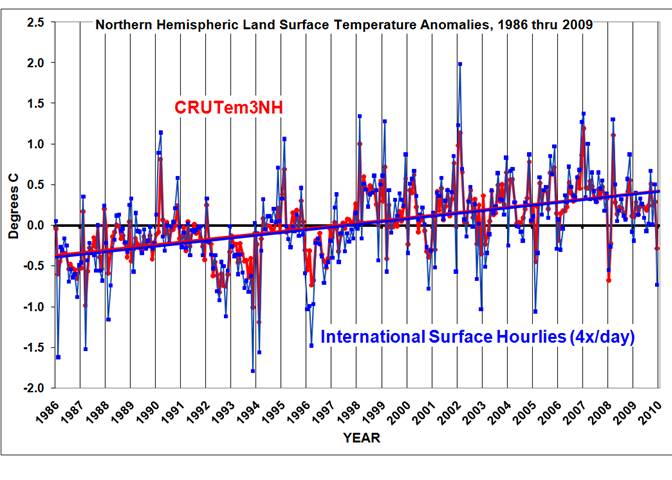
Similar to the Jones methodology, I then averaged all station month anomalies in 5 deg. grid squares, and then area-weighted those grids having good data over the Northern Hemisphere. I also recomputed the Jones NH anomalies for the same base period for a more apples-to-apples comparison. The results are shown in the following graph.

I’ll have to admit I was a little astounded at the agreement between Jones’ and my analyses, especially since I chose a rather ad-hoc method of data screening that was not optimized in any way. Note that the linear temperature trends are essentially identical; the correlation between the monthly anomalies is 0.91.
One significant difference is that my temperature anomalies are, on average, magnified by 1.36 compared to Jones. My first suspicion is that Jones has relatively more tropical than high-latitude area in his averages, which would mute the signal. I did not have time to verify this.
Of course, an increasing urban heat island effect could still be contaminating both datasets, resulting in a spurious warming trend. Also, when I include years before 1986 in the analysis, the warming trends might start to diverge. But at face value, this plot seems to indicate that the rapid decrease in the number of stations included in the GHCN database in recent years has not caused a spurious warming trend in the Jones dataset — at least not since 1986. Also note that December 2009 was, indeed, a cool month in my analysis.
FUTURE PLANS
We are still in the early stages of development of the satellite-based land surface temperature product, which is where this post started.
Regarding my analysis of the ISH surface thermometer dataset, I expect to extend the above analysis back to 1973 at least, the year when a maximum number of stations were available. I’ll post results when I’m done.
In the spirit of openness, I hope to post some form of my derived dataset — the monthly station average temperatures, by UTC hour — so others can analyze it. The data volume will be too large to post at this website, which is hosted commercially; I will find someplace on our UAH computer system so others can access it through ftp.
While there are many ways to slice and dice the thermometer data, I do not have a lot of time to devote to this side effort. I can’t respond to all the questions and suggestions you e-mail me on this subject, but I promise I will read them.

 Home/Blog


