When I saw the “record” warmth of our UAH global-average lower tropospheric temperature (LT) product (warmest January in the 32-year satellite record), I figured I was in for a flurry of e-mails: “But this is the coldest winter I’ve seen since there were only 3 TV channels! How can it be a record warm January?”
Sorry, folks, we don’t make the climate…we just report it.
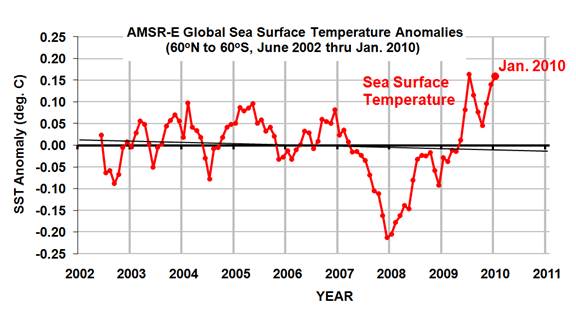
But, I will admit I was surprised. So, I decided to look at the AMSR-E sea surface temperatures (SSTs) that Remote Sensing Systems has been producing from NASA’s Aqua satellite since June of 2002. Even though the SST data record is short, and an average for the global ice-free oceans is not the same as global, the two do tend to vary together on monthly or longer time scales.
The following graph shows that January, 2010, was indeed warm in the sea surface temperature data:

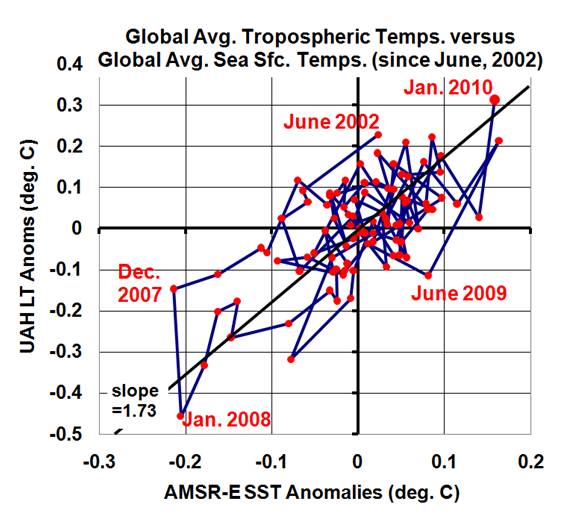
But it is difficult to compare the SST product directly with the tropospheric temperature anomalies because (1) they are each relative to different base periods, and (2) tropospheric temperature variations are usually larger than SST variations.
So, I recomputed the UAH LT anomalies relative to the SST period of record (since June, 2002), and plotted the variations in the two against each other in a scatterplot (below). I also connected the successive monthly data points with lines so you can see the time-evolution of the tropospheric and sea surface temperature variations:

As can be seen, January, 2010 (in the upper-right portion of the graph) is quite consistent with the average relationship between these two temperature measures over the last 7+ years.
[NOTE: While the tropospheric temperatures we compute come from the AMSU instrument that also flies on the NASA Aqua satellite, along with the AMSR-E, there is no connection between the calibrations of these two instruments.]

 Home/Blog


