
 Home/Blog
We finally received the missing NOAA-19 and Metop2 AMSU data from NESDIS, resulting from the government shutdown, covering the first half of October. For some reason we got all of the NOAA-15 and NOAA-18 data, but the other two satellite feeds were stopped.
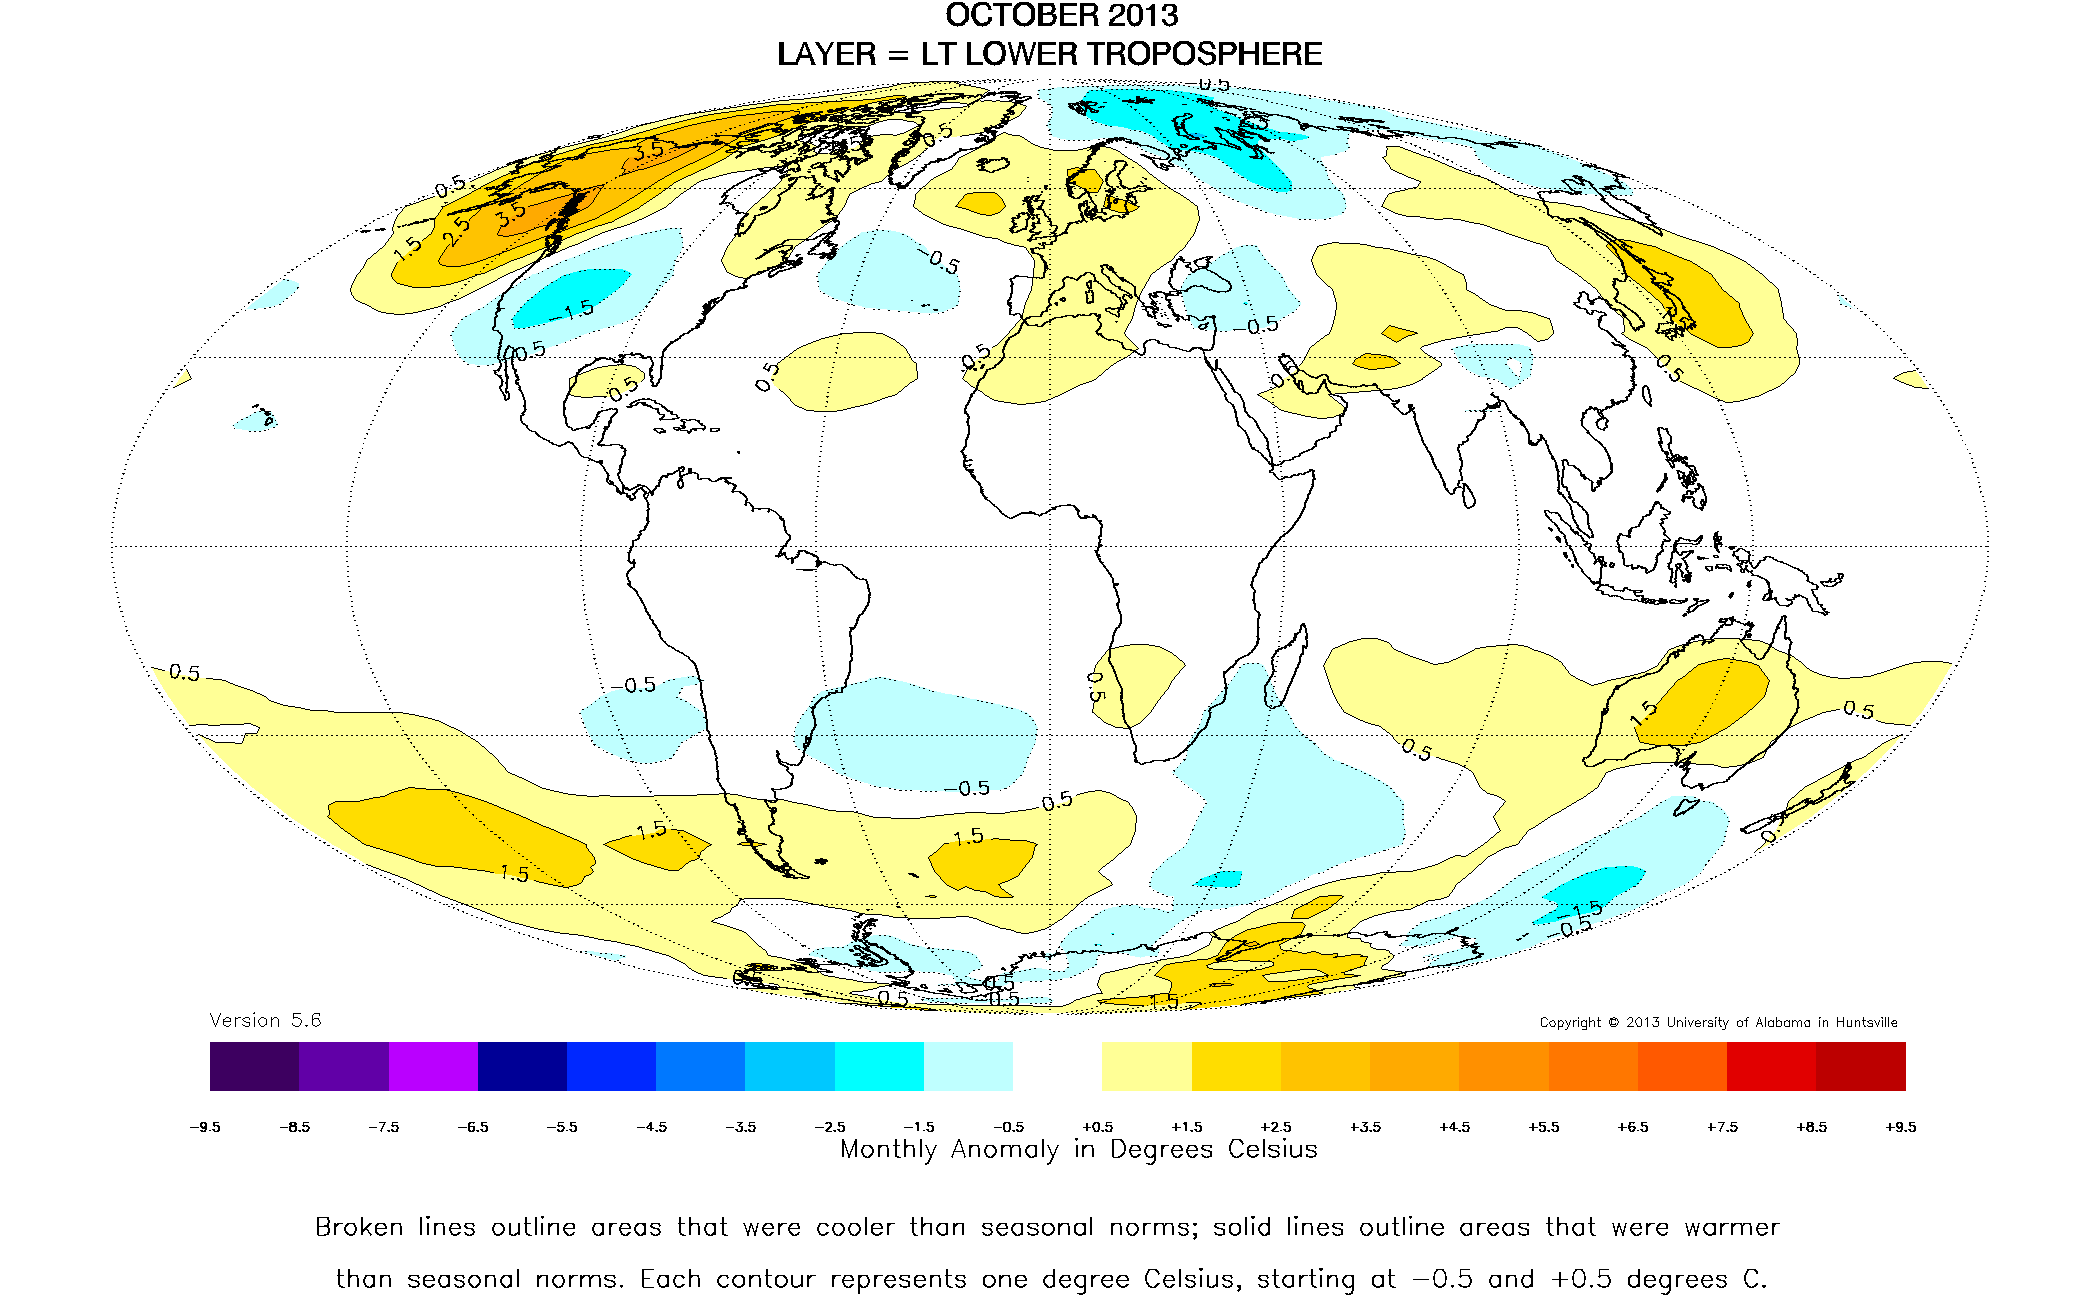
So, the numbers below supersede the UAH October temperature press release, which was sent out by accident. (The global anomaly map for October was approximately correct, though, because it was based upon the 2 satellites which had complete data coverage for the month).
The Version 5.6 global average lower tropospheric temperature (LT) anomaly for October, 2013 is +0.29 deg. C (click for larger version):
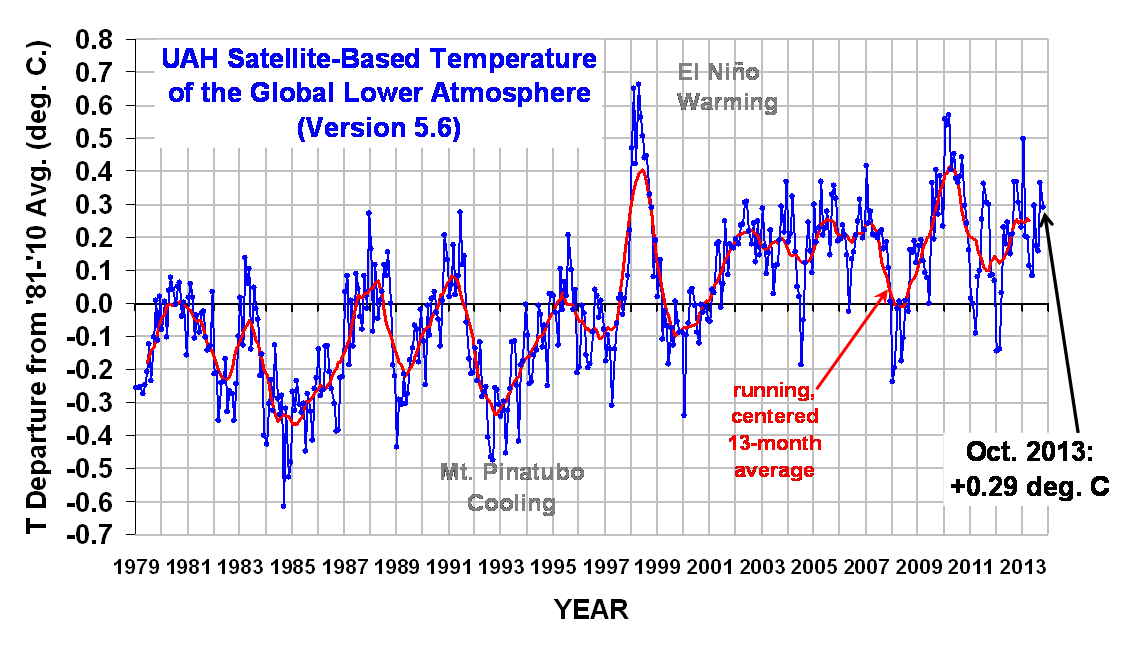
The global, hemispheric, and tropical LT anomalies from the 30-year (1981-2010) average for the last 10 months are:
YR MON GLOBAL NH SH TROPICS
2013 01 +0.496 +0.512 +0.481 +0.387
2013 02 +0.203 +0.372 +0.033 +0.195
2013 03 +0.200 +0.333 +0.067 +0.243
2013 04 +0.114 +0.128 +0.101 +0.165
2013 05 +0.082 +0.180 -0.015 +0.112
2013 06 +0.295 +0.335 +0.255 +0.220
2013 07 +0.173 +0.134 +0.211 +0.074
2013 08 +0.158 +0.111 +0.206 +0.009
2013 09 +0.365 +0.339 +0.390 +0.189
2013 10 +0.290 +0.329 +0.250 +0.032
Popular monthly data files:
uahncdc_lt_5.6.txt (Lower Troposphere)
uahncdc_mt_5.6.txt (Mid-Troposphere)
uahncdc_ls_5.6.txt (Lower Stratosphere)


