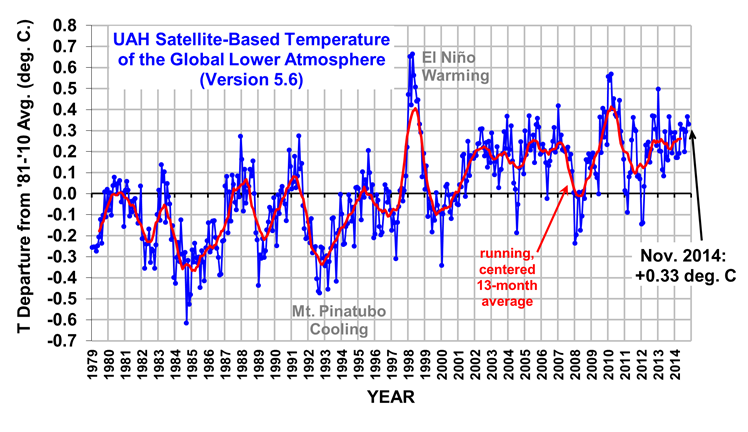
The Version 5.6 global average lower tropospheric temperature (LT) anomaly for November, 2014 is +0.33 deg. C, down a little from the October value of +0.37 deg. C (click for full size version):

The global, hemispheric, and tropical LT anomalies from the 30-year (1981-2010) average for the last 23 months are:
YR MON GLOBAL NH SH TROPICS
2013 1 +0.497 +0.517 +0.478 +0.386
2013 2 +0.203 +0.372 +0.033 +0.195
2013 3 +0.200 +0.333 +0.067 +0.243
2013 4 +0.114 +0.128 +0.101 +0.165
2013 5 +0.082 +0.180 -0.015 +0.112
2013 6 +0.295 +0.335 +0.255 +0.220
2013 7 +0.173 +0.134 +0.211 +0.074
2013 8 +0.158 +0.111 +0.206 +0.009
2013 9 +0.365 +0.339 +0.390 +0.190
2013 10 +0.290 +0.331 +0.249 +0.031
2013 11 +0.193 +0.160 +0.226 +0.020
2013 12 +0.266 +0.272 +0.260 +0.057
2014 1 +0.291 +0.387 +0.194 -0.029
2014 2 +0.170 +0.320 +0.020 -0.103
2014 3 +0.170 +0.338 +0.002 -0.001
2014 4 +0.190 +0.358 +0.022 +0.092
2014 5 +0.326 +0.325 +0.328 +0.175
2014 6 +0.305 +0.315 +0.295 +0.510
2014 7 +0.304 +0.289 +0.319 +0.451
2014 8 +0.199 +0.244 +0.153 +0.061
2014 9 +0.294 +0.187 +0.401 +0.181
2014 10 +0.365 +0.333 +0.396 +0.189
2014 11 +0.329 +0.356 +0.302 +0.252
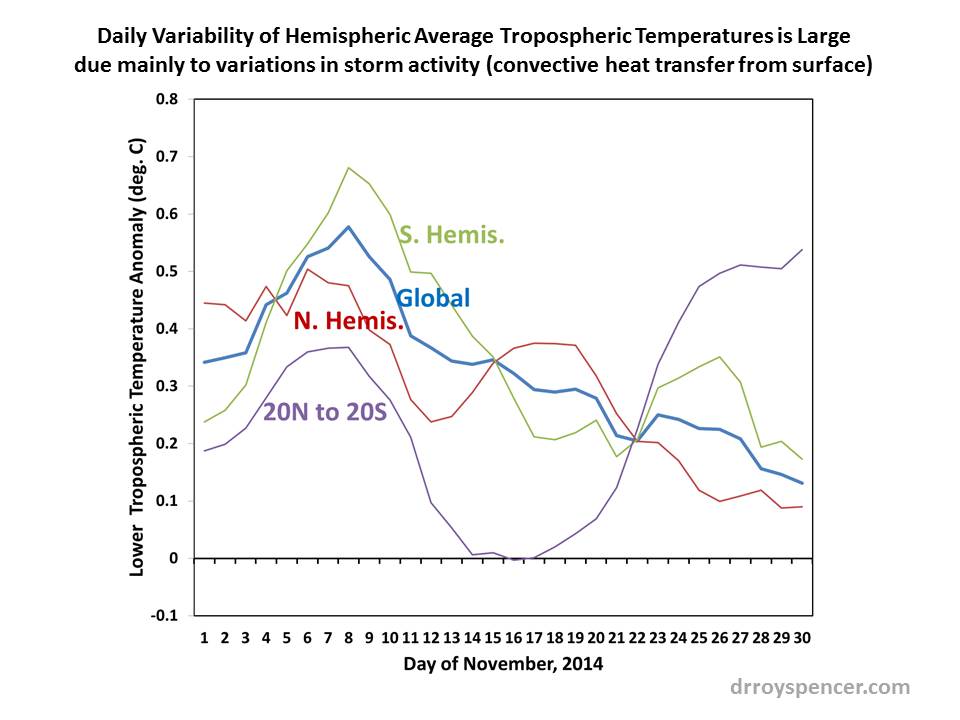
As I have mentioned before, month-to-month variations in global tropospheric temperature can be rather large just due to variations in convective overturning of the atmosphere (storm activity). To demonstrate how large the changes can be, the following plot shows the daily temperature anomalies for November, 2014. Note that the tropical troposphere warmed by 0.5 deg. C in less than 2 weeks, presumably coming out of a less convective phase.
Despite this rise in late November tropical temperatures, note the extratropics must have cooled since both the NH and SH show downward trends. While this variability in tropospheric temperature might suggest just how dynamic the climate system is, it requires less than 10% variability in storm activity. In general, rapid tropospheric warming events occur during SST cooling (and vice versa), which is much weaker in magnitude owing to the very different heat capacities of water versus air.
The global image for November should be available in the next day or so here.
Popular monthly data files (these might take a few days to update):
uahncdc_lt_5.6.txt (Lower Troposphere)
uahncdc_mt_5.6.txt (Mid-Troposphere)
uahncdc_ls_5.6.txt (Lower Stratosphere)

 Home/Blog


