
 Home/Blog
UPDATE: As of 9 a.m. PST, the water level has increased to 901.24 ft., and water is overflowing the 1,700 ft. long emergency spillway.
For the first time in the 50 year history of Oroville Dam, Lake Oroville has exceeded its design limit as of 3 a.m. PST this morning, reaching 900.1 ft. elevation.
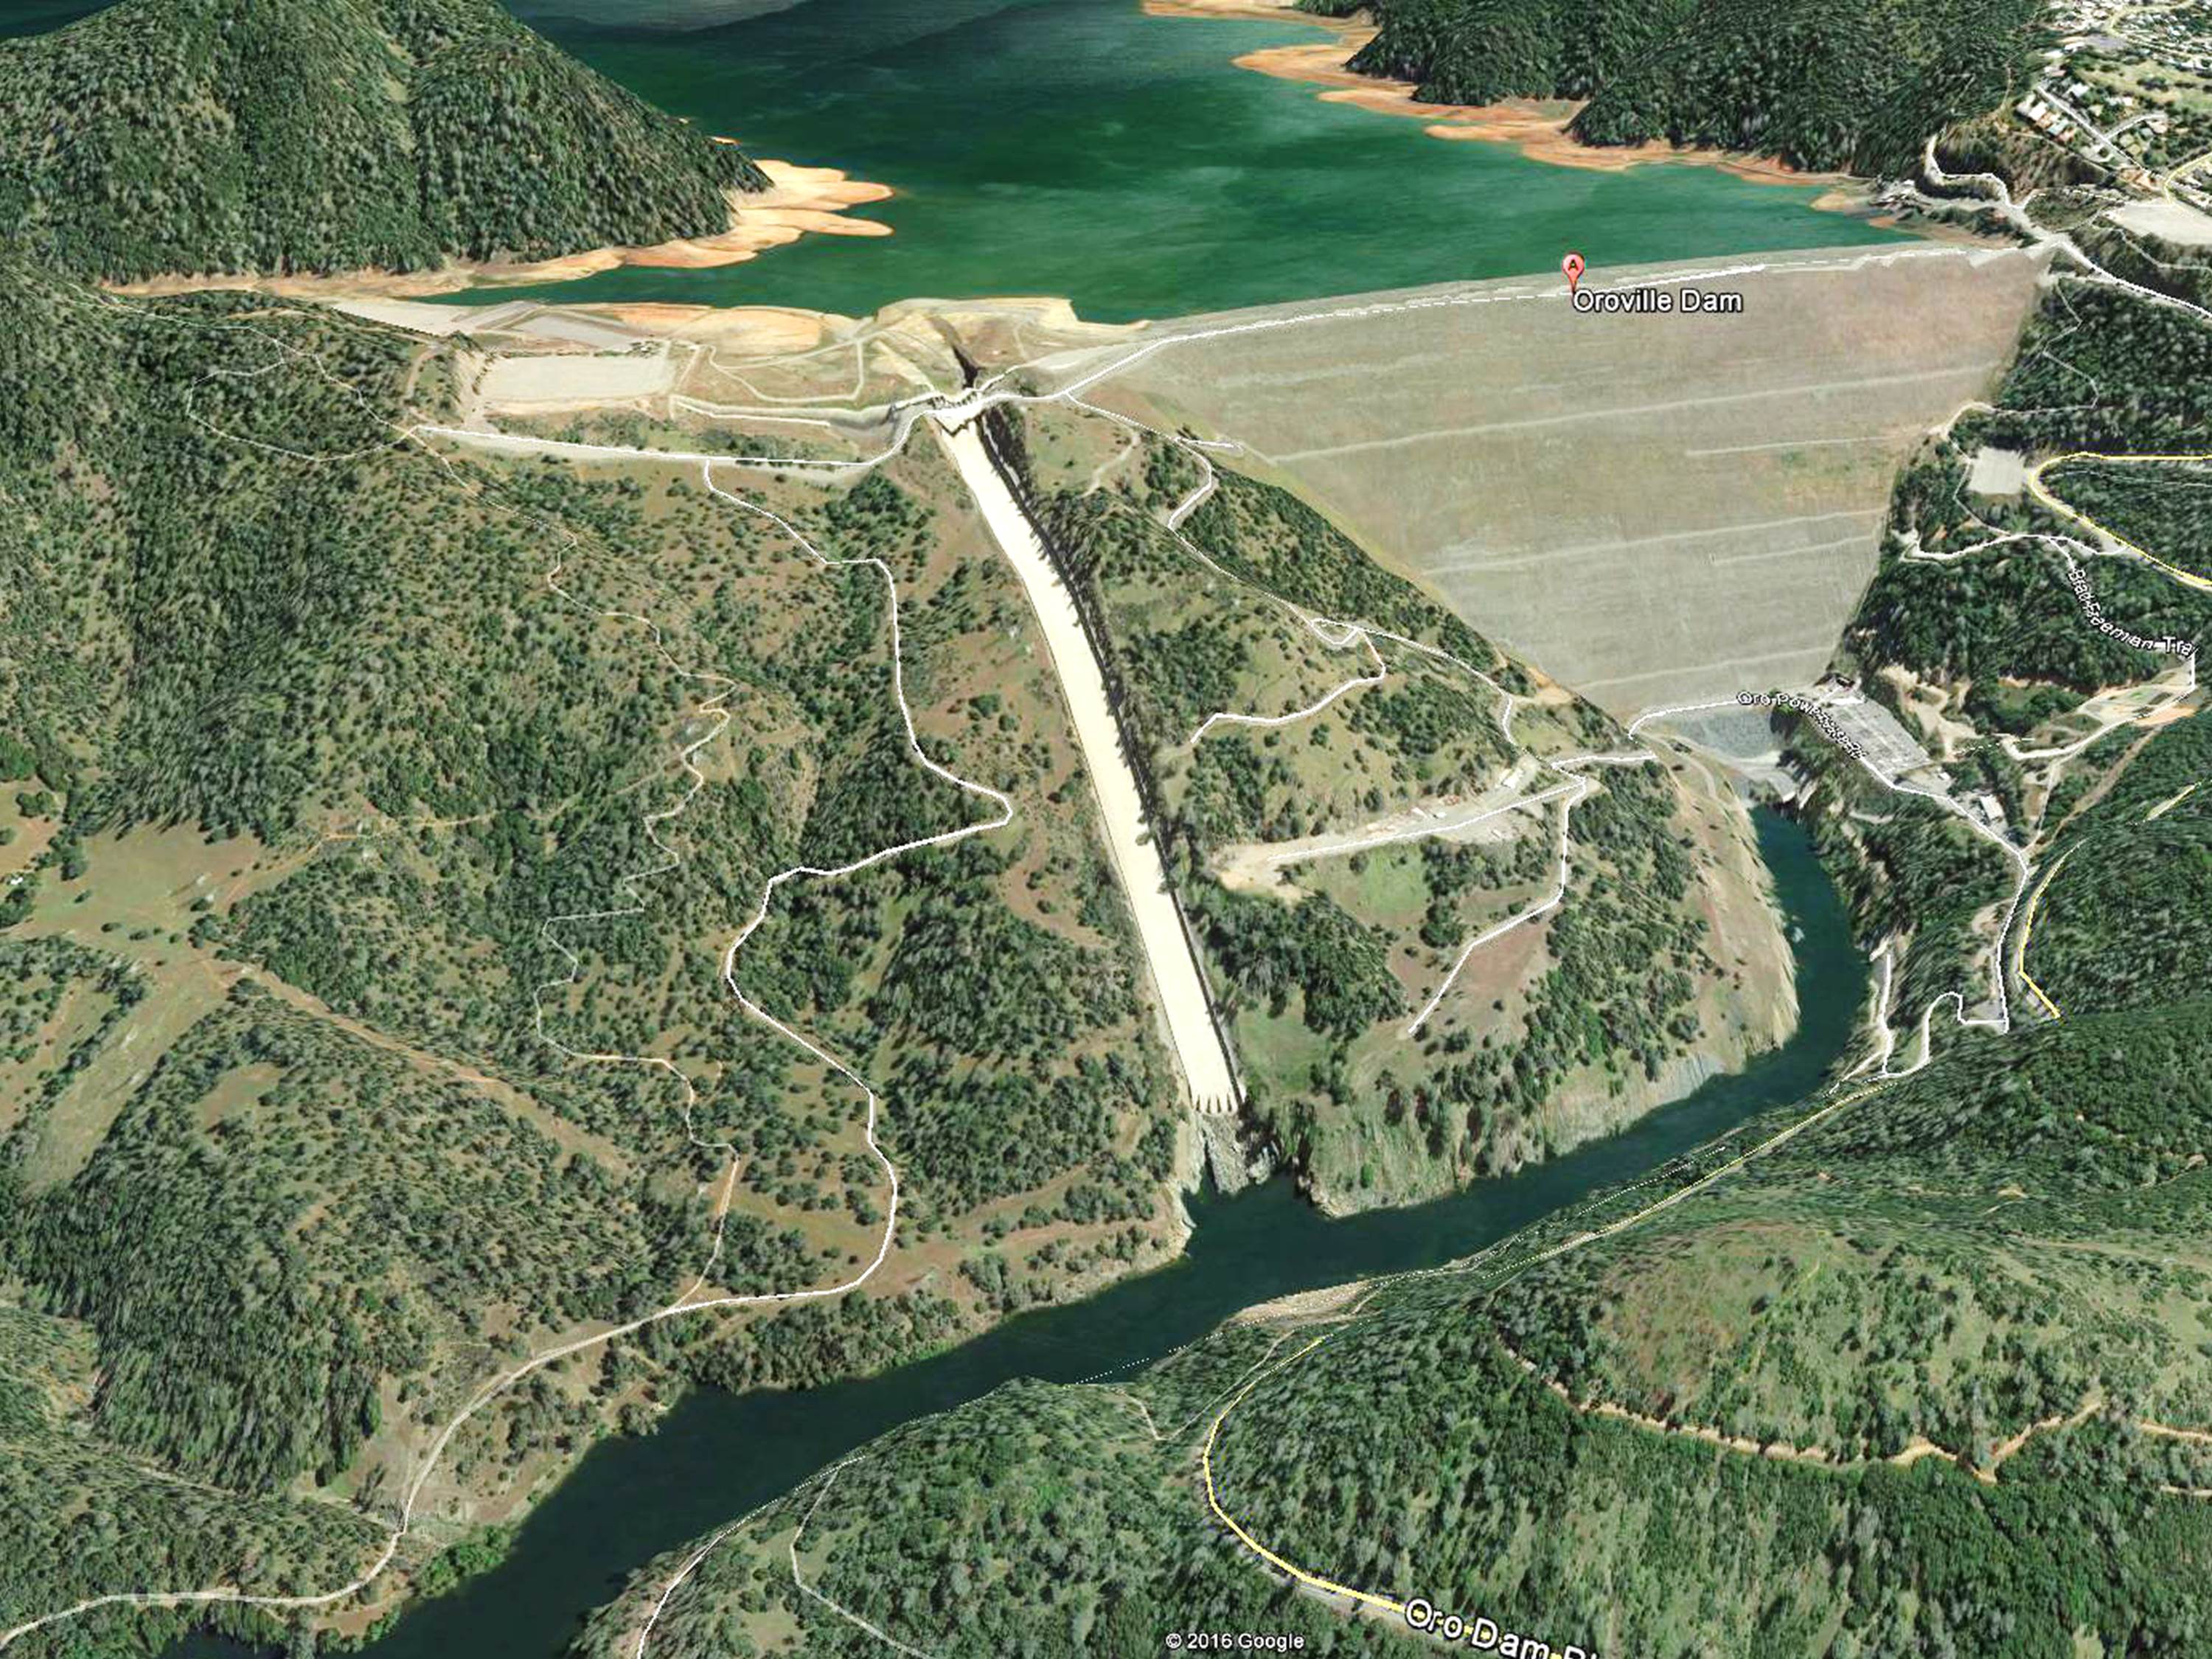
The inflow rate into the reservoir continues to exceed the outflow rate, increasing the probability of the first-ever use of the emergency spillway. This would cause massive erosion of the hillside, which in this Google Earth image is to the left of the narrow concrete spillway (2015 imagery, reservoir 50% full):
I have made an estimate of when the emergency spillway might be breached based upon rates of inflow and outflow; the following chart suggests around 8 a.m. this morning:
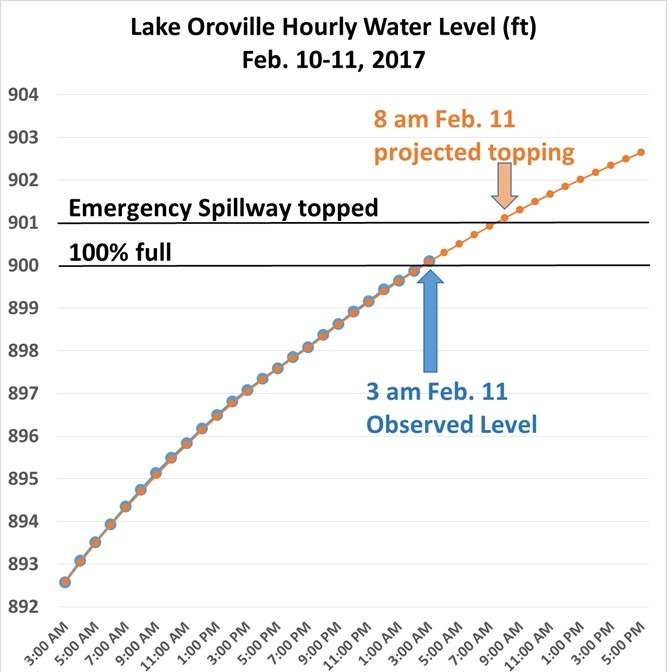
Observed (blue) and model-estimated (orange) Lake Oroville water levels.
These (unofficial) model-projected levels in the above chart assume measured inflow into the reservoir continues its steady decrease, and the outflow remains the same as it has been since 8 p.m. last night, when engineers reduced the flow through the damaged concrete spillway to avoid damage to power line towers:
Even if flow through the concrete spillway is increased to full-flow, the topping of the emergency spillway would only be delayed by an hour or so (9 a.m.). Lake levels would not keep increasing afterward, as suggested in the above chart… the model estimates are just meant to suggest we are likely headed to a breach of the emergency spillway, which will then provide an additional outflow channel for the lake.
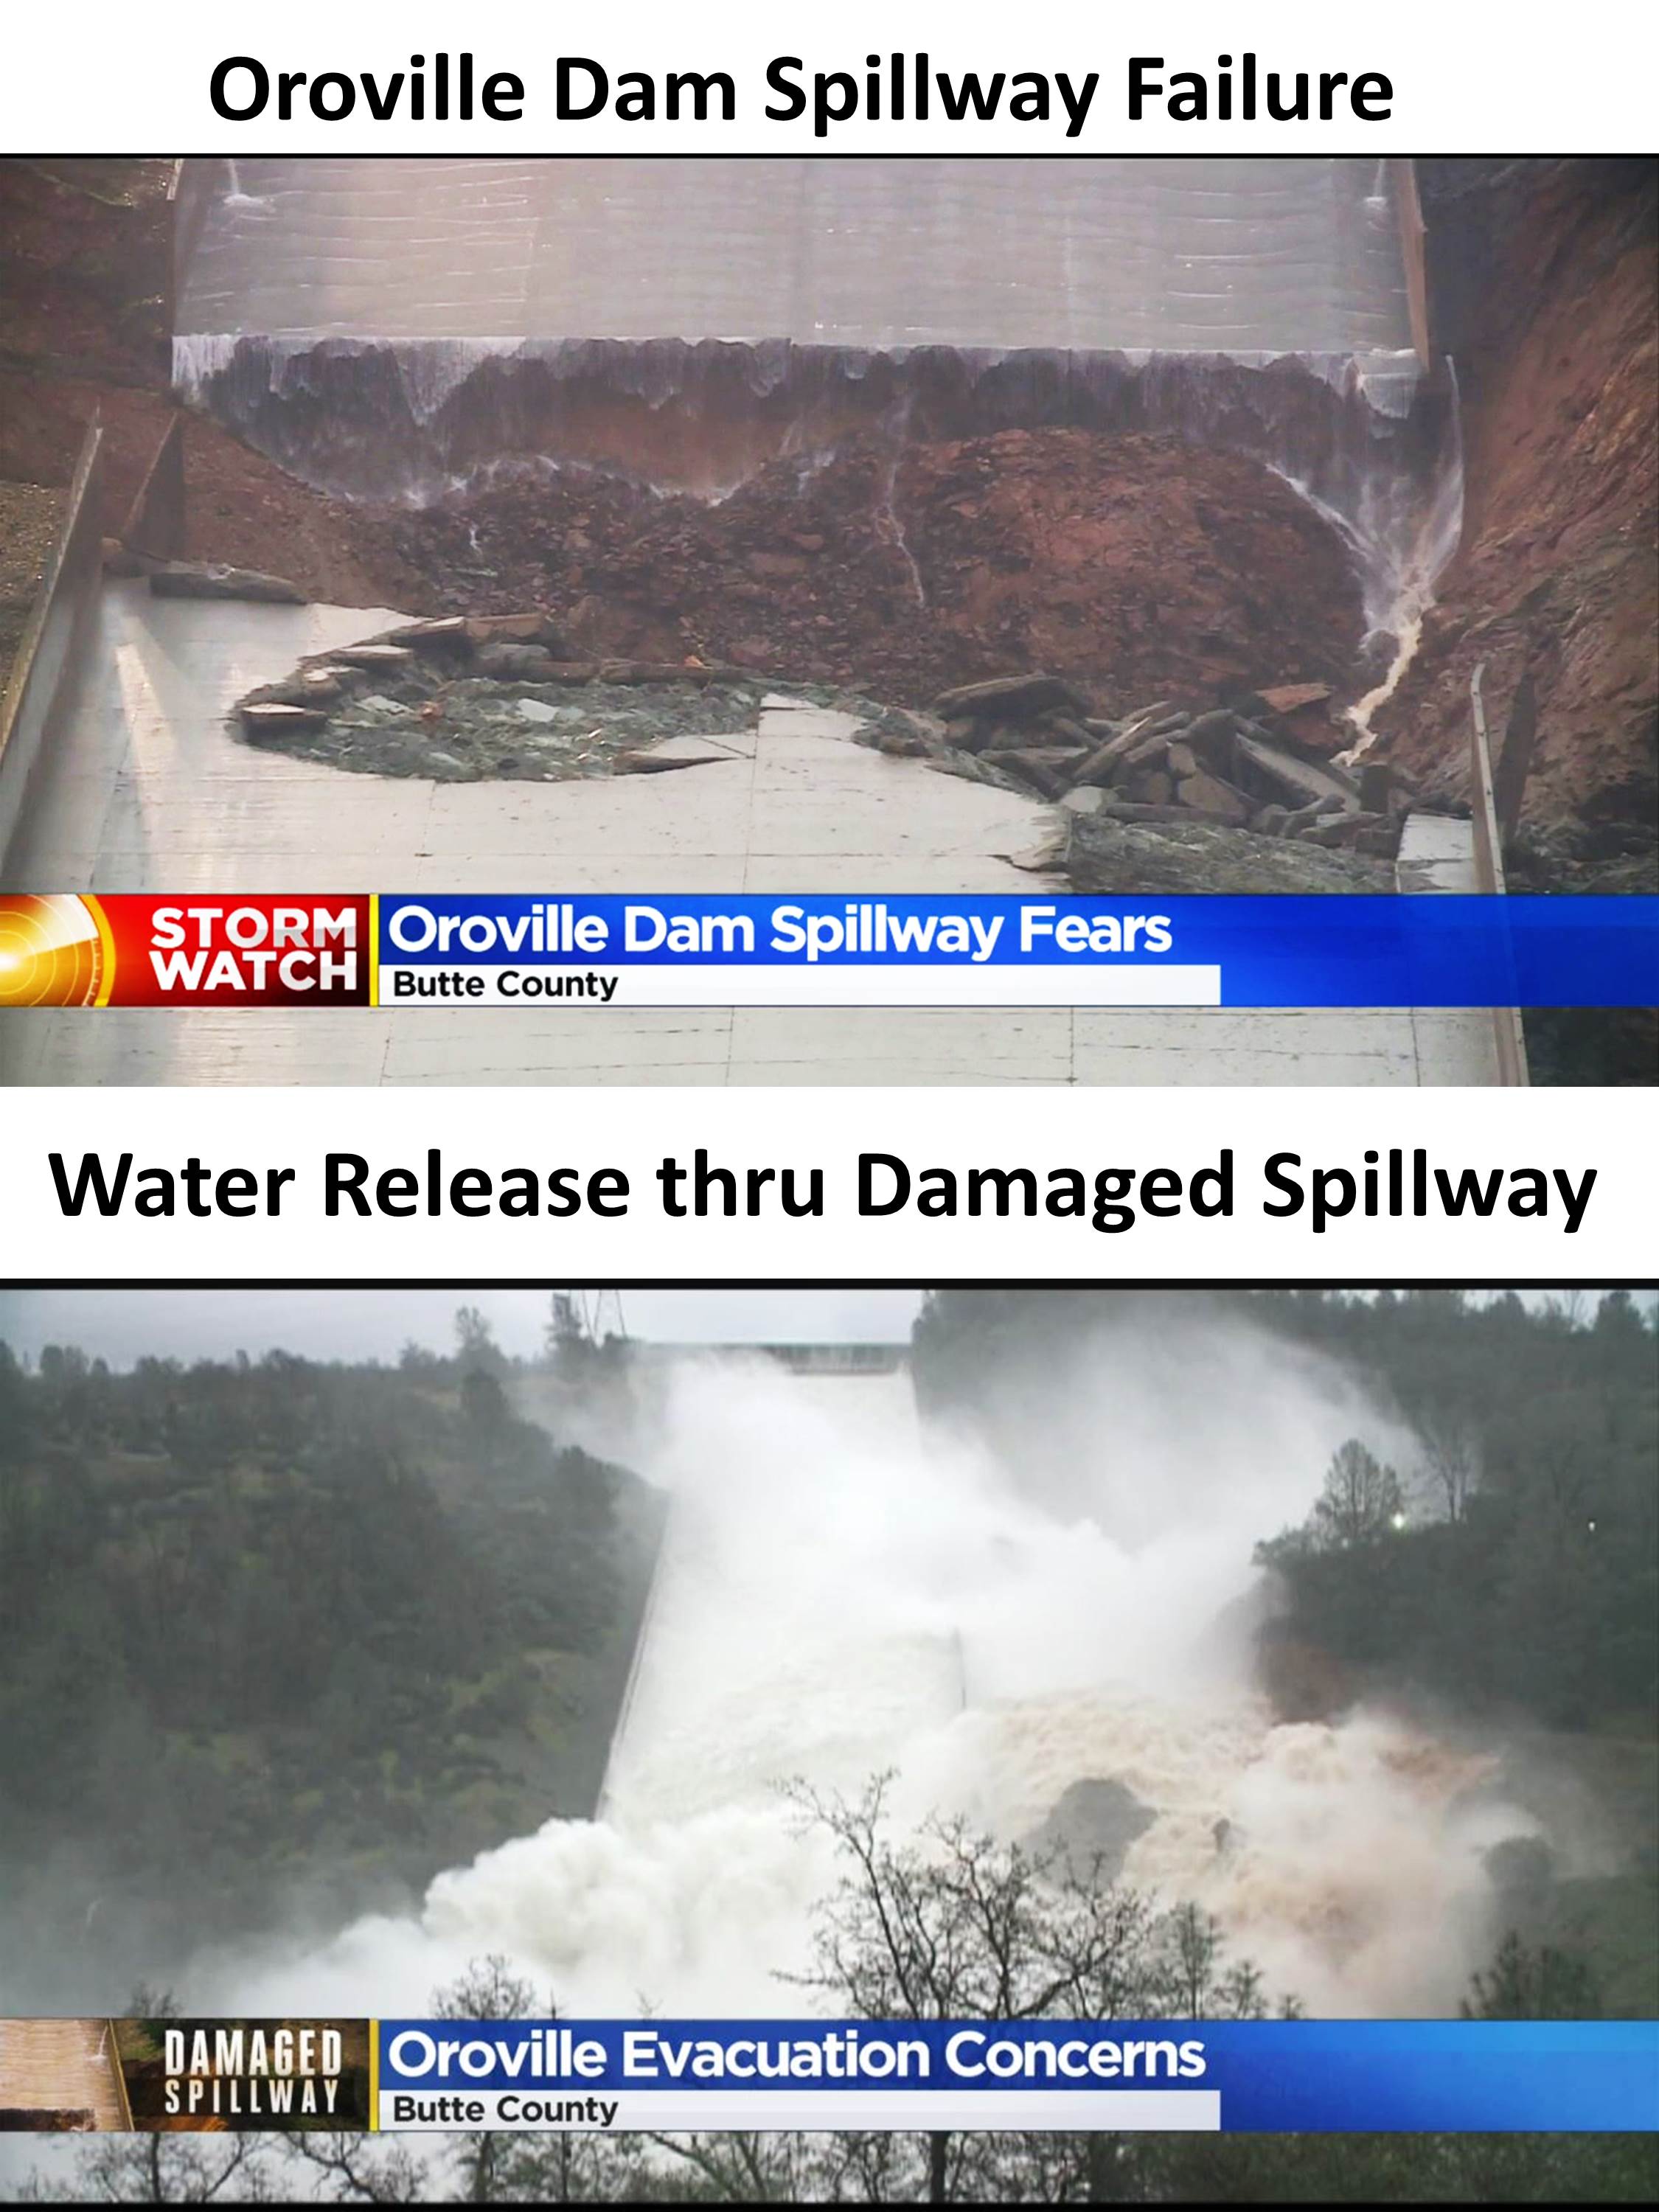
I have no idea whether engineers have any “tricks up their sleeve” to avoid the emergency water release. The electricity generating turbines have been shut down due to debris in the water. I suspect we will be seeing some rather dramatic (and very muddy) video later today.
(Oroville Mercury Register live news updates.)
(Follow the hourly updates of water flow and lake level.)


