[This is an update on research progress we have made into determining just how sensitive the climate system is to increasing atmospheric greenhouse gas concentrations.]
While published studies are beginning to suggest that net feedbacks in the climate system could be negative for year-to-year variations (e.g., our 2007 paper, and the new study by Lindzen and Choi, 2009), there remains the question of whether the same can be said of long-term climate sensitivity (and therefore, of the strength of future global warming).
Even if we find observational evidence of an insensitive climate system for year-to-year fluctuations in the climate system, it could be that the system’s long term response to more carbon dioxide is very sensitive. I’m not saying I believe that is the case – I don’t – but it is possible. This question of a potentially large difference in short-term and long-term responses of the climate system has been bothering me for many months.
Significantly, as far as I know, the climate modelers have not yet demonstrated that there is any short-term behavior in their models which is also a good predictor of how much global warming those models project for our future. It needs to be something we can measure, something we can test with real observations. Just because all of the models behave more-or-less like the real climate system does not mean the range of warming they produce encompasses the truth.
For instance, computing feedback parameters (a measure of how much the radiative balance of the Earth changes in response to a temperature change) would be the most obvious test. But I’ve diagnosed feedback parameters from 7- to 10-year subsets of the models’ long-term global warming simulations, and they have virtually no correlation with those models known long-term feedbacks. (I am quite sure I know the reason for this…which is the subject of our JGR paper now being revised…I just don’t know a good way around it).
But I refuse to give up searching. This is because the most important feedbacks in the climate system – clouds and water vapor – have inherently short time scales…minutes for individual clouds, to days or weeks for large regional cloud systems and changes in free-tropospheric water vapor. So, I still believe that there MUST be one or more short term “markers” of long term climate sensitivity.
Well, this past week I think I finally found one. I’m going to be a little evasive about exactly what that marker is because, in this case, the finding is too important to give away to another researcher who will beat me to publishing it (insert smiley here).
What I will say is that the marker ‘index’ is related to how the climate models behave during sudden warming events and the cooling that follows them. In the IPCC climate models, these warming/cooling events typically have time scales of several months, and are self-generated as ‘natural variability’ within the models. (I’m not concerned that I’ve given it away, since the marker is not obvious…as my associate Danny Braswell asked, “What made you think of that?”)
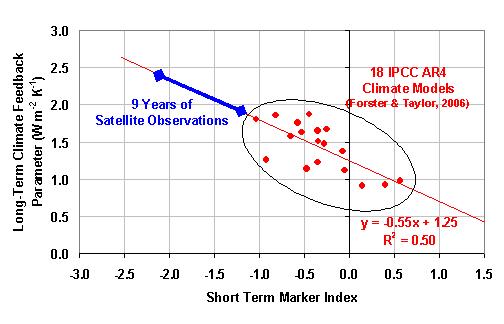
The following plot shows how this ‘mystery index’ is related to the net feedback parameters diagnosed in those 18 climate models by Forster and Taylor (2006). As can be seen, it explains 50% of the variance among the different models. The best I have been able to do up to this point is less than 10% explained variance, which for a sample size of 18 models might as well be zero.

Also plotted is the range of values of this index from 9 years of CERES satellite measurements computed in the same manner as with the models’ output. As can be seen, the satellite data support lower climate sensitivity (larger feedback parameter) than any of the climate models…but not nearly as low as the 6 Watts per sq. meter per degree found for tropical climate variations by us and others.
For a doubling of atmospheric carbon dioxide, the satellite measurements would correspond to about 1.6 to 2.0 deg. C of warming, compared to the 18 IPCC models’ range shown, which corresponds to warming of from about 2.0 to 4.2 deg. C.
The relatively short length of record of our best satellite data (9 years) appears to be the limiting factor in this analysis. The model results shown in the above figure come from 50 years of output from each of the 18 models, while the satellite range of results comes from only 9 years of CERES data (March 2000 through December 2008). The index needs to be computed from as many strong warming events as can be found, because the marker only emerges when a number of them are averaged together.
Despite this drawback, the finding of this short-term marker of long-term climate sensitivity is at least a step in the right direction. I will post progress on this issue as the evidence unfolds. Hopefully, more robust markers can be found that show even a stronger relationship to long-term warming in the models, and which will produce greater confidence when tested with relatively short periods of satellite data.

 Home/Blog


