Global Average Sea Surface Temperatures Continue their Plunge

June 18th, 2010 by Roy W. Spencer, Ph. D.

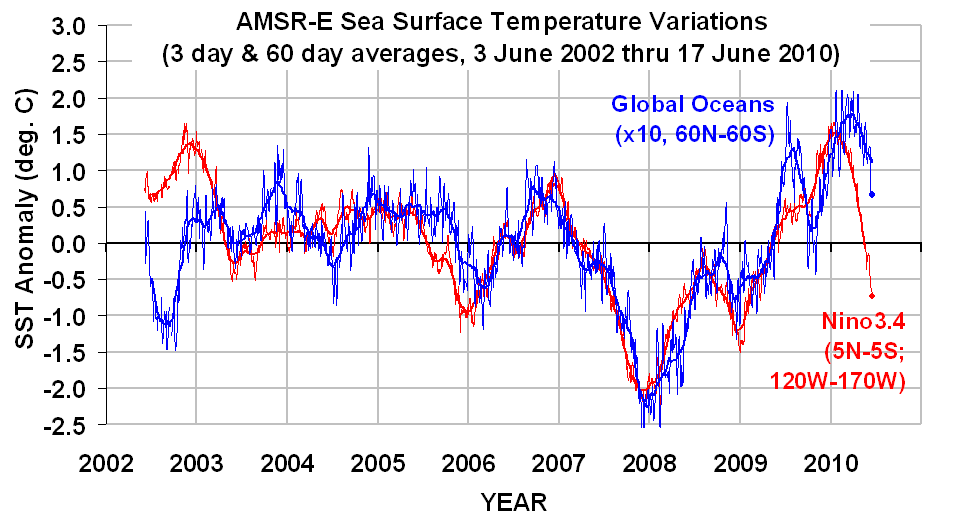
Sea Surface Temperatures (SSTs) measured by the AMSR-E instrument on NASA’s Aqua satellite continue their plunge as a predicted La Nina approaches. The following plot, updated through yesterday (June 17, 2010) shows that the cooling in the Nino34 region in the tropical east Pacific is well ahead of the cooling in the global average SST, something we did not see during the 2007-08 La Nina event (click on it for the large, undistorted version):
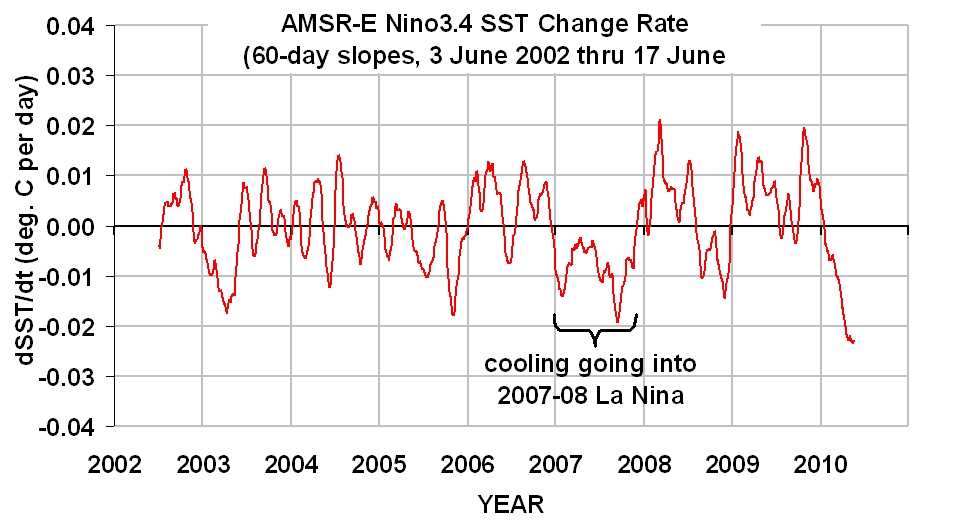
The rate at which the Nino34 SSTs are falling is particularly striking, as seen in this plot of the SST change rate for that region:
To give some idea of what is causing the global-average SST to fall so rapidly, I came up with an estimate of the change in reflected sunlight (shortwave, or SW flux) using our AMSR-E total integrated cloud water amounts. This was done with a 7+ year comparison of those cloud water estimates to daily global-ocean SW anomalies computed from the CERES radiation budget instrument, also on Aqua:
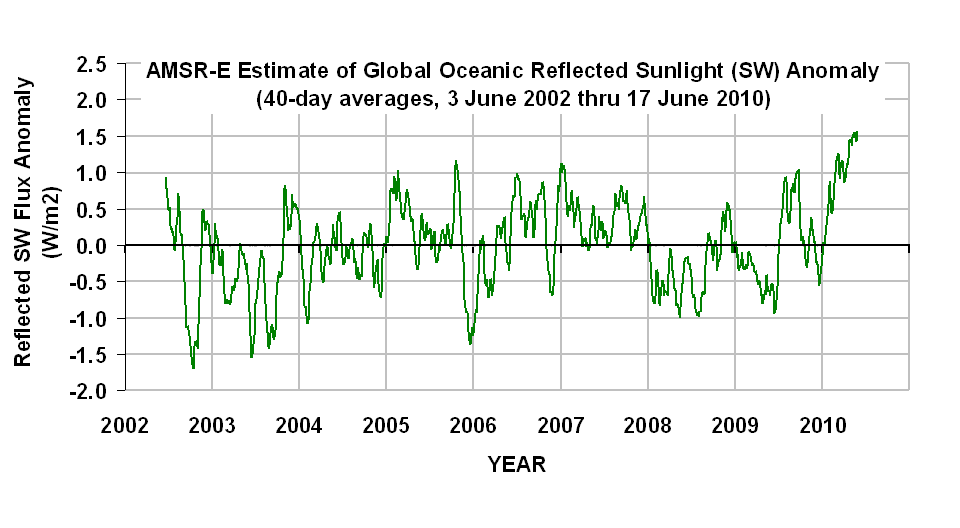
What this shows is an unusually large increase in reflected sunlight over the last several months, probably due to an increase in low cloud cover.

At this pace of cooling, I suspect that the second half of 2010 could ruin the chances of getting a record high global temperature for this year. Oh, darn.


30 Responses to “Global Average Sea Surface Temperatures Continue their Plunge”

Toggle Trackbacks

  1. Otter says:

    I unfortunately doubt it will make any headlines, nor prevent the suicide of the US re: cap-and-strangle 🙁

    Keep up the Excellent work anyway. Some few of us around the world are paying attention.

  2. harrywr2 says:

    This seems to confirm what we are experiencing in Seattle.

    The last ‘hot day’, defined as 75 degrees or warmer was Sept 23rd, 2009. On June 9th we broke the record for ‘no hot days’ and there is no end in sight.

  3. toby says:

    Dear Dr. Spencer,

    Against what base period average is the anomaly measured? It might also be more effective to show the anomaly back to 1979.

    • The anomalies are relative to the period shown. Extending the data to before mid-2002 (when Aqua was launched) would require other sources of SST data, which might not have the same characteristics in terms of seasonal cycle, etc. The AMSR-E provides the most geographically complete record of SST because it can measure through most cloud cover conditions.

      • Anonymous says:

        just the fear that others are watching the AQUA, like a hawk, may provide enough reason for some of the dishonest ones to not try to doctor the data, like they are doing to the land data

  4. Carl Chapman says:

    “At this pace of cooling, I suspect that the second half of 2010 could ruin the chances of getting a record high global temperature for this year.”

    A challenge for James Hansen and GISSTemp. If he ignores every weather station in Canada and Alaska, and every station that’s not on the coast, I believe he can do it. He’s up to the challenge.

  5. Scott says:

    What about data before 2002? Is 2002-2008 all you have to make these conclusions for things being usual or unusual?

    And you are forgetting that this year has already been a record year. If you dont use the arbitrary boundaries of a year and instead use a 1yr running average, we’ve already reach record temperatures.

  6. Juho says:

    Scott you are forgetting that both RSS and UAH show 1998 150d avg higher than 2010. Dont look at GISTEMP.

  7. John says:

    Dear Dr. Spencer

    Atmospheric water appears in two phases, gas and liquid. The gas phase tends to trap radiation while the liquid phase reflects. When the gas phase rises, it cools, changing to liquid at high altitudes where it becomes a reflector.

    If there were more of the gas phase than usual, owing to extra heating from some “greenhouse” gas, wouldn’t there be more clouds shading the earth and counterbalancing the warming tendency?

    Am I missing something? Would you help? Thanks.

    • Anonymous says:

      “John says:
      June 19, 2010 at 10:48 AM
      Dear Dr. Spencer

      Atmospheric water appears in two phases, gas and liquid. The gas phase tends to trap radiation while the liquid phase reflects. When the gas phase rises, it cools, changing to liquid at high altitudes where it becomes a reflector.

      If there were more of the gas phase than usual, owing to extra heating from some greenhouse gas, wouldnt there be more clouds shading the earth and counterbalancing the warming tendency?”

      First there are of course 3 phases – the liquid phase becoming ice crystals that are even better at reflecting high frequency radiation.

      I think that the general idea of clouds (aka the hydrologic cycle) acting as a homeostatic feedback that is sensitive and of considerable power is gaining acceptance. The Climate Process Team on Low Altitude Cloud Feedbacks and Cloud Sensitivity (Cloud CPT) have come up with a finding:

      “The worlds first superparameterization climate sensitivity results show strong negative cloud feedbacks driven by enhancement of boundary layer clouds in a warmer climate.”

      See: http://www.atmos.washington.edu/~breth/CPT-clouds.html

  8. Hugh says:

    The ocean is cooling faster than Al and Tippers relationship. Karma.

  9. If my observations of the way the ocean reacts to low solar activity are correct, this dip will be short lived and we’ll get another el nino next year. It won’t be as high as this one though, as ocean heat content is dropping fast due to increased cloud cover and low solar activity.

    Nutshell: the ocean is taking the opportunity to shed excess heat-energy acquired during the high solar activity of the mid-late C20th.

    Implication: The ocean absorbs and retains heat-energy on longer timescales than previously thought.

    Logical deduction: variations in Solar activity have more of an effect on temperature than previously thought.

    • Anonymous says:

      I seriously doubt that we will see an El Nino next year, there is a large pool of cold water at depth that precludes that possibility. The powers that be are now predicting a 70% chance of a La Nina forming late this summer and continuing throughout the winter.

      DontGetOutMuch

  10. Ed_B says:

    John:

    I suggest you buy and read Dr. Spencers book. It has an excellent description of the climate systems inner workings. See the advertisement on this blog.

  11. tommy says:

    Here in middle of Norway we have had only one summer day so far this “summer”.
    The one so called summer day happened in middle of may and since then we havent even been near 20c. So far june looks like it will be several degrees below normal by the time this month is finished:
    “Last 30 days: Average temperature was 9.5 C, 1.9 C below the normal. Highest temperature was 19.2 C (10 June), and the lowest was 2.3 C”

    I know no one who has ever experienced a year like this. Our winter was also the coldest in decades and temps have since then been constantly below normal except for april that came out around “normal”.

    Makes me wonder how bad things will be when global temps actually start dropping.

    • coturnix19 says:

      here in ukraine (eastern europe) we had probably one of the hottest junes on record. While +32-+34 isn’t extraordinay for summer in whole, it is very strange to see this in early june. We also had very nice, even and mild spring, at least from my point of view. So you see, global temp. is like avg. temp. in hospital – hardly useful.

  12. Sam NC says:

    Even 2 deg C rise or fall is nothing! Why drilling on 0.0X degree rise or fall? Climate Scientists are mad and warn us its the end of the world. IPCC, NAS and NASA warmists are climate nuts.

  13. Stephen Wilde says:

    The slow rise in albedo since 2000 is consistent with the equatorward drift of the three main cloud bands over that period.

    During the late 20th century warming spell those cloud bands moved poleward and albedo decreased.

    Less shortwave will enter the oceans until those cloud bands move back poleward again.

    The recent El Nino pushed the cloud bands a little poleward in 2008/09 hence the dip in albedo during that period however the cloud bands were not pushed as far poleward as similar El Ninos sent then during the late 20th century.

    The main difference since then is the less active sun so I propose that a less active sun tends to enhance the polar oscillations and restrain the effectiveness of El Nino events in pushing the clouds poleward.

    The primary influence on global albedo would appear to be latitudinal shifts in the cloud bands due to the change in the incidence of sunlight upon them at different latitudes.

    The observed changes since 2000 are not in any way correlated with CO2 but appear to result from an interplay between solar and oceanic variability.

    • Anonymous says:

      Has the influence of the large cyclical changes in the gravitational pull of the moon been taken into account in the variations of the different oceanic and atmospheric phenomena?
      See eg http://globalweatheroscillations.com/GWGCNCF/index.htm

      Makes sense to me, given the distribution of landmasses between NH and SH, that these gravitational changes influence the large oceanic flows etc.

  14. Alex the skeptic says:

    NEW SCIENTIST:What’s wrong with the sun?

    Global warmists will have to find another job, maybe carrying coal to the sun to mak eit hotter? Read here:

    http://www.newscientist.com/article/mg20627640.800-whats-wrong-with-the-sun.html?full=true

    “What the sun will do next is beyond our ability to predict. Most astronomers think that the solar cycle will proceed, but at significantly depressed levels of activity similar to those last seen in the 19th century. However, there is also evidence that the sun is inexorably losing its ability to produce sunspots (see “The sunspot forecast”). By 2015, they could be gone altogether, plunging us into a new Maunder minimum – and perhaps a new Little Ice Age.”

  15. HR says:

    Dr Spencer,

    This is off topic but I hope you forgive me.

    The question arose based on an article I read about the tropospheric hot spot on skepticalscience.com

    http://www.skepticalscience.com/How-Jo-Nova-doesnt-get-the-tropospheric-hot-spot.html

    It points out that no long term trend is observable in the tropospheric hot spot and puts this down to “long-term biases caused by orbital decay and the cooling stratosphere”. And this problem had been overcome by the work of a series of groups who had “accounted for these biases” and had shown the expected warming trend (Titchner 2009, Sherwood 2008, Haimberger 2008). I was wondering whether you could pick apart those comments for me?

    On a side note it also got me thinking about how the technology had changed. My understanding is that the satellite record is the product of a series of satellites. I imagine that with each subsequent satellite lessons are learned and technology is improved so that the record has become more reliable over time. Is this in fact true? If you have the time to flesh out how things have changed or point me in the direction of further reading you’d be doing a great service to a curious mind.

    Thanks

  16. lgl says:

    A plot of the integral of reflected SW would be interesting. (or a link to the text format SW data)

  17. Venter says:

    Dear Dr.Spencer,

    One of the true believers in AGW with whom I’ve had a few arguments had the following comment on your article

    “I have no idea how he managed to come to that conclusion. I just looked at the AMSR data (I am involved in one of the other instruments on the same satellite, so get access to the raw data) and it looks nothing like what he suggests.
    In fact, in the AMSR-E record last week was the second warmest, only 2009 was higher. I also don’t see why he is using the poorly calibrated 2002 data.”

    Could you please provide an answer?

    • Venter, I think he is confusing temperature with change of temperature with time. Yes, global average SSTs remain very warm…but are falling rapidly. Losing all of that accumulated energy takes time. Also, I do not know what he is talking about re: poorly calibrated 2002 AMSR-E SST data.

  18. pochas says:

    We now know the names of the heretics, but we also know the names of the Collegium of Syncophants. I wonder whose names will be remembered in 368 years.

  19. Charles Wilson says:

    Dr. Roy:
    Do you have a breakout on CLOUDINESS for the ARCTIC OCEAN ?

    I am currently predicting an 80% + melt off of the Arctic Sea Ice with 1-in-4 to 1-in-8 chance of Ocean Current Reversal, enough to, well: KILL US ALL with 300 mph high winds. If there are unusually few Clouds, like for 2007’s great Melt. See: http://www.arctic.noaa.gov/report08/images/essays/ocean/o2.jpg

    So I cheer & Root for Clouds !
    I’d prefer to be Wrong rather than Dead.

    The lively debates on WattsUpWithThat.com have found
    an index for Barrow (Alaska)’s weather & nearby: see: http://climateinsiders.files.wordpress.com/2010/06/melt-out_small-1.png – – from the site: http://seaice.alaska.edu/gi/observatories/barrow_breakup

    My problem is the Sea Ice Volume Anomaly http://psc.apl.washington.edu/ArcticSeaiceVolume/images/BPIOMASIceVolumeAnomalyCurrent.png
    has shown 2200 km3 more of an Anomaly = LESS Ice, than Last Years’ Piomas-derived minimum of 5800 km3 “left over”. Of course any Anomaly Trend, may Reverse at any time, but the Anomaly has worsened by 300 a week for 10 straight weeks.

    But your “uah-lt” Satellite temps for the Arctic Ocean, continue about 2.5 degrees C above average – – as they have since December. Winds also broke the Nares Ice Dam early, etc.

    I figure it FACTORS AS THE RATIO of EL NINO STRENGTH:

    2007 was 1.1, 2010 is 1.8. If so, dividing 2010 by 2007 (4000 is 2007’s Loss over 2006) gives:

    1.8/1.1 times 4000 = 6545 km3 Loss = “We all Die”

    (OK, I give it 15%: see reasons below)

    You see, there is not 6545 km3 to lose.
    Only 5800.

    A negative result means it melts off WAY EARLY
    = Polar overheat
    = Ocean currents start conveying Warmth SOUTH.
    = They take Months to reverse at Ocean Currents’ speeds of 3 knots, meanwhile the WINDS have to take over Heat Transfer and, as the Oceans weigh 1900 times the Atmosphere, they have to go faster

    — likely, the 300 mph winds AS OBSERVED IN THE FOSSIL/ICE CORE RECORD. NO buildings survive North of Venezuela. None.
    99% dead America.

    (and, as NASA’s Drew Shindell found 74% of Gradual Arctic Warming = 1.09oC –is from Cap & Trade, you can thank the Cap & Trade Lobby — which also means I am getting no help from either Right OR Left on this).

    But the Clouds were trending low, like 2007, then snapped back towards Normal the last Week. NO SUN = GOOD. Maybe Clouds will counteract the other factors.

    Or Not.

    The other big coin flip: the present Ocean Current system may not be similar enough to the Ice Age End for the same result — beaches on Greenland Imply an Open Arctic in summer till after 6000 BP and there was no SuperWind every year. Just the First year. Some think maybe 8200 BP too. But there IS a Ocean current system that excludes it. As we now have a Closed Arctic Ocean = like the Ice Age, is that enough similarity ?

    And would you bet 2 BILLION childrens’ LIVES on it ?

    And of course we will see undersetimations of Melt from PIOMAS, like in 2007, if it melts the Central Arctic. But then we had ICESAT to show the True Loss. And since then “Icebridge” flew over the Central Arctic, which data plug right into the Piomas framework.

    But Icebridge plane Flights stopped once Cryosat Launched.

    … The Europeans of course, have decided to ignore the “QuickLook” feature on Cryosat which would give a timely & precise MEASURE of Ice Volume – – to preserve “Academic Priority of Publication” for a year or 2 or whenever they feel like it, or until they like the results, or …

    — you know the Drill with the Europeans: Right ?

    So since May there are no Laser thickness measurements to calibrate Piomas (except near shore stations & ships) … and it defaults to the the usual proxy: Microwave reflectance, which is already plotting the big Open Water patches as THICK Ice, as 90% ice reflects more SUN than a mix but 0% Ice = 100% OPEN water: Heats up from Sunlight without Ice to cool it, and thus ALSO puts more radiation up vertically, tricking the Satellite into showing it as THICK ice — which you see on sites not calibrated with shore station & ship-measured thickness. And until recently: Planes.

    Dr. Roy, you & your people ALREADY do the only “breakout” of air Temps for the Arctic Ocean http://vortex.nsstc.uah.edu/data/msu/t2lt/uahncdc.lt>
    . . .

    . . . Can you post something similar for CLOUDS ?

    Sincerely, Charles Wilson

  20. Alec, a.k.a. Daffy Duck says:

    Any chnce of updating the graghs??? Layman here…I just follow this stuff.

Leave a Reply