Update on the Role of the Pacific Decadal Oscillation in Global Warming

June 17th, 2010 by Roy W. Spencer, Ph. D.

UPDATE: more edits & enhancements for clarity made at 3:35 CDT, June 17, 2010.

I’ve returned to the issue of determining to what extent the Pacific Decadal Oscillation (PDO) can at least partly explain global average temperature variations, including warming, during the 20th Century. We tried publishing a paper on this over a year ago and were immediately and swiftly rejected in a matter of days by a single (!) reviewer.

Here I use a simple forcing-feedback model, combined with satellite estimates of cloud changes caused by the PDO, to demonstrate the ability of the model to explain the temperature variations. This time, though, I am going to use Jim Hansen’s (GISS) record of yearly radiative forcings of the global climate system since 1900 to demonstrate more convincingly the importance of the PDO…not only for explaining the global temperature record of the past, but for the estimation of the sensitivity of the climate system and thus project the amount of future global warming (er, I mean climate change).

What follows is not meant to be publishable in a peer-reviewed paper. It is to keep the public informed, to stimulate discussion, to provide additional support for the claims in my latest book, and to help me better understand what I know at this point in my research, what I don’t know, and what direction I should go next.

The Simple Climate Model
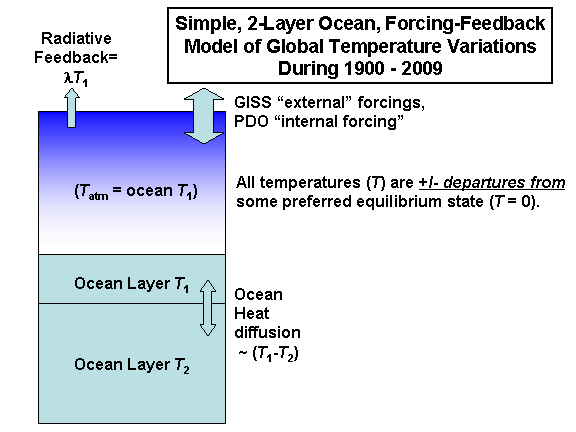
I’m still using a simple forcing feedback-model of temperature variations, but have found that more than a single ocean layer is required to mimic both the faster time scales (e.g. 5-year) temperature fluctuations, while allowing a slower temperature response on multi-decadal time scales as heat diffuses from the upper ocean to the deeper ocean. The following diagram shows the main components of the model.
For forcing, I am assuming the GISS record of yearly-average forcing, the values of which I have plotted for the period since 1900 in the following graph:
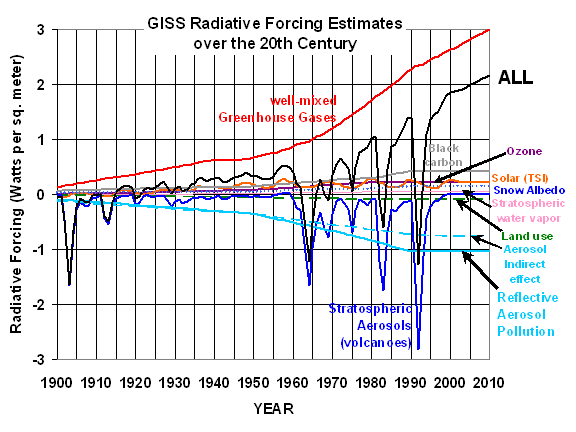
I will simply assume these forcings are correct, and will show what happens in the model when I use: (1) all the GISS forcings together; (2) all GISS forcings except tropospheric aerosols, and (3) all the GISS forcings, but replacing the tropospheric aerosols with the satellite-derived PDO forcings.

Internal Radiative Forcing from the PDO
As readers here are well aware, I believe that there are internal modes of climate variability which can cause “internal radiative forcing” of the climate system. These would most easily be explained as circulation-induced changes in cloud cover. My leading candidate for this mechanism continues to be the Pacific Decadal Oscillation.

We have estimated the radiative forcing associated with the PDO by comparing yearly global averages of them to similar averages of CERES radiative flux variations over the Terra CERES period of record, 2000-2009. But since the CERES-measured radiative imbalances are a combination of forcing and feedback, we must remove an estimate of the feedback to get at the PDO forcing. [This step is completely consistent with, and analogous to, previous investigators removing known radiative forcings from climate model output in order to estimate feedbacks in those models].

Our new JGR paper (still awaiting publication) shows evidence that, for year-to-year climate variability at least, net feedback is about 6 Watts per sq. meter per degree C. After removal of the feedback component with our AMSU-based tropospheric temperature anomalies, the resulting relationship between yearly-running 3-year average PDO index versus radiative forcing looks like this:
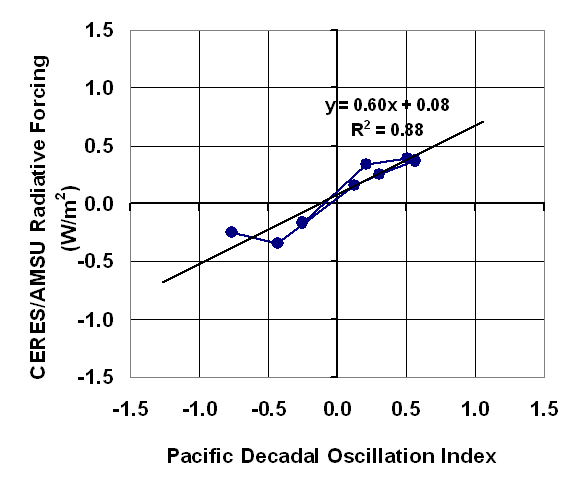
This internally-generated radiative forcing is most likely due to changes in global average cloud cover associated with the PDO. If we apply this relationship to yearly estimates of the PDO index, we get the following estimate of “internal radiative forcing” from the PDO since 1900:
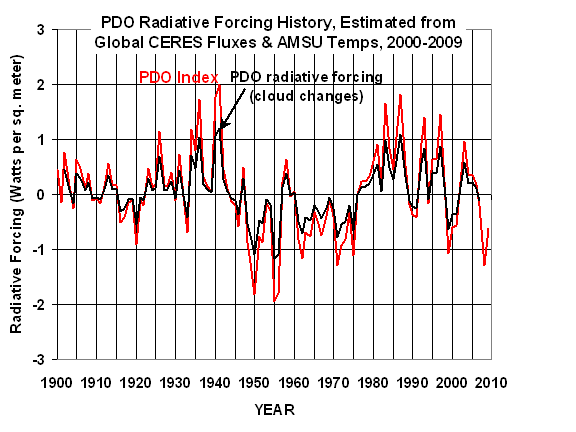
As can be seen, these radiative forcings – if they existed during the 20th Century– are comparable to the magnitude of the GISS forcings.

Model Simulations

The model has 7 free parameters that must be estimated to not only make a model run, but to then meaningfully compare that model run’s temperature “predictions” to the observed record of surface temperature variations. We are especially interested in what feedback parameter, when inserted in the model, best explains past temperature variations, since this determines the climate system’s sensitivity to increasing greenhouse gas concentrations.

Given some assumed history of radiative forcings like those shown above, these 7 model free parameters include:
1) An assumed feedback parameter
2) Total ocean depth that heat is stored/lost from.
3) Fraction of ocean depth contained in the upper ocean layer.
4) Ocean diffusion coefficient (same units as feedback parameter)
5) Initial temperature for 1st ocean layer
6) Initial temperature for 2nd ocean layer
7) Temperature offset for the observed temperature record

While the net feedback in the real climate system is likely dominated by changes in the atmosphere (clouds, water vapor, temperature profile), the model does not have an atmospheric layer per se. On the time scales we are considering here (1 to 5 years an longer), atmospheric temperature variations can be assumed to vary in virtual lock-step with the upper ocean temperature variations. So, the atmosphere can simply be considered to be a small (2 meter) part of the first ocean layer, which is the amount of water that has the same heat capacity as the entire atmosphere.

The last parameter, a temperature offset for the observed temperature record, is necessary because the model assumes some equilibrium temperature state of the climate system, a “preferred” temperature state that the model “tries” to relax to through the temperature feedback term in the model equations. This zero-point might be different from the zero-point chosen for display of observed global temperature anomalies, which the thermometer data analysts have chosen somewhat arbitrarily when compiling the HadCRUT3 dataset.

In order to sweep at least 10 values for every parameter, and run the model for all possible combinations of those parameters, there must be millions of computer simulations performed. Each simulation’s reconstructed history of temperatures can then be automatically compared to the observed temperature record to see how closely it matches.

So far, I have only run the model manually in an Excel spreadsheet, one run at a time, and have found what I believe to be the ranges over which the model free parameters provide the best match to global temperature variations since 1900. I expect that the following model fits to the observed temperature record will improve only slightly when we do full “Monte Carlo” set of millions of simulations.

All of the following simulation results use yearly running 5-year averages for the forcings for the period 1902 through 2007, with a model time step of 1 year.

CASE #1: All GISS Forcings
First let’s examine the best fit I found when I included all of the GISS forcings in the model runs. The following model best fit has a yearly RMS error of 0.0763 deg. C:
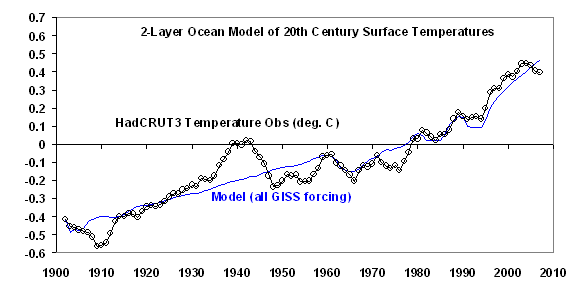
The above “best” model simulation preferred a total ocean depth of 550 meters, 10% of which (55 meters) was contained in the upper layer. (Note that since the Earth is 70% ocean, and land has negligible heat capacity, this corresponds to a real-Earth ocean depth of 550/0.7 = 786 meters).

The offset added to the HadCRUT3 temperature anomalies was very small, only -0.01 deg. C. The heat diffusion coefficient was 7 Watts per sq. meter per deg. C difference between the upper and lower ocean layers. The best initial temperatures of the first and second ocean layers at the start of the model integration were the same as the temperature observations for the first layer (0.41 deg. C below normal), and 0.48 deg. C below normal for the deeper layer.

What we are REALLY interested in, though, is the optimum net feedback parameter for the model run. In this case, it was 1.25 Watts per sq. meter per deg. C. This corresponds to about 3 deg. C of warming for a doubling of atmospheric carbon dioxide (2XCO2, based upon an assumed radiative forcing of 3.7 Watts per sq. meter for 2XCO2). This is in approximate agreement with the IPCC’s best estimate for warming from 2XCO2, and supports the realism of the simple forcing-feedback model for determining climate sensitivity.

But note that the above simulation has 2 shortcomings: 1) it does not do a very good job of mimicking the warming up to 1940 and subsequent slight cooling to the 1970s; and (2) other than the major volcanic eruptions (e.g. Pinatubo in 1991), it does not mimic the sub-decadal temperature variations.

CASE #2: All GISS Forcings except Tropospheric Aerosols
Since the tropospheric aerosols have the largest uncertainty, it is instructive to see what the previous simulation would look like if we remove all 3 tropospheric aerosol components (aerosol reflection, black carbon, and aerosol indirect effect on clouds).

In that case an extremely similar fit to Case #1 is obtained, which has only a slightly degraded RMS error of 0.0788 deg. C.
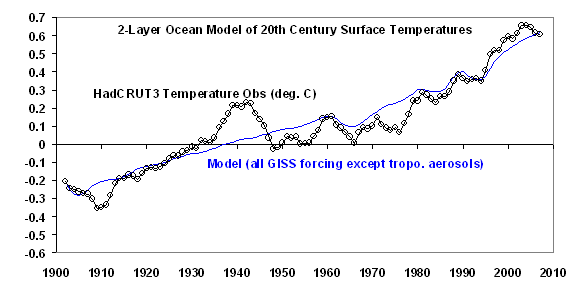
This reveals that the addition of the tropospheric aerosols in the first run improved the model fit by only 3.2% compared to the run without tropospheric aerosols. Yet, what is particularly important is that the best fit feedback has now increased from 1.25 to 3.5 Watts per sq. meter per deg. C, which then reduces the 2XCO2 climate sensitivity from 3.0 deg. C to about 1.1 deg. C! This is below the 1.5 deg. C lower limit the IPCC has ‘very confidently” placed on that warming.

This illustrates the importance of assumed tropospheric aerosol pollution to the IPCC’s global warming arguments. Since the warming during the 20th Century was not as strong as would some expected from increasing greenhouse gases, an offsetting source of cooling had to be found – which, of course, was also manmade.

But even with those aerosols, the model fit to the observations was not very good. That’s where the PDO comes in.

CASE #3: PDO plus all GISS Forcings except Tropospheric Aerosols
For our third and final case, let’s see what happens when we replace the GISS tropospheric aerosol forcings – which are highly uncertain – with our satellite-inferred record of internal radiative forcing from the PDO.

The following plot shows that more of the previously unresolved temperature variability during the 20th Century is now captured; I have also included the “all GISS forcings” model fit for comparison:
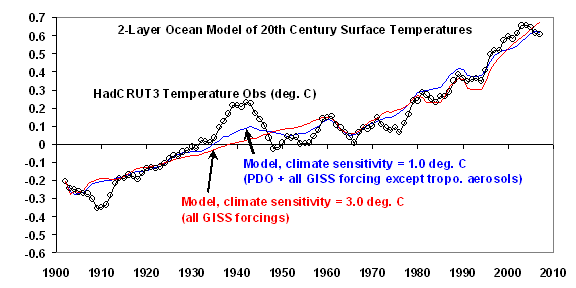
Using the satellite observed PDO forcing of 0.6 Watts per sq. meter per unit change in the PDO index, the RMS error of the model fit improves by 25.4%, to 0.0588 deg. C; this can be compared to the much smaller 3.2% improvement from adding the GISS tropospheric aerosols.

If we ask what PDO-related forcing the model “prefers” to get a best fit, the satellite-inferred value of 0.6 is bumped up to around 1 Watt per sq. meter per unit change in the PDO index, with an RMS fit improvement of over 30% (not shown).

In this last model simulation, note the smaller temperature fluctuations in the HadCRUT3 surface temperature record are now better captured during the 20th Century. This is evidence that the PDO causes its own radiative forcing of the climate system.

And of particular interest, the substitution of the PDO forcing for the tropospheric aerosols restores the low climate sensitivity, with a preferred feedback parameter of 3.6, which corresponds to a 2XCO2 climate sensitivity of only 1.0 deg. C.

If you are wondering, including BOTH the GISS tropospheric aerosols and the PDO forcing made it difficult to get the model to come close to the observed temperature record. The best fit for this combination of forcings will have to wait till the full set of Monte Carlo computer simulations are made.

Conclusions

It is clear (to me, at least) that the IPCC’s claim that the sensitivity of the climate is quite high is critically dependent upon (1) the inclusion of very uncertain aerosol cooling effects in the last half of the 20th Century, and (2) the neglect of any sources of internal radiative forcing on long time scales, such as the 30-60 year time scale of the PDO.

Since we now have satellite measurements that such natural forcings do indeed exist, it would be advisable for the IPCC to revisit the issue of climate sensitivity, taking into account these uncertainties.

It would be difficult for the IPCC to fault this model because of its simplicity. For global average temperature changes on these time scales, the surface temperature variations are controlled by (1) radiative forcings, (2) net feedbacks, and (3) heat diffusion to the deeper ocean. In addition, the simple model’s assumption of a preferred average temperature is exactly what the IPCC implicitly claims! After all, they are the ones who say climate change did not occur until humans started polluting. Think hockey stick.

Remember, in the big picture, a given amount of global warming can be explained with either (1) weak forcing of a sensitive climate system, or (2) strong forcing of an insensitive climate system. By ignoring natural sources of warming – which are understandably less well known than anthropogenic sources — the IPCC biases its conclusions toward high climate sensitivity. I have addressed only ONE potential natural source of radiative forcing — the PDO. Of course, there could be others as well. But the 3rd Case presented above is already getting pretty close to the observed temperature record, which has its own uncertainties anyway.

This source of uncertainty — and bias — regarding the role of past, natural climate variations to the magnitude of future anthropogenic global warming (arghh! I mean climate change) is something that most climate scientists (let alone policymakers) do not yet understand.

WeatherShop.com Gifts, gadgets, weather stations, software and more...click here!


30 Responses to “Update on the Role of the Pacific Decadal Oscillation in Global Warming”

Toggle Trackbacks

  1. Dan Kirk-Davidoff says:

    There are numerous independent estimates of the aerosol cooling. Murphy et al. (2009) say it’s -1.1 W m^-2 +/- 0.4 W m^-2.

    What is your basis for preferring a value of 0?

    Why should a mixed layer model forced with anthropogenic radiative forcing reproduce the sub-decadal variability? Don’t you believe in unforced variability?

    Also, can I give you a nudge about my prior comment? What’s your basis for preferring a mixed layer depth of 25 m to a depth of 18 m with respect to the solar cycle, when 18 m provides a much better fit?

    • I interested in the NET tropospheric aerosol effect, which could be close to zero.

      I don’t believe there is any such thing as “independent” estimates of aerosol effects.

      What you call unforced variability I am calling internal radiative forcing…it’s just semantics. It acts the same as a radiative forcing, so why not call it that? The alternative is too antropocentric for me.

      I think it is a red herring to argue over mixed layer depths because the depth of mixing is a function of time scale, and it is not uniform within the layer being mixed anyway.

      I really do not trust the solar cycle-based estimates of climate sensitivity anyway. Seeing a temperature effect resulting from such a small variation in TSI seems to argue for some indirect solar effect, which would then reduce the inferred climate sensitivity. I’m not a huge fan of the Svensmark mechanism, but I guess that’s what I’m advocating.

      • …oh, I think I misinterpreted your second question, Dan. I WOULDN’T expect anthropogenic forcings to reproduce sub-decadal temperature variability. But if a known mode of natural climate variability can be shown to exert a radiative forcing of the climate system, then surely we must consider the possibility that the 30/60 year cycle in that natural mode (the PDO) might cause centennial time scale climate changes?

        If as much money and effort had gone into investigating what I am talking about, as has been put into aerosol research, don’t you think there would be multiple investigators with various ~1 Watt estimates of forcing due to natural cloud changes on climate time scales? Researchers tend to find what they are paid to find.

        • Anonymous says:

          Hi Roy,

          Re: aerosol forcing. You think the net aerosol forcing is zero- can you please cite a study, any study, that supports that? Murphy et al. 2009 (JGR, “An observationally based energy balance for the earth since 1950”) derive the aerosol forcing as a *residual*, consistently negative for the last forty years, *unlike* the PDO which has had positive and negative phases over that time. So if natural variability of cloud forcing has a large role in explaining the recent warming it’s *not* associated with the PDO. Please do read it- I’d be interested in your comments on it. (Lohmann et al., 2010, “Total aerosol effect: radiative forcing or radiative flux perturbation”, Atmos. Chem. Phys., is interesting as well).

          Re: solar forcing. The observed variability is exactly what you’d expect from a mid-range climate sensitivity. Yes the TSI variation is small, but the temperature response is pretty small too. And yet its clearly detectable. So if I’m not misunderstanding you, you are ruling out a climate sensitivity of 2-3°C *a priori*, even though it gives the best fit to the data *you examined*. Can you please explain why?

          By the way, have you looked at the climateprediction.net experiments? They looked at many parameter combinations that result in low climate sensitivity models. But those parameter settings tend not to give a good fit to observed climate. Have you read Knight et al., PNAS, 2007?

          Cheers,
          Dan

  2. Andrew says:

    Is the feedback parameter from the “best fit” with PDO, the same as that removed from the fluxes to get the PDO “forcing”? This would seem important for consistency.

    From what I can tell, it’s looking increasingly like the warming impact of aerosols has been underestimated and the cooling effect overestimated. That’s clearly a recipe for the models needing lower sensitivity to fit the observational record.

  3. No, it appears that feedbacks are time-scale dependent. The only CLEAR evidence we see of feedbacks can only be seen in response to short time scale, non-radiative forcing events, which runs around 6 W m-2 K-1…strong negative feedback.

    But from everything I’ve see from analyzing the output from most of the IPCC models is that their short term feedbacks are more negative than their diagnosed long-term feedbacks from transient CO2 runs.

  4. lacavin says:

    That’s very interesting, thank you (and for all the other interesting articles as well).

    I have something I am wondering here – let me summarize what I understood:

    The PDO-index is calculated based on temperature measurements.
    The simulation of temperature uses those PDO as input.
    Therefore the simulation show the same behavior than the temperature measurements… because it is based on temperature measurements.

    That seems circular…

    Could you please explain what I did not understand?

    Thanks for you help.

    • The PDO is a geographic re-arrangement of sea surface temperature patterns in the North Pacific, not a measurement of temperature. Besides, PDO changes precede temperature changes, which is true of all forcings…this is evidence that the PDO indeed involves a radiative forcing of the climate system.

  5. Andrew says:

    lacavin-The PDO does originate from temperature measurements of the North Pacific. However, the creators of the index claim to explicitly remove any “global warming” effect by removing the global temperature signal. They say

    “Updated standardized values for the PDO index, derived as the
    leading PC of monthly SST anomalies in the North Pacific Ocean,
    poleward of 20N. The monthly mean global average SST anomalies
    are removed to separate this pattern of variability from any
    “global warming” signal that may be present in the data.”

    So theoretically this should be independent of the GMST, as a residual regional signal.

    In order to make the argument that the PDO is not an independent and therefore valid statistical predictor of GMST, you’d need to show that the attempt to remove a global signal from the index has failed. I’m not saying that the removal has necessarily been successful, but if it has, your objection would be wrong, and if it hasn’t your objection would be right.

    • Anonymous says:

      Thanks for your answer, Andrew.

      I respectfully do not agree (but I am sorry if I am wrong – newbie speaking here), because the upward trend is coming from all the other forcings (see CASES #1 and #2). Adding PDO improve the fit for the variations around this trend – which is exactly what a warming-cleaned temperature indicator would do.

      Dear Roy,

      Thanks for your answer. Do I understand it correctly in saying that actually PDO is therefore not guarenteed to follow AVERAGE temperature like the GISS is representing, because it is based on localizations.
      i.e. for the same average temperature, the PDO Index may be high or low depending on WHERE it is hot and where it is warm?
      If I got that right, then I understand why it is interesting to use it as predictor.

      Thanks again for your explanations.

  6. joni says:

    Sir, I am just wondering why it now seems that you are using phrases like “at least partly explain global average temperature variations, including warming, during the 20th Century”. A few years ago you seemed to have been using much more definitive language.

    I am not sure if you know, but the journalist Andrew Bolt has been using your data for the past few years to state that the earth is not warming.

    On the 21st October he quotes you as saying “evidence presented here suggests that most of that warming might well have been caused by cloud changes associated with a natural mode of climate variability: the Pacific Decadal Oscillation”.

    Now that the earth is warming again, does that mean that you are now backtracking on the “most of that warming” being down to the PCD theory, which is why you are now saying that it is “partly” to blame?

    I am not questioning your science, just wondering on the apparent change in language.

    Also, why have the averages been removed from the Daily Earth Temperatures website?

  7. PaulD says:

    I am a layman who follows the “climate crisis” debate closely, but I don’t fully understand all the technical detail of climate modeling. I do have several questions that are relevant to your discussion here that you may be able to answer, along with a comment.
    1) I believe that it is well-established that the PDO is one of the natural and significant elements of climate variation. Am I correct that no one seriously disputes this assertion?
    2) From my understanding, the IPCC’s climate models do not accurately replicate the historical PDO. Is this true?
    3) If this is true, how, if at all, do the historical runs of the IPCC’s climate models incorporate the PDO? Is it ignored? Is it viewed as too insignificant to affect the overall estimates of the climate models? Is it entered as an input?
    My comment is that I have recently learned of some “surprising” empirical studies that suggest that the warming affects of Black Carbon Soot may have been seriously underestimated in the most recent IPCC. See e.g. http://www.probeinternational.org/UPennCross.pdf page 63 ; http://www.paragonclimateresearch.org/files/ClimateReportJune2008.pdf . As a layman, I don’t have the background the evaluate the validity of this research, but I point it out as what may be yet another unresolved issue that gives reason to suspect that the IPCC climate models may have overestimated climate sensitivity to CO2 by failing to fully account for other relevant variables.

  8. Andrew says:

    Off topic, But Roy, could you offer any comment on a couple of papers which have recently appear directly challenging you work? DM Murphy and PM Forster have just gotten a paper in JoC:

    “On the accuracy of deriving climate feedback parameters from correlations between surface temperature and outgoing radiation”

    Claiming that your demonstration of bias in the estimation of feedback from failure to account causation going the other way, exaggerated the degree to which this presents a problem, claiming that the error in diagnosed feedback is much lower than you found. Lin et al:

    “Can climate sensitivity be estimated from short-term relationships of top-of-atmosphere net radiation and surface temperature?”

    Argue that the “memory” of the system, and varying timescales of feedback, mean that the short term variations absolutely cannot be used to get the feedback relevant to the long term.

    Comments? Have you been offer the opportunity to reply to these papers?

  9. toby says:

    lacavin’s point is well made. Here is a simple illustration.

    Suppose I have a variable y and substract variable x to get w = y-x.

    If I then regress x on w, I will get a spurious signal
    x=b-ax,
    with b~mean(y) and a~1.

    y is the PDO temp, x is the global temp. The regression model needs further checking.

  10. Bob Tisdale says:

    Roy: Question 1, through what mechanism does the PDO alter global cloud cover? Keep in mind that the PDO does not represent SST anomalies of the North Pacific, north of 20N.

    Question 2, according to Zhang et al (the paper that first presented the method used to calculate the PDO), the PDO lags ENSO by a few months, and according to Newman et al, the PDO is dependent on ENSO on all time scales. With that in mind, how do you isolate the changes in global cloud cover caused by the PDO (from question 1) from the known global responses to ENSO?

  11. Bob Tisdale says:

    Andrew: You wrote, “So theoretically this should be independent of the GMST, as a residual regional signal.”

    Incorrect. The PDO does not represent the residual of the North Pacific SST anomalies (north of 20N) minus global temperature anomalies:
    http://i42.tinypic.com/345kgsk.jpg

    Refer to for the detailed description of how the PDO is calculated here:
    http://bobtisdale.blogspot.com/2009/04/misunderstandings-about-pdo-revised.html

  12. Stephen Wilde says:

    “Bob Tisdale says:
    June 20, 2010 at 5:27 PM
    Roy: Question 1, through what mechanism does the PDO alter global cloud cover? Keep in mind that the PDO does not represent SST anomalies of the North Pacific, north of 20N”

    The PDO would operate via ENSO and the lagged effects of ENSO on other ocean basins. PDO is merely a statistical artifact of ENSO but nonetheless mirrors the changing relative intensities of El Nino and La Nina over multidecadal periods of time

    As the warmer water surfaces develop they push the jets and the ITCZ with their associated cloud banks poleward.

    As they do so the angle of incidence of solar energy onto the clouds reduces so that Earth’s albedo declines and more solar shortwave enters the oceans in the lower latitudes.

    The opposite occurs when the surface waters become cooler.

  13. Bob Tisdale says:

    Stephen Wilde: You replied, “PDO is merely a statistical artifact of ENSO but nonetheless mirrors the changing relative intensities of El Nino and La Nina over multidecadal periods of time.”

    Not completely correct. The difference between the PDO and ENSO (i.e. PDO minus standardized NINO3.4 SST anomalies) appears to reflect the additional impacts of the variability of Sea Level Pressure on the North Pacific, (i.e. the NPI). It is also likely that volcanic aerosols have an effect on the PDO, since SST in the Kuroshio Extension can linger well past the cause of perturbation.

    You replied, “The PDO would operate via ENSO and the lagged effects of ENSO on other ocean basins.”

    If the “PDO is merely a statistical artifact of ENSO”, as you later wrote, then the PDO is not operating via ENSO. It is ENSO that is causing the variations in cloud cover, not the PDO.

    You wrote, “As they do so the angle of incidence of solar energy onto the clouds reduces so that Earth’s albedo declines and more solar shortwave enters the oceans in the lower latitudes.”

    “…the angle of incidence of solar energy onto the clouds…”???? “…the angle of incidence…”????

    During a La Niña event, the trade winds strengthen and the total cloud amount drops over the tropical Pacific (east of the Pacific Warm Pool), allowing more downward shortwave radiation (visible sunlight) to warm the tropical Pacific. During an El Niño event, convection and cloud cover accompany the warm water as travels to the east. The reduction in cloud amount over the Pacific Warm Pool allows more downward shortwave radiation to warm the oceans there, providing additional fuel for the El Niño and keeping the OHC of the PWP from dropping further.

    • Anonymous says:

      Bob,

      “…the angle of incidence of solar energy onto the clouds…”???? “…the angle of incidence…”????

      Clouds nearer the poles will reflect less energy back into space than the same clouds situated nearer the equator.

      I’m looking at the global energy balance and it’s effect on the global air circulation systems. The way those changes translate into localised events in the Pacific is a seperate issue and I accept your descriptions of those.

  14. Roy, I’m really pleased to see you have gone back to using a deeper ocean layer for your simple model. Did you see my comment here?
    http://www.drroyspencer.com/2010/06/low-climate-sensitivity-estimated-from-the-11-year-cycle-in-total-solar-irradiance/#comment-270

    The 1993-2003 decade was exceptional, but a 0.3C rise in suface temp and a reasonably linear dropoff to the thermocline would indicate that an average 0.15C rise in the temp of the top 1000m is consistent with the total energy absorbed to cause the amount of thermal expansion indicated by the steric component of sea level rise in that decade.

    Incidentally, the amount of energy required is well in excess of the rise recorded for that decade by Levitus et al 2009. It is consistent with Levitus et al 2000 however, and it is my belief the figures have been downplayed to bring the forcing into line with that claimed for co2 at around 1.7W/m^2

    The true figure of the additional forcing on the ocean surface for that decade is more like 4W/m^2 according to my calcs (verified by Leif Svalgaard). This is far more than co2 is capable of and must be due to lowered cloud cover and high solar activity in my opinion. Nir Shaviv’s work on ‘using the oceans as a calorimeter’ is also consistent with my calcs. He also fingers the cloud variation as the amplifying factor on solar variation. The ISCCP results empirically corroborate it too.

    Great work! keep it up.

  15. Stephen Wilde says:

    Whoops, forgot to disclose my identity in the preceding post.

  16. Bob Tisdale says:

    Stephen Wilde: In response to my questioning your use of the phrase, “…the angle of incidence of solar energy onto the clouds…”, you replied as Anonymous, “Clouds nearer the poles will reflect less energy back into space than the same clouds situated nearer the equator.”

    You missed the reason for my questioning your use of the term, Stephen. If the ITCZ has moved northward (as you constantly claim), this means the total cloud amount over the equatorial oceans has decreased. If there is less cloud cover over the equatorial oceans, there will be more downward shortwave radiation warming them. Think of it as the aperture of a camera, Stephen. A lower f-stop number will open the aperture and admit more light onto the camera sensors. Lower total cloud amount over the tropics allows more sunlight to warm the oceans. Why complicate a discussion with phrases like “…the angle of incidence of solar energy onto the clouds…” when they are seasonally dependent and beyond your means to calculate and document?

    • Anonymous says:

      Bob,

      The clouds are not exclusively seasonally dependent. They shift latitudinally beyond normal seasonal variation. During the LIA the ITCZ and the jets were all nearer the equator than now. During the late 20th century they were all nearer the poles than now.

      Simple observation is all that is required to notice that but the full significance has never been appreciated and no adequate measurements have ever been recorded.

      As for the effect it seems that you agree with me. Poleward movement of the cloud bands increases shortwave solar energy into the oceans and equatorward movement reduces it. Within the equatorial regions themselves there will be irregularities from region to region such as you correctly describe but the net global energy budget is as I say (and as you say)namely more net warming of the oceans the more poleward the clouds go (reduced albedo) and more net cooling of the oceans the further equatorward (increased albedo)the clouds go.

      It is the changing angle of incidence of solar energy onto the clouds that alters the albedo and thus the net energy flow into the oceans.

  17. Bob Tisdale says:

    Stephen Wilde: You wrote, “The clouds are not exclusively seasonally dependent.”

    I did not write or imply that they were.

    You wrote, “As for the effect it seems that you agree with me.”

    An unfounded assumption on your part. I was simply discussing a better way to conceptualize what you’re proposing.

    You continued, “Poleward movement of the cloud bands increases shortwave solar energy into the oceans and equatorward movement reduces it.”

    Also an assumption on your part. How many degrees latitude does it vary, Stephen, and during what season? Does the ITCZ total cloud amount decrease or increase in area as it migrates northward or southward? What is the variation in DSR (in Watts/m^2) at the surface caused by the migration of the ITCZ?

    You repeated, “It is the changing angle of incidence of solar energy onto the clouds that alters the albedo and thus the net energy flow into the oceans.”

    Incorrect. If (BIG IF) there is less cloud cover in the tropics as you propose, it is the increase in ocean surface area that is receiving more DSR that causes the net increase in energy to the tropical oceans. Again, refer to my aperture discussion above.

    • Anonymous says:

      “it is the increase in ocean surface area that is receiving more DSR that causes the net increase in energy to the tropical oceans.”

      Of course it is. However the increased ocean surface area available for heating is only there because the clouds moved more poleward simultaneously reducing global albedo. And I’m considering ALL the global oceans so the mid latitude jets are included in my proposition with perhaps more effect than just the ITCZ.

      I don’t think we need to postulate any significant change in the size of the cloud bands when they shift latitudinally beyond normal seasonal variability. Nor do we need to establish precise degrees of latitude, indeed we cannot as yet. Likewise the precise change in DSR is not yet available.

      However we do have some surprising numbers in relation to albedo changes and those changes correlate with those latitudinal shifts.

      Remember this ?

      http://wattsupwiththat.com/2007/10/17/earths-albedo-tells-a-interesting-story/

      The rising albedo trend dates back to the late 90?s when the jets started moving back equatorward again though I first noticed in 2000.

      As all those clouds move towards the equator their reflectivity increases, albedo rises, less solar shortwave enters the oceans

      The area where we do disagree is that I think you see the Trade Winds change first, then the cloud changes, then ocean surface temperatures and you don’t yet accept any seperate causation for the initial Trade Wind changes.

      I take a step further and attribute those Trade Wind changes to shifts in the global air circulation systems both in intensity and latitudinal positioning.

      By doing that I am able to fit the Enso phenomenon into a much longer term global scenario covering the apparent 30/60 year cyclical changes generally referred to as the PDO (I know you disagree with that nomenclature because the PDO is in your words a statistical artifact derived from Enso data but for good or ill the term PDO is in general use in the way I mean) and the changes from Mediaeval Warm Period through the LIA to date.

  18. Stephen Wilde says:

    I am discussing all the oceans not just the tropics but observations in the tropics fit perfectly well.

    Remember this ?

    http://wattsupwiththat.com/2007/10/17/earths-albedo-tells-a-interesting-story/

    The rising albedo trend dates back to the late 90?s when the jets started moving back equatorward again though I first noticed in 2000.

    As all those clouds move towards the equator their reflectivity increases, albedo rises, less solar shortwave enters the oceans

  19. Stephen Wilde says:

    Well if I’m right solar variability affects both the level of cosmic rays and the size and intensity of the polar oscillations simultaneously.

    We see more cosmic rays AND a cooling troposphere AND increasing ozone AND more negative oscillations AND equatorward shifting jets AND a warming stratosphere AND increasing albedo when the sun is quiet.

    We see less cosmic rays AND a warming troposphere AND decreasing ozone AND more positive oscillations AND poleward shifting jets AND a cooling stratosphere AND decreasing albedo when the sun is active.

    Just too many ‘coincidences’ in that all those observed changes from one regime to the other began during the late 90s and are currently intensifying.

    If just one of those phenomena goes substantially (not just slightly) out of line then my propositions may be falsified but unless that happens I’m on a roll.

    The oceanic oscillations nonetheless operate independently in the background and can either resist or supplement the effects from above as regards the jetstream and ITCZ positioning.

    So to simply say that more cosmic rays causes the negative oscillations is a bit of a stretch but it is one possibility provided it can be shown that it is the cosmic ray effect that influences the temperature of the stratosphere.

    Personally I think it more likely to be an effect of the solar wind with the matter of cosmic rays just a side effect.

    Svensmark’s ideas rely on cosmic rays causing cloudiness changes in the troposphere but that doesn’t fit the bill because we need something that affects the intensity of the polar oscillations in order to push the jets and the ITCZ around thereby affecting global albedo.

  20. Bob Tisdale says:

    Stephen Wilde: You replied, “By doing that I am able to fit the Enso phenomenon into a much longer term global scenario covering the apparent 30/60 year cyclical changes generally referred to as the PDO…”

    In reality you show and “fit” nothing because you won’t use data. You speculate, nothing more.

    Also, the multidecadal low frequency component of ENSO has been known for decades and it has NOT been known as the Pacific Decadal Oscillation.
    http://i43.tinypic.com/33agh3c.jpg

    You wrote, “…the term PDO is in general use in the way I mean.”

    And it’s confusing when used that way, especially when you do not qualify it. Many papers refer to the basin-wide phenomenon as Pacific Decadal Variability (PDV) so not to confuse it with the PDO.

    You wrote, “However the increased ocean surface area available for heating is only there because the clouds moved more poleward simultaneously reducing global albedo.”

    The “simultaneously reducing global albedo” is another assumption on your part.

    You replied, “And I’m considering ALL the global oceans so the mid latitude jets are included in my proposition with perhaps more effect than just the ITCZ.”

    Show me the data, Stephen. You speculate without relying on data.

    You replied, “The rising albedo trend dates back to the late 90?s when the jets started moving back equatorward again though I first noticed in 2000.”

    Again, show the data, Stephen. That fact that you noticed something proves nothing.

    You wrote, “I don’t think we need to postulate any significant change in the size of the cloud bands when they shift latitudinally beyond normal seasonal variability.”

    If you want your hypotheses to be taken seriously, you need to document all, Stephen.

    You replied, “Likewise the precise change in DSR is not yet available.”

    The NCEP/DOE Reanalysis-2 Surface Downward Shortwave Radiation Flux (dswrfsfc) dataset is reasonable in my view, Stephen. I’ve used it in a number of posts. I think you’d be surprised with what they present for the variations in global surface DSR over the past three decades. It’s available through the KNMI Climate Explorer as a linked External dataset.

    You wrote, “The area where we do disagree is that I think you see the Trade Winds change first, then the cloud changes, then ocean surface temperatures and you don’t yet accept any seperate causation for the initial Trade Wind changes.”

    Wrong. I do accept that there is a separate cause for the changes in the trade winds, Stephen. When did I ever write that there wasn’t? I just don’t waste time trying to speculate about what caused the trade winds to shift.

    Also, the order in which you present is a bit skewed, Stephen. The warm water in the Pacific Warm Pool shifts to the east along the equatorial Pacific in response to the lessening and reversal of the trade winds. The eastward shift in convection and cloud cover are responses to the change in location of the warm water. Also, when you can illustrate (with data) the initiator of the change in the trade winds for each ENSO event, I might find your speculations credible. The initiators can and do vary per ENSO event, FYI.

    You wrote, “If just one of those phenomena goes substantially (not just slightly) out of line then my propositions may be falsified but unless that happens I’m on a roll.”

    Since you provide no documentation and write in generalities, your speculations can’t be falsified. You know that. I know that. And when data proves you wrong, you have been known to shift your presentation to different timescales.

    You wrote in an earlier comment, “Simple observation is all that is required to notice that but the full significance has never been appreciated.”

    Maybe the effects of the shift of the ITCZ have been studied and have been found to have no significance in the ways you assume. Have you checked? I know the Atlantic ITCZ shifts in response to ENSO events have been studied, Stephen, and those impacts have been documented. I don’t recall whether they confirm or disprove your speculations, though.

    Hmm. Did you notice that you haven’t used “angle of incidence” in your past three comments?

Leave a Reply