I’m getting more and more questions about the daily global temperature updates we provide at the NASA Discover website. I suppose this is because 2010 is still in the running to beat 1998 as the warmest year in our satellite data record (since 1979).
But also we have made a couple of significant changes recently, and there continue to be some misunderstandings of the data that are posted there.
The bottom line is this: You can rely ONLY upon two channels at the Discover “Temperature Trends” page:
(1) the “Aqua ch.5 v2” channel for global-average mid-tropospheric temperatures, from the AMSU on NASA’s Aqua satellite, and
(2) the “Sea Surface” temperatures, which are averaged over the global ice-free oceans (60N to 60S), from the AMSR-E instrument on Aqua.
Do not trust any of the other channels for temperature trend monitoring. This is because, while the Aqua satellite equatorial crossing time is kept very near 1:30 am and pm with periodic orbit maneuvers, the rest of the channels come from the NOAA-15 satellite whose equatorial crossing time has now drifted from its original 7:30 am/pm value in late 1998 to about 4:30 am/pm now.
This orbital drift makes the NOAA-15 channels (4 and 6) unusually warm, and is why those of you who have been monitoring channel 4 and 6 at the Discover site are seeing such warm temperatures.
Tropospheric Temperature Monitoring
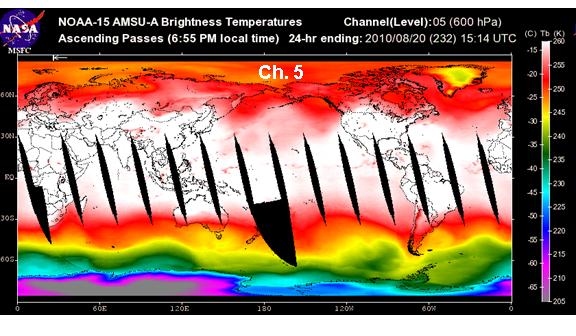
The following AMSU channel 5 image comes from the Discover “Recent Global Temperatures” page, and illustrates the kinds of signals present in this channel used in the construction of our UAH MT (mid-tropospheric) and LT (lower tropospheric) temperature products:

Note that even though NOAA-15 should not be used for trend monitoring, all of our global imagery at the “Recent Global Temperatures” page come from that satellite since the spatial patterns are not substantially affected by diurnal drift of the satellite orbit. If you scan through the global images for channels 1, 2, 3, 4, and 5 at the web site you will see how the surface and oceanic cloud water signatures change as you progress from the window channels (1, 2), to those channels more sensitive to oxygen emission at higher altitudes (3, 4, 5, etc.)
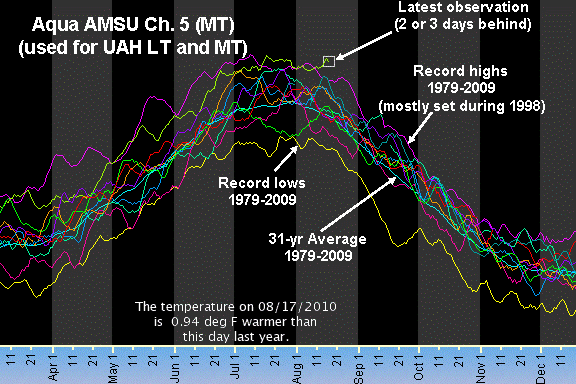
The next image is a screenshot of the Aqua AMSU ch.5 portion of our “Temperature Trends” page. In order to plot daily values that can be compared to previous years before the Aqua satellite was launched, we have intercalibrated the Aqua ch. 5 average annual cycle in daily global-average temperatures to the official UAH MT product during their overlap period (June 2002 through December 2009). This also allows us to compute curves for daily maximum, minimum, and 1979-1999 daily averages:

Most of the daily record high temperatures were set in 1998. As can be seen, 2010 has also been quite warm. For those who are wondering, the main reason why 1998 was warmer in the satellite record than the surface thermometer record is due to strong warming of the troposphere over the tropical east Pacific during the El Nino conditions in early 1998. These regions are not well represented in the surface thermometer data.
Sea Surface Temperature Monitoring
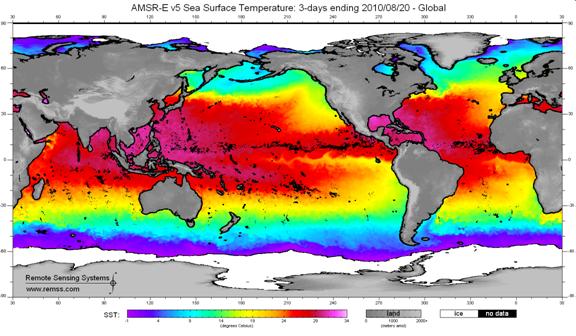
The following SST image comes from the Remote Sensing Systems website. It is based upon the most recent 3 days of SST retrievals from the AMSR-E instrument on Aqua. These measurements are made through most cloud conditions; areas of precipitation contamination are blacked out.

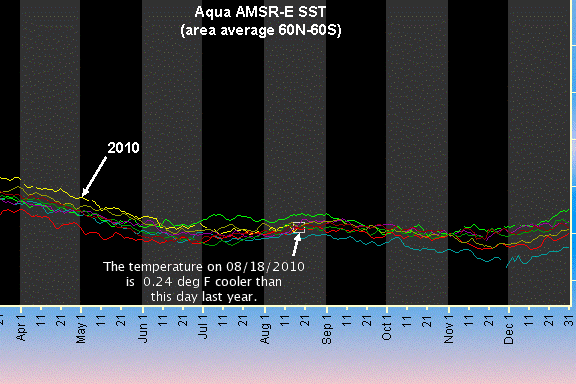
Because of AMSR-E’s through-cloud sensing, it provides a more accurate global average SSTs on short time scales compared to the traditional infrared measurements. We download the binary gridded SST data from the RSS website once a day and compute global area averages, which are labeled “Sea Surface” in the channel list on the Discover Temperature Trends page:

(Processing of the data is not trivial, and requires some programming skills.)
Since the AMSR-E data are available only since mid-2002, our SST record only extends back that far. There are no Max, Min, or Avg traces provided for this web page.
Why the Tropospheric Temperature Variations Don’t Match the Sea Surface Temperature Variations
Many people have noticed that the up- and down-ticks in these two temperature measures (troposphere versus sea surface) often diverge from each other. This is partly because the tropospheric temperatures include global land areas, whereas the SST data are (obviously) only over the ice-free oceans, approximately between 60N and 60S latitudes.
But another reason they diverge is because there are slight variations in the heat loss by the ocean to the atmosphere. These “intraseasonal oscillations” are usually in the tropics, and are only about +/- 1% variations in the average heat flux from the ocean to the atmosphere. Nevertheless, they can cause substantial temperature swings, especially in the troposphere.
This is why they produce opposing temperature signals. When there is above-normal ocean heat loss, the ocean surface cools below normal. Most of that heat loss is through evaporation. Meanwhile, the extra moisture in the atmosphere leads to above-normal rainfall, and so causes excess latent heating of the troposphere. The result is that SST cooling is accompanied by tropospheric warming, while SST warming is accompanied by tropospheric cooling.
These events occur on time scales of around 1 month, and so there is usually no long-term climate change significance to them. These high-frequency signals are always riding upon a more slowly varying background of temperature variability, which I believe are mostly caused by natural variations in cloud cover changing the solar energy input into the ocean.
 |

 Home/Blog


