I’m getting more and more questions about the daily global temperature updates we provide at the NASA Discover website. I suppose this is because 2010 is still in the running to beat 1998 as the warmest year in our satellite data record (since 1979).
But also we have made a couple of significant changes recently, and there continue to be some misunderstandings of the data that are posted there.
The bottom line is this: You can rely ONLY upon two channels at the Discover “Temperature Trends” page:
(1) the “Aqua ch.5 v2” channel for global-average mid-tropospheric temperatures, from the AMSU on NASA’s Aqua satellite, and
(2) the “Sea Surface” temperatures, which are averaged over the global ice-free oceans (60N to 60S), from the AMSR-E instrument on Aqua.
Do not trust any of the other channels for temperature trend monitoring. This is because, while the Aqua satellite equatorial crossing time is kept very near 1:30 am and pm with periodic orbit maneuvers, the rest of the channels come from the NOAA-15 satellite whose equatorial crossing time has now drifted from its original 7:30 am/pm value in late 1998 to about 4:30 am/pm now.
This orbital drift makes the NOAA-15 channels (4 and 6) unusually warm, and is why those of you who have been monitoring channel 4 and 6 at the Discover site are seeing such warm temperatures.
Tropospheric Temperature Monitoring
The following AMSU channel 5 image comes from the Discover “Recent Global Temperatures” page, and illustrates the kinds of signals present in this channel used in the construction of our UAH MT (mid-tropospheric) and LT (lower tropospheric) temperature products:
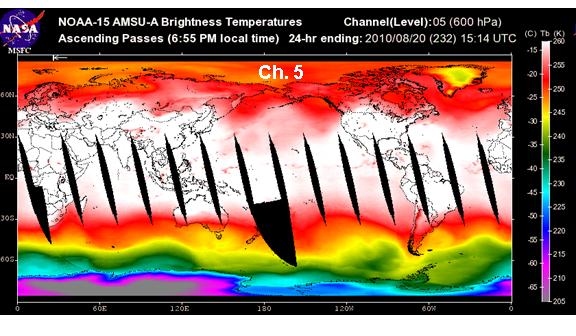
Note that even though NOAA-15 should not be used for trend monitoring, all of our global imagery at the “Recent Global Temperatures” page come from that satellite since the spatial patterns are not substantially affected by diurnal drift of the satellite orbit. If you scan through the global images for channels 1, 2, 3, 4, and 5 at the web site you will see how the surface and oceanic cloud water signatures change as you progress from the window channels (1, 2), to those channels more sensitive to oxygen emission at higher altitudes (3, 4, 5, etc.)
The next image is a screenshot of the Aqua AMSU ch.5 portion of our “Temperature Trends” page. In order to plot daily values that can be compared to previous years before the Aqua satellite was launched, we have intercalibrated the Aqua ch. 5 average annual cycle in daily global-average temperatures to the official UAH MT product during their overlap period (June 2002 through December 2009). This also allows us to compute curves for daily maximum, minimum, and 1979-1999 daily averages:
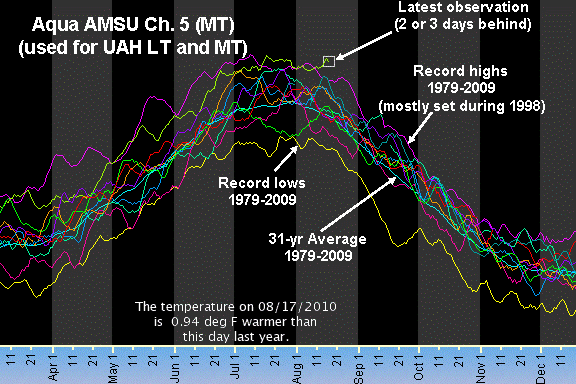
Most of the daily record high temperatures were set in 1998. As can be seen, 2010 has also been quite warm. For those who are wondering, the main reason why 1998 was warmer in the satellite record than the surface thermometer record is due to strong warming of the troposphere over the tropical east Pacific during the El Nino conditions in early 1998. These regions are not well represented in the surface thermometer data.
Sea Surface Temperature Monitoring
The following SST image comes from the Remote Sensing Systems website. It is based upon the most recent 3 days of SST retrievals from the AMSR-E instrument on Aqua. These measurements are made through most cloud conditions; areas of precipitation contamination are blacked out.
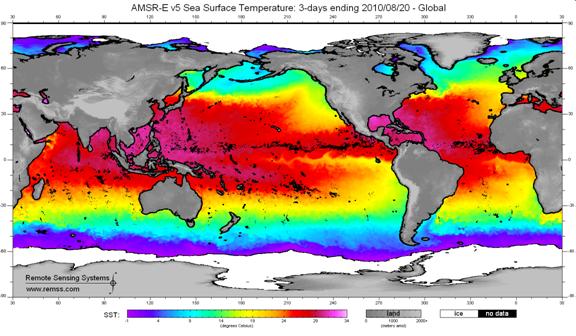
Because of AMSR-E’s through-cloud sensing, it provides a more accurate global average SSTs on short time scales compared to the traditional infrared measurements. We download the binary gridded SST data from the RSS website once a day and compute global area averages, which are labeled “Sea Surface” in the channel list on the Discover Temperature Trends page:
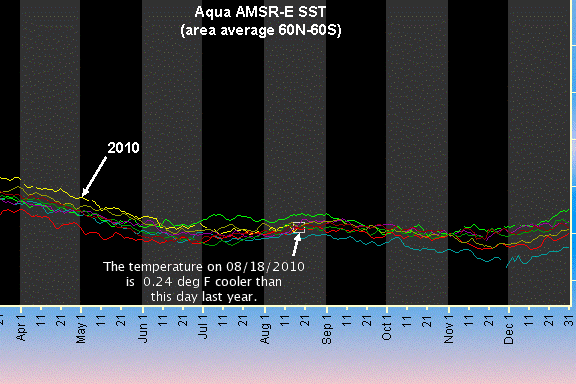
(Processing of the data is not trivial, and requires some programming skills.)
Since the AMSR-E data are available only since mid-2002, our SST record only extends back that far. There are no Max, Min, or Avg traces provided for this web page.
Why the Tropospheric Temperature Variations Don’t Match the Sea Surface Temperature Variations
Many people have noticed that the up- and down-ticks in these two temperature measures (troposphere versus sea surface) often diverge from each other. This is partly because the tropospheric temperatures include global land areas, whereas the SST data are (obviously) only over the ice-free oceans, approximately between 60N and 60S latitudes.
But another reason they diverge is because there are slight variations in the heat loss by the ocean to the atmosphere. These “intraseasonal oscillations” are usually in the tropics, and are only about +/- 1% variations in the average heat flux from the ocean to the atmosphere. Nevertheless, they can cause substantial temperature swings, especially in the troposphere.
This is why they produce opposing temperature signals. When there is above-normal ocean heat loss, the ocean surface cools below normal. Most of that heat loss is through evaporation. Meanwhile, the extra moisture in the atmosphere leads to above-normal rainfall, and so causes excess latent heating of the troposphere. The result is that SST cooling is accompanied by tropospheric warming, while SST warming is accompanied by tropospheric cooling.
These events occur on time scales of around 1 month, and so there is usually no long-term climate change significance to them. These high-frequency signals are always riding upon a more slowly varying background of temperature variability, which I believe are mostly caused by natural variations in cloud cover changing the solar energy input into the ocean.
![]() |
Do the recent discovered problems with the NOAA-16 satelite affect these records?
No. Different instrument, different satellite.
Roy, I’m really confused by your post. I see mumbo jumbo here. Can you simplify the Post? Also, can you put some “error bars” around the satellite data, so we have some idea about just how much confidence we can have in this stuff?
JAE comments above:
‘I’m really confused [-]. I see mumbo jumbo here. Can you simplify the Post?’
I assume (hope) that by ‘mumbo jumbo’ you mean technical language – as opposed to ‘made-up nonsense’?
The information is clear enough, just ignore the technical detail:
Changes in the orbit of a satellite can have significant effects on the accuracy of measurements that it makes.
The interactive graph page at the NASA Discover website lets you choose from feeds from TWO different satellites – NASA Aqua and NOAA-15.
ONLY THE NASA AQUA SATELLITE CHANNELS SHOULD BE USED.
There are two: ‘AQUA channel 5 version 2’ and ‘Sea Surface’. Ignore the rest.
Aqua is kept on a stable orbit by firing tiny jets from time to time. It passes over the equator at the same time of day (and night). So it ‘sees’ the atmosphere and ocean surface under the same conditions on each pass.
This means you can make like-for-like comparisons with older measurements. By doing so, you can estimate changing trends in temperature.
The NOAA-15 satellite has no on-board jets and so its orbit has drifted since 1998. It ‘sees’ the atmosphere at a different time of day now than it once did.
This changed orbit means you cannot make like-for-like comparisons with older measurements and cannot use any of the other channels for calculating trends in temperature over time.
Hope this helps,
Dominic
[Dr Spencer, if I’ve botched this, please accept my apologies and delete the whole post. I appreciate that trying to be helpful can backfire… D]
Hi Ray,
good basic instrumentation stuff so to say, supported also by other evidence. Just copying the core post I made couple days ago to Sea Ice News, same set might give some perspectives also to this. As you say, high SST means lower formation of latent heat, as energy is not leaving sea area.
In sea Ice news:
“As seen below, the symmetry between the North and South Pole is impressive through the satellite record. They always seem to move opposite each other and produce an approximately constant amount of sea ice. It would be nice if the experts focused on solving this relationship rather than making up forced explanations like the “Ozone Hole” – which has just started forming for the year and will be gone before Christmas.”
And my comment:
-> so it obviously shows, that sun exposure to Earth is quite stable in given period and thus humidity formation and further ice formation. But the heat exhaust distribution thru Poles fluctuates. So sometimes either of dominates the process, like SP now. This is possible because the heat flow is somewhat quantized, so depending on summer-winter conditions at that moment that the heat/humidity/latent heat decides to travel, the direction is kind of randomly selected (or not??).
-> now it looks also more clear how this influences us. we have been living extreame summer here subpolar areas, like record number of above 25 C days and also monthly alltime high temperatures. Russian are still suffering forest fires, this is because Gulf stream does not pump humidity thru heat normally, but both have travelled to SP. Normal Atlantic south-west mixing humid wind pattern is missing because of lacking driving force and continental lower latitudes mid-east summer is spreading even to Scandinavia. This is interesting, because this missing Altantic flow was already visible during winter 2009/2010 in Northern Atlantic temperature patterns, but I was not able interpret it correctly at all, but knew that some change will take place. I was more expecting just opposite what actually happened. But as Russian stated, they really saw once every 1000 years summer there. So not an easy point to understand.
-> so just for curiosity, please check Joensuu (holds now Finnish record temperature of 37,2 on 62,7 N, can you imagine!!!) Jul-2010 for the jump in GISS:
http://data.giss.nasa.gov/work/gistemp/STATIONS//tmp.614029290001.1.1/station.txt
But please also notice that in Finland last winter we also got some record number of continuous below zero periods in days, so winter was quite cold. Also that’s visible in JFM data.
http://data.giss.nasa.gov/cgi-bin/gistemp/gistemp_station.py?id=614029290001&data_set=1&num_neighbors=1
Thank you very much! That certainly clears up a mystery of mine as to why the “near surface layer” anomaly for August 1998 was 0.52 and why it was 0.24 for August 2009, even though the graphs looked basically the same for this month for those two years. This leads to a further question. Suppose BOTH the “near surface layer” and the “Sea Surface” for a given month in consecutive years would be very close to each other. Would the anomalies for those two months then be virtually the same? Thank you!
“This is why they produce opposing temperature signals. When there is above-normal ocean heat loss, the ocean surface cools below normal. Most of that heat loss is through evaporation. Meanwhile, the extra moisture in the atmosphere leads to above-normal rainfall, and so causes excess latent heating of the troposphere. The result is that SST cooling is accompanied by tropospheric warming, while SST warming is accompanied by tropospheric cooling.”
I’m not sure that that is correctly expressed.
If there is above normal ocean heat loss then of course the ocean heat content will decline whilst the troposphere warms and vice versa. However the SSTs have to become warm first before the increased ocean heat loss can develop to cool SSTs down again.
As for latent heat that is ‘latent’ and therefore does not register on sensors does it?
It is true that the extra latent heat is contained in extra water vapour which leads to more rainfall but that is a cooling process that quickly eliminates extra energy in the form of latent heat from the troposphere.
I think a better way of expressing the concept is by using the idea of regular ‘overshoots’ as the SSTs and troposphere each gain or lose heat as they both cycle around an equilibrium point.
So, a warmer ocean surface will accelerate energy loss from the oceans such that ocean heat content declines and in due course the surface cools down again. Meanwhile that warmer ocean surface for as long as it lasts will heat the troposphere but in doing so will accelerate the hydrological cycle to vent the extra energy to space faster and in due course the troposphere cools down again. However by the time the troposphere cools down again the SSTs may have completed their cooling and be on the upswing again so one constantly gets diverging trends in ocean and air with each often trending in the opposite direction to the other.
I also observe various extra seasonal changes in the rate of ocean heat loss which complicates the situation but that is for another day.
This is a response to previous back-radiation subject. As follow-up to the sky IR readings you took I went out and bought one of the IR thermometers and took some readings from up here in Los Alamos, NM at 7,400 feet elevation. This weekend I recorded a sky temperature on the device (also set at emissivity 0.95) of 2.8 F with an air temperature reading of 72.4 F. I also decided to check the temperature of the roof of my white Honda Civic at 11 pm and the same air temperature and got a reading of 55.2 F for a depression of 17.2 F. I related in a blog reply earlier that I recalled the advice in my solar engineering class years ago that solar panels are subject to freezing at around 40 F, which I take to be a sea level number as I have seen ice on the roof of my car when local air temperatures here are well into the forties.
One interesting anomaly I did run into in my sky readings was that I first bought a higher temperature range IR thermometer that only goes down to -4 F and it kept showing L meaning it read lower than -4 F. The second device has a lower range, down to -27 F, and it reads 2.8 F. Both devices are manufactured by Cen Tech in China and the one that read lower is the more expensive unit. They both agree on temperatures of everything I have measured except the sky. I think I am going to check the temperature in my freezer next and see if they agree in the near zero range.
1998 was warmer…..satellite record than surface record due to strong warming of the troposphere over the tropical east Pacific during the El Nino conditions in early 1998. These regions are not well represented in the surface thermometer data
and insufficient data and deplected system resources are a big problem
which you believe are mostly caused by natural variations in cloud cover changing the solar energy input into the ocean, perhaps
but the superblooms of algae are indicative of ascensional
cold (und nutrient rich)oceanic currents? perhaps?
they are hydrodinamic factors at play…i s’pose
Dear Dr Spencer,
You write: “The result is that SST cooling is accompanied by tropospheric warming, while SST warming is accompanied by tropospheric cooling.” How close is this relationship? Does it as mean that one can or cannot precisely and reliably predict the tropospheric temperature from knowledge of the sea surface temperature alone, or one can or cannot precisely and reliably predict the sea surface temperature from the tropospheric temperature alone? If one can reliably and precisely predict one from the other, pray tell precisely how?
If these two quantities varied apparently independently, this would be a serious problem for the doctrine of feedback set out for example in ‘Physics of Climate’, by Peixoto and Oort, American Institute of Physics, New York, 1992, ISBN 0883187124 at section 2.5 on pages 26-31, with a lovely diagram in Figure 2.9. This doctrine is widely accepted, it seems to me. This doctrine requires that one should be able to derive all feedback quantities from one temperature alone, contrary to the above questioned possibility that at least two independent temperatures are needed to precisely describe the observed measurements.
Yours sincerely,
Christopher Game
Christopher Game thinking he is answering his own question posed in his post of 2010 Aug 24 at 2:50 AM.
I asked:
““The result is that SST cooling is accompanied by tropospheric warming, while SST warming is accompanied by tropospheric cooling.” How close is this relationship? Does it mean that one can or cannot precisely and reliably predict the tropospheric temperature from knowledge of the sea surface temperature alone, or one can or cannot precisely and reliably predict the sea surface temperature from the tropospheric temperature alone?”
As I read Table 1 of Dr Spencer and Dr Braswell’s 2010 paper, the answer to this question is that on a short time scale, of say 1 month, one cannot precisely and reliably predict the sea surface temperature from the tropospheric temperature alone, nor the other way. In word, no, one cannot.
This leads to my next comment in that post:
“If these two quantities varied apparently independently, this would be a serious problem for the doctrine of feedback set out for example in ‘Physics of Climate’, by Peixoto and Oort, American Institute of Physics, New York, 1992, ISBN 0883187124 at section 2.5 on pages 26-31, with a lovely diagram in Figure 2.9. This doctrine is widely accepted, it seems to me. This doctrine requires that one should be able to derive all feedback quantities from one temperature alone, contrary to the above questioned possibility that at least two independent temperatures are needed to precisely describe the observed measurements.”
It seems that my comment applies, and that these data, in Table 1 of Spencer and Braswell 2010, are bad news for the doctrine of feedback mentioned above, in terms of which the IPCC bases most of its arguments. These data seem to show that, to derive feedback quantities, one will need to know at least both the SST and the tropospheric temperature, contrary to the assertion of the above mentioned feedback doctrine that one of them is enough. Time for the IPCC to mend its ways, time for it to scrap the above mentioned doctrine, and go back to square one.
Christopher Game
Christopher Game said:
“If these two quantities (SST and tropospheric temperatures) varied apparently independently,”
Well I think that is exactly what does happen.
On the one hand internal ocean cycling alters the rate at which energy is released from ocean below to air above.
On the other hand solar surface variability somehow affects the energy flux to space which affects the temperature of the troposphere from above.
Furthermore the combined effect from that interplay moves the air circulation systems and the associated cloud bands latitudinally for an effect on global albedo and so an effect on the amount of solar energy that gets into the oceans.
One should be able to ascertain the background trend in tropospheric temperatures at any given moment(net warming or net cooling) from an examination of the net latitudinal position of all the air circulation systems.
Proposing independent solar and oceanic cycles sometimes offsetting and sometimes supplementing each other explains a lot of observations as I have explained elsewhere.
Christopher Game replying to Stephen Wilde’s post of 2010 Aug 24 at 9:29 AM.
Dear Stephen Wilde,
You write: “Well I think that is exactly what does happen.”
Please offer some way of proving that that is exactly what does happen. I am here not prejudging whether or not it does happen.
Also I am hoping for Dr Spencer’s opinion on this question of dependence or independence of these two variables.
To decide on dependence or independence of two variables, of course one must specify the model with respect to which the dependence or independence refers.
Yours sincerely,
Christopher Game
To Anonymous, Aug 23rd:
This is not so straight forward.
Let’s say that you are in sauna in air temperature of 90 C. You throw 20 C water on heated stones. Water evaporates immediately, but actually air temperature drops to 80 C. However water has 4000 times higher specific heat capacity, so the latent energy (heat is bit misleading) of the sauna air is much higher and skin feels it, althought the thermometer shows something else.
Christopher Game asked:
“Please offer some way of proving that that is exactly what does happen.”
I think that given the data that is currently available asking for proof is a little optimistic.
However, one has to explain observations somehow and a critical observation is that the air circulation systems move poleward and equatorward cyclically beyond normal seasonal variation over a 1000 year period such as that from the MWP to the LIA to date.
The thing is that such cycling within the troposphere must be linked to the energy flux coming out of the oceans and the energy flux flowing up into the stratosphere.
Over recent years it has become increasingly clear that the energy flux from the oceans varies a good deal but the issue of energy flux from troposphere to stratosphere is not considered.
Nonetheless we have seen that the strength of the temperature inversion at the tropopause has waxed and waned. In particular that inversion became weaker during the late 20th century warming spell when the stratosphere was observed to cool contrary to established theory and the jets moved poleward. The discrepancy was put down to human CFC and CO2 production but suppose that that assumption was wrong ?
Now with a less active sun the stratosphere is warming slightly which is again the opposite of what ‘should’ happen and it’s a bit of a stretch to blame the change in trend on human CFCs and CO2. Although CFC production has fallen CO2 emissions certainly have not.
The important point is that the polar high pressure systems can only intensify if the upward energy flux declines and that can only happen if the inversion strengthens i.e. the stratosphere warms.
Yet we see them intensify when the sun is LESS active as now. So observations suggest that conventional climatology is wrong and that for some reason the stratosphere cools naturally when the sun is more active and warms naturally when the sun is less active.
I know that is heretical but it fits the observations if one ignores the CFC and CO2 speculation.
So that gives us solar induced variability in the energy flux to space to set against the energy flux from ocean to air.
It’s not ‘proof’ as yet but a further period of observation will resolve the issue.
It fits the observations and basic physics and explains a great deal as I have pointed out elsewhere.
Christopher Game replying to Stephen Wilde’s post of 2010 Aug 24 at 2:38 PM.
Dear Stephen Wilde,
Thank you for your reply.
As I read your reply, it looks like a verbal description of the workings of an atmospheric-oceanic general circulation model (AOGCM) with a specified dynamical structure. That would mean that it would need something like an AOGCM to test it against the measured records. Complicated theories need complicated empirical tests.
My question is less ambitious. I am asking whether you have examined the temperature records numerically to check whether the time series of SST and tropospheric temperatures shows a close linkage between the two variables: how close? In particular, Dr Spencer has pointed out that on an intraseasonal time scale the two variables move oppositely; how does that compare with a longer time scale, over several years: is the relation on that longer times scale also one of opposite movement? This seems to me like a simple question to be settled by examining the time series numerically.
You did wrote: “Well I think that is exactly what does happen.” What did you mean by “exactly”?
Yours sincerely,
Christopher Game
MarkkuP said:
“and skin feels it, althought the thermometer shows something else.”
Quite so but the reason is that the skin cools more slowly if the air is more humid. The latent heat remains hidden from thermometers. Does it also remain hidden from satellite sensors ?
Dear Christopher,
Good questions but the relevant data is sparse in detail because it is only recently that significant variability in SSTs has come to be acknowledged. First it was noted in the Pacific and now in all the other oceans.
Nonetheless one can see from basic physical principles that the energy content of water is so large as compared to the energy content of air that the water will always dominate. A hot bath heats the air in a bathroom very effectively. It is surprising that the air temperatures do not follow SSTs much more obviously over short time scales but I think part of the reason for that must be that the SSTs globally are rarely synchronised and the net global SSTs at any given time are not yet adequately measured.Then there is the matter of time lags.
So on short timescales of say less than the length of a single Pacific Ocean phase of around 30 years the ocean/air link is swamped by chaotic variability and the variability of the ENSO cycle from year to year.
The link starts to become clear at longer timescales because we see the jets drift irregularly poleward during a period of strong warming El Ninos such as the late 20th century and equatorward during a period of less strong El Ninos as now. If one then considers the 1000 year period from MWP to LIA to date the changes in jet stream positions over the period are very clear from historical information albeit not finely detailed.
So there is good evidence of an ocean SST / tropospheric temperature link but it doesn’t explain all the observations on it’s own as you correctly pointed out. Thus the logical need for a second variable and it is becoming more widely noted that different levels of solar activity seem also to be linked to changes in jet stream positions via changes in the polar high pressure cells.
So I don’t have detailed data but the logic is consistent with observations. That is a move forward.
As for the term ‘exactly’ I was using that as a term of emphasis rather than precision. I see no other possible explanation for the patterns that we observe. All other attempts to explain observations have quickly gone awry.
Christopher Game replying to Steven Wilde’s post of 2010 Aug 24 at 10:23 PM.
Dear Stephen Wilde,
Thank you for your reply.
My question was:
“I am asking whether you have examined the temperature records numerically to check whether the time series of SST and tropospheric temperatures shows a close linkage between the two variables: how close? In particular, Dr Spencer has pointed out that on an intraseasonal time scale the two variables move oppositely; how does that compare with a longer time scale, over several years: is the relation on that longer times scale also one of opposite movement?”
It seems to me that Dr Spencer’s lead article here indicates some detailed data that would be at least partly suitable for answering my question. That’s why I asked the question.
You write: “So I don’t have detailed data but the logic is consistent with observations. That is a move forward.”
I read that as an answer “no” to my question as to whether you have examined the temperature records numerically.
Yours sincerely,
Christopher Game
Christopher Game further replying to his own question posed in his post of 2010 Aug 24 at 2:50 AM.
Reading more of Spencer and Braswell 2010, at [35] we find:
“Note that this type of forcing would not exist if it was the total heat content fo the system that was monitored rather than the temperatures of its components. But since feedback is referenced to temperature, our analysis uses temperature, and so we are forced to deal with the complication that the climate system has a variety of temperatures (of the troposphere, upper ocean [not too different from SST I think?], and deep ocean ) that do not vary in unison.”
As I read this, it means that the answer to my question as asked above is no, one cannot precisely and reliably predict one temperature from another.
This means that the analysis in terms of “forcings and feedbacks” is an artefact of the stucture of the IPCC formalism, which is arbitrary and procrustean, and does not directly show the physical invariants or physical structure of the process under investigation. Not only that, but also the IPCC formalism cannot actually represent the data because the formalism requires that knowledge of one temperature be enough to allow calculation of the feedbacks.
Poor Drs Spencer and Braswell are struggling, courageously and carefully I grant, with problems not created by nature, but with problems created by the formalism that requires that “feedback is referenced to temperature”, and a single temperature at that.
Drs Spencer and Braswell tell us at [35]: “In fact, if the only source of temperature variability in the system is from time-varying radiative forcing, the feedback is for all practical purposes not observable.” They are really struggling with the formalism, not with the processes of nature.
Drs Spencer and Braswell have more to say at [62]: “Time-varying radiative and non-radiative forcings are continually occurring, and so radiative feedback parameters will need to be diagnosed in the presence of some level of time-varying radiative forcing, which we have seen usually leads to large errors.”
The root cause of these problems is that the IPCC formalism is not physical theory, it is, rather, a procrustean formalism intended to cover all imaginable physical theories, a one-size-fits-all omnibus. Its origin is in papers by Hansen et al. and by Schlesinger which cite Bode’s (1945, Network Analysis and Feedback Amplifier Design, Van Nostrand, New York, xii and 551 pages) celebrated and admirable theory of design techniques for negative feedback electronic amplifiers. Bode’s theory is excellent for the specialized engineering purpose for which it was constructed, but it was not constructed as a theory for the investigation of atmospheric-oceanic energy transfer.
The IPCC formalism uses an assumption that that at the steady state, the difference between the total absorbed solar radiation and the outgoing longwave radiation is zero. This is a valid statement of a contingent mathematical condition for a steady state, but it is not a general law of nature, nor is it a dynamically specified structural feature of the IPCC formalism, that such a steady state must exist. That is to say the steady-state assumption does not refer to a dynamically determined fixed point of a properly defined dynamical system. Consequently the definitions of positive and negative feedback are at best arbitrary and do not reflect mathematically invariant dynamical features of the process. Such is not physics. The IPCC needs to scrap this formalism and go back to square one.
The remedy is to use a physically based model, as in the usual methods of investigation of natural systems. One will want an external driver or several to allow investigation of the dynamics of the system. The day-night cycle, and the seasonal cycle of the earth being nearer to and further from the sun, and the moon and the sun and perhaps of Jupiter and Saturn driving the tides, and the variable activity of the sun signalled by the sunspots, and volcanic eruptions, are obvious candidates. As a general rule, the easiest cause and effect relationships to investigate are the most short-time linked ones. One will start with the day-night cycle of one can get suitable data. Then perhaps the volcanic eruptions.
Perhaps Drs Spencer and Braswell’s grand and most admirable work here will eventually lead, rather than to a continuation of the quarter of a century of hopeless struggles with the inappropriateness of the IPCC (Bode) formalism, to a root and branch reform of the IPCC way of thinking, and to the general adoption of a fundamentally better physical model.
Christopher Game
Readers might be interested to know that Christopher and I have been having this discussion/debate over the use of the “feedback” concept for over a year now. It is true that one of the implications of our new paper is that diagnosing “feedbacks” has not helped us get any closer to figuring out how sensitive the climate system is to long-term forcing. Maybe there will be a better construct or paradigm developed eventually, I don’t know.
But we also show that the linear striations and spirals we see in phase space plots of year-to-year variability in both the satellite and model data are explainable with a simple forcing-feedback model. So, until someone invents a better way of addressing the sensitivity question, we are stuck with the current paradigm.
The fact that the climate use of “feedback” is not as elegant or as well defined as Bode and others might have expressed it is, to me, not very relevant. If observed behavior acts like a feedback upon temperature, then use the term — or invent a new term…I don’t really care.
Either way, the behavior still exists.
Christopher Game replying to Dr Spencer’s post of 2010 Aug 30 at 6:31 AM in response to Christpher’s “Anonymous” post of Aug 30 at 4:45 AM.
Dear Dr Spencer,
Thank you for your reply.
I have no problem with the idea of feedback. I am very keen on the use of the idea of feedback. What concerns me is how it is put into practice. I am looking for you to find a better way of setting it up than the one that the IPCC uses.
The “behaviour” is partly a matter of how it is described. Einstein wisely said that the theory decides what can be observed. In my opinion, Einstein was a pretty bright chap, even if clever people like to rubbish him because he didn’t swallow the fancy philosophy that people attach to the quantum mechanical formalism. I don’t swallow it either!
Your paper says that some kinds of feedback are unobservable in terms of the IPCC formalism. At [35] you write: “In fact, if the only source of temperature variability in the system is from time?varying radiative forcing, the feedback is for all practical purposes not observable.” The non-observability is due to a flaw in the model, not that there is no behaviour there.
I still think a better model would allow that behaviour to be observed, and I don’t discount the possibility that you and Dr Braswell might invent it.
Yours sincerely,
Christopher
“I read that as an answer “no” to my question as to whether you have examined the temperature records numerically”
The MWP displayed warmer temperatures and poleward jets.
The LIA displayed cooler temperatures and equatorward jets.
The recent warm spell displayed warmer temperatures and, again, poleward jets
That is enough to qualify as a numerical examination albeit not detailed in the way I think you meant. It is however sufficient to provide an indication that there is a link between temperature trends and latitudinal air circulation positioning.The next step is to consider why there is such a link.
Clearly the rate of energy release by the ocean varies and now many suspect that the energy flux to space also varies.
The only logical description that complies with observations and basic physics is mine.
There is no way that a weaker inversion at the tropopause (cooler stratosphere) can cause the polar high pressure cells to intensify and move equatorward. One has to have a stronger inversion for that to happen, basic fluid dynamics. Contrary to established climatology the inversion is stronger from a warmer stratosphere when the sun is weaker.A weaker sun is supposed to cool the stratosphere but apparently it does not.
Overcome that problem and I will reconsider. Quite simply the observations disprove standard climatology.