Sea Surface Temperatures (SSTs) measured by the AMSR-E instrument on NASA’s Aqua satellite continue the fall which began several months ago. The following plot, updated through yesterday (August 18, 2010) reveals the global average SSTs continue to cool, while the Nino34 region of the tropical east Pacific remains well below normal, consistent with La Nina conditions. (click on it for the large, undistorted version; note the global SST values have been multiplied by 10):
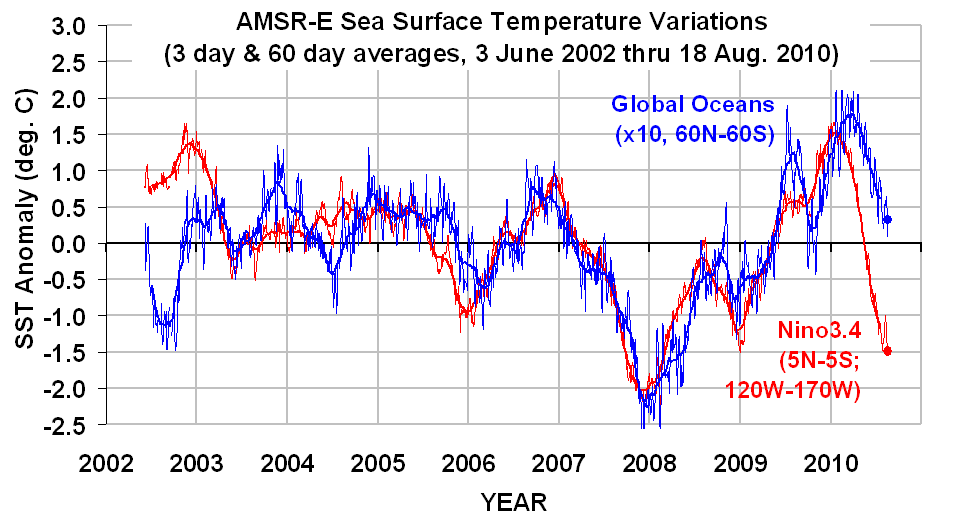
Anomalously High Oceanic Cloud Cover
The following plot shows an AMSR-E estimate of anomalies in reflected shortwave (SW, sunlight) corresponding to the blue (Global) SST curve in the previous figure. I have estimated the reflected SW anomaly from AMSR-E vertically integrated cloud water contents, based upon regressions against Aqua CERES data. The high values in recent months (shown by the circle) suggests either (1) the ocean cooling is being driven by decreased sunlight, or (2) negative feedback in response to anomalously warm conditions, or (3) some combination of (1) and (2). Note that negative low-cloud feedback would conflict with all of the IPCC climate models, which exhibit various levels of positive cloud feedback.
![]() |
Hey Roy,
Most of these posts and comments are going way over my head, I would like to ask a few questions not related to this post. How can the statement be made that we are adding co2 at an unprecendented rate? I have personally concluded that this is false and that surely co2 was being added at a much faster rate during the time of the dinosaurs. Also, since we had 7,000ppm of co2 in the atmosphere and are now down to 390ppm, isn’t this proof that the earth filters out extra co2? This is why I think global warming is a hoax. I think this turns the argument into “the earth cannot and will not do something it has already done, even though it is on a smaller scale. Nobody has adequately explained this to me.
Playing devil’s advocate here, they will say that those huge CO2 changes occurred over eons…not decades.
Even if you look at 100,000’s of years of CO2 record from the Vostok ice core, the periods of the most rapid changes in CO2 show that there is very little change over 100 years.
Now, whether this means anything for our current climate system, or whether it is even necessarily bad for life on Earth is, I agree, questionable.
Cool stuff Dr. Spencer (pun intended).
Thank you for the two graphs. I am curious about the seeming disconnect between Nino 3.5 and Global SST at the beginning of the record (2002) and now the more recent readings. Does Nino 3.5 region reflect a reaction to more contemparious physical events and global SST lags behind as a response to events in equatorial Pacific? Does Nino3.5 refect tropical large water volumes responses not necessarily observed in the equatorially lesser volume Atlantic? Are the North-South currents dominant over the West-East SST &/heat flow? I realize that Nino 3.5 is a calculation to facilitate predictions. I wonder how SST in the Indian Ocean influences temperatures and heat transfer in the equitorial Pacific? Do events that transfer heat in the equitorial Pacific behave somewhat independently of those events happening globally?
As to cloud cover: are the mechanisms for cloud development which occur water surface to land the same as cloud cover development just over land or just over water the same?
Thank you any and all kindnesses.
RiHo08 asked, “Does Nino 3.5 region reflect a reaction to more contemparious physical events and global SST lags behind as a response to events in equatorial Pacific?”
Yes. The NINO3.4 SST anomalies are used to represent the frequency and magnitude of El Nino and La Nina events. Sea Surface Temperatures outside of the tropical Pacific are responding to changes in atmospheric circulation caused by the El Nino/La Nina, and it takes a few months for those changes in atmospheric circulation to reach the other ocean basins as they travel eastward–hence the lag in global sea surface temperatures.
You asked, “Does Nino3.5 refect tropical large water volumes responses not necessarily observed in the equatorially lesser volume Atlantic?”
There are El Nino-like events in the Atlantic but they are fewer and of lesser magnitude.
With respect to the remainder of your comments and questions, it would be easiest for me to direct you to an EL Nino FAQ webpage written by NOAA’s Bill Kessler:
http://faculty.washington.edu/kessler/occasionally-asked-questions.html
My Introduction to ENSO may also help answer your questions:
http://bobtisdale.blogspot.com/2010/08/introduction-to-enso-amo-and-pdo-part-1.html
Am curious why despite the deep plunge in SST in 2008, the reflected SW was low or even negative. Whereas the current plunge in SST has a very high SW reflection. What could explain for this? Thanks.
changes in reflected SW can be due to either forcing or feedback. The current high SW reflection during cooling suggests we are seeing most SW forcing temperature. The previous SST plunge in 2008 seems to have exhibited more of a feedback signature, with below normal temperature causing below-normal reflected SW, which would be negative feedback (a cloud change trying to wam it back up again).
In general, forcing and feedback signals are mixed in together and are difficult to separate. This is the subject of our latest JGR paper, which is now officially in print.
Is there any real correlation between oceanic reflected sunlight and ocean temps? Is there any trend in oceanic reflected sunlight that we know of?
Roy, If it is cloud driven, shouldn’t we see a similar reflected SW pattern for the 2008 drop in SST ?
“Note that negative low-cloud feedback would conflict with all of the IPCC climate models, which exhibit various levels of positive cloud feedback.”
Very understated — and absolutely critical — point.
It seems that SSTs is lagging Oceanic Cloud Cover and in opposite phase. That is by definition negative low-cloud feedback.
More intresting may be that global-average lower tropospheric temperature, where the cloud is 🙂 , are in phase with cloud cover.
Let see now what is cloud?
Vapor condensation that release latent heat into the atmopshere. Yes clouds do heat the atmosphere where they are formed.
Are UAH global-average lower tropospheric temperature also a proxy for global cloud formation?
You’re right condesation occurs during atmospheric cooling.
How much of the Global SST change is just due to the Nino change? Has the total ocean area not including the Nino area cooled? If that is the case then the extended cloud cover may be the cause if not what then?
I was wondering the same thing. What is Global Oceans minus Nino3.4 and how would it be weighted for area and absolute temperature. Is a 0.5 degree anomaly at 10 Celsius the same as 0.5 at 25 degrees?
The drop in 2008 was due to the last La Nina wasnt it?! I remember here in Australia we had significant floods along the east coast of the continent at the time, and increased rainfall on the east coast of Oz is a classic indicator of a La Nina condition.
The increase in cloud cover over oceans fits perfectly with my New Climate Model which anticipates just such a development with consequent increased global albedo when the air circulation systems sink equatorward taking the clouds with them. Primarily that means the cloud bands of the various jet treams and the ITCZ.
One doesn’t necessarily need a change in total global cloud cover or type, just a latitudinal shift to alter the angle of incidence of incoming solar energy.
The inevitable consequence is of course less solar shortwave entering the oceans until the clouds move poleward again and I suspect that won’t happen until the sun gets more active.
The recent El Nino failed to push the jets as far poleward as similar El Ninos did during the late 20th Century when the sun was more active. The only variable that has changed since then is the level of solar activity
Dr Spenser,as well as a relationship between PDO/ENSO and low cloud cover,there appears to exist one between low cloud formation and antarctic ice formation.Could it be that the rate of deep water upwelling driven by subduction around antarctica, coriolis forces equitorially and lower surface pressures in the areas where subsurface geography promotes upwelling, lifts and releases cloud nuclei forming chemicals from this deep water as its pressure drops near the surface?
Dr. Spencer,
The AMSU graph shows SST that are in average(+- 0.2F)of the last 8 years, for now a month. Why are the Near Surface Temps (I suppose land + sea Temperatures) not following?
Interesting stuff.
Am I imagining it, or does your graph of estimated reflected sunlight look very much like the lower troposphere temperature record, but shifted in time (reflected light lags tropospheric temperature by a few months)? The dip in reflected light following the 2008 cooling also supports a negative low level cloud feedback.
Roy,
Any way you can post the data that went into the reflected sunlight graph?
The recent NOAA satellite temperature reading problem…
Is that in any way related to the satellites from which you obtain data?
Thanks Roy,
Can I be extra picky? Could you extend your graphs back to 1998 so that we can see how this year compares to 1998. Do you see the same cloud effect then?
Just curious how could one pick apart 1) and 2) to get a definitive answer?
Thanks for maintaining this website Dr Spencer and for providing these interesting articles. One question that has been asked by a UK Professor of Atmopsheric Physics (when I posted a link to your site) was as follows:
“There have been several El-Nino to La-Nina transitions during the satellite era going back to 1979. Do we know whether this increase in oceanic cloud cover occurs each time ?”
I can’t determine the answer based on the data here as it doesn’t go back far enough – but if you have time to answer I would be very grateful to know whether the earlier historical data exists and if so what the answer is.
I would imagine there will normally be an increase in cloud cover in response to the ocean warming of El Nino (negative feedback) – but is the current response larger than previous responses (as we might expect if Svensmark’s theories for example are accurate, or if the negative PDO were contributing)?
Very interesting. That’s the type of empirical data I like to say. Could be some support for Lindzen’s theory.
Does this info really “conflict with” IPCC models? I thought that, of the 18 models reflected in the 4th assessment, 14 or 15 predicted neither a net positive nor a net positive feedback effect from clouds. Hence, the statement in the Synthesis Report to the effect that cloud feedback continues to be the great uncertainty in climate modelling … a sentiment that was reiterated in the recent NAS report (and really all meaningful compilations of the current state of our climate science knowledge).
Ben G said:
“I would imagine there will normally be an increase in cloud cover in response to the ocean warming of El Nino.”
That is certainly the general assumption but I think it works somewhat differently.
The El Nino ocean warming pumps more energy into the air and increases convection but the air being warmer it can hold more water as vapour without it condensing out.
What it does instead is increase the size of the equatorial air masses above the warmer water and push poleward the interface between that equatorial air mass and the sub tropical air masses in each hemisphere.That would reduce cloud cover in equatorial oceanic regions.
Increases in cloud cover and/or density would occur at the interface between hemispheres (the ITCZ) and between the equatorial and sub tropical air masses but by far the greater cause of an effect on global albedo would be the change in the angle of incidence of solar energy onto all those clouds which are pushed poleward by the expanded equatorial air masses.
We saw that in the late 20th century when a run of strong El Ninos pushed the air circulation systems with their cloud bands towards the poles and albedo declined with more solar energy entering the oceans.
Now the oceans surfaces are becoming cooler. The equatorial air masses are contracting and the cloud bands are moving back equatorward and indeed global albedo has been increasing since around the turn of the century with less solar energy entering the oceans.
Note that the oceanic effect is only half the equation as I explain elswhere but that is another issue.
Stephen – yes I agree with you – I was being rather blinkered and was thinking mainly of the region of the ITCZ – I’m pretty sure that the current La Nina developed in response to the previous El Nino by creating an increase in tropical convection along the equator which then led to cooling at depth of the tropical sea – which has ultimately mixed towards the surface and resulted in an increased SOI.
In terms of your hypothesis that as the jets move North or South in response to Enso, or variations in the AO – that we see a general impact on albedo – then it seems completely intuitive that this must be the case – it’s surprising there’s not more research on the matter, but then we know where the research money gets spent these days.
Facts: Nitrogen constitutes 78% of the atmosphere, oxygen 21% and trace gases just 1%. Water vapor is the most significant trace gas and the most significant green house gas (GHG). According to IPCC technical reports carbon dioxide is the least significant trace gas both by volume and by Global Warming Potential (GWP).
Question: What are the chances an infinitesimal (.04%) trace gas (CO2), essential to photosynthesis and therefore life on this planet, is responsible for runaway Global Warming?
Answer: Infinitesimal
Discussion: The IPCC now agrees. See the IPCC Technical Report section entitled Global Warming Potential (GWP). And the GWP for CO2? Just 1, (one), unity, the lowest of all green house gases (GHG). What’s more, trace gases which include GHG constitute less than 1% of the atmosphere. Of that 1%, water vapor, the most powerful GHG, makes ups 40% of the total. Carbon dioxide is 1/10th of that amount, an insignificant .04%. If carbon dioxide levels were cut in half to 200PPM, all plant growth would stop according to agricultural scientists. It’s no accident that commercial green house owner/operators invest heavily in CO2 generators to increase production, revenues and profits. Prof. Michael Mann’s Bristle cone tree proxy data (Hockey stick) proves nothing has done more to GREEN (verb) the planet over the past few decades than moderate sun-driven warming (see solar inertial motion) together with elevated levels of CO2, regardless of the source. None of these facts have been reported in the national media. Why?