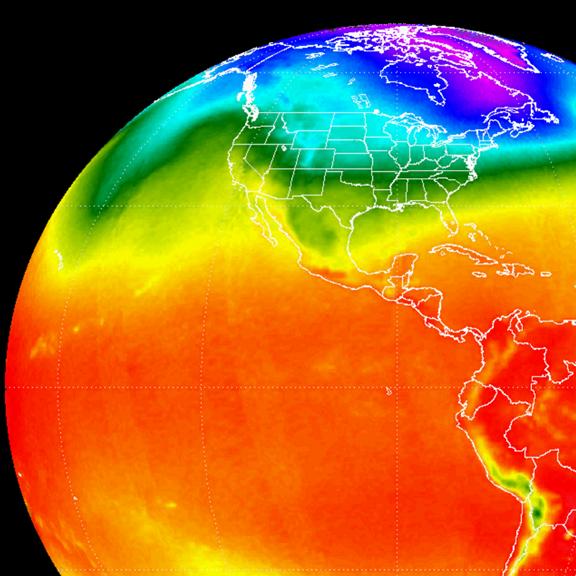
YR MON GLOBE NH SH TROPICS
2010 1 0.648 0.860 0.436 0.681
2010 2 0.603 0.720 0.486 0.791
2010 3 0.653 0.850 0.455 0.726
2010 4 0.501 0.799 0.203 0.633
2010 5 0.534 0.775 0.292 0.708
2010 6 0.436 0.550 0.323 0.476
2010 7 0.489 0.635 0.342 0.420
2010 8 0.511 0.674 0.347 0.364
2010 9 0.603 0.555 0.650 0.285
2010 10 0.426 0.370 0.482 0.156
2010 11 0.381 0.513 0.249 -0.071

The tropical tropospheric temperature anomaly for November continued its cooling trend, finally falling below the 1979-1998 average…but the global anomaly is still falling slowly:+0.38 deg. C for October November, 2010.
2010 is now in a dead heat with 1998 for warmest year, with the following averages through November:
1998 +0.538
2010 +0.526
December will determine the outcome, but remember that the difference between the two years is not statistically significant.
For comparison, here are the monthly anomalies for 1998:
YR MON GLOBE NH SH TROPICS
1998 1 0.582 0.612 0.552 1.097
1998 2 0.753 0.857 0.649 1.291
1998 3 0.528 0.655 0.401 1.025
1998 4 0.770 1.014 0.525 1.059
1998 5 0.645 0.685 0.606 0.885
1998 6 0.562 0.635 0.490 0.536
1998 7 0.510 0.659 0.362 0.442
1998 8 0.518 0.544 0.492 0.447
1998 9 0.458 0.571 0.345 0.312
1998 10 0.416 0.519 0.312 0.339
1998 11 0.192 0.272 0.113 0.130
1998 12 0.277 0.416 0.138 0.073
FOR THOSE TRACKING OUR DAILY TEMPERATURES: Since I’m getting many e-mails about quirks in the daily channel 5 temperature updates at the Discover website, here are a few tips to keep in mind:
1: The Discover website is an automated process and there is little quality control.
2. A few of the orbit files end up coming in several days late, in which case some day’s averages can be missing for several days. We fix it manually as time permits.
3: If a daily temperature difference between this year and last year is 100’s of degrees, it’s because one of the days has missing data. It’s not because we’ve been hacked by Earth First! Check out the text data…you’ll figure it out.
4. During spring there can be strong warming trends, and (as has happened in the last couple of weeks) in the fall there can be strong cooling trends. This is partly because the seasonal cycle has not been removed from the data. Click the “Average” box and “Redraw” to see how what’s happening compares to what’s normal for that time of year.
[note: These satellite measurements are not calibrated to surface thermometer data in any way, but instead use on-board redundant precision platinum resistance thermometers (PRTs) carried on the satellite radiometers. The PRT’s are individually calibrated in a laboratory before being installed in the instruments.]
 |

 Home/Blog


