Nov. 2010 UAH Global Temperature Update: +0.38 deg. C

December 3rd, 2010 by Roy W. Spencer, Ph. D.


YR MON GLOBE NH SH TROPICS
2010 1 0.648 0.860 0.436 0.681
2010 2 0.603 0.720 0.486 0.791
2010 3 0.653 0.850 0.455 0.726
2010 4 0.501 0.799 0.203 0.633
2010 5 0.534 0.775 0.292 0.708
2010 6 0.436 0.550 0.323 0.476
2010 7 0.489 0.635 0.342 0.420
2010 8 0.511 0.674 0.347 0.364
2010 9 0.603 0.555 0.650 0.285
2010 10 0.426 0.370 0.482 0.156
2010 11 0.381 0.513 0.249 -0.071

UAH_LT_1979_thru_Nov_10

The tropical tropospheric temperature anomaly for November continued its cooling trend, finally falling below the 1979-1998 average…but the global anomaly is still falling slowly:+0.38 deg. C for October November, 2010.

2010 is now in a dead heat with 1998 for warmest year, with the following averages through November:

1998 +0.538
2010 +0.526

December will determine the outcome, but remember that the difference between the two years is not statistically significant.

For comparison, here are the monthly anomalies for 1998:

YR MON GLOBE NH SH TROPICS
1998 1 0.582 0.612 0.552 1.097
1998 2 0.753 0.857 0.649 1.291
1998 3 0.528 0.655 0.401 1.025
1998 4 0.770 1.014 0.525 1.059
1998 5 0.645 0.685 0.606 0.885
1998 6 0.562 0.635 0.490 0.536
1998 7 0.510 0.659 0.362 0.442
1998 8 0.518 0.544 0.492 0.447
1998 9 0.458 0.571 0.345 0.312
1998 10 0.416 0.519 0.312 0.339
1998 11 0.192 0.272 0.113 0.130
1998 12 0.277 0.416 0.138 0.073

FOR THOSE TRACKING OUR DAILY TEMPERATURES: Since I’m getting many e-mails about quirks in the daily channel 5 temperature updates at the Discover website, here are a few tips to keep in mind:

1: The Discover website is an automated process and there is little quality control.

2. A few of the orbit files end up coming in several days late, in which case some day’s averages can be missing for several days. We fix it manually as time permits.

3: If a daily temperature difference between this year and last year is 100’s of degrees, it’s because one of the days has missing data. It’s not because we’ve been hacked by Earth First! Check out the text data…you’ll figure it out.

4. During spring there can be strong warming trends, and (as has happened in the last couple of weeks) in the fall there can be strong cooling trends. This is partly because the seasonal cycle has not been removed from the data. Click the “Average” box and “Redraw” to see how what’s happening compares to what’s normal for that time of year.

[note: These satellite measurements are not calibrated to surface thermometer data in any way, but instead use on-board redundant precision platinum resistance thermometers (PRTs) carried on the satellite radiometers. The PRT’s are individually calibrated in a laboratory before being installed in the instruments.]

WeatherShop.com Gifts, gadgets, weather stations, software and more...click here!


69 Responses to “Nov. 2010 UAH Global Temperature Update: +0.38 deg. C”

Toggle Trackbacks

  1. JohnD says:

    I think you meant to say that November was +0.38 not October. Given the trend line it would be shocking to me if 2010 topped 1998. But if a drastic turn takes place and 2010 tops 1998 by even 0.001 degrees, the media blitz about ‘warmest year on record’ would surely be headache inducing.

  2. enSKog says:

    I have previously noted the ‘note’ concerning the PRTs but I can not see how these are used in the derivation of the temperature data from microwave radiation measurements. Could you advise?

  3. An Inquirer says:

    I do not see how .38 can be derived from the daily entries for Channel 5. I understand that Channel 5 is now using the latest satellite and needs no adjustment for orbital drift, etc. The biggest deviation for any invidual day is .36, and the last 11 days were even negative.

  4. Why JohnD would it ‘surely be headache inducing if a drastic turn takes place and 2010 tops 1998 by even 0.001 degrees’?

    After all, the dispute or argument going on is not about whether there was global warming during the last few years of the 20eth century or not. Nor is it (so far) any need to argue whether or not the Earth is still a warmer place than it was at the end of the 19th century – If it is shown that 2010 was slightly warmer (0.001 °C) than 1998 – then so be it.

    The question or argument is over whether the “official” claim that the rise of Carbon Dioxide in the Troposphere from 0.029% to 0.039% (a total rise of 0.01%) caused that warming is correct.

    That’s the basic –, let’s call it disagreement – Don’t, if you have an opinion about it, loose sight of this basic disagreement.
    There are many other claims and counter-arguments arising from this basic one, like for example: Is the rise in CO2 completely due to fossil fuels? —— is the warming likely to be catastrophic? Et cetera, et cetera.

    Yes, a temperature record is important for many reasons and one of them is that if it can be shown (beyond doubt) that temperatures are falling then you may think that the AGW claim has been lost, but don’t be too sure The IPCC may, once again, find there is a need for “adjustments” to the records.

    What baffles me are Northern Hemisphere temperatures for Jan., Feb and March 2010.

    If I remember right, it was colder than normal in most part of our Hemisphere right from the time the first snow fell in Copenhagen during a certain conference in December 2009 until we had reports of Mongolian nomads and their animals dying due to severe frost in those parts during February & March 2010. I can even remember reports of frost, snow and ice formation in certain places as far south in The USA as New Orleans and Florida. – Or was I dreaming?

  5. I must confess to being puzzled as well about how the numbers were derived. There sometimes seems to be a better correlation between the same months in adjacent years than between any year and the average. For example, October 2010 was HIGHER than October 2009, both in the tables and the graph. As well, November 2010 was LOWER than November 2009, both in the tables and the graph. As it turns out, December 1998 was 0.27 and December 2009 was 0.29. Since these are virtually identical, I would say that if December 2010 does NOT beat December 2009, then a new record will NOT be set. A great start has been made between the two December values but we will have to wait and see what happens.

  6. slimething says:

    Is the globe warming, or is it is expelling heat from the oceans? It would seem logical that if the oceans are releasing heat, the heat must invariably rise and enter the LT.

    At some point the temperatures will drop, and I think it won’t be a minor event.

    My 2c.

  7. Nonoy Oplas says:

    The tropics now has negative temperature anomaly. We now have daily rains here in Manila this December, supposedly a “cold but dry” month.

    Some cartoons about Al Gore and “global warming” that I gatherered from the web, http://funwithgovernment.blogspot.com/2010/12/weekend-fun-3-al-gore-cartoons.html

  8. JohnD says:

    Olay,
    My point was only that the media buzz would be an annoyance, I am not sure how it could have been interpreted in such a way as to justify a four paragraph response.

  9. AntonyIndia says:

    South India the same: lots of clouds and rain more then usual, so temperatures will be lower for November and even December, not higher. The whole year had more rain (and clouds).

  10. Oakden Wolf says:

    December will determine the outcome, but remember that the difference between the two years is not statistically significant.

    (Raising an eyebrow, Spock-style):

    “Fascinating”.

    Oceanic Niño Index

    The 1997-1998 El Nino had six straight months with an ONI greater than 2, and 13 intervals with a positive ONI. The 2009-2010 El Nino had a maximum ONI of 1.8, and 11 intervals of a positive ONI (the 1997-1998 El Nino lasted one interval longer into the year than the 2009-2010 El Nino, by definition of exceeding 0.5 ONI). All this tells me that the 2009-2010 El Nino was significantly weaker than the 1997-1998 recordbreaker.

    So I think the potential statistical dead heat between 1998 and 2010 is a worthy datum for consideration.

  11. Orkneygal says:

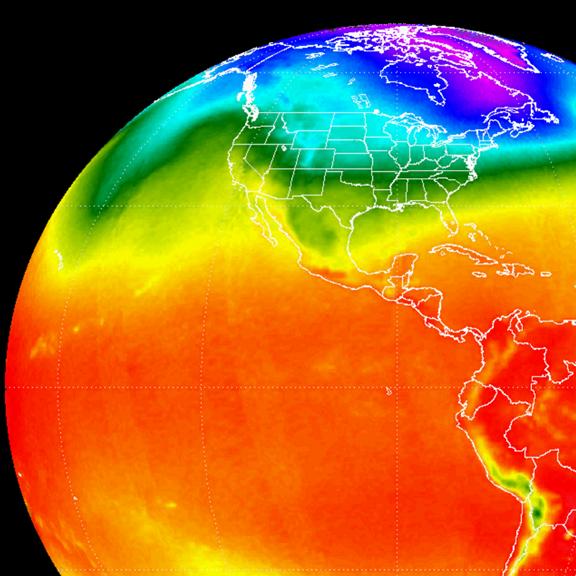
    I understand the chart and the table, but the image is confusion to me.

    Is the image an actual representation of any of the real data? Or is it just a “pretty picture” for visual impact?

    Certainly, the image does not seem to show cooling over the tropics.

  12. Cassanders says:

    @Olv H. Dahlsveen.
    (Guessing from your name) I suspect you are writing from Norway.
    As I have understood the data from 2010 winter/spring,it was indeed Europe that was an “outlier”. Negative NAO and a very long stable high over Russia twarted the heat transportation from the Gulf to Europe and Scandinavia by the Atlantic current.
    Other (and large) areas were simultaneously well above the currently applied long term averages.

    Cassanders
    In Cod we trust

  13. Ray says:

    Troy,
    This may, or may not be relevant, but, after adjustment of UAH to the same period as HadCRUT3, the UAH anomaly for this year is running an average of 0.189c higher than HadCRUT3. I have also noticed that after adjustment, UAH tends to be more extreme than HadCRUT3 or other measures, i.e. it tends to be higher during warm periods and lower during cool periods.

  14. Ray says:

    Orkneygal,
    As far as I can tell, the image is just a “pretty picture”.
    It seems to have been the same for at least the last 3 months, and I suspect longer.
    Dr Spencer, if that is the case, I suggest removal, since int adds nothing scientific to the blog and is only likely to cause confusion.

  15. Ted says:

    Dr. Spencer,

    I have a few questions. I’ve asked these in previous posts without receiving a response from you, but maybe you missed them. I know that you were travelling recently.

    Could you explain the history of the UAH satellite temperature readings from a decade or so ago that others discovered were being misinterpreted? Why were the erroneously low temperature readings not recognized sooner?

    Why did the temperature anomaly of 0.72 degrees C in January 2010 disappear from every subsequent monthly chart in your data set? Was it a mistake? Was it changed when you recalibrated your system earlier this year?

    What evidence do you see that directly refutes the hypothesis that global warming of the last 100 years is caused largely by human activities?

    Thank you.

  16. Chris G says:

    Look, the 2010 anomaly is dropping, but it is still positive. A positive anomaly means that it is still warmer than the baseline. So, I’m not sure where any talk of cooling is coming from.

    Can’t figure why everyone is so excited about any one or two years.

  17. Dylan says:

    Commentary emphasising the outstanding current global warmth; to Paul Hudson’s blog;
    CC: Roy Spencer’s climate change blog;
    CC: Green Party headquarters Brighton.

    The fires in Russia this summer; & the floods in Pakistan around the same time; along with our heat waves this summer; along with both last winter’s freeze in the Northern Hemisphere; & the UK’s current icy spell; also the current very warm conditions around Greenland & Nova Scotia; & for a while in parts of Russia & Siberia are all caused by the same on-going phenomenon; the unusually flaccid waves & kinks & patterns of the Northern Hemisphere Jetstream. I’ve not observed it like this before. The current situation is really quite astonishing.

    First; here are some quotes from an anti-Global-warming website by Dr Roy Spencer that I follow; as it has useful satellite global temperature data.

    “2010 is now in a dead heat with 1998 for warmest year, with the following averages through November:
    1998 +0.538
    2010 +0.526
    December will determine the outcome, but remember that the difference between the two years is not statistically significant.”

    Here is a quote from someone making comments on his website;

    Given the trend line it would be shocking to me if 2010 topped 1998. But if a drastic turn takes place and 2010 tops 1998 by even 0.001 degrees, the media blitz about ‘warmest year on record’ would surely be headache inducing.

    Aside… Yeah mate; headache inducing if you’ve already made up your mind & you’re not open to the blatant evidence you yourselves examine. But I’m not here to argue about Global warming…

    The following comments I’m making are hinted at in Paul Hudson’s current blog as bullet points. I speak generally about the climate for those who have an overall picture of the topic; because I understand the science behind what I am saying – & so will many others. So I don’t intend to post loads of links to back up what I am saying; as those who understand the science will know where I get the information from; as well as knowing it for themselves anyway. I study global climate intensely; & write on an amateur basis; but with an in depth knowledge of the topic. But much of the information I give can be cross-referenced; & is available through the fantastic Weather Underground website; & the blogs; particularly Dr Jeff Masters. I also follow the global climate on various websites; as well as monitoring the Jetstream (on “wunderground”) & the world’s climate on a week to week basis; on the Met Office & others; as well as the El Nino & La Nina phenomenon; & I have posted comments here before; with similar points to those echoed in Paul’s current blog on this website; regarding the current record warmth globally in 2010; despite the current La Nina; & the strength of the El Nino which caused 1998’s record warmth. So these comments are to emphasise that the current global climate situation is extraordinary.

    The current situation in the global climate fascinates me. As I said; many of the world’s extreme meteorological events this year are all clearly linked; & were all associated with the pattern that has developed in the Jetstream. The unusually wide; & not very strong; but very winding path of the Jetstream has caused massive kinks & shifts unusually far to the north & south over many parts of the temperate globe for much of this year. This has also been recognised on many weather & climate blogs. It seems to be caused by the fact that the poles are currently very warm compared to average; we see that warmth tends to accumulate in the North Pole during warmer years; hence the near record sea-ice minimums this year; & periods of record warmth. But the Continent has often experienced extreme heat & cold build up in the relevant seasons; which has also caused heat waves & cold spells to spill over to our UK shores at times; when the wind has come from the continent. The result has been that we have been more influenced by the continental climate; with hot dry spells in summer; & severe bitter spells in the winter.

    On the other-hand; Equatorial regions have been comparatively cooler; partly because the spin of the earth can spread anomalous warmth North; but mostly due to the supposedly “moderate” La Nina***(I say supposedly; as it was the coldest August – October three month running mean temperature recorded; the coldest La Nina area sea-temperature recorded in Aug-Oct in the La Nina (3:4) region since 1988; and there were only 3 slightly cooler such three month August – October periods prior to that since 1950; when the globe was cooler anyway; so this is a very strong La Nina & early building one as far as I can see) & this is all due to the resulting La Nina cooling that has developed; so that the difference between the Equator & the poles is less than usual; & the Jetstream has basically spread out; & then snaked erratically around the northern hemisphere; due to the fact that the conflict between polar & tropical air is just that bit less intense.

    This pattern creates strong blocking high pressure systems; causing prolonged drier periods; bitterly cold periods in the winter; & stiflingly hot periods in the summer. So during this summer; periods of anomalous warmth were caused in many areas as the Jetstream snaked far to the north; causing us some significant heat waves & dry spells at times (especially here in the south-east). This caused punishing heat in Eastern Europe; and the terrible forest fires. But in its passage further east from Russia; it then had a southward kink that lunged it down far south of usual causing the rain & depressions pushed along it to hit the Himalayas; displacing tens of millions of people by the floods that ran down the rivers from the mountains in Pakistan.

    This same pattern is also causing the current meteorological situation; we are locked in a “kink”; in an area North of the Jetstream; which currently looks to stay in place; causing us a second; (perhaps more severe) continental winter; here on the polar side of the Jetstream; with occasional incursions of Atlantic air such as we are having right now; as the kink in the Jetstream passes briefly right over us. But soon; that polar pattern will block over us again; & I suspect we are in for record breaking prolonged cold spells this year; unless change causes a blast of Atlantic air; perhaps if the poles start to cool down with the recent La Nina later in the winter; & the Jetstream becomes stronger & more uniform in its passage across the Northern Hemisphere.

    These same waves & kinks have also been affecting the America’s. It is a truly global phenomenon. But despite all the polar incursions across the temperate globe; causing record cold periods; the warmth has superseded the cold; & even in this La Nina influenced year; the sea; & the poles are refusing to cool down quickly; hinting at a slow incredible build-up & release of latent warmth. 1998’s El Nino was near a degree warmer & stronger than the one that diminished at the beginning of this year; & this strong La Nina should have cooled the globe more by now; it is about 0.2 degree’s warmer than it was at the end of 1998; & we have had more than the five month lag of cooler than average temperatures in the Equatorial Pacific.

    Not being a professional meteorologist; I have the privilege of observing the climate & drawing my own conclusions; not restricted to one area of expertise; I have a general & instinctive understanding of the global climate; & it is so clear to me; as even Dr Roy Spencer’s anti-meteorology website cannot deny. Recent comments & posts; have expressed the headache global warming critics are going to feel if people get wind of the significance of this near record warmth. Yes; I have the privilege of just saying what I think – Global warming is real – I believe it. You can call it a matter of faith; but I see it as a matter of fact.

    From this liberty that my Amateur study gives me; I can make the wildest predictions; & not be held to account. From my instincts; I find it very likely that we will have a winter that rivals the winter 1962-1963; & I would be unsurprised if the Thames froze. It doesn’t strike me as very likely that this pattern will diminish for the next few months; as the sea & the poles are still very warm; but the La Nina is still very strong. So the difference will remain less between the extremes; and the Jetstream still won’t get its move on; with this lazy flaccid feel; lazily plonking ice-blocks of air where it will in the Northern Hemisphere; and creating dramatic thaws and floods in their wake when warmth finally kicks in on the tropical side; (maybe record warmth.)

    But most alarming; is that even a strong La Nina just isn’t sufficient to cool the globe enough; & heat just keeps building up; like an overactive storage heater. The poles continue to warm; & sea temperatures across the globe in general continue warm and patterns of anomalous weather will continue to move more & more forcefully across the globe. But by five months’ time; (as that is the lag period) we will be under a heavy period of global cooling; caused by the current strong La Nina; & although it has taken 8 months of La Nina conditions by then to do so; it will finally have succeeded to cool the globe as a whole to around average levels. (Yes; so far our strongest La Nina in 23 years by then; will have had to be going for eight months; just to bring the global temperature back to around average (It is still at about 0.3C above now)).

    I also instinctively see that once the globe does finally get to around average warmth; the Jetstream will likely tighten up again; (though it may not; & if it doesn’t; the current continental trend in the UK will continue) but if the Jetstream does go back to normal; it is likely that there will be very severe floods this spring in Europe along its path; & I suspect a slow increase in uniformity in the Jetstream as the globe cools slightly through the spring; hopefully to include the poles. This may not say much for the UK summer though; & that might allow for a 2007 style deluge to occur at one point if the Jetstream is stronger in the summer. So in a nut-shell – it might be European floods in spring; & a disappointing summer here; unless we are lucky and something pushes the stronger Jetstream unusually far north. (But Scotland will still get it.) I give this as the most likely scenario – there will be hot spells; but the summer will be characterised by “normal” (seemingly cooler & more unsettled) weather.

    But if this optimistic prediction doesn’t come true; (& the climate pattern is nearer what it is now); & the poles stay warm despite this La Nina; & the global waters stay warm; or if the La Nina diminishes unexpectedly; or another El Nino begins; then these anomalous outbreaks of weather will continue; & even once it does return to normal; we will still realise an increased tendency of this pattern occurring over the years to come; & a decrease the periods of so called “normal” climate. The next El Nino that occurs after that will emphasise this pattern even further; & global warming will step up another gear; contrary to the sceptic’s predictions.

    I like the fact that anti-global warming theorists will have to acknowledge the significance of this current warmth; because their own data displays it vehemently; & little more than their rhetoric displays anything else. I believe that the website I follow might have to be the first to acknowledge; from their own data; that they are now convinced by the statistical evidence they themselves are presenting; having denied it in the preceding years.

    None the less; I will also post a copy to them & their soon unhappy SUV’s. In the end; we all have to buy into something if we find it’s the truth; or else we bury our heads in the sand; hiding from the screaming evidence.

  18. Chris G says:

    Olav,
    You have a curious presentation of percentages. The earth is about 33K warmer than it would be without any GHGs. CO2 contributes about 20% of that warming effect. About 1/3 of the CO2 in the atmosphere is anthropogenic in origin.

    Presenting a percentage of CO2 based on its partial density in the atmosphere is somewhat misleading. If it were the only GHG, it would be contributing 100% of the greenhouse effect.

  19. JohnD

    I wrote a rather long four paragraph response to your comment because I am beginning to get a bit concerned. – Concerned – about what is happening in the world of AGW believers and deniers. (Yes I say deniers when it comes to AGW, because I am one) It seems, to me at lest, that those who believe can say what they like, and promote whichever idea they like, while those who are in denial of AGW are quite happy with that scenario as long as they can quote one or two temperatures that quite frankly are irrelevant.

  20. Richard says:

    What is the UAH anomaly? Is it CH4? If so I would guess temperatures get cooler as we go higher. Would that account for the difference?

    Also where do you get the SST data from? Seeing that graph the temperatures are set to drop further.

  21. Chris G says:
    The earth is about 33K warmer than it would be without any GHGs. CO2 contributes about 20% of that warming effect. About 1/3 of the CO2 in the atmosphere is anthropogenic in origin.

    Who told you that then Chris? – The IPCC perhaps or maybe even Dr. Spencer? – Whosoever told you, – I would like to see the proof!-

    Why don’t you just think about it for yourself for a minute? Are air movements on this planet mainly horizontal, or are they vertical?
    Answer:
    They are mainly horizontal. – And what does that mean when talk about atmospheric cooling is concerned?
    1.) It means my friend that the gases in the atmosphere do not cool adiabatically very quickly as they do not ascend. very quickly.
    2.) Air temperature is closely related to pressure. Or are you perhaps denying that it is colder up there in the mountains than down here in the walleyes?
    3.) The term ‘greenhouse gas’ implies that that describes the properties of a gas that can stop or reduce convection.
    It had been proved by 1910 that no such gas existed so now they say it is a misnomer.

    4.) Dr. Spencer has tried to defend the “Greenhouse Effect” but even he seems not to understand what the power of conduction and convection versus radiation is.

    He tried once to tell me that radiation was ¼ of convection. That proved to me that he has not done or taken part in even the simplest of experiments to prove his point.
    The only gas that can be attributed to holding on to warmth is water vapou,r which is a gas that has an adiabatic cooling rate index of its own. – Look it up- if you like-
    To cut it short Cris G, – there is absolutely no proof to support your claim.
    If you disagree, please feel free to post your claim

  22. sHx says:

    Dylan,

    would you care to demonstrate that extended causal connection/s in weather and climate patterns as a mathematical formula for those who understand such things? Have you considered submitting it to Nature for publication?

    As it is, I am sorry to say it reads like a horoscope piece for a climate-fiction magazine.

  23. Ray says:

    Chris G:
    “Look, the 2010 anomaly is dropping, but it is still positive. A positive anomaly means that it is still warmer than the baseline. So, I’m not sure where any talk of cooling is coming from.
    Can’t figure why everyone is so excited about any one or two years.”
    It depends on the periods you are comparing. The anomaly figure is the differential between any month and the 1978-98 average, not a rate of warming. Naturally, the mean anomaly for the period 1978-98 is approximately zero, but that doesn’t mean it wasn’t warmer relative to say 1878-98. The anomaly for 1978-88 was negative, but that doesn’t mean it was getting cooler during that period. I am not sure if there is an absolute temp. figure for 1978-98 based on UAH, but if it was say 14c (it doesn’t really matter what it was), the absolute temp. for Jan-Feb 2010 was 14.63c, and that for Sep-Nov was 14.47c. That is cooling in absolute terms, albeit only over a probably insignificant 3 month period. More significant, I think is that the absolute temp. for Jan-Nov 1998 was 14.54c, while that for Jan-Nov 2010 is 14.53c. While that isn’t cooling, it certainly isn’t warming either.
    What will be critical is how the temp. behaves after this year, i.e. will it decline to similar levels that it did after 1998, or continue upwards between El Nino years.

  24. Dylan says:

    Thank you “sHx” for your very detailed & constructive feedback. Sorry if my answer is slightly forthright at times. You ask for a mathematical formula to back up what I am saying. Do I need a mathematical formula to have observed the fact that the Jetstream has changed its feel over 2010 to that of a more flaccid winding feel? I don’t think so? I don’t need a formula to understand that when the Jetstream kinks north; tropical air is pulled up behind it. Nor that if it kinks south; polar air follows it. And I can appreciate how this caused the heat in Eastern Europe & Russia; the floods in Pakistan; & the two cold spells we have had in the UK & Western Europe; in November 2010; & the winter of 2009-2010; I don’t think there is anything unscientific about that?

    When I posted these comments on Paul Hudson’s blog; I was directed by a poster to watch the Climate Show Part 3; Cancun & cooling. They were looking at the 850mb geopotential heights at the current time; & linking this to the current cold spell & also last year’s cold spell in North Western Europe. All these things are already understood without going over the maths. You understand don’t you; the 850mb geopotential heights & its climatology; & realise; do you; that the arctic has had incursions of anomalous warmth; & that continental areas have cooled & heated in their respective seasons? And seen as the next part of my post simply quotes from Dr Roy Spencer’s blog about 2010 in comparison to 1998; that can’t be what you object to.

    It’s not the statement that this is the strongest La Nina for 23 years that you object to is it? That the August-October three month running mean was at its highest level at that time of year since 1988; La Nina’s normally follow a pattern that peaks late in the year doesn’t it? So a colder La Nina earlier in the year is a stronger one? Look at the charts for the El Nino research & observations website since 1960; you will see that I am right.

    Perhaps it’s the next part of my post you object to? The fact that I pointed out that the difference in temperature between the poles & the equator is less than normal? These are matters of fact aren’t they? Sea Ice has been limited of late; La Nina has been strong of late; none of these things you object to I hope? I think you see from 850 mb Geopotential heights; that this has occurred? The fact that there has been a massive bite in the normal pattern of the circumpolar vortex; in the Arctic area around the Greenland area all backs up what I am saying.

    My belief that this pattern will remain in the next few months has been said by commentators since this strongest; earliest cold spell for 17 years hit the UK late last month. The Met Office suggests that this winter will retain this pattern. That’s not done by horoscopes is it? Though I confess; I didn’t have a climate model to hand; except my brain. (God forbid I simply use that).
    You understand then; how I have linked all these events together; the Russian fires; & the Pakistani floods were linked to the position; & snaking nature of the Jetstream – and that this same has caused the heat waves & the colder spells & more of a continental flavour in the climate of the UK these last few years? I think you can appreciate that? I am one of many that have observed this pattern. You don’t object to the fact that I said that the end of 2010 is currently warmer than the end of 1998; despite the fact that it had a strong El Nino; and we are now influenced more by a La Nina? After all; this websites data clearly shows it.

    Oh; I know what you object to. Perhaps it’s the fact that I said I am not a professional meteorologist; that as a result I am not confined by one area of discipline or rhetoric; & that I can make observations based on my instincts; & make predictions by it, that’s what you object to. Is that so very different to the predictions that the Met Office are making for milder winters; whereas others predict that winters will be cooler? The same pattern could go either way. That’s what you object to; I saying it will go the Global Warming way. So; is it the fact that I predicted that the Thames would freeze; that it will be the coldest winter in the UK since 1962-1963; when the Thames last froze solid in some areas? Seen as last year’s UK cold spell started 3 weeks later than this years; though it was the worst winter in 30 years as widely reported; this one is both earlier; & started more harshly; & the blocking high regime that is now in place looks more vigorous & stubborn than last year. Is this not a scientific or mathematical enough conclusion for you? Is it not reasonable to suggest this; seen as my town Brighton has had an average temperature of 0C in the last seven days of November; though I am right on the relatively warm coast? Is it not reasonable than to predict this winter may be worse than last?

    Is it the fact that I say it is likely that the world will cool dramatically over the next five months due to a continued strong La Nina; & it is likely that towards the Spring; the difference between the poles & the Equator will be more again; as the world returns to “normal” temperatures globally; as it takes about 8 months of a strong La Nina to do this in this decade; to simply return the global temperature to average levels globally; & then that it is likely to result in a returning of the pattern of the Jetstream to a stronger more uniform pattern? Come on; that’s not that outrageous. Well; there might not be a formula attached to that prediction; but it is reasonable to suggest it is possible; isn’t it?

    About the summer; 2003 & 2006 broke many records for heat in the UK. Yet 2007 & 2008 had atrocious spells of summer weather. During the settled summers; the Jetstream passed way to the North of the UK; bringing record breaking heat – 2003 had the highest ever UK recorded temperature of 38.5C; (previous record was 37.1 a few years earlier; it had been 36.9 for many years prior to that. 2006 was our hottest ever summer; beating the infamous drought of 1976. Yet some recent summers since have had a very active and rather southerly position in the Jetstream; causing terrible summer floods; particularly in 2007. Central Europe was also struck miserably. Is it not reasonable to suggest that the following summer might follow a more unsettled pattern; as the Jetstream is likely to strengthen & position itself more certainly? Seen as I see how the position & strength of the Jetstream affects our summers; is it not reasonable to make a prediction on that basis; as I am not a professional; just someone giving my view from observation? Is it not reasonable to suggest possibilities of how these patterns will develop over the coming years? Reasonable at least it is I think to suggest them.

    Lastly I would like to point out that the response I got from the website I initially posted these comments to Paul Hudson’s website was not that I was reading a horoscope. The person I spoke to pointed me to a video which I watched that gave some more of the Maths & the Science behind what I am saying. So I suspect your reaction says more about what your position on AGW is; rather than a genuine and thoughtful analysis of someone else’s point of view. On the other hand; I hope this reply shows at least that – I have made a careful analysis on your point of view; not that you had much of one – other than scientific prejudice. So there is my analysis.

  25. sHx says:

    Dear “Dylan,”

    Thank you for another fulsome comment. Reading it has offered fresh challenges and experiences. Evidently you put great time and care into making persuasive arguments. That’s a most respectable virtue.

    Although your analysis strongly resemble what passes for most of climate science nowadays, it is also easy to confuse it with an astrological explanation of cause and effect relationships.

    Still, as Thrasyllus said to Tiberius in…, “the charts never lie”. You may have discovered the cosmic nexus between Climate Science and the Wheel of Fortune. Work on it a bit more.

    Best wishes and good luck.

  26. Paul K2 says:

    I find it interesting that Dr. Spencer didn’t point out the fact that the 13-month rolling average he shows on the figure above, hit a new all time high with the release of the November anomaly. Also the 14 month hit a new record as well. The only rolling average record left hanging on from the big 1998 El Nino result, is the 12 month average and lower. Recent years have bust all the longer rolling averages.

    The most telling rolling averages are the 120 and 180 month (10 year and 15 year) averages. They have been hitting all time highs quite regularly over the last ten years, and unless anomalies really crater into negative territory this La Nina, will likely keep hitting new highs.

  27. At the following I read: (http://www.climate4you.com/GlobalTemperatures.htm#Temporal%20stability%20of%20global%20air%20temperature%20estimates)
    “The UAH MSU temperature record showed a very high degree of temporal stability until February 2010. In March 2010 a correction was introduced (Version 5.3), accounting for a mismatch between the average seasonal cycle produced by the older MSU and the newer AMSU instruments. This affects the value of the individual monthly departures, but does not affect the year to year variations, and thus the overall trend remains the same as in Version 5.2.”
    Now I know this is a very convoluted way of estimating things, but compare the graphs of October and November for 2005 and 2010. They have similar average curves and a similar anomaly. So if you want to guess what the anomaly will be a few days ahead of time, see which other December graph curve from 2002 to 2009 is closest to the December graph curve for 2010 and go from there. If anyone has a better way, please let me know.

  28. JohnD says:

    Olay,
    I am a AGW denier as well, if that clears things up.

  29. Dylan says:

    Thanks sHx;

    I’ll take that as a compliment??? Interesting point you make about “astrological” cause & effect; & I take that point.

    Your last comment was quite funny…

  30. Ray says:

    Paul K2,
    One reason the 13 month average showed a marginal increase is that it includes two November anomaly figures and the Nov. 09 anomaly was relatively high. The 12 month average (a more meaningful average I suggest), showed a fall. The 13 month average should fall next month, and even more rapidly when the very high anomalies for the early part of this year are excluded. In order for the 10 and 15 year averages to fall, anomalies don’t need to be negative, just lower than corresponding month 10 or 15 years ago. Admittedly unlikely in the case of the 15 year one, but quite possible in the case of the 10 year one during 2011 I think.

  31. Christopher Game says:

    Christopher Game replying to Dylan’s posts of December 4, 2010 at 12:40 PM, and of December 5, 2010 at 4:47 AM.

    Dear Dylan,

    I do not see in your posts a reference to carbon dioxide. Nor your explanation of the causes and timing of the El Niño and La Niña events, nor of the cause of the Great Pacific Multidecadal Oscillation, nor of the connection between the sunspot cycle and the climate.

    Yours sincerely,

    Christopher Game

  32. Dylan says:

    Dear Christopher;

    You’re right; those topics were not referred to in my posts were copied to this website as a matter of interest or debate, but they were intended in reply to Paul Hudson’s blog; which references some of the data from this website; and was looking at the likelihood of 2010 beating the 1998 record. I was not intending to argue about AGW; just simply to observe patterns I have seen in the Jetstream & how that has affected the climate in the Northern Hemisphere during the last year or two; & how it might go on affecting us.

    Then I mentioned how someone posting on the BBC website pointed me to the current 850mb geopotential heights chart; & I linked this to the patterns we have seen in the Jetstream. I’m looking more generally at the climate as an observer; not trying to argue my point; as is extremely clear; right from the start of my post.

    None the less; to refer to the matters you mentioned; as I didn’t intend to argue; I will just state that with reference to carbon dioxide concentration; I do accept AGW; so I lean towards the idea that human emissions & an increased concentration of carbon dioxide; are causing global warming; though I have looked at the arguments against this; & I do not accept they are strong.

    With reference to the Pacific Multidecadal Oscillation; I understand the theory; & I do find it interesting; but I see it as just that. We cannot be sure what happened prior to taking reliable measurements; we can only extrapolate backwards; & the person extrapolating will use bias from their own take. I do not believe that there will be a diminishing of the El Nino in the coming 30 or so years; though I accept that this La Nina is the strongest for 23 years; and I accept that there has been an alteration of their frequency. But my feeling is that the warming we see is very unnatural in its appearance; & most logically was caused by urbanisation. To put it in a simple geometric way; which will probably not satisfy your question – but will explain what I see; I look at climate data from things like the ice records; & look at past dramatic shifts in climate; that have been chaotic & sudden; whereas I see this shift as strangely uniform over the last 35 years; & it is clear there is a slow steady build-up of heat. Simply put; it seems unnatural.

    Even when you look at recorded global temperature data; it seems there is a too steady incline of late that has picked up from underneath the usual up & down chaotic trends. I accept the correlation between the frequencies of El Nino & La Nina & the global temperature; but as I said in my last post; recent La Nina’s do not seem to be enough to cool the earth down; as if there is an accumulation of warmth; & an underlying trend of warming makes progressive La Nina’s affect the anomaly less & less. Likewise; smaller & smaller El Nino’s make a bigger effect; as we are seeing from 2010. The El Nino was weaker; a La Nina picked up; yet we still rival the strongest El Nino year on record.

    It is quite clear to me that this process will go on regardless of how optimistic opponents of AGW are. Even if there is an increased frequency of La Nina’s now; in the next 30 years; there will at best be a stabilising of Global Warming. La Nina’s are no longer enough to mitigate the underlying trend of warming. This is based on my own forecasting; & based on observing the trend over recent years; just like when we see that a depression moves towards us; we can predict some days in advance how it will behave. So with that same observational skill; I can see that there is an underlying trend of warming; & I am certain that we will see this warming continue.

    I would adhere to the all too ubiquitous; but no less correct predictions; that proponents of AGW have been making. Obviously the proof will be in the pudding. I do not think there will now be an increase in La Nina’s – or that even if there were; I do not think that this would then fail to still reveal an underlying trend of warming over the next few decades. And I will have to go on observing; and see for myself. Just because AGW has been popular; & now it is much more popular to question it; doesn’t make that view wrong; & from my observation; it is correct; nothing I see contradicts it; & I don’t have to look for evidence; it always presents itself to me.

    The same applies to the effect of sunspot cycles. Even when there is a cooling affect; it is not sufficient to diminish the overall underlying warming trend. And warming trends caused by an increase of solar activity have tended to be more & more significant. So I understand all the variation; but none of that alters the fact that even if there is an increase of La Nina frequency; & an even if there is a decrease of warming from reduced solar activity; & probably even if there were a massive eruption that had a two year cooling effect on the globe; none of that would alter the fact that the best we could hope for would be a temporary reduction in temperature like that that we saw about the middle of the twentieth century; a reduction that will always be less than expected; & then there will always be a jump start; & a steady increase in temperature as soon as whatever cooling phenomenon occurs passes; or once the next warming phenomenon occurs; & it will always be just that little more than the cooling. That is what has already been happening thus far.

    Now I mean this in the nicest possible way…

    Basically; what I’m saying in a fantastic nutshell; is that opponents of AGW; are simply going to face a long; slow; & painful death; & in that sense; it will really be a tragic existence; of slowly & progressively being proved wrong by their own data; that they are obsessed by; & scrutinise to back up their point. AGW opponents would not have expected 2010 to be quite so significant; AGW proponents were the ones predicting 2010 would be the warmest year; yet they were duped by the El Nino that was still quite strong at that time.

    So; please! Come on; Anti-AGW society! Turn to the light; before embarrassment comes; & it’s too late; & you are caught with you scientific pants down!!!

    I’m just kidding; but I’m sure you hear my point.

  33. aarik says:

    it’s CURTAINS U.S.A America
    silver race granddaddy con/demed
    grandaddy is my granddad
    CUNT CUNT CUNT
    left wing journalist ’72
    CUNT
    now grandaddy is a republican
    grandaddy is a republican oh
    grandaddy did a pooh pooh
    in my CUNT CUNT CUNT
    and
    daddies daddy did a faeces
    beefy CURTAINS
    CURTAINS CURTAINS

  34. Paul K2 says:

    Ray, regarding the 13 month average etc., I actually prefer the longer averages, since the UAH anomalies have been shown to be strongly correlated with El Nino cycle. The 12 month and shorter averages, simply represent heat flux of thermal energy into the atmosphere during the El Nino, and more appropriately should be considered an indicator of how strong an El Nino has occurred. The 12 month average doesn’t give a lot of evidence of a temperature trend in the atmosphere (that presumably can be correlated with the heat building up on the planet).

    Incidentally, the 13-month, 14-month, and 24-month rolling averages all hit new highs in the last several months, and only the 12-month average or less from the 1998 period still holds the record (although a coin toss would be as meaningful in determining which year was hotter; which is to say, statistically insignificant). The high anomalies from 1998 clearly seem to signal the very strong El Nino heat flux into the atmosphere that year, and not much more than that.

  35. Fernando says:

    Unfortunately,

    At the beginning I have released 1 / 24 hours for the fascinating theme climatology.

    Today. I know 24/24. Not enough to understand all details of global UAH … (simple… fernando.phd … is not capable)

    Fact that apparently is a contradiction. In reality it is not.

    I believe

    It is a sufficient condition.

    Evidently,

    There is an option.

    No statistically significant warming (by Phil)

    reminiscing ….

    Should you believe anything John Christy and Roy Spencer say?

    Yes, I believe

    http://climateprogress.org/2008/05/22/should-you-believe-anything-john-christy-or-roy-spencer-say/

  36. RW says:

    Dr. Roy (and/or anyone else),

    This is a little off topic, but I’m wondering if I could get your opinion on this:

    Physicist George White has presented a relatively simplistic analysis of climate sensitivity that is basically this:

    The average incident solar energy is about 340 W/m^2. If you subtract the effect of the earth’s albedo (about 30% or 0.3 = 102 W/m^2), you get a net incident solar energy of about 238 W/m^2 (340 – 102 = 238). (*The albedo is the amount of incoming short wave radiation from the sun that gets reflected back out to space off of clouds, snow, ice, etc., and most importantly cannot be absorbed by GHGs or contribute to the greenhouse effect, which is why it’s subtracted out).

    From this you take the surface power at the current average global temperature of 288K, which is about 390 W/m^2 (from Stefan Boltzman), and with it you can calculate the gain or the amount of surface warming as a result of GHGs in the atmosphere. To get this you divide the current surface power by the net incident solar power, which comes to about 1.6 (390/238 = 1.6). What this means is that for each 1 W/m^2 of solar input, you get 1.6 W/m^2 of power at the surface due to the presence of GHGs and clouds in the atmosphere – a boost of about 60%. This accounts for all feedbacks, positive and negative, known and unknown, because its an aggregate empirically measured response.

    A doubling of CO2 alone absorbs only about 4 W/m^2 of additional power. About half this is directed upward out to space and the other half is directed downward toward the surface, resulting in a net of about 2 W/m^2. If you then multiply this additional 2 W/m^2 of power by the same gain calculated for solar power (as a result of the greenhouse effect), you get an increase in the surface power of about 3.2 W/m^2 from a doubling of CO2 (2 x 1.6 = 3.2). Using Stefan Boltzman, an additional 3.2 W/m^2 will increase the surface temperature only about 0.6 degrees C (390 + 3.2 = 393.2 W/m^2 = 288.6K). This is much less than the 3 degrees C predicted by the IPCC. Even if you assume all of the 4 W/m^2 from a doubling of CO2 goes to the surface, the temperature increase would still only be 1.2 degrees C – significantly less than the low end of the IPCC’s claimed range of 2 – 4.5 C.

    To get the 3 degrees C claimed by the IPCC, an additional 16 W/m^2 would be needed. This requires a gain of 8 rather than 1.6 (or at least a gain of 4 instead of 1.6 if we assume all of the absorbed power is directed back to the surface). The bottom line is the actual response of atmosphere (from GHGs and clouds) relative to average incident solar power, measured in W/m^2, is far less than the response claimed by the IPCC from a doubling of CO2, which is also measured in W/m^2. A watt/meter squared of power is watt/meter squared of power – whether it’s from the Sun, or redirected back to the surface as a result of more CO2 in the atmosphere.

    In short, this strongly suggests an upper limit of only about 0.6 C from a doubling of CO2, and that the 3 degrees C claimed by the IPCC is way out of bounds. Also, the amount of perturbation involved is absolutely tiny – only 2 W/m^2 from a doubling of CO2 (at most 4 W/m^2 ) out of an existing total of 238 W/m^2 (less than 1 %). It’s doesn’t seem logical that the system is somehow all the sudden going to treat such a small increase radically differently than it does the original 99+ percent. Highly doubtful to say the least.

    Your thoughts?

  37. TO DYLAN

    LETS TALK ABOUT ITEMS THAT CONTROL THE CLIMATE

    SUN

    The sun’s activity did not start a significant decline
    until Oct.2005, and prior to that time it was mostly very very active. One has to appreciate the cumulative effect a weak sun will have on the climate, along with a substancial lag time, of most likely 5 to 30 years. These things need time to play out.
    In addition the sun is presently having an impact on the climate, by causing the atmospheric circulation to be much more merdional, then it would be otherwise, due to the fact when solar activity is weak, the polar stratosphere tends to warm relative to the stratosphere in lower latitudes giving a tendency for the AO/NAO to be more negative.

    It will be very interesting going forward to see how deep and long this present solar minimum will be. I like to look at the solar flux and k index values to see what kind of an impact the sun is having on our atmosphere.

    VOLCANOS – Again a lag time of at least a year and where the activity is ,is very important,because when volcanos erupt in the high latitudes and eject SO2 into the atm. they again will cause the stratosphere to warm more in the polar regions ,in contrast to lower latitudes. Again a more meridional circulation. In contrast, if they should happen in low latitudes a more zonal circulation will happen, and on another note ,volcanic eruptions in lower latitudes tend to promote El Nino’s as oppossed to La Nina’s.

    IF ONE GOES BACK IN HISTORY ONE WILL SEE A CORRELATION OF INCREASED VOLCANIC ACTIVITY DURING PROLONG SOLAR MINIMUMS.

    SOI OSCILLATION- This also seems to be tied into solar activity to some degree with La Nina ,much more likely during long solar minimums. La Nina’s will serve to cool the earth’s atmosphere, but has a lag time of 7 to 9 months.

    PDO/AMO -PDO now in cold phase ,again lag times have to be appreciated, and the up shot is this cold PDO phase will serve to bring global temperatures down over the coming years. Again lag time. AMO ,should start it’s cold phase by year 2015.

    These are the factors that control the climate and they have a much greater impact in the N.H., in contrast to the S.H. because of the distribution of land versus ocean. Also most of the active volcanos in the high latitudes ,are located in the N.H.

    ALBEDO CHANGES- Again lag time, and it will happen to a much greater degree in the N.H. due to the large expanse of land area which has a low specific heat compared to water and whose surface can change from soil cover, to snow cover very quickly.
    This ties in with the more meridional circulation which will promote more N.H. land areas to be covered by more ice/snow ,then if the atmospheric circulation was more zonal.

    I predict if solar activity remains as is, this will be the decade of global cooling. We have entered the first phase which is the LESS ZONAL atm. circulation.SECOND PHASE will be when the pressure heights start to lower over the entire globe, which I think will start soon, but the pressure heights, will lower more in the mid latitudes, contrasted to the poles.

    LASTLY -CO2 has no effect on the climate. All one has to do ,is go back in history, to see that is true. Just look at the CO2 levels during the Ordovcian Period or Carboniferous Period, or more recent ,just look at the sudden drastic temp. changes independent of CO2, a recent example of this being the Younga Dryas.

  38. Mark says:

    Fact, Ireland and the U.K have had record Breaking Low temperatures for November and December 2010! And they go way further back than any satellite! There may even have been snow records broken for the time of year too, though I can’t verify that!

    I am not an expert on meteorology or climatologist, But winter 2010, Jan-Feb and Nov-Dec have caused havoc across the U.K and Ireland, And caused many deaths throughout Europe.

    Now I ask the so called experts, If the earth warms by 2 Degrees Celsius or Fahrenheit,in 50-100 years or whatever, will it really cause the misery that snow and Ice cause to mankind? Who Cares? the general public Do NOT care! That is a FACT.

    It’s laughable to the general public that scientists rely so much on computer models, and not good old fashioned science. What if the information fed to these computers is wrong? How can a computer model predict the average global temperature in 50-100 years when they can barely get 5 days weather right? Funny stuff! Yeah I’ve heard the weather is not climate argument, From the Oxford English Dictionary, Climate =”the weather conditions prevailing in an area in general or over a long period:our cold, wet climate”

    We in the E.U pay the HIGHEST TAXES on fuel in the entire world, and that is unacceptable. It’s costing people dearly to travel just to work and back every week. It costs me €75-00 to fill up my car with Diesel a week, That is a disgrace. Carbon tax is a disgrace!

    I believe in alternative energy, and research into renewable energy! No problem.

    Most people don’t want to hear about global warming and it’s annoying at this stage. The general public are not fools and please don’t treat us like fools! We know there are organisations benefiting significantly from funding that is allocated to them and will come out with any waffle to justify their funding.

    And hearing of adjustments to measurements in temperature data makes me crazy, adjustments tell me they can alter data whatever way they want!

    To think that some scientists can say that the cold in Europe last winter was caused by global warming is really funny!

    No more co2 arguments please, instead, there are more important issues like the effects of nano particles, nuclear waste, pollution to water systems, causes of cancer, uses of chemicals, starving people, air quality, the still dangers of Chernobyl,

    Mark

  39. Dylan says:

    To Salvatore;

    I have read all your individual points & have taken them all into consideration. I accept the majority of what you are saying; I just anticipate that human impact has not been taken into consideration here. Your predictions rely on all of these factors conspiring together to create a cooling. But no-one can really have reached this conclusion yet; in a year that is rivalling the warmest ever. Let’s take that year; 1998. Solar maximum was probably about 5 – 7 years prior to that; so not only did the El Nino create warming; a stronger one by far than the latest one; but perhaps that Solar Maximum may have warmed that year to – by your own figures. On the other hand; 2010 was about 5 years after a solar minimum; & not only was the El Nino shorter; & less strong; but a La Nina developed during that time. I recognise the lag as about 5 months on cooling; not more. So these things should have conspired to reduce the year’s temperature. Of course; you cannot define this on one year; but there have been many such examples. It seems everything other than the obvious must be conspiring to warm the year 2010; seen as it is one of the warmest; yet El Nino & Sunspot influence was much less in that year. How exceptional then this year is? And how optimistic you are that all these factors will conspire to cool the climate now? So even if what you are saying about long term cycles is true; 2010 must be a bit of a fly in the ointment for you hey? Solar minimum; less El Nino; an increase of recent La Nina incidents since 2007 really; yet Oceans are still warm; so is the land. How much faith you have that it will now suddenly cool down? We had two weak El Nino’s in the year 2004; yet that was enough to create the rival warm year of 2005.

    About Volcanic activity; I understand that there has been an increase in volcanic emissions; which should by your reckoning create an increase in El Nino phenomenon over the coming years? But then you would defer to the Multi-Decadal Oscillation. But the above facts are so far contradicting this; so you are looking to 2015 in your own words; to really see the impact. Here’s hoping??? There are many Oscillations like this that affect the climate; let’s just hope they all conspire together to go your way hey? But aren’t you rather clasping after the wind? Albedo changes – yes – if all these things conspire together to create cooling; then I accept your point. But to me that will fall flat on its face at the first hurdle. If there is not this predicted cooling; then neither will Albedo changes be significant; likewise; if these things don’t occur – then there is an equal – no – not equal; greater chance of all these things conspiring to create additional warming.

    Lastly; seen as you put it so curtly put your conclusion on Carbon emissions; I will do the same. You are wrong; Man-made emissions are creating warming. Human activities are affecting the climate. You just refuse to believe that; because it’s not ideal for you – for whatever reason.

    So here’s a question; just what it take for them to accept it? How long will AGW deniers go on denying in the face of evidence if the warming continues??? 5; 10; 20 years?

    What explanation will be given for the next record breaking year over the next half a decade?

    Though it tarries you think – no – smell the coffee; it isn’t tarrying; this cooling won’t ever come.

    There was a brief tarry in the warming; over last few years; (before this one at least) & all those who were looking for evidence contradicting Global Warming grasped that & allowed themselves to be duped by that. And they are seeking more and more evidence that points to a cooling that has happened. As that evaporates; they seek cooling that will happen. As that evaporates; they seek cooling that will eventually emerge; & claim that Global warming is – but it is natural. Eventually; they are left isolated & clutching at straws. And I’m sorry for that.

    I’m sorry there are lazy moments in this reply. As I said; I never intended to argue about Global Warming; I was just making observations. It was not intended for this website; but another.

  40. Dylan, time is needed, that is my first point. Solar activity did not start a significant decline until late 2005.

    This man made global warming due to increase CO2 , I say no way ,and here are my reasons.

    First ,if one goes back just to 1690 to the present, the temperature rise from 1700-1800 was greater then the temperature rise from 1900-2000, when man’s influence was nill.

    Secondly ,if CO2 were the cause it would lead the temperature rise, not follow it.

    Third ,CO2 is only 390 ppm, and it has only increaed 100 ppm over the past 100 years. I find it hard to believe, that the earth’s climate system is that sensitive to CO2. If it were, why has it not shown this in the past ,when many changes in the earth’s temperature were much greater then the recent warming, and moved independently of CO2 concentrations.

    Fourth -The models predicted a lower trop. hot spot near the equator due to the so called positve feedback between CO2/increase water vapor, due to more latent hear release. To date it is missing in action.

    Fifth-CO2 and water vapor absorb long wave radiation in many similar wavelengths, and even more important, the wave lengths they absorb longwave radiation in, are already saturated, so that adding additional CO2 will have very little further effect in this absorption, of these longwave radiation wavelengths.

    SIXTH- how do you account for dramatic temperature swings on the order of 7c in the past in a space of 5 to 10 years both up and down. The Younga Dryas ,being a great example, if the earth’s climate is so sensitve to CO2?

    SEVENTH- the earth’s temp. today is still lower then it was during many time periods over the last 8000 years. Romen,Minoan ,time periods for example.

    In closing I am confident if solar activity stays as is, this wil be the decade of global cooling. Only time will tell who is right and who is wrong.

  41. Dylan says:

    To Salvatore;

    I don’t think you can be sure we are entering a significant decline in Solar Activity; it is currently building as one would expect? There’s nothing to say that the next peak after this coming one won’t be higher; though there may be a long term decline. Yeah – you’re right – well too early to say. Think you’ll be waiting a while for that one? Maybe thirty years at least for a significant decline?

    The temperature record – the warming of the 18th Century was caused by the earth emerging from a cold period. As you rightly point out; changes can appear suddenly; as if they are perhaps pent up for some reason; a bit like the passage of a cold front or in this case a warm front on a day to day meteorological basis. That warming was the earth recovering from the little Ice Age; so using my analogy; you point to the time that the warm front passed.

    You say that CO2 concentration followed temperature rise; but I totally refute that. After the words recovery from the little Ice Age; Warming really took off in the early part of the twentieth century; whereas CO2 concentration broke a thousand year record soon after the mid nineteenth century and has steadily increased ever since. I would argue that CO2 leads the temperature rise; not the other way round.

    Your next point again is a matter of interpretation of data. Low CO2 concentration coincided with lower temperature; & much higher concentration in natural history coincided with warm times. There is far more evidence in the records that they align themselves then that they diverge. However; there is a massive margin of error; thus people can spin it how they will. It can confirm the link & refute it. It depends on who is arguing. My view is that CO2 has a clear & direct bearing on the global temperature.

    Point four; you will certainly find examples of errors when so much information has been gathered from so many sources. If I look for anything I will find it. But to me the overwhelming tide of evidence shows that models have predicted the warming accurately. The majority of Science backs it up; but you will site the few examples that won’t. Many more do though. Any model could have any error – & every model has errors. But the majority of models point to on-going warming. The consensus is far more towards AGW than against. But you work far harder – as you have to – to find evidence of the dispute.

    Point 5; how long has it reached saturation for? Because so far over the last 100 years; increased concentration of CO2 has occurred alongside warming. How do you account for the warming we have just seen then? How do you account for the fact that 2010 is one of the hottest ever years? So far – it seems that the more CO2 is added; the warmer it gets. The facts contradict your analysis – it is still warming; according to the increase of CO2. That warming has never diminished. You must smooth out 1998 as it had a record breaking El Nino. You cannot account for 2010’s warmth; due to Solar minimum & relatively weak El Nino + developing La Nina.

    So far; the facts contradict your analysis; & you are waiting on cloud 9 to see it finally works for you. You can say that CO2 concentration isn’t warming the planet; as much as I can say the Grass is blue. But the fact is; the planet is getting warmer & there is a steady of increase of CO2. They have diverged very little; & boy do you have to hunt & re-interpret to show that they have. If they do for a significant enough period; only then have you any true evidence to back up your claim. Whereas without evidence to the contrary; I have much evidence to support it.

    Point 6; I recognise much of the changes in the last as much more chaotic than the current smooth & unnatural incline in temperature. You are right; previously the climate went through very jagged and angular changes; with some very sudden ones; just as you mentioned.

    In that sense it is like a wild growing olive tree; with many points & little uniformity. How do you now account then; for the two smooth inclines of warming in the last 100 years? It is like a neatly trimmed bush; crafted geometrically by the hand of a man to me. From a yo-yo like trend of intermittent warm & cold years & periods; we now go on a smooth incline of gentle up & downs; (with an underlying up) which is not explained by normal natural variation. If this were such a sudden 5 or 7 year change; then perhaps we could explain it in a like manner.

    Point 7; I refute that! Only if you look at the extreme of the margin of error can we see that the last few years were not warmer than at any other time in the last 8000 years! Some models suggest it was warmer at some periods; but the consensus suggests that we have now just peaked above the warmest such period; about when you say – 8000 years ago. But go on; dig around; you will find some convincing & deceptive arguments. I of course; just need to open my eyes & I will constantly see what I believe I will see – evidence supporting AGW.

    “In closing I am confident if solar activity stays as is, this wil be the decade of global cooling. Only time will tell who is right and who is wrong.”

    But for me; I don’t need time only to tell me; also the current time tells me; it is the warmest year on record. There are fewer reasons to explain the warmth of this year – there were many such explanations for 1998. I really think it is unfortunate, don’t bury your head in the sand!

    Anyway; you seem to know your facts; and if I wanted to argue against AGW; I would use your points. But I would have to delude myself – genuinely – before I could deny what my eyes plainly see – not in 5; 10 years’ time; but right now; & in the last few decades. I’m not waiting for anything – it is already here. Can’t you see that?

  42. Dylan says:

    Now I see!

    This website is the Global Warming Tea-Party; its little revival of odd-bods with very little continuity drawn together in one purpose to oppose the grounds of reason!!!

    Scraping around for any ammunition they can find on the battle field in its little archaic revival.

    Open your eyes & see; this is just a relic of the battle field. Most of the ammo is empty shells.

    The battle really is won & lost already; but one nostalgic leap into the past aided by climate-gate gives you a little false hope – for a little while.

    You always wait for the evidence that I already see. “a few more years” you say; but mine is already here – 2010: By far the warmest ever year; (taking out the El Nino impact of 1998; & adding the solar minimum impact of 2010) by far the warmest year. No doubt next year will be the warmest ever strong La Nina year.

    But we’ll over look that & call it more proof of global cooling; the ostriches we are!!!!

    Only in America would such archaic & self-interested thinking be quite so liberated & scrutinised.

  43. Dylan says:

    unscrutinised should I say…

  44. Massimo PORZIO says:

    Hi Salvatore,
    maybe you are Italian as I am, but we are guests of an English language blog, so I write you in my bad English.

    As they would say, I tell you: drop the ball!

    Dylan seems to be a “master” of the climate science knowledge. He got the truth, you can’t fight the truth, you are a loser.

    I avoided to reply your posts Dylan, but I ask just one favor from you please:
    don’t call us “deniers” because a denier is one who knowing the truth still professes falsity.

    I prefer you call us “heretics”, because we are just opposed to the “believers” like you are.

    Science pertains the pursuit of truth and when the truth is reached it’s easily explainable. If you really know the causality between the carbon dioxide and the current global warming, well we are all awaiting for such explanation.

    Only one more thing I would say to you:
    I’m an electronic engineer having more than 20 years of electronic design over my shoulders, if in my designs I used such superficiality in measurements as the one used by the “consensus”, I probably went to live under the bridges.

    You are on your side, and I respect you.
    Please have respect to us too, and don’t believe we are all evils souls from hell.
    Have a nice day.

    Massimo

  45. Dylan says:

    Oh; I assure you; I think of you not as evil; just a little misguided?

    AGW deniers is a term I learned from this website; so I didn’t label them as such; some of them labelled themselves as such; I simply quote them. One recent posts states that “I am an AGW denier if that helps” Well; it did on this point – so I suggest you take up your concern with them.

    You say; Science pertains to the pursuit of truth; yes; & far more of that Science convincingly points to AGW. You say you await proof of Carbon emission related AGW; but we have a much longer wait for proof that contradicts AGW. To me what I have seen is far closer to proof than that which contradicts it.

    You don’t just go blindly with the consensus; that is good & that is right. But neither is it necessarily prudent to constantly drive too far out in the extremes; as opponents of AGW do. You cannot gain much to back up your claim from the consensus. It is not always right – but do mark – it will be better & more accurate than that which contradicts it.

    Not having respect for you is not the same as wanting to put forth my view. I do not mean to disrespect any of you. I’m just that convicted; that certain & that sure of my view. You say that is a matter of faith; but it isn’t. Science backs it up. It is not faith that convinces me of manmade Global Warming; it is evidence. It is not astrologically derived; it is derived from the statistics.

    It is much easier to defend AGW than to deny it.

  46. Dylan, this is good give and take,and you have some sincere views,that are different then mine. That is what makes this climate arena so great, the large difference in opinion, on how one looks at data, how one views data ,and the difference in opinion one draws from the data, going forward.

    The main errors of your ways, from my viewpoint, are as follows:

    FIRST- You cannot understand the lag times that are involved ,thing have to play out ,it is not instant.

    SECONDLY- The SUN is very likey to have a Dalton ,if not a Maunder type minimum, and I dare you to show me one period in earth’s history when solar activity of that scale, did not result in much lower temperatures. Solar predictions have been quite poor, to say the least by the mainstream scientist that make such predictions.

    THIRD- One of my corner stones of cooling is an increase in volcanic activity associated with prolong low solar activity. Past history shows this to be likely. So the excuse that any cooling is due to volcanic activity ,independent of solar activity will not fly. The other cornerstone, is the more meridional circulation due to low solar activity ,and the possible albedo positive feedback this might create for the N.H.

    FOURTH AND MOST IMPORTANT- All the factors that I am mentioning now, that being SOLAR/VOLCANIC,PDO/AMO,SOI OSCILLATION ,AO ,NAO OSCILLATIONS ,can be shown to be largely responsible for the warming last century because all of these oscillations, were mostly in a warm phase last century , while the sun was very active, and volcanic activity low.

    FIFTH- This situation has now BEGUN to change, and any warming we my have had up to now is a result of the lingering lag times, although most people that look at the temp. data say it has leveled off since 2002, and has actually been on slight decline since that time.

    SIXTH- Almost every temp spike over the last few decades can be associated with a strong EL NINO, including the temp. spike earlier this year. It is funny, as CO2 keeps increasing, the temperature which according to your camp, which is so SENSITIVE to it, does not correlate with it, very well. It is funny ,how the El NINO activity, just has so much more influence. To take this further ,it is strange ,that as CO2 keeps increasing ,the temperature increase does not follow, it has had periods in the last century where it declined, such as 1940-1970. I would not make a big deal of that, if it were not for the fact that your side keeps saying how SENSITIVE earth’s climate is to CO2. If it is so SENSITIVE ,why do other events keep conteracting it? I mean CO2 is where it is at,according to your side.

    EIGHT- THE PHONY POSITIVE FEEDBACKS- This is the biggest joke of all. Clouds are being shown to have a negative feedback, and there is no sign of a increase water vapor /increase CO2, positive feedback.

    NINTH- Please explain why the sea ice in Antarctica is increasing, and temperatures there are below normal ,if CO2 is causing the earth’s temperatures to go up.

    I WILL MAKE THIS BOLD PREDICTION

    The monthly global temperature trend will continue in a downward trend over the coming months, let us see who is right,who is wrong. LAG TIMES,REMEMBER THAT.

  47. DYLAN. One last point from reading what you last said, you are acting as if this warming, even worse, this degree of warming has never happened before ,while the reality is, it has happend many times, and to make matters worse for your side, why has it reversed in the past?
    I would think from your point of view ,once a CO2 increase got going with it’s associated phony positive feedbacks ,that it would keep going, but that never has happened. Why? Explain that to me.

    CO2 follows the temperature, show me one chart that shows CO2 leading the temperature. I want to see it. Of course CO2 will increase when the temp. goes up ,due to the temperatures going up ,not the temperatures going up, due to the increase in CO2.

    It is basic science, that the warmer the ocean ,the less CO2 it can hold, that accounts for much of the CO2 increase when temperatures rise.

    Lasty, how do you explain the Ice Age some 400 million years ago when CO2 concentrations were 4000ppm. Maybe you believe this to be false? Is that your explanation?

  48. DYLAN, I look forward to more conversations. Here is my email [email protected].

    Feel free to email me anytime. I enjoy talking with you about this subject. You know your stuff quite well, that is for sure even, though we don’t agree on what will be happening to the temperatures going forward.

    Look at it this way, if we all agreed, we could not have these good conversations, there would be nothing to talk about ,or think about.

    I am done for today, to much writing. Take Care

  49. Massimo PORZIO says:

    Dylan,
    you wrote: “You say you await proof of Carbon emission related AGW; but we have a much longer wait for proof that contradicts AGW. To me what I have seen is far closer to proof than that which contradicts it.”
    So, let me understand: one shot an absurd statement, then he get the “consensus” of some dozens of friends without giving any proof of the truth of his statement, and now are the others who should disprove his statement?
    Sorry, that’s not really the pursuit of truth. If you get the truth via your theory then tell me clearly how it works, don’t expect me to disprove your theory to confirm that you are right.
    In the climate arena I read of people writing about Bode theory without having the minimal professionalism to understand what “feedback” really means.
    That’s just one of the craziness I read about some “scientist” who want to silence people like me because “we are not so smart to understand their points, so they don’t tell us anything at all”

    About the statistics which convinced you:
    “Statistics” made Prozac and many SSRI wonder drugs to heal depression, but the reality is that they are not different from MDMA (Ecstasy), they kill the brain.
    Statistics must be taken with respect, but must be judged in full cognition of the facts, only that way statistics became science in my point of view.

    Anyways, I’ve no time to spend on this argument.

    I return in silence.

    Have a nice day.

    Massimo

  50. DYLAN Back for one more time,other items you can’t seem to grasp in addition to lag times, are the cumulative effect these items have, along with the degree of magnitude/duration, the items I say control the climate phase into and persist, that being the cold or warm phase, which in my book can account for all of the temperature variations.

    Also ,I think if the items I have mentioned phase long enough, and to a certain x magnitude, a threashold can be reached ,which then could explain the rapid temperature swings both up and down, from time to time in the past. The reasons why I think the temperatures much of the time don’t change much or move gradual, is because the items I think control the climate,do not change in magnitude enough or persist long enough, or phase in properly in the same direction often enough, to allow that to happen. Why? Because,everything is random, and chaotic ,and only sometimes,do things come together to create a dramatic change.

    I also think Milankovitch cycles ,have some influence ,but limited, on the climate.

    That is my two cents.

  51. Dylan says:

    To Salvatore & Massimo;

    Thank you for your comments; I am interested to read them; & have been looking at the issues with interest; I look forward to addressing them; but do not have time to cover them fully now; but I will do so over the coming day or so. To give you an indication; I will explore your individual points; & after I have looked at them all; I will also pose the question; what happens when the unknown factor occurs?

    You understand that there is a natural link between temperature & CO2; & you show that an increase of temperature is understood to release CO2 into the atmosphere; & increase its concentration; making it appear that Temps cause CO2 to increase; & it does not work the other way with a feedback effect.

    But what happens if you tamper with that natural correlation? That tampering being; we add our own personal contribution of 100 CO2 (ppmv) ourselves to the usual natural mix; in a very short time period; ballooning it? We can only surmise what may happen; but we do know at least that it has increased for our sakes. Being as that you acknowledge a relationship between CO2 & temperature; whichever way it arises; (if not both ways – both exacerbating each other) doesn’t it frighten you that we have swelled it so much; so unnaturally; in such a short time?

    Anyhow; this is in no way a satisfactory response; I will come forthwith as I am able. Any additional points I will address together at that time. If nothing else; this will strengthen my understanding & sharpen my argument – if that is what is needed…

  52. Dylan says:

    Sorry – to be clear – in my second paragraph; when I say; “”making it appear that Temps cause CO2 to increase; & it does not work the other way with a feedback effect.”” I imagining your argument here; my argument is that both temperature & CO2 augment each other.

  53. DYLAN, I am looking forward to what you have to say. Thanks.

  54. Massimo PORZIO says:

    Dylan,you wrote:
    “my argument is that both temperature & CO2 augment each other.”
    If you were right that’s the typical cat who bites its tail.
    I’m not sure you can understand the statement above, but here in Italy that’s the way we say when we talk about processes which never end at all. To be valid your statement (and it could be indeed, I’ve no proof to demonstrate you are wrong here), it must exist a negative feedback greater than the positive one, otherwise the system is always in a runaway state, doesn’t matter the level of C02. I mean there is no “tipping points”. I read someone who states that the current negative feedback could be the relation between the “absorbed” power and the temperature which is the well known Stefan-Boltzmann equation, but that’s not a negative feedback. It’s just a non linear correlation, which means that as the power increases the temperature increases, even less but it still increases (it’s a parabolic curve of course). No, in my current opinion it must exist an another real negative feedback which exceeds the positive one.

    But being a technician and not a scientist, the most disturbing for me is the assumption that we are able to measure the effective outgoing LW radiation. I read on Real Climate people saying that doubling the CO2 concentration the outgoing radiation reduces of about 3W. They use this on-line tool to support the claim:
    http : / / geodoc.uchicago.edu/Projects/modtran.orig.html
    (please remove the spaces, I added them to avoid the automatic message locking for moderation)

    Well, some times ago Dr.Spencer convinced me that MODTRAN is a reliable tool, and I thank him for that. But the MODTRAN analyses shows us just what a spectrometer placed at a certain altitude can “see” in the LW IR band, which is not the whole outgoing radiation. You must know that in my professional experience I also designed an optical spectrum analyzer, and documenting myself to design the instrument I discovered that all of them (also the one based on the Michelson interferometer, widely used for the meteorological FTIR spectroscopy) measure only the incoming radiation which is normal to their input slit. For that, any outgoing radiation which is exiting the atmosphere with an angle different from the zenith can’t be measured by the satellite spectrometers because it sight the nadir.
    Since GHG (I prefer to call the IR active gases indeed) spread the outgoing radiation, it is obvious to me that a lot of radiation exits the atmosphere with angles different from nadir. Thus more GHG means more spread radiation too.
    Want a proof of what I’m saying? Take a look here:

    http : / /www.atmos-chem-phys-discuss.net/6/4061/2006/acpd-6-4061-2006-print.pdf

    They used the spectrometer with a beam bender to allow measurements not only from the nadir but also from the “limb view”. Not so much good, because they declare a 0.133rad field of view, so they are missing a lot of escaping energy with angles amongst nadir and the “limb”, but at least they are on the right way.
    See the top of figure 3, do you see it?
    It shows the emission which is tangent the atmosphere at about 34km.
    Hoops! There is an outgoing energy peak exactly where MODTRAN shows us the CO2 “absorption”.

    In few words, my point is:
    if there is no doubts that doubling the CO2 the outgoing emission at the zenith reduces of 3W, what is the total increase of the outgoing radiation at different angles?
    I sure it increases, but how much does it?
    I think that when the climate scientist will discover that, the human kind do a great step in the CO2 climate issue.
    But I believe it’s an hard to reach goal, because the radiometer should “see” the whole Earth dish and its atmospheric corona too, this for each point of the globe.

    Anyways, I’m just a hobbyist of the climate, maybe I’m fully wrong.

    Massimo

  55. DYLAN

    THE REAL REALATIOSHIP BETWEEN SOLAR AND TEMPERATURE

    BY PIERS CORBYN,

    I WILL QUOTE HIS CONCLUSIONS -And you will see why lag times are important and it is not as simple as you think it is, and more time is needed to see what effect this current solar minimum will have on the temperature trend.

    FROM PIERS, It has been known for many years that solar activity(eg sunspot numbers or anything which follows the 11 year cycle) is NOT a detailed driver of world temperatures(ie on time scales of less than one solar cycle);this is evidenced by the FACT that the main signal in world temperatures is the magnetic Hale *(22 yr) cycle.

    So for about half of the time solar activity(eg smoothed on a 3 yr moving average) and temperatures move together, and about half the time they move oppositely.

    So what he is saying ,is during a solar minimum temp. trend is going to be down in the general trend, but at times the temp. trend will be running counter to the solar activity.

    This is much more complicated then what you, and all of the global warmist are willing to admit, and more important requires time to play out.

    Also lunar modulation of solar activity comes into play, because it modulates the magnetic linkage between the earth and sun, and this is where it is at, as far as the sun’s effects on earth’s climate are concerned. It is the magnetic linkage.

    As far as my phase in, the only way to get a possible substancial phase in of the items I mentioned ,in either direction is through a very weak sun ,or a very strong sun, anything in between will result in mix signals.

    Last century we had a strong sun ,starting in 2005 we have a weak sun, if the sun stays weak,then I feel the chances of all the items I have mentioned phasing into a colder mode,for a substancial time frame will be much greater, and that along with weaker solar irradiance /weaker solar wind will be enough to casue a substancial drop off in temperatures.

    We will see what this decad brings, I predict global cooling.

    LET’S TALK ABOUT THE MAN MADE CO2 GLOBAL HOAX

    Their latest attempt is to try to say clouds create a positve feeddback which they hav no supporting evidence for. I believe like Dr. Spencer ,that it is a negative feedback.

    ALSO HERE ARE SOME QUESTIONS.

    Why in the past when temperatures were warming and CO2 was increasing ,along with the assumed positive feedbacks did that not keep going?

    I know what you might say, you might say it is because CO2 cconcentratins became less after a time, and I say how could that be if temperature trends are on the rise and the oceans are warming giving up more CO2, and all the associated positve feedbacks are in place. Why in the world given that, would the CO2 concentration ,along with other greenhouse gasses revert ,if that is what your side would claim for the reason why temperatures when CO2 increased ,did not keep going up.
    Why would the positive feedbacks end?

  56. Massimo PORZIO says:

    Dylan,
    I wrote:
    “To be valid your statement (and it could be indeed, I’ve no proof to demonstrate you are wrong here), it must exist a negative feedback greater than the positive one, otherwise the system is always in a runaway state, doesn’t matter the level of C02. I mean there is no “tipping points”. I read someone who states that the current negative feedback could be the relation between the “absorbed” power and the temperature which is the well known Stefan-Boltzmann equation, but that’s not a negative feedback. It’s just a non linear correlation, which means that as the power increases the temperature increases, even less but it still increases (it’s a parabolic curve of course). No, in my current opinion it must exist an another real negative feedback which exceeds the positive one.”

    Returning to my school books, I’ve been proven to be wrong here. Yes, a positive only feedback system can exists if its amplitude is lower than the system input signal.
    So your specific claim could be right.

    I apologize for my previous superficial analyses on the issue.

    The rest of my previous post remains as before.

    Massimo

  57. Dylan says:

    Hey Salvatore & Massimo;

    Wow; I’ve got a lot of stuff to look at here; & you guys will definately teach me a thing or two; because I will want to establish my facts; & research fully before replying.

    So; I’ve read your points; but I hate to dissapoint you; but I will need some extra time to research some things a bit further; I reckon I might need another day or two!!! But I’ll explore the issues; & get armed with a bit more facts. I guess we could all help each other learn a lot!!! Some interesting issues to explore.

    As it happens I am also working on an unrelated personal project regarding amongst other things; Roma; Firenze & Pisa, at the moment my head is buzzing with Frescoes; & renaissance & baroque art & architecture styles; & memories from my own short time there.

    Been looking at a few cities across Europe in this context; but right now I’ve been looking at Italy for about two weeks; & been kind of stuck there; looking at it.

    Funny that I should come across two (I think) Italian Global Warming (hoax?!?) enthusiasts at the same time on my unrelated debate!

    Anyhow; hope to find some decent time to explore your mails & add more tomoz…

    Ciao for now!

    • Massimo PORZIO says:

      Hi Dylan,
      I know what you are saying.
      I’m working too of course. If the name in your ID card isn’t Steve Jobs, Bill Gates or Donald Duck :), you have to work to eat something everyday!
      The thing which make my job more pleasant than the AGW issue for me, is the fact that at the end I can measure anything I do.
      Don’t know if Salvatore is Italian too, the name for sure, but he could be an American native Italian.

      Enjoy your arts project.

      Have a nice day.

      Massimo

  58. I want to say hello to Massimo. I appreciate your inputs, as I do Dylan’s.
    It is nice to talk with Dylan, who may have a different take on things ,but who is sincere and knows his material.

    I can deal with that, I just can’t deal with the frauds,that always seem to pop up in the climate arena.

    • Massimo PORZIO says:

      Hi Salvatore.
      Just to tell you that I read your posts and I usually agree with them. Even if my opinion is not of any value, since I’m just an electronic engineer.
      I’m very disturbed dealing with issues at the “edge of knowledge” as the people of climate arena does. Maybe it’s because I miss some important details well known from others.
      For example, I would like to know if someone given any explanation of the thin peak in the middle of the CO2 650cm-1 absorption band. It’s amazing me that it’s absolutely absent on Mars and Venus.
      I already have an idea about it, but I would investigate more in my free time.

      Have a nice day.

      Massimo

  59. Getting back to my previous post ,what I was trying to say at the end, is I think a Positive Feedback does exist between clouds, and earth’s climatic system ,but in EXACTLY the opposite way DR. DESSLER suggest.

    THE POSITIVE FEEDBACK(FOR COOLING) IS AS FOLLOWS:

    WEAK SUN, EQUATES TO A LESS ZONAL ATMOSPHERIC CIRCULATION,LESS ZONAL ATMOSPHERIC CIRCULATION, EQUATES TO MORE CLOUDS,THAT RESULTS IN A NET COOLING.AGAIN LOCATION, AND TYPE OF CLOUDS INCREASING, BEING VERY IMPORTANT.

    THE OTHER POSITIVE FEEDBACK FOR LOWER TEMP. WITH A MERIDIONAL CIRCULATION WHICH I MENTIONED BEFORE IS

    A more meridional circulation ,I think serves to cause land areas in the N.H. to have more snow cover then there would be with a zonal circulation, therefore increasing earth’s albedo, especially over those latitudes where the snow cover increases the most ,which would be south of the polar region, therefore reinforcing the meridional circulation , keeping the positive feedback in place.

    As I said in my previous post, this is likely to be the DECADE OF GLOBAL COOLING.

    The prolong low solar activity, is providing the set up ,to make it possible for the real items that control the climate to phase in long enough, to a degree of magnitude strong enough, to cause a temperature drop off this decade, if not beyond.

    Those items one more time being VOLCANIC ACTIVITY(MORE ACTIVE -(HIGH LATITUDES BEING MORE IMPORTANT),PDO/AMO (COLD PHASE),SOI STATE(MORE LA NINAS ),AO,NAO ATMOSPHERIC CIRCULATIONS(MORE NEGATIVE )

    DR DESSSLER, and his crowd constantly try to make things come out the way they want them to ,not the way they are.

    Examples of this are first the CO2/ WARMER TEMP/CLOUD positive feedback, next the false positive feedback of more CO2/MORE WATER VAPOR/ WARMER TEMPERATURES, followed by their manipulating of the recent past temperatures and trying to ignore the historic climatic temperature trends, such as Mann, who tried to force upon us, his ridiculous garbage hocky stick graph, then not only do they ignore the sun, but they have no understanding of how the sun and earth’s climatic system interact, and on over what time lags that interaction takes place(which is going to trip them up), not to mention how they always forget, to mention the S.H sea ice has been increasing, for many years now.

    They did not count, or expect this solar minimum to take place ,and this is going to be what puts the nail in the coffin for them.

  60. Thanks ,Massimo. Keep posting ,because you bring forth very good points and thoughts. Between you,me and Dylan ,we should be the ones having a national debate. I think we have good give and take,and are more informative about our positions , then the so called professionals in this field.

  61. Dylan says:

    To Salvatore (initially)

    Well; sorry about the delay in replying; I had a lot to work with; & my own stuff to do.

    Now first I will look at your points Salvatore; as they are the points most outstanding. This is from the comment 9/12/2010; 11 am; on the discussion as follows;

    http://www.drroyspencer.com/2010/12/nov-2010-uah-global-temperature-update-0-38-deg-c/#comments

    POINT 1
    The first point you made was the benefit of these discussions; & yes – with that I agree. It feels exacerbating though don’t you think? Doesn’t it sometimes feel that we are banging our head against a brick wall? Do we actually ever convince people of our views? Or do we state them & argue them only to strengthen & re-enforce our own views? Is that the benefit of this discussion? So that we end up more convinced of our own arguments than before; & convince no-one else of our arguments; except by re-enforcing the arguments of those who agree with us.

    At least; I guess; we will research the questions posed to us; and therefore others will teach us by default. But it makes you wonder what we do it for; no?

    POINT 2
    (You described as the first point; I number as above for ease of reference.)
    I do understand that lag times have to play out; but I also feel that they are used by AGW opponents as an excuse when nothing happens; or when something happens to contradict there analysis. At best; we must all agree that the very nature of sunspot lag times for example; is that they are not always clearly defined except over the long-term; thus much is left to the interpretation of data; the problem than being; that each one filters the data for his or her own ends.

    We are all guilty of pre-determining the outcome of an argument; even when we are presented with facts or data that could contradict us. We all filter it according to the bias within us. None of us are open from scratch to the truth. None of us are blank sheets. So the difficulty we have is that every time there is a warm year; or we see facts that contradict our view; AGW opponents defer to the idea that we are still under the lag of warming; & still awaiting the lag in cooling.

    But the difficulty AGW opponents then may have is – that – for example – I predict that next year; 2011 might find it-self to be the warmest ever year with a strong La Nina; perhaps around the 6th – 10th warmest year recorded. But then it will be said; as you seem to imply; that there is still a lag time from proceeding increased solar activity; & other warming phenomenon. But when will that deference to lag effects from warming factors in the past cease? In 100 years’ time; will people still point to lag times if our view is constantly contradicted?

    Of course the benefit of arguing as a proponent of AGW is that this year’s data backs it up; so I don’t have to point to lag times. But AGW opponents will then say; “You can’t judge it by one year” despite the fact that they judged for themselves that the world had cooled due to the excessive warmth of 1998.

    I highlight the fact that we are all guilty of this. We all pre-determine the outcome; as we are all so convinced of our own view; & either side of the argument can be evidenced; according to the preference of the inquirer. The question is; what level of proof or evidence is required before we will retract our view one way or the other? All that remains then is to look at on-going records as they arrive; & wrangle over how authoritative our conclusions are based on the incoming data. None of us dare say – perhaps we just don’t know? We do know it remains to be seen.

    The difficulty you are now going to find; is that if the warming process continues to occur; despite your prediction of Global cooling over the coming decades; it will become less & less easy to put it down to lag times. So clearly we see that the coming years will be the proof of the pudding.

    The fact that there are so many arguments either way – many of them valid; proves that we are announcing the outcome prematurely prior to the time. So in this I agree that we need to see how it plays out.

    But where we differ; is that right now; I don’t have to point to lag times; but to the current warmth. Next year; I will not have to either; because we will see the warmest ever La Nina year; unless the La Nina weakens; when we may even see a warmer year.

    POINT 3
    (You described as “Secondly”) If I look at long term solar activity; for example; I cannot see how you can reach the conclusion that we are entering a Dalton or Maunder minimum when we are so close to the modern maximum. We still have many years left of diminishing solar activity to come; one would think 50 or 100 years. Why do you relate this to the next two decades? You yourself give an upper limit to the lag times of 30 years; seen as we are still in the Maximum; we may well have 25 years of peak warmth still to come; from this Solar Maximum; by your own figures. Are you really so sure that you will see anything more than a slight decline in solar-activity over the rest of your lifetime? I think you are grossly overestimating the impact that on-going reduced solar activity will bring; & misplacing your hopes for an imminent decade of cooling – at least this coming decade on that basis. Ironically; it appears to me that in arguing about lag times; you are in this underestimating the impact of the lag time of this period of Solar Maximum; which smacks of over-optimism to me; & overestimating the impact of the cooling lag time that you think will suddenly arise from reduced Solar-Activity in the coming years.

    Lastly – I don’t doubt the impact of solar activity; but I also don’t doubt the impact of the current manmade warming we see. I think it will outweigh the slow cycles of sunspot warming & cooling. I do not believe there is any evidence that there will be a sudden imminent reduction in solar activity; & certainly not an imminent reduction of global temperature on that basis. But the best you can hope for; is rather a slow decline over the coming 50 or so years; with intermittently reducing peaks in the 11-year cycle. This current sunspot cycle is building quite clearly as one might expect. It is far too early to pin your hopes on anything but slight insignificant cooling from reduced solar activity over even the next 50 years I think. That is – even if we do enter a maunder minimum. Even in your best scenario this isn’t very likely to me.

    POINT 4
    I must be honest; I have found it hard to get definitive evidence of volcanic activity at all in the past; never mind enough to determine at what time volcanic activity was more or less. I recognise that this may have its own cycle; but where on earth are we going to determine this from? Do you have data about volcanic activity? Even if you do; I highly doubt is enough to reach much in the way of a valid conclusion; about how this may or may not have affected the climate; or how it will. Do you know what will happen to volcanic activity in the coming years; never mind what impact it may have on the temperature? If you do; you are privy to information I do not have. We know that Volcanoes cause initial cooling from obscuring the sun; but it may create long term warming as well; through an increase of CO2 & gasses trapping the suns warmth; emphasising the Greenhouse effect; though I realise this doesn’t fit well with your theory. IN the meantime; we are left with not having anywhere enough information on Vulcan activity to make any real conclusion scientifically plausible. There is no way that you can accurately predict enough of a change in Vulcan activity to make any conclusion on how this may affect the climate; & you are punching way above your weight in something that just so happens to be used by you to back up your argument for imminent cooling.
    All a bit too good to be true I think? In association with prolonged Solar activity; & you are setting too many parameters that might fail; or even be contradicted. Both volcanic & solar activity will have to really get a move on; & then we still have to await the lag. Either way; I fear me & you will be in our graves before we see it. These are interesting ideas and theories; but to me they are just that. A similar assessment you may have of some of my views.

    I will humour you; if you put these two facets together; you might; just might get some sort of realistic connection. But I think you are running before you can fully recognise what you are actually seeing; let alone walk (& who can blame you; I think no-one has fully recognised this). Much more research needs to be done; research you have neither the time; the funding; nor inclination for. And there isn’t enough being done about it now; as surely people would understand the topic more? Please point me to any long term Vulcan activity data; as I have not come across any significant data. Has anyone charted their frequency? Has anyone charted it against global temperature? If they have; please show me the links.

    You then refer to the fact that you think this has caused a more meridional circulation; & I hear the argument; but I say that has been caused by the pooling accumulating warmth we have seen in the Arctic; this is very much understood to have the same affect. You say it relates to the above; I say it is the accumulation of the warmth at the poles caused by AGW. You cannot say that changes in solar & volcanic activity has created warmth; because very little research has been done in this area. Much has been done in the impact of CO2. It is too early to reach any conclusion on this activity; but there has been more than 100 years of a steady increase in CO2 that we can look at the impact from.

    Even so far I can see; Salvatore; that a lot of facts that have to not only stack up; but then they also have to hang together just for it all to work at all. It just seems to be a really big challenge; you must be tired if nothing else!!! I think I know why you; Roy & others feel very exasperated sometimes. But I think any area of thinking is valid; & if you don’t emphasise & theorise on it; who will. Also even if it were hare-brained; it must be put forward so that it can challenge & sharpen the consensus. Ironically; AGW might once have been seen as a stretch; now it’s just challenged; due to the fact that “the consensus” had not completely understood or fully appreciated; or explored their own argument. Of course that is because it was pioneering. It has taken the challenge of Anti-AGW for us to really get fully to grips with our facts; & when our argument proves true; we will thank you for sharpening us as you have. Anti-AGW must be far more stretching; a constant battle against the tide; moments of let up; & moments of ferocity.

    POINT 5
    (You described this as your fourth & most important point.) You say all these factors; can be shown to be largely responsible for recent warming; those being Solar & Volcanic activity; (It has not been shown at all; very little is known about Vulcan activity; and it is far too early (a few decades perhaps) to reach conclusions about that either. You can argue that increased solar activity created additional warmth; I say – correct; & it will continue to do so. But there has been additional accumulating warmth that these things do not explain (in my view.) And regarding the Oscillations; how can you say they can be shown to create warming? Just one of them; the NAO for example; cannot be said to create warming or cooling. In winter; a negative NAO pattern creates bitter winters in North Western Europe; but the same can create warmth elsewhere. And those cycles have regularly settled on all the possibilities; so there has not been a trend for warmth based on any of these. You say they can be shown to have created warming; but I believe CO2 can & has been shown to create warming already; though I recognise that that is an interpretation of data. None of the long-term Oscillations have shown a sudden likelihood to develop a cooling pattern over the globe; especially as each causes warming & cooling in different areas anyway; & few of them are so straightforward as the ENSO is. You can no more argue this than I can argue this isn’t the case.
    To say all these things conspired to create warming is delusional. (Not because it might not have happened; but because you have not been presented with enough data to appreciate this fact.)
    If all of the tenets observed in this point are correct; so it is; but what are the chances of that? Isn’t this what posters on this website call an astrological interpretation of cause & effect; linking probably unrelated facets; & confusing the causal relationship?

    Your point 5 I have covered in Point 2.

    Point 6
    Yes; I agree; almost every spike is associated with a strong El Nino. But have you noticed that progressive El Nino’s have had progressively warmer years; because the underlying trend is of warming. That’s why virtually every one of our years appears as one of the ten warmest; La Nina; El Nino; or otherwise. Spikes do ocurr due to this phenomenon; but those spikes get progressively higher & higher. The best example is this year & 1998.

    In 1998 it took our strongest ever El Nino; stronger than 2010’s by about a degree; & longer; to create the warmth that this less significant El Nino; after a La Nina; & then another La Nina influenced year brought. It takes less input to create the same result. This is a classic case in point. I would add – though you refute it; that solar activity was low at this time; but higher in 1998. Likewise; this La Nina year may be the strongest La Nina since 1988; but it will still be among the ten warmest years; & it will also be the warmest La Nina year. So those spikes just keep getting higher & higher; & those troughs don’t get any lower. You acknowledged that all these things conspired to create warming; the question is; will the warming now stop? It hasn’t so far. Most people said that things dipped since 2002 before 2010. 2010 is the fly in the ointment. Not on one year – no; but how many do you need? 2010 should not have been as warm as 1998 if there is no underlying warming. 2011 should not be among the 10 or even 15 warmest years recorded if it is the strongest La Nina since 1988 as it now is. If it is; that’s why you can see there is continued warming; (Yeah Salvatore – we’re still in that never-ending lag.)

    Point 7
    You referred to as Point 8; well just look at the current blog on Roy Spencer’s web-site. It is still so up in the air. You can’t derive any conclusion yet surely? (Especially when the issue is currently under such scrutiny) You know that this can be argued either way. Please – humour me; the fact is we don’t know yet! More research is needed. You see the arguments against this; they are the one’s Roy Spencer quotes; re-buffing his explanations. Let me not go any further but to say – we don’t know yet on this one. If you are already drinking it to its dredges now; then it strikes me your argument lacks strength. You are looking for arguments we will be having in thirty years time; because that’s when we’ll have enough evidence to have this argument. Far be it from me to surmise; when the Powers that be are fighting it out over my head.

    Point 8. To me that is the same question as why has the Arctic warmed faster. My view is that warmth is pooling in the Northern Hemisphere. We know that the Antarctic is a very different beast; as is the sea-covered SH. To me; if there has been an increase of thickness in the Antarctic; well; there has been record breaking sea-ice loss in the arctic; & guess what; the globe overall is much warmer – you may have noticed by the fact that this is near record breaking warmth. Looking at one area of retention of ice for evidence against global warming is the same as looking at one year in isolation. You have to take it in the wider context. In general the SH has been warming; & we know why it doesn’t warm as quickly. You have to look at the globe as a whole.

    Point 9
    Reference your next post; sent 11:18 am the same day. Firstly you ask why there is not a steady increase in temperature if it is linked to CO2; as this has been consistently gone up steadily; & I would say; I’d refer you to my friend Salvatore for that… oh sorry… that’s you. You know why the temperature doesn’t simply follow CO2. You state it throughout your posts. It isn’t just CO2 that affects the climate!!! I recognise all the other factors – you know – the sort of factors that normally bring subtle changes over thousands of years; or a sudden change pent up. But underlying the normal chaotic trend; is an additional & smooth trend of warming that has picked up & slowly occurred over the last century or more. All the factors you mention do have some affect. It’s just that underneath there is a perceptibly more unnatural change that has knocked us out of the normal chaotic up & down trend; to a smoother more even warming behind the other variations. Refuting none of what you say – I recognise all these things have an effect. They are just a lot less; & not sufficient to mask an underlying trend of additional warming; & I don’t believe they ever will be; things as they are in the coming centuries. The fact that this natural variation is a lot less is precisely why you find yourself having to link them all together before you have a realistic argument. It takes all of your cooling & warming theories to amount to just my one. Albedo; Oscillations; Solar; (& more worryingly; the unstudied volcanic) impacts; all these together might explain this warming; or just one thing does; something sufficient to make up for them all. This current man-made warming. Really; what strikes you from that analysis as more likely? Don’t answer that. Actually do – say what you will. But I know you’ll have to work harder to find the arguments.

    Point 10
    The CO2 follows temperature & temperature follows CO2 debate. You paint a lovely picture – one in which there is an 800 year lag; as gentle warming slowly releases carbon in the sea. Don’t tell me; sea life is in the sea; & bird life Is in the air; trees grow wild across the globe; almost all the temperate & tropical land surfaces are covered; A satellite image of the globe would reveal gentle pristine weather patterns untouched & unseen. The seas glisten with the reflecting sun; the land pumps & breathes green; except in the inhospitable parts of the globe. As night falls what do you see? Absolutely nothing. There is no evidence of Man’s existence.

    In your perfect world; the temperature rises & 800 years later; carbon dioxide levels increased. Do you know what I’m going to do with that theoretical world?

    I’ll chop its trees down; make a bulldozer; slam it through; & I will cover the earth with concrete taking out its lungs; & filling it with smoke. When I did that to my body; I got lung cancer. If you see a satellite image; you know longer see darkness. From the poles to the equator there is unnatural light; green areas savaged.

    In your ideal world; all these things are untouched; they flow naturally; one phenomenon into the next; & all in all there exists a balance. But here we are; mucking around with the dials of the earth; without any knowledge and adding half of the original balance of CO2; & thinking it will have no effect.

    My most important point is this;

    Imagine if we behaved like this with terrorism? Imagine if the threat level was “0” until we actually saw the bombs & witnessed the decapitations. Imagine if we just lulled around with a false sense of security saying; “we haven’t seen proof that terrorists are actually attacking us; let’s wait until they have infiltrated the earth & we have absolutely no room for manoeuvre”.

    Because even if there is a 1 in 10 risk of AGW; isn’t that something worth acting on or at least researching with caution; never mind if it is as I think – virtually a foregone conclusion.

    To do nothing because you may have seen one or two holes in the established science is at best reckless; at worst tyrannical. And it leaves those who have to suffer its consequences without a leg to stand on. That to me is enough; but there is much more than that – it is already happening.
    We then hand the world over to our offspring & sod them to deal with the consequences. Please!

    Your last point; How can you compare such a time 400 million years with now? I concede; I don’t know; but nor do you. All we know is that CO2 has been constant; that one way you except that there is a link with an 800 year lag; but after 100 years (with warming) refute there is a link. I believe that there is a release of CO2 in a warmer world; I also believe; (& you should at least acknowledge there is a risk) that man-made emissions of CO2 has an unknown affect. You wouldn’t take a drug that you didn’t understand; even if its components were naturally found in the body. Why should you take such a risk with the toxicology of the earth? To me a risk of harm is enough at least to research; & to restrain.

    That’s what’s so desperately alarming about the camp of opponents of AGW. If you are right; the worst that will happen to AGW proponents is a red-face of embarrassment. But if you’re wrong; you have put in jeopardy the safety of future generations; as low lying countries are flooded; & there is an increase of destructive weather & climate patterns.

    If it were anything other than something so intangible as the climate; we would be up in arms, we would act JUST INCASE our children choke to death on our fumes; whilst we are not around to pick up the pieces. I urge you to consider that point well!!!! It’s more than a matter of principle or of theory for a true AGW proponent. Humanities future depends on it.

    You also posted a post at 12:36 pm;

    Some interesting points – & I don’t discount them. But again; we clearly cannot know.

    Ok; here is a starting point; I will post this now for initial discussion; though I’m sure there is much more to discuss; & I may have missed points. But this is an on-going debate…. So let’s see where it goes.

    Lastly; your questions are increasing my overall understanding; but also my conviction as to how important this matter is.

    Thank you for now;

    Dylan.

    I’m through with proof reading – hope its ok…

  62. Dylan says:

    Massimo;

    For now; ok if I refer you to my new post? If you have any further queries; let me know.

    Dylan.

  63. Dylan says:

    I HAVE LIFTED THIS PORTION from my post; as I think it deserves a hearing in its own right; from the pervious post by me. ***************************************************

    My most important point is this;

    Imagine if we behaved like this with terrorism? Imagine if the threat level was “0” until we actually saw the bombs & witnessed the decapitations. Imagine if we just lulled around with a false sense of security saying; “we haven’t seen proof that terrorists are actually attacking us; let’s wait until they have infiltrated the earth & we have absolutely no room for manoeuvre”.

    Because even if there is a 1 in 10 risk of AGW; isn’t that something worth acting on or at least researching with caution; never mind if it is as I think – virtually a foregone conclusion.

    To do nothing because you may have seen one or two holes in the established science is at best reckless; at worst tyrannical. And it leaves those who have to suffer its consequences without a leg to stand on. That to me is enough; but there is much more than that – it is already happening.
    We then hand the world over to our offspring & sod them to deal with the consequences. Please!

    Your last point; How can you compare such a time 400 million years with now? I concede; I don’t know; but nor do you. All we know is that CO2 has been constant; that one way you except that there is a link with an 800 year lag; but after 100 years (with warming) refute there is a link. I believe that there is a release of CO2 in a warmer world; I also believe; (& you should at least acknowledge there is a risk) that man-made emissions of CO2 has an unknown affect. You wouldn’t take a drug that you didn’t understand; even if its components were naturally found in the body. Why should you take such a risk with the toxicology of the earth? To me a risk of harm is enough at least to research; & to restrain.

    That’s what’s so desperately alarming about the camp of opponents of AGW. If you are right; the worst that will happen to AGW proponents is a red-face of embarrassment. But if you’re wrong; you have put in jeopardy the safety of future generations; as low lying countries are flooded; & there is an increase of destructive weather & climate patterns.

    If it were anything other than something so intangible as the climate; we would be up in arms, we would act JUST INCASE our children choke to death on our fumes; whilst we are not around to pick up the pieces. I urge you to consider that point well!!!! It’s more than a matter of principle or of theory for a true AGW proponent. Humanities future depends on it.

  64. Michael Hauber says:

    From time to time I’ve seen the claim that Uah temp should be rising 20% faster than ground temps due to tropospheric amplification. I am also under the impression that although Uah is based on tropospheric measurements, it does try and calculate a surface temperature, and so should be rising at the same rate as ground temps such as GISS.

    Can you please clarify?

    This issue has most recently come up again at Lucia’s Blackboard, so a comment there might be helpful.

  65. P.S. says:

    Obama Plans will Push Through Global Warming Policy
    Obama lost the fight to get Climate Change legislation passed through Congress, but he plans on making it happen by going around Congress. The Republicans say they are ready to fight it out.
    See more http://www.under5cents.com/2010/12/obama-plans-will-push-through-global.html

  66. george says:

    from this statement and comparison i can see that you are a person who is ready to accept anything the system throws at you like terror threat for example.scientists or not ,you should really start thinking further than weather ,see the manipulation you ve been subjected to and you reproduce.terrorists would not exist without the secret plans of goverments ,and especially USA.So if you can not have a stand of critisism against this,i cant see how your arguments about weather have anything to do with reality ….live with osama and leave us alone …and the planet.terrorists would not decapotate anyone if they wewre not employed by the CIA,and you wouldnt be american if you could see that the system is using you in exchange for breadcrumbs…but you are achievers ,so its ok to create excuses to steal resources …

Leave a Reply to Massimo PORZIO