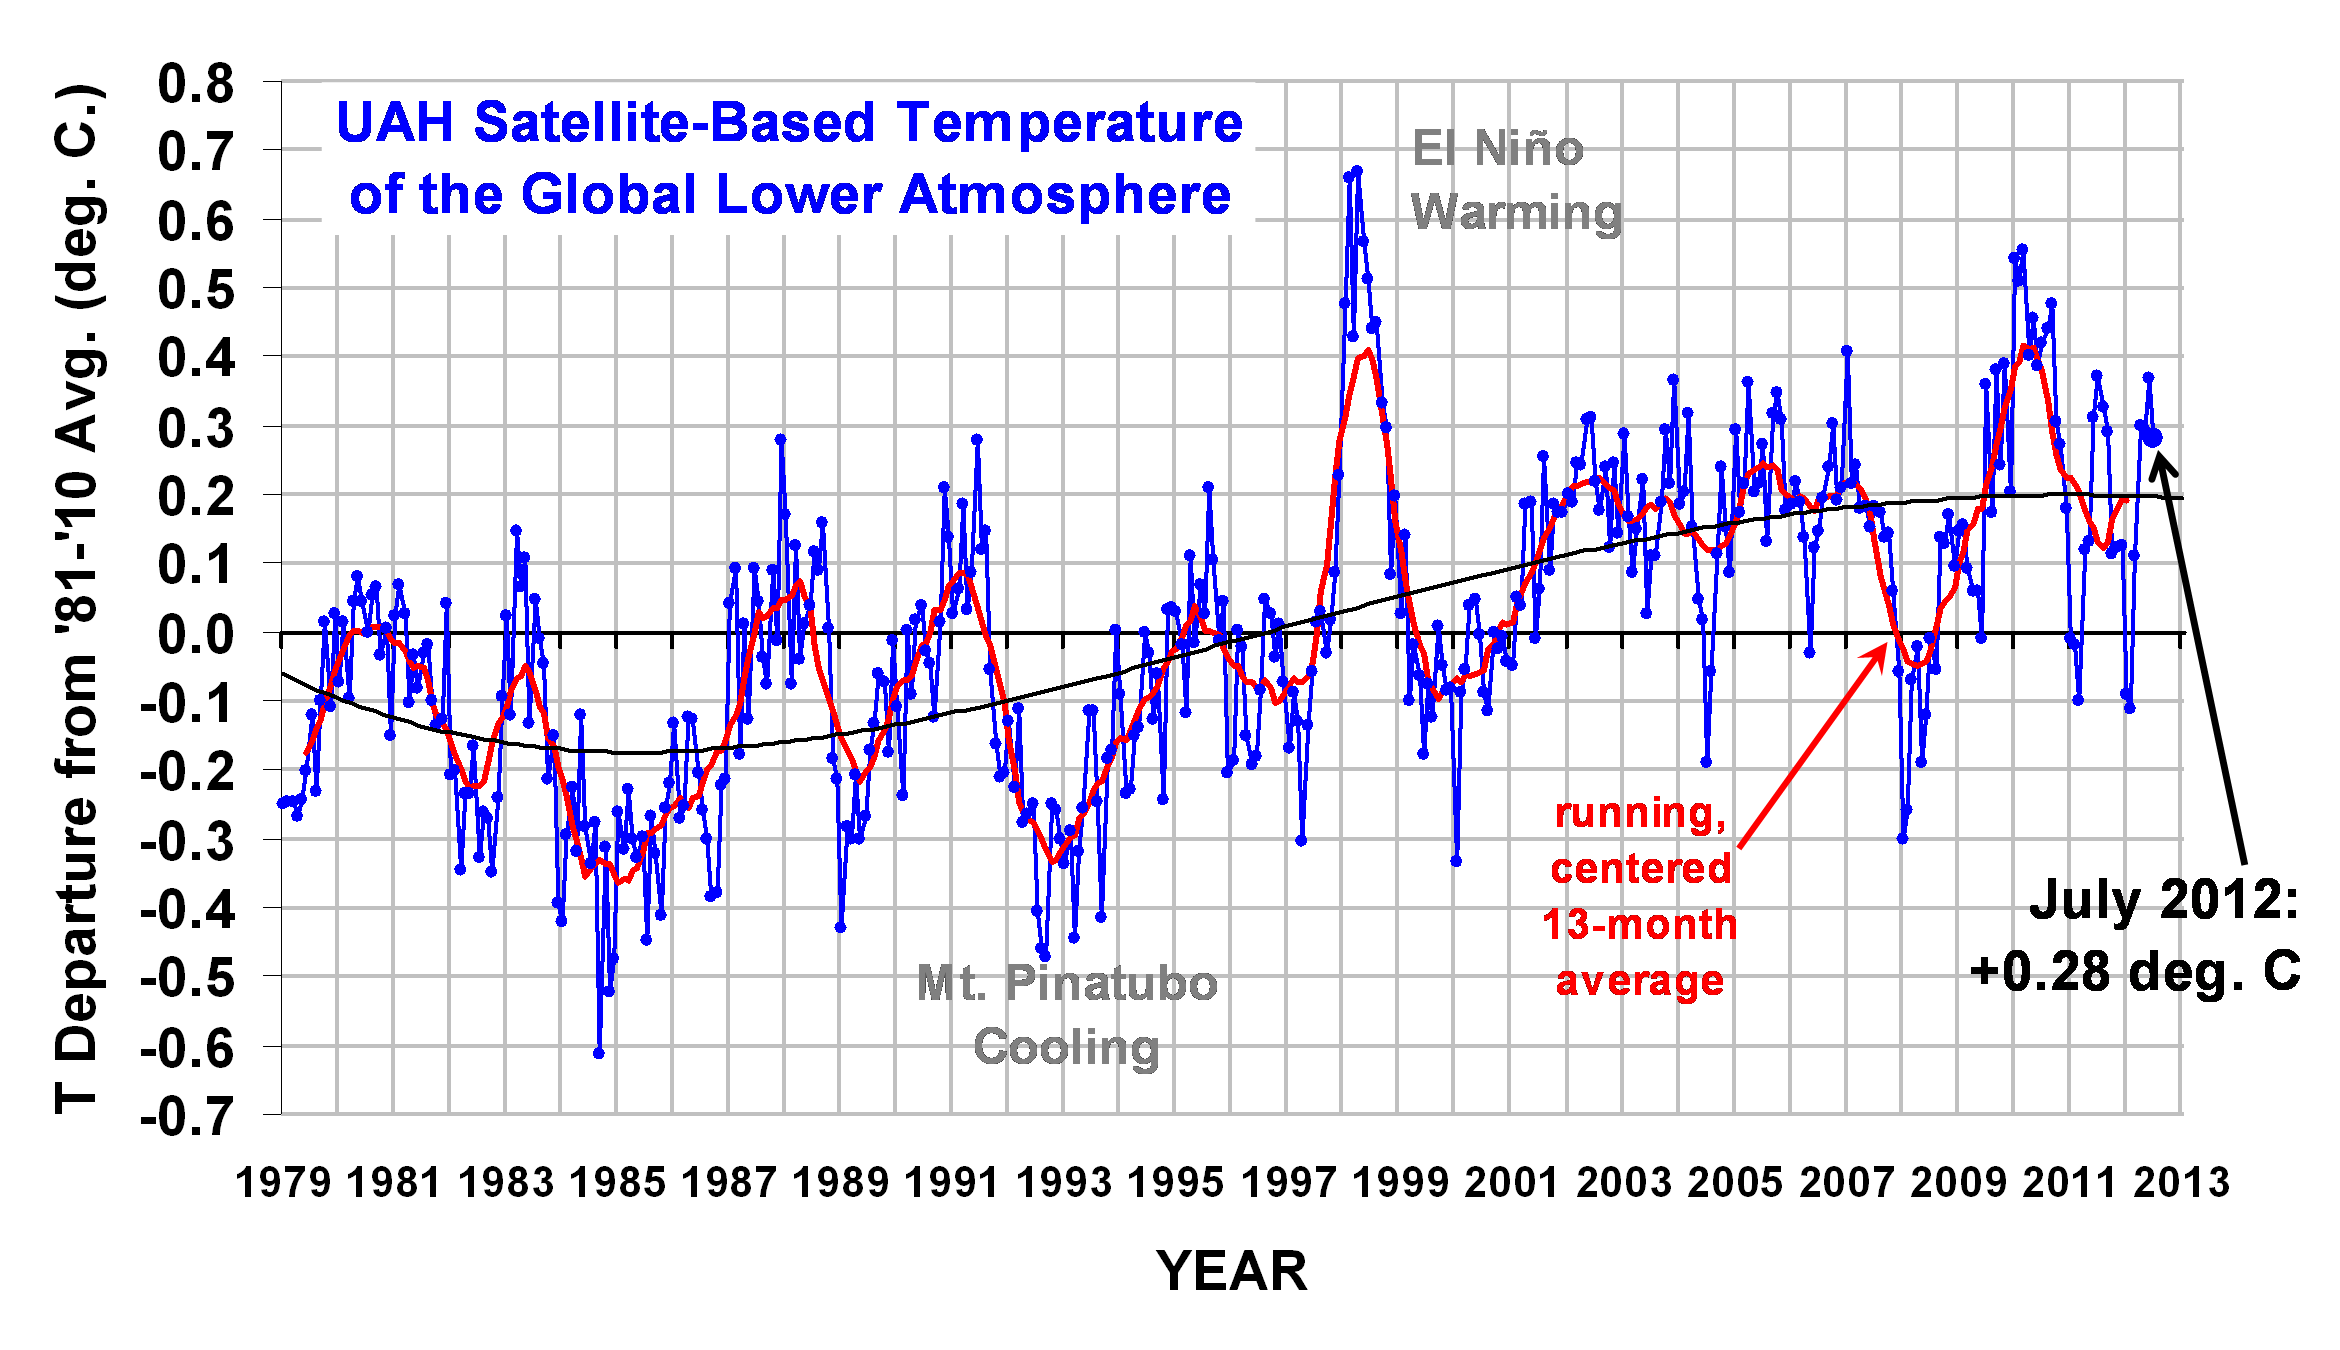
The global average lower tropospheric temperature anomaly for July (+0.28 °C) was down from June 2012 (+0.37 °C). Click on the image for the full-size version:

Here are the monthly stats:
YR MON GLOBAL NH SH TROPICS
2011 01 -0.01 -0.06 +0.04 -0.37
2011 02 -0.02 -0.04 +0.00 -0.35
2011 03 -0.10 -0.07 -0.13 -0.34
2011 04 +0.12 +0.20 +0.04 -0.23
2011 05 +0.13 +0.15 +0.12 -0.04
2011 06 +0.32 +0.38 +0.25 +0.23
2011 07 +0.37 +0.34 +0.40 +0.20
2011 08 +0.33 +0.32 +0.33 +0.16
2011 09 +0.29 +0.30 +0.27 +0.18
2011 10 +0.12 +0.17 +0.06 -0.05
2011 11 +0.12 +0.08 +0.17 +0.02
2011 12 +0.13 +0.20 +0.06 +0.04
2012 1 -0.09 -0.06 -0.12 -0.14
2012 2 -0.11 -0.01 -0.21 -0.28
2012 3 +0.11 +0.13 +0.09 -0.11
2012 4 +0.30 +0.41 +0.19 -0.12
2012 5 +0.29 +0.44 +0.14 +0.03
2012 6 +0.37 +0.54 +0.20 +0.14
2012 7 +0.28 +0.44 +0.11 +0.33
As a reminder, the most common reason for large month-to-month swings in global average temperature is small fluctuations in the rate of convective overturning of the troposphere, discussed here.

 Home/Blog


