UAH v5.5 Global Temperature Update for December, 2012: +0.20 deg. C

January 3rd, 2013 by Roy W. Spencer, Ph. D.

Our Version 5.5 global average lower tropospheric temperature (LT) anomaly for December, 2012 is +0.20 deg. C (click for large version):
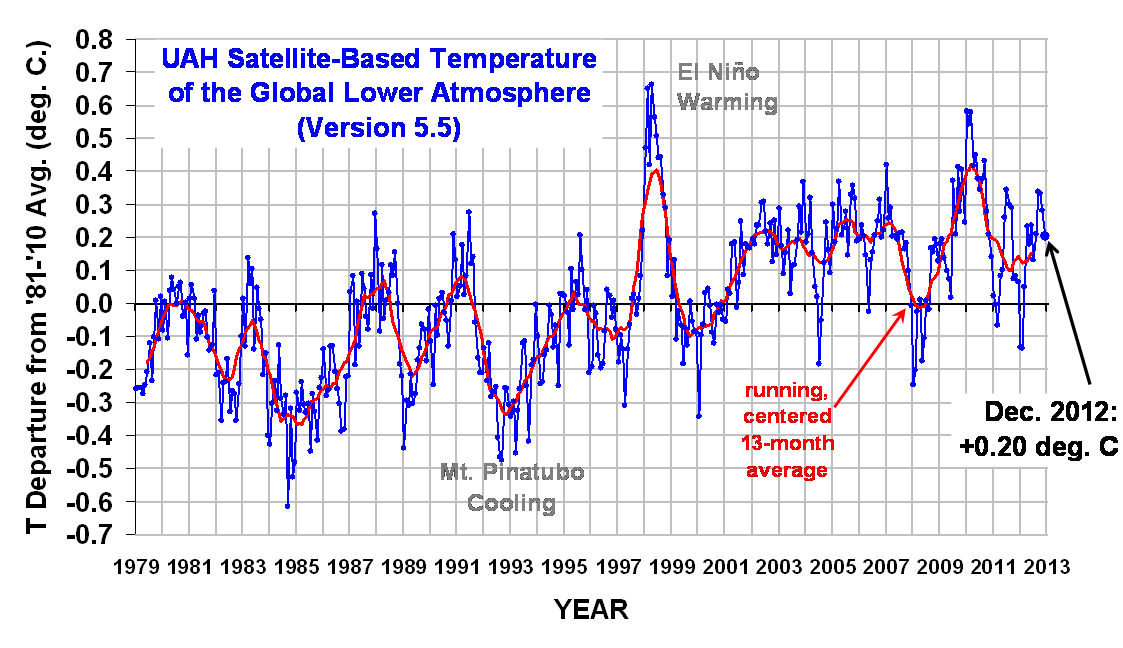
The global, hemispheric, and tropical LT anomalies from the 30-year (1981-2010) average for 2012 are:

YR MON GLOBAL NH SH TROPICS
2012 1 -0.134 -0.065 -0.203 -0.256
2012 2 -0.135 +0.018 -0.289 -0.320
2012 3 +0.051 +0.119 -0.017 -0.238
2012 4 +0.232 +0.351 +0.114 -0.242
2012 5 +0.179 +0.337 +0.021 -0.098
2012 6 +0.235 +0.370 +0.101 -0.019
2012 7 +0.130 +0.256 +0.003 +0.142
2012 8 +0.208 +0.214 +0.202 +0.062
2012 9 +0.339 +0.350 +0.327 +0.153
2012 10 +0.333 +0.306 +0.361 +0.109
2012 11 +0.282 +0.299 +0.265 +0.172
2012 12 +0.202 +0.142 +0.261 +0.134
ANN AVG +0.161 +0.225 +0.097 -0.033

Globally, 2012 was the 9th warmest of the last 34 years, behind 1998, 2002, 2003, 2005, 2006, 2007, 2009, and 2010:

1979 through 2012, ranked from warmest to coolest:
1. 1998 0.419
2. 2010 0.394
3. 2005 0.260
4. 2002 0.218
5. 2009 0.218
6. 2007 0.202
7. 2003 0.187
8. 2006 0.186
9. 2012 0.161
10. 2011 0.130
11. 2004 0.108
12. 2001 0.107
13. 1991 0.020
14. 1987 0.013
15. 1995 0.013
16. 1988 0.012
17. 1980 -0.008
18. 2008 -0.009
19. 1990 -0.022
20. 1981 -0.045
21. 1997 -0.049
22. 1999 -0.056
23. 1983 -0.061
24. 2000 -0.061
25. 1996 -0.076
26. 1994 -0.108
27. 1979 -0.170
28. 1989 -0.207
29. 1986 -0.244
30. 1993 -0.245
31. 1982 -0.250
32. 1992 -0.289
33. 1985 -0.309
34. 1984 -0.353

The following comments are from John Christy:

While 2012 was only the ninth warmest year globally, it was the warmest year on record for both the contiguous 48 U.S. states and for the continental U.S., including Alaska. For the U.S., 2012 started with one of the three warmest Januaries in the 34-year record, saw a record-setting March heat wave, and stayed warm enough for the rest of the year to set a record.

Compared to seasonal norms, March 2012 was the warmest month on record in the 48 contiguous U.S. states. Temperatures over the U.S. averaged 2.82 C (almost 5.1° Fahrenheit) warmer than normal in March; the warmest spot on the globe that month was in northern Iowa. The annual average temperature over the conterminous 48 states in 2012 was 0.555 C (about 0.99 degrees F) warmer than seasonal norms.

Compared to seasonal norms, the coolest area on the globe throughout 2012 was central Mongolia, where temperatures averaged about 1.39 C (about 2.5 degrees Fahrenheit) cooler than seasonal norms. The warmest area was north of central Russia in the Kara Sea, where temperatures averaged 2.53 C (about 4.55 degrees Fahrenheit) warmer than seasonal norms for 2012.

Compared to seasonal norms, over the past month the coldest area on the globe was eastern Mongolia, where temperatures were as much as 4.55 C (about 8.19 degrees Fahrenheit) cooler than seasonal norms. The “warmest” area was off the coast of the Antarctic near South America, where temperatures averaged 3.79 C (about 6.82 degrees Fahrenheit) warmer than seasonal norms for December.

Archived color maps of local temperature anomalies are available on-line at http://nsstc.uah.edu/climate/;

The processed temperature data is available on-line at vortex.nsstc.uah.edu/data/msu/t2lt/uahncdc.lt


423 Responses to “UAH v5.5 Global Temperature Update for December, 2012: +0.20 deg. C”

Toggle Trackbacks

  1. Arfur Bryant says:

    Once upon a time…

    …there were people who actually thought that the radiative properties of a trace gas called Carbon Dioxide could have a significant warming effect on global temperature.

    The end.

  2. Werner Brozek says:

    2012 in Perspective so far on Six Data Sets
    This has three parts for a number of data sets:
    1. Here I give the ranking of various data sets assuming the present ranking stays that way for the rest of the year.
    2. Here I give the longest time the slope is flat for a number of data sets.
    3. Here I give the longest time for which the warming is NOT significant at the 95% level.
    1. Below, I am giving the latest monthly anomalies in order from January on. The bolded one is the highest for the year so far. I am treating all months equally and adding all anomalies and then dividing by the total number of months. This should not make a difference to the relative ranking at the end of the year unless there is a virtual tie between two years. After I give the average anomaly so far, I say where the year would rank if the anomaly were to stay that way for the rest of the year. I also show the warmest year on each data set along with the warmest month ever recorded on each data set. Then I show the previous year’s anomaly and rank.
    The 2011 rankings for GISS, Hadcrut3, Hadsst2, and Hadcrut4 can be deduced at the following respectively:
    http://data.giss.nasa.gov/gistemp/tabledata_v3/GLB.Ts+dSST.txt
    http://www.cru.uea.ac.uk/cru/data/temperature/hadcrut3gl.txt
    http://www.cru.uea.ac.uk/cru/data/temperature/hadsst2gl.txt
    http://www.metoffice.gov.uk/hadobs/hadcrut4/data/current/time_series/HadCRUT.4.1.1.0.annual_ns_avg.txt

    The present rankings for UAH were calculated from the revised data due to the new version 5.5. This data can be found at the WFT site.
    The rankings for RSS to the end of 2011 can be found at http://motls.blogspot.ca/2012/01/rss-amsu-2011-was-12th-warmest-year-out.html (Others may also be found at http://motls.blogspot.ca/#uds-search-results)

    With the UAH anomaly for December at 0.202, the average for the twelve months of the year is (-0.134 -0.135 + 0.051 + 0.232 + 0.179 + 0.235 + 0.130 + 0.208 + 0.339 + 0.333 + 0.282 + 0.202)/12 = 0.16. This would rank 9th. 1998 was the warmest at 0.42. The highest ever monthly anomaly was in April of 1998 when it reached 0.66. The anomaly in 2011 was 0.132 and it will come in 10th.

    With the GISS anomaly for November at 0.68, the average for the first eleven months of the year is (0.32 + 0.37 + 0.45 + 0.54 + 0.67 + 0.56 + 0.46 + 0.58 + 0.62 + 0.68 + 0.68)/11 = 0.54. This would rank 9th if it stayed this way. 2010 was the warmest at 0.63. The highest ever monthly anomalies were in March of 2002 and January of 2007 when it reached 0.89. The anomaly in 2011 was 0.514 and it will come in 10th assuming 2012 comes in 9th or warmer.

    With the Hadcrut3 anomaly for November at 0.480, the average for the first eleven months of the year is (0.217 + 0.194 + 0.305 + 0.481 + 0.473 + 0.477 + 0.445 + 0.512+ 0.514 + 0.491 + 0.480)/11 = 0.417. This would rank 9th if it stayed this way. 1998 was the warmest at 0.548. The highest ever monthly anomaly was in February of 1998 when it reached 0.756. One has to back to the 1940s to find the previous time that a Hadcrut3 record was not beaten in 10 years or less. The anomaly in 2011 was 0.340 and it will come in 13th.

    With the Hadsst2 anomaly for October at 0.428, the average for the first ten months of the year is (0.203 + 0.230 + 0.241 + 0.292 + 0.339 + 0.351 + 0.385 + 0.440 + 0.449 + 0.428)/10 = 0.336. This would rank 9th if it stayed this way. 1998 was the warmest at 0.451. The highest ever monthly anomaly was in August of 1998 when it reached 0.555. The anomaly in 2011 was 0.273 and it will come in 13th.

    With the RSS anomaly for November at 0.195, the average for the first eleven months of the year is (-0.060 -0.123 + 0.071 + 0.330 + 0.231 + 0.337 + 0.290 + 0.255 + 0.383 + 0.294 + 0.195)/11 = 0.200. This would rank 11th if it stayed this way. 1998 was the warmest at 0.55. The highest ever monthly anomaly was in April of 1998 when it reached 0.857. The anomaly in 2011 was 0.147 and it will come in 13th.

    With the Hadcrut4 anomaly for November at 0.512, the average for the first eleven months of the year is (0.288 + 0.208 + 0.339 + 0.525 + 0.531 + 0.506 + 0.470 + 0.532 + 0.515 + 0.524 + 0.512)/11 = 0.45. This would rank 9th if it stayed this way. 2010 was the warmest at 0.54. The highest ever monthly anomaly was in January of 2007 when it reached 0.818. The anomaly in 2011 was 0.399 and it will come in 13th.

    If you would like to see the above month to month changes illustrated graphically, see:
    http://www.woodfortrees.org/plot/wti/from:2012/plot/gistemp/from:2012/plot/uah/from:2012/plot/rss/from:2012/plot/hadsst2gl/from:2012/plot/hadcrut4gl/from:2012/plot/hadcrut3gl/from:2012

    2. For the part below, I went from the latest date that data is available on WFT to the furthest date in the past where the slope is a least slightly negative. So if the slope from September is 4 x 10^-4 but it is – 4 x 10^-4 from October, I give the time from October so no one can accuse me of being less than honest if I say the slope is flat from a certain month.

    On all data sets, the different times for a slope that is at least very slightly negative ranges from 8 years and 2 months to 15 years and 11 months.

    1. UAH: since October 2004 or 8 years, 3 months (goes to December)
    2. GISS: since May 2001 or 11 years, 7 months (goes to November)
    3. Combination of 4 global temperatures: since December 2000 or 11 years, 9 months (goes to August)
    4. HadCrut3: since May 1997 or 15 years, 7 months (goes to November)
    5. Sea surface temperatures: since March 1997 or 15 years, 8 months (goes to October)
    6. RSS: since January 1997 or 16 years (goes to December) (December is not out yet, but there is no way that it will not be negative to December when it comes.)
    RSS is 192/204 or 94% of the way to Santer’s 17 years.
    7. Hadcrut4: since December 2000 or an even 12 years (goes to November.)

    See the graph below to show it all.

    http://www.woodfortrees.org/plot/hadcrut3gl/from:1997.33/trend/plot/gistemp/from:2001.33/trend/plot/rss/from:1997.0/trend/plot/wti/from:2000.9/trend/plot/hadsst2gl/from:1997.1/trend/plot/hadcrut4gl/from:2000.9/trend/plot/uah/from:2004.75/trend

    3. For the part below, I went to the following site and determined the longest time that the slope is less than the 95% uncertainty range for various data sets. This indicates for how long the warming is not significant at the 95% level. http://www.skepticalscience.com/trend.php
    If you wish to verify any such as RSS for yourself, put in 1990 for the start date; put in 2013 for the end date; click the RSS button; then click “calculate”. The second number needs to be larger than the first number in order to have the possibility for a slope of 0.
    For RSS the warming is NOT significant for 23 years.
    For RSS: +0.130 +/-0.136 C/decade at the two sigma level from 1990

    For UAH, the warming is NOT significant for 19 years.
    For UAH: 0.143 +/- 0.173 C/decade at the two sigma level from 1994
    For Hacrut3, the warming is NOT significant for 19 years.
    For Hadcrut3: 0.098 +/- 0.113 C/decade at the two sigma level from 1994
    For Hacrut4, the warming is NOT significant for 18 years.
    For Hadcrut4: 0.098 +/- 0.111 C/decade at the two sigma level from 1995
    For GISS, the warming is NOT significant for 17 years.
    For GISS: 0.113 +/- 0.122 C/decade at the two sigma level from 1996

  3. David Appell says:

    Werner, I’m not going to wade through all your numbers, but how do you get a 2-sigma uncertainty of 0.173 C/decade for the 19-year trend? I get 0.04 C/decade, which is easily statistically significant.

  4. Werner Brozek says:

    David Appell says:
    January 3, 2013 at 1:15 PM

    I went to:
    http://www.skepticalscience.com/trend.php

    I clicked UAH; then 1994 for the start date; then 2013 for the end date; the “calculate”. What it showed was For UAH: 0.143 +/- 0.173 C/decade
    Obviously December would not be there yet, but it would not change things much once it is there.

    What did you enter to get your number?

  5. David Appell says:

    I calculated my number directly, but without including autocorrelation, which Skeptical Science does (as per Foster and Rahmstorf 2011).

    Assuming their result is correct, what this really tells you is that 19 years is too short of a time period to make statistically significant conclusions about temperature trends — there is just too much thermal inertia in the system.

  6. Arfur Bryant says:

    David,

    What thermal inertia?

  7. What year 2012 tells us is the global temp. rise has ended.

    Month of Dec. also shows no increase in global temperatures.

    As each month goes by the global man made warming argument becomes weaker and weaker , as temperatures fail to increase.

  8. David Appell says:

    Arthur: the oceans, mostly. They take a lot time to heat up and cool down. The temperature of the atmosphere for any given month depends strongly on the temperature of the months before.

  9. David Appell says:

    > What year 2012 tells us is the global temp. rise has ended.

    Ridiculous. The UAH LT for the last 10 years (i.e. 120 months) have been 0.17 C warmer than the 10 years before.

    You can’t make judgements about AGW based on short-term trends of a few years. You just can’t. Deal with it.

  10. anthony beevor says:

    We seem to be dealing with an aborted El Nino here.

    According to the World Meteorological Association,
    updating their report of the putative 2012-13 event,
    on 22nd November, 2012:

    The dissipation of El Nino-like sea surface
    temperatures during the Northern Hemisphere
    autumn is considered highly unusual, with no
    clear analogue in the historical record.

  11. What are you talkng about, David, the temperatures have not risen for 16 years in any appreciable manner.The model projections are way off and it is going to get worse going forward, as the temperatures start to decline in response to the prolong solar minimum which started in year 2005.

  12. Arfur Bryant says:

    David,

    Do you have evidence?

    Where is the lag?:

    HadSST2 GlobalMonthlyTempSince1979 With37monthRunningAverage.gif

    HadCRUT4 GlobalMonthlyTempSince1979 With37monthRunningAverage.gif

    If thermal lag existed, then we should be seeing increasingly warmer temperatures as a result of the ‘historic’ effect of earlier warming. The lack of warming of the last 14 years shows us that, at the very least, natural factors combatting any surmised CO2 effect are strong enough to mask not only the current CO2 effect, but also the historic CO2 effect.

    The data does not support your postulation.

  13. Arfur Bryant says:

    David,

    [“Ridiculous. The UAH LT for the last 10 years (i.e. 120 months) have been 0.17 C warmer than the 10 years before.

    You can’t make judgements about AGW based on short-term trends of a few years. You just can’t. Deal with it.”]

    Firstly, if you climb up a hill, then walk along a plateau, you are always going to be ‘higher’ (warmer) than you were when climbing. However, you are ‘climbing’ (warming) any more.

    If you don’t like short-term trends, here is the HadCRUt3 trend since 1850:

    0.053C per decade (appx)! Is that long enough for you? Also…
    The trend today is lower than it was in 1878. Therefore…
    There is no acceleration in the warming trend.
    And no further warming since 1998.
    All official datasets show that we are cooler today than we were in 1998 by about 20% of the total warming since 1850.

    What part of ‘the warming has stopped’ (however temporary) is so difficult? I agree that short term trends are pretty pointless, but that didn’t stop the MBH98 crowd using a short term trend to ‘demonstrate’ the aggressive nature of global warming, did it?

  14. Arfur Bryant says:

    Sorry, my first paragraph after the quote marks should have finished with:

    However, you are not‘climbing’ (warming) any more.

  15. David does not understand that trends come to an end and new trends begin.

  16. David Appell says:

    > the temperatures have not risen for 16 years
    > in any appreciable manner.

    More than one factor affects climate in the short term, especially ENSOs. There was a warm El Nino near the start of your 16 years, and a cold La Nina near the end. The underlying AGW signal is still there:

    “Global temperature evolution 1979–2010,” G Foster and S Rahmstorf, Environ Res Lett 6 044022 (2011)
    http://iopscience.iop.org/1748-9326/6/4/044022

    The best signal is that the ocean — at least its top half — has been warming all along:

    http://www.nodc.noaa.gov/OC5/3M_HEAT_CONTENT/

  17. Entropic man says:

    We already know that at 20th century warming rates it takes 15-20 years of data to demonstrate a 95% significant warming. Phil Jones said as much in his interview.

    What concerns me is that Arfur Bryant and others are claiming that warming has stopped on the basis of much shorter periods of data. Statistically all they can say is that in the 21st century they are 95% confident that the temperature has increased by no more than 0.2C or decreased by no more than 0.2C.

    It is ironic to see them using statistics in an attempt to discredit previous warming and then ignoring the statistical weakness of their own arguments.

  18. David Appell says:

    Trends don’t “begin” and “end.” A trend is a trend — the only questions how long is the interval you wish to consider, and what is the trend’s statistical significance. And the latter is not trivial to answer when you get into the details (viz. when you consider autocorrelations).

  19. David trends do begin and end. There are always trends, and the global warming trend has come to an end.

    THE GLOBAL WARMING TREND STARTED IN 1820,ENDED IN 1998.

  20. Before you reply, I will say time will tell in the very very near future who is correct. I expect a decline in global temperatures to become firmly established post 2014.

    • John says:

      salvatore del prete: “I expect a decline in global temperatures to become firmly established post 2014.”

      I’ll give you 100 to 1 odds that there won’t be a statistically significant global cooling (at the 95% level) for any recorded period that you like that includes data up to the end of 2014.

  21. Arfur Bryant says:

    Entropic man and David,

    Who is discrediting previous warming? I have given you and David a 160 year trend. I do not deny that there was warming between 1850 and 1878, 1910 and 1945, and 1970-1998. Overall, the trend is less than 0.06C per decade.

    http://www.climate4you.com/images/HadCRUT3%20MAATand3yrAverage%20Global%20NormalisedFor1979-1988.gif

    Don’t try to twist my point. If you can’t accept that there has been no warming since 1998, then that is your choice. It doesn’t falsify the statement. Why argue the obvious? What part of a 0.06C per decade warming over 160 years is a statistical weakness?

    For you and David, here is a comparison of sea surface and lower trop temperatures over 30 years:

    SST:
    http://www.climate4you.com/images/HadSST2%20GlobalMonthlyTempSince1979%20With37monthRunningAverage.gif

    HadCRUt3&4:
    http://www.climate4you.com/images/HadCRUT4%20GlobalMonthlyTempSince1979%20With37monthRunningAverage.gif

    Where is the lag? David, how does the deeper ocean warm without a corresponding rise in surface temperature? Why isn’t the historic ‘thermal lag’ showing up as an acceleration in the near-surface temperature?

    This will be my last post of the night. Working early.

  22. Entropic man says:

    salvatore del prete says:
    THE GLOBAL WARMING TREND STARTED IN 1820,ENDED IN 1998.

    Why do you choose 1998 as your end point?

  23. David Appell says:

    It doesn’t even make sense to say a trend has come to an end.

    First of all, unless you can see the future, you have no way of knowing that.

    Second of all, you’ve been saying the same old thing for years now.

    But mostly, a trend is just a way to summarize data. It might be a good summary, or it might not be. It’s simply a mathematical description of one aspect of the data, and that’s all. Unless there is some reason to think the underlying physics has changed — and I don’t see anyone claiming that — there’s no reason to expect a change in the trend (whatever it may be).

  24. David Appell says:

    Arfur: what is the point of considering the linear trend over 160 years? That’s only a reasonable thing to calculate if you have reason to believe temperature is changing linearly. If it were changing exponentially or logarithmically, say, you wouldn’t try to fit it to a straight line.

    The factors affecting climate in recent decades, especially GHGs, are different than was affecting it 100 years ago or 160 years ago.

    But, for the sake of argument, 0.06 C/decade linear warming over 160 years is 1 C of warming. That’s a lot. Where did it come from?

  25. David Appell says:

    > If you can’t accept that there has been no
    > warming since 1998, then that is your choice.

    I don’t accept that really — HadCRUT4 shows warming over the now notorious “16 years,” but it’s statistically significant at the 92% level instead of the canonical 95%:
    http://davidappell.blogspot.com/2012/12/the-closing-of-david-rose-hole.html

    (It depends, of course, on what exactly you mean by “statistically significant.” It ALWAYS depends.)

    But even if it were true, it does not disprove AGW. There are other factors that influence temperature — solar irradiance, aerosols, ENSOs — and that is what Foster and Rahmstorf tried to flesh out via multiple regression. They found the underlying AGW signal still there, but countered in recent years by ENSOs and some small changes in solar irradiance. (Regional aerosols are harder to consider.)

    Hence, most scientists expect warming to resume once its change of about 0.15-0.2 C/decade rises above the natural variability of (especially) ENSOs of about 0.3 C in a few years. Sadly, when it does I’m sure the so-called skeptics will be conveniently blaming it on an El Nino or something.

  26. Entropic man says:

    Salvatore del Prete

    http://www.metoffice.gov.uk/research/monitoring/climate/surface-temperature

    The table in this link summarises data from NCDC, GISS, Hadcrut3 and Hadcrut4.All three agree that the three warmest years on record are 1998, 2005 and 2010.NOAA agrees.

    This summarises the relevant temperature anomaly data.

    …….NOAA….NCDC….GISS….Hadcrut3….Hadcrut4
    1998___0.62____0.50____0.51____0.52________0.52
    2005___0.63____0.52____0.55____0.47________0.53
    2010___0.63____0.53____0.56____0.50________0.54

    Note that NCDC, GISS and Hadcrut4 agree.
    2010 was the warmest year on record, followed by 2005. 1998 came in third.

    NOAA has 2005 and 2010 tied for first place.Only Hadcrut 3 gives 1998 first place.

    Your contention that warming stopped in 1998 is based on obsolete data.

  27. Werner Brozek says:

    “Only Hadcrut 3 gives 1998 first place.”

    See my post above, and even this article. Besides Hadcrut3, Hadsst2, RSS and UAH also agree that 1998 was the warmest year.

  28. Entropic man says:

    Werner Brozek

    So which do we use?

    With eight different temperature records available, and no consensus,how does one decide which set of samples best reflects what is actually happening out there?

  29. Werner Brozek says:

    “So which do we use?“

    The following combines four sets of data:
    #Mean of HADCRUT3VGL, GISTEMP, UAH and RSS,

    See: http://www.woodfortrees.org/plot/wti/mean:12

    On this basis, 1998 comes out on top. However other combinations may well have a different outcome. Now there are problems with measurements such as the urban heat island effect and time of day issues, and what to do where there are few thermometers, etc. So perhaps satellite data is best.

  30. DABbio says:

    I want my third order polynomial back!

  31. Kristian says:

    Entropic man says: “Your contention that warming stopped in 1998 is based on obsolete data.”

    Yup, HadCRUT3 was made obsolete because it didn’t show the stipulated warming since 1997/98. Yet it is the only global dataset that agrees with all the oceanic (SSTA) and tropospheric records.

    GISS, NCDC and HadCRUT4 only agree with the adjustments made to push an agenda.

  32. David Appell says:

    HadCRUT3 underestimated the global temperature, by assuming the temperature across sparsely covered (with thermometers) Arctic was the global average.

    HadCRUT4, like GISS, assumes that area’s temperature is the average of nearby stations that ring it.

    Which seems more realistic to you?

    • Scott says:

      David,

      I’d actually say that neither is very realistic and they shouldn’t estimate that area at all. Extrapolating Arctic Ocean temperatures from the closest land stations is a head scratcher. It might make sense in the winter, but in the summer, it has an obvious bias. The loss of the Arctic sea ice is most prominent near the edges/shore, so these areas will show large summer warming trends since the temperatures there aren’t buffered by melting ice. But ice is still present (for now) over a large part of the Arctic during the summer, so giving its extrapolated temperature a trend similar to the land stations is foolish. The global trend makes more sense in that case than the closest stations, but in reality a trend of 0 might be better than either for areas that are essentially always covered by sea ice. However, I’d argue that just omitting those regions and only having minimal extrapolation over the Arctic using land-based data is the most honest approach.

      -Scott

  33. anthony beevor says:

    How many years does it take to establish a trend?

    Duh! “42”.

  34. Stephen Wilde says:

    Many thanks to Werner for his very helpful dataset comparisons.

  35. David Appell says:

    Scott: like all measurements, including temperature, HadCRUT4 is based on a model. It’s main use is not really the absolute temperature but a comparison of one time period to another. But it seems to me more accurate to take the average or the nearest sites, than of all sites, which includes a completely different hemisphere. Eliminating the Arctic skips over a region that is climatically crucial to the rest of the globe.

    • Scott says:

      David,

      Of course it uses anomalies. But extrapolating land-based anomalies that are heavily influenced by recently reduced Arctic Sea ice over ocean areas that haven’t (yet) seen reductions in sea ice cover is biased at best and dishonest at worst. It doesn’t matter that it doesn’t use absolute temperatures or anomalies…the bias still exists. Nor does it matter that it’s a model…the model works pretty well for interpolation between stations, but in this case it’s more of an extrapolation than interpolation, and so it’s not going to work nearly as well.

      If they want to have numbers for the Arctic Ocean, I think they’d better to use an (adjusted) extrapolation from the satellite measurements, which measure up to 82.5 N IIRC. You can feel free to disagree.

      -Scott

  36. Arfur Bryant says:

    David,

    I feel like I’ve walked into a theatre with ‘Goldilocks’ showing!

    At 1:53 pm on 3rd Jan you say:
    [“…19 years is too short of a time period to make statistically significant conclusions about temperature trends.”]

    And oat 6:59 pm you say:
    [“…what is the point of considering the linear trend over 160 years?”]

    So one trend is too short and the other is too long? Do you want to pick a trend that is just right to suit your view of what the climate is doing?

    You say GHGs have only had an effect ‘in recent decades’. I call foul on that.

    Let me take you back to 1998. The MBH98 ‘Hockeystick’ graph. You know, the one that was sold to Joe Public as ‘proof’ that AGW was happening, accelerating and potentially catastrophic for mankind. Hmmm, no-one mentioned that the warming from 1970 to 1998 was ‘too short’. Nope, the world was warming at an accelerative rate and it was down to anthropogenic emissions of CO2 and other nGHGs. Take a look at what happened before 1998 and what has happened since 1998. Be honest, be objective, do you think the warming prior to 1998 has been continued?

    If, as you say, the underlying AGW signal has been masked by ‘other factors’, then you have to accept that it is possible (objectively) that the warming of 1970-1998 was either caused by, or at least added to, by those same ‘other factors’ working in a different ratio to produce warming instead of masking.

    It is not unreasonable for you to believe in the theory of CO2 = cAGW, but it is unreasonable for you to deny the possibility that the radiative effects of CO2 and other nGHGs may have been over-estimated. If GHGs started to affect global temperatures in ‘recent decades’, what caused the warming of 1910-1945? That warming is almost <exactly the same as the later warming which you attribute to GHGs. This alone should make you pause for thought.

    It is entirely feasible that CO2 has very little – or even no – significant effect on global warming.

    I ask you to consider this problem:

    Back in 1850, when ‘accurate data’ started (according to the IPCC), there was an ‘Atmosphere Effect’ or ‘Greenhouse Effect’ if you prefer. In 1850, the level of CO2 was 280ppmbv. SInce then, there has been a recorded 41% increase in CO2 to 395ppmbv. Contemporaneously, the global recorded temperature has risen by about 0.8C in 162 years. The warming has variously increased, accelerated, flattened and cooled. There is no correlation between the various periods and the CO2 increase. So, if CO2 was a ‘significant’ player in the ‘Atmosphere/Greenhouse Effect’, why has a 41% increase in this major player not had a corresponding effect on the temperature? Before you say ‘thermal inertia, or feedbacks, please note that you have no evidence for either.

    The warmings of 1910-1945 and 1970-1998 are key here. You asked me what could have caused the 1 degree warming since 1850 (actually it is less than that, at around 0.8C). My honest answer, being objective, is that I cannot say. However, I can say, equally objectively, that there is NO evidence that CO2 can or has made any significant effect.

    If you wish to insist it has, then please provide evidence.

    Regards,

  37. Stephen Richards says:

    Every where Apple and Entrails go they disrupt the blogs with their cretinous crap.

    Grow up you two.

  38. David Appell says:

    >> If, as you say, the underlying AGW signal has been masked by ‘other factors’, then you have to accept that it is possible (objectively) that the warming of 1970-1998 was either caused by, or at least added to, by those same ‘other factors’ working in a different ratio to produce warming instead of masking. <<

    Prove it. (Foster and Rahmstorf begins in 1979.)

  39. David Appell says:

    >> If GHGs started to affect global temperatures in ‘recent decades’, what caused the warming of 1910-1945? That warming is almost <exactly the same as the later warming which you attribute to GHGs. This alone should make you pause for thought. <<

    Total solar irradiance increased by about 0.6 W/m2 from 1900 to 1950 (averaging across the solar cycle), and has changed little since then:
    http://lasp.colorado.edu/sorce/tsi_data/TSI_TIM_Reconstruction.txt

    In 1900, cumulative CO2 emission were an estimated 44 GtC, and by 1950 were about 139 GtC, which is certainly a nonzero forcing. By 2011 they are 539 GtC, which is a significant acceleration.
    http://cdiac.ornl.gov/trends/emis/overview.html

    It is scientifically inconceivable that CO2 has no effect on climate.

  40. David Appell says:

    Arthur: Here is some of the direct evidence of an increasing greenhouse effect:

    “Increases in greenhouse forcing inferred from the outgoing longwave radiation spectra of the Earth in 1970 and 1997,” J.E. Harries et al, Nature 410, 355-357 (15 March 2001). 
    http://www.nature.com/nature/journal/v410/n6826/abs/410355a0.html

    These findings have been confirmed:

    “Comparison of spectrally resolved outgoing longwave data between 1970 and present,” J.A. Griggs et al, Proc SPIE 164, 5543 (2004). http://spiedigitallibrary.org/proceedings/resource/2/psisdg/5543/1/164_1

    “Spectral signatures of climate change in the Earth’s infrared spectrum between 1970 and 2006,” Chen et al, (2007) http://www.eumetsat.int/Home/Main/Publications/Conference_and_Workshop_Proceedings/groups/cps/documents/document/pdf_conf_p50_s9_01_harries_v.pdf

    More papers on this subject are listed here:

    http://agwobserver.wordpress.com/2009/08/02/papers-on-changes-in-olr-due-to-ghgs/

  41. Arfur Bryant says on January 3, 2013 at 5:32 PM:

    “David,
    [“Ridiculous. The UAH LT for the last 10 years (i.e. 120 months) have been 0.17 C warmer than the 10 years before.
    You can’t make judgements about AGW based on short-term trends of a few years. You just can’t. Deal with it.”]”

    =============

    Short or long term trends do not matter. How can any sane person make any judgment about AGW based on temperature trends as long as the AGW theory itself has not yet been proved correct? –

  42. David Appell says:

    OH: AGW has been proved correct. The only big questions remaining are climate sensitivity (known only to about 50%) and the effects of clouds.

  43. Entropic man says:

    Werner Brozek

    “On this basis, 1998 comes out on top. However other combinations may well have a different outcome. Now there are problems with measurements such as the urban heat island effect and time of day issues, and what to do where there are few thermometers, etc. So perhaps satellite data is best.”

    Satellite data has its own problems, notably the inability to monitor high latitudes and the differences in calibration between the different sensors.

    The uncomfortabable reality is that all the data has measurement and environmental uncertainties that the compilers of records have to compensate for as best they can.

    That’s why I fret so much about the statistics. They give some idea of the limits of our knowledge and the limits to our ability to draw conclusions.

  44. Entropic man says:

    Scott

    “However, I’d argue that just omitting those regions and only having minimal extrapolation over the Arctic using land-based data is the most honest approach.”

    The problem with omitting the high Arctic is that, on the basis of the measurements available, this is one of the fastest warming regions on the planet.If you decide to ignore it, you are going to significantly underestimate overall warming.

    Ideally this area needs a lot more monitoring, but it is likely to get less.

    http://www.sai.develop.community.pdqmedia.info/?id=918

    • Scott says:

      Hi Entropic Man,

      Yes, the polar regions should be most affected, in terms of temperature, by a warming trend. But the need to measure trends in that region doesn’t mean that those trends should be subjected to a potentially biased extrapolation protocol in order to get “data” for those latitudes. A need for important data is not a license to lower standards. On the other hand, if the extrapolations were adjusted for sea ice coverage changes, then I’d be more accepting of them.

      -Scott

  45. Massimo PORZIO says:

    @David Appell
    From your link “IRIS, flown on Nimbus 4, is a Fourier transform spectrometer (FTS) with apodized spectral resolution of 2.8 cm-1 and a nadir field of view that corresponds to a ground footprint of 95 km in diameter”

    From NASA Nimbus 4 trajectory details “Periapsis 1092.0km” see here:
    nssdc.gsfc.nasa.gov/nmc/spacecraftOrbit.do?id=1970-025A

    Just compute the field of view angle as the arc tangent of (95/2)/1092 = 2.49° which is an aperture of just 4.98°.
    That Michelson interferometer based FFT spectrometer in no way sees all the outgoing scattered radiation.
    As I already wrote in a previous thread, it’s a long time that I found a research made by Franch/Italian scientist which reported this:
    http://www.atmos-chem-phys.net/6/5025/2006/acp-6-5025-2006.pdf

    Look at fig.1 and note the mirror at the spectrometer input slit. That mirror allowed the spectrometer to move its field of view from nadir to the so called “limb” view.
    I expected to see exactly what fig.3 shows. That is, there is an outgoing peak exactly where at the nadir the spectrometer sees the CO2 pit.
    When CO2 concentration increases, as the nadir pit became deeper, that peak of non-nadir outgoing scattered radiation became higher. To compute the right (if even exists) real energy back radiation, one should integrate the whole half spherical view of the input slit of the spectrometer for each TOA point; and if exist it must be many times lesser than those hypothesized in those papers.
    In the climate arena, that seems to be a common misunderstanding of what spectrometers measures.

  46. Dear AGW & CAGWarmists

    As far as my “quick research” can “unearth” : The pack ice between Iceland and Greenland had become too thick and robust by 1410 for any possible further communications between the two island to continue.

    1683 seems to have been the first “River Thames Frost Fair”; many such fairs took place throughout The Little Ice Age (TLIA), with the last one taking place in 1814.

    So, what did AGW have to do with that then? –

    Or… Does “The Hockey Stick” prove there was neither such thing as TLIA nor any Medieval Warm Period (MWP) presiding it?

  47. David Appell says:

    Are you really asking what AGW had to do with the climate of 1410 and 1683 A.D.? Before the Industrial Revolution??

    Not much — CO2 emissions were very slight — although see the work of William Ruddiman (and a few others).

  48. Kristian says:

    David Appell says: “AGW has been proven correct.”

    Yeah, that’s a good one!

    The ONLY mechanism by which the cooler atmosphere (through an enhanced GHE – your AGW) can induce a further warming of the already warmer surface is by reducing its total heat loss. Not by any other means.

    If the total heat loss of Earth’s surface is observed to INcrease during warming in the long-term, like in our case since the mid 70s, then that means this theoretical potential atmospheric warming mechanism CANNOT be the cause of the warming. It would effectively disprove the notion of the anthropogenically enhanced GHE’s dominance in any warming seen during the last three and a half decades.

    No heat will be able to accumulate at the surface through an enhanced GHE as long as the atmosphere in any way allows the total heat loss of that same surface to go beyond its original level (before the forcing) – that is, increase FROM that level.

  49. David Appell says:

    Kristian: When I was in graduate school (this was before the widespread reach of the Internet) the professors would get manuscripts in the mail explaining how special relativity was wrong, or the Big Bang could not have happened, or showing elementary proofs of Fermat’s Last Theorem. They would leave these manuscripts on the table in the mailroom for the graduate students to pick through, laugh about, and learn from.

    Today, the cranks pick on the greenhouse effect.

    I’m just not interested — it’s a waste of time.

  50. David Appell says on January 4, 2013 at 4:54 PM:

    “OH: AGW has been proved correct. The only big questions remaining are climate sensitivity (known only to about 50%) and the effects of clouds.”

    = = = = = = = =

    Oh has it been proved now? —– Really! —– Then pray tell me what the proof is.

    You see as far as I can see the evidence that the “basic physics” which is said to support the theory is all wrong.
    I am convinced that Joseph Fourier war correct in 1824. The “Dark radiation” from the ground is blocked (or absorbed – if you like) by water-molecules or H2O vapor right there – at the surface. – That goes for most of the radiation from most of the earth’s surface. – Just move your thoughts to a dry desert, say The Sahara where the air is dry, there most of the radiation escapes and the nights are therefore much cooler as the GHE from Water Vapor (WV) is reduced in accordance with the air’s “Moisture content” (MC). – A 20 % MC in the Sahara is a lot different to the 88 % we presently experience here (near Manchester UK).

    Now then, add to that that the production of IR wavelengths (WL) are heavily dependant on the emitter’s temperature and you will soon realize that anywhere where the temperature (T) is within the range where H2O absorbs it, wavelengths that CO2 will absorb must be far and few between.

    Apart from those WL that are produced by surfaces at a T below 0 deg. C where H2O is frozen solid anyway and therefore cannot absorb anything by radiation, I know of no place on earth where WV does not get heated at the surface.

    The most basic of all Thermodynamic Laws tell us that does.

  51. David Appell says:

    > Then pray tell me what the proof is.

    1) the Earth emits infrared radiation, and CO2 absorbs it; CO2 levels are rising
    2) see the links above on the enhanced greenhouse effect.
    3) stratospheric cooling
    4) widespread, long-term oceanic warming
    5) diurnal warming patterns
    6) rise of the height of the tropospause
    7) paleoclimatic variations (especially the PETM)
    8) no other factors can explain modern warming

    Now, go read some of the scientific papers, or at least a textbook.

  52. Kristian says:

    David Appell, you say: “I’m just not interested — it’s a waste of time.”

    Classic, condescendingly evasive warmist response.

    It’s a simple point made, David. And hence one that should be easy to refute.

    So why don’t you? What’s the problem? AGW is after all, according to you, already proven. Which means answering this question should pose no problem for you:

    How does the atmosphere make the Earth’s surface warmer by allowing its total heat loss to increase (both in the long-term)?

  53. Entropic man says:

    O. H. Dahlsveen

    You share Dr Spencer’s misapprehension that AGW acceptors are wedded to CO2 as a climate driver to the exclusion of everything else.

    My personal view is that the MWP marks an earlier warmer stage in the current interstadial and that the LIA was due to a reduction in solar insolation . Note how closely the LIA correalates with the Maunder Minimum.

    Since the latter 19th century neither orbital mechanics, solar insolation variations or other variables have produced significant changes in Earth’s energy budget, leaving CO2 induced warming as the only hypothesis whose physics matches the observed changes.

    I suggest you read Dr. Spencer’s Global Warming 101 on this website for a primer on the process and the evidence. He takes a very conservative view of the degree of CO2 induced warming, but his basic physics is sound.

  54. David Appell says:

    Kristan: Because there is never an end to the arguments of cranks.

    Get your idea published in a journal that is at least semi-respectable, and send me a copy of the paper.

  55. Entropic man says:

    Kristian

    “How does the atmosphere make the Earth’s surface warmer by allowing its total heat loss to increase (both in the long-term)?”

    As I said to O. H. Dahlsveen, read Dr. Spencer’s Global Warming 101 article on this site.

  56. Kristian says:

    David: Again, this is a complete non-answer. To a very simple question. If you KNOW that AGW has caused the warming we’ve seen, then you should also know by what mechanism it accomplished this feat.

    Based on this I’ll ask the question again: “How does the atmosphere make the Earth’s surface warmer by allowing its total heat loss to increase (both in the long-term)?”

  57. tonyM says:

    Arfur Bryant
    January 4, 2013 at 2:37 PM

    Arfur – a nicely put clear essay addressing the issues and selective cherry picking of stats.

    May I add to those observations. The increase of CO2 from 1850 would imply a forcing of close to 2 W/m2 and in Hansen’s supposedly empirical conversion equates to nearly 1.5 deg K. This is close to double the observed increase in global T since 1850.

    This is a long enough period for all major forcings and feedbacks to come into play. It also presupposes that there was no other underlying T increase trend. The latter is hard to accept as the mid 17th century was the nadir of T in the last 1000 years.

    Lindzen took it further by suggesting that CO2 equivalent has doubled since the 1880’s as man has also increased the output of other gases which have a much stronger GHG effect than CO2. Yet the T increase is only of the order of 1 deg K which is more consistent with just the CO2 effect and no positive feedback.

    This is more in line with Dr Spencer’s thinking.

    Ultimately that is the empirical evidence that faces the Hansen type hypothesis and it fails.

  58. Kristian says:

    Entropic man,

    You quote my question. And yet you do not even make an attempt to answer it.

    I’ll give you one more chance …

    BTW, in Roy’s GW101 article it says: “Global warming theory says that the lower atmosphere must then respond to this energy imbalance (less IR radiation being lost than solar energy being absorbed) by causing an increase in temperature (which causes an increase in the IR escaping to space) until the emitted IR radiation once again equals the amount of absorbed sunlight. That is, the Earth must increase its temperature until global energy balance is once again restored. This is the basic explanation of global warming theory.”

    If the solar input AND the latent and sensible heat transfer processes for simplicity’s sake are assumed to remain constant, then this to me clearly states that the heat loss from the surface (and all layers of air in the troposphere) is first incrementally reduced by more GHGs in the atmosphere, leading to accumulation of heat -> warming, incrementally increasing the heat loss back up again, but never beyond the original level – only until balance is restored. So we would never actually SEE the surface (or tropospheric) heat loss increasing. Only the mean temperature. That’s the whole point. That’s how the atmospheric warming mechanism works.

    So how can the atmosphere be responsible for any long-term surface warming if increased long-term heat loss is observed during the warming?

  59. David Appell says:

    Kristian says:
    > If you KNOW that AGW has caused the warming we’ve seen, then you should also know by what mechanism it accomplished this feat. <

    Absorption of upwelling infrared radiation, and re-emission in all directions.

  60. Kristian says:

    David, you say: “Absorption of upwelling infrared radiation, and re-emission in all directions.”

    Yes, so this would reduce the rate of heat loss from the Earth’s surface.

    So how does that same surface warm if its total heat loss is observed to increase, David?

  61. David Appell says on January 4, 2013 at 6:31 PM:

    “Now, go read some of the scientific papers, or at least a textbook.” he ends but starts:

    “1) The Earth emits infrared radiation, and CO2 absorbs it; CO2 levels are rising”
    ——
    I assume you mean the Earth’s surface emits infrared radiation —-. If so, Ok that is the basics for all AGW beliefs, but how do you then explain the fact that CO2 does follow the lapse rate (moist or dry) that affects the rest of the atmosphere. And indeed why should there be such a thing as moist (saturated) lapse rate if these greenhouse gases are receiving a constant supply of heat from the ground?
    = = =
    2) see the links above on the enhanced greenhouse effect.
    —–
    I have seen it, read it and rejected it, Mainly because there is nothing unusual about this last “warming spike”.
    = = =
    3) stratospheric cooling
    —–
    So you are saying that CO2 causes the Stratosphere to cool but other causes for Tropospheric warming does not.?
    = = =
    4) widespread, long-term oceanic warming
    —-
    How do you know that as being a fact? – And while I am at it, how can an atmospheric gas molecule that can warm more than the rest of the gases contained in the same air-pocket or mass without rising up warm the oceans below? (An atmospheric gas-molecule that receives constant IR radiation at say 15 deg. C from surface radiation cannot cool down at the same rate as it’s non GHG molecule companions – or if it does how then can it be a called a GHG.)
    = = =

    5) diurnal warming patterns
    —-
    How do you know they have they changed due to a 0.01 % increase of atmospheric CO2 content. And do you know they have changed globally?
    = = =
    6) rise of the height of the tropospause
    —-
    The tropospheric hight, and the Tropospause with it, is moving up and down all the time as the Earth circles the Sun. And for how long have we been measuring these heights? We did not have much of a clue even about the Jet Streams until WW2
    = = =
    7) paleoclimatic variations (especially the PETM)
    = = =
    This last one and the smiley with no other factors can explain modern warming statement you shall have to explain a bit more in depth.

  62. David Appell says:

    Kristian says:
    January 4, 2013 at 8:05 PM
    David, you say: “Absorption of upwelling infrared radiation, and re-emission in all directions.”

    Yes, so this would reduce the rate of heat loss from the Earth’s surface.

    So how does that same surface warm if its total heat loss is observed to increase, David?

    What are you talking about??

    If the rate of heat loss decreases, the ‘total heat loss’ does not increase.

  63. David Appell says:

    >> 4) widespread, long-term oceanic warming
    —-
    How do you know that as being a fact? <<

    http://www.nodc.noaa.gov/OC5/3M_HEAT_CONTENT/

    Do you have better data?

  64. David Appell says on January 4, 2013 at 8:21 PM:

    http://www.nodc.noaa.gov/OC5/3M_HEAT_CONTENT/

    Do you have better data?
    = = = = = = = =
    No, of course I haven’t. As you must realize I am looking at your supplied evidence of long-term oceanic warming. And no one else’s counts on this occasion.

    So far I have I have clicked on the oceanic temperatures at 10 meters dept. and from 1955 till 2011 it looks to me as if the oceans have cooled quite a lot as the red colors are disappearing little by little as you go back in time.

    Why don’t you, for a change, try to think for yourself and look at the data, instead of reading AGW propaganda and take it as gospel?

  65. Sorry; “it looks to me as if the oceans have cooled quite a lot as the red colors are disappearing little by little as you go back in time.” should have read:

    “it looks to me as if the oceans have cooled quite a lot as the red colors are disappearing little by little as you go forward in time from 1955.”

    And there was no need for me to repeat “I have”

    It is getting late, or early morning here and I am getting tired.

  66. David Appell says:

    OH: So you have no data of your own.

    Just as I thought.

    That makes your arguments worthless, scientifically.

    Try harder.

  67. David Appell says on January 4, 2013 at 10:46 PM:

    “OH: So you have no data of your own.”

    = = = =

    Oh yes, I have got lots of data of my own but when somebody show me a data-set and make a false claim or statement about the said data, then it is only fair that I use the data supplied to point out the errors of their way.

    All the data we need is freely available here on the internet anyway – so the data we find here belong neither to you nor to me. I therefore will never claim that data published by NASA, the IPCC or any other organization or person is my data.

    But it would be nice if you accepted the fact that “your data” show Ocean Cooling, at least on one or two occasions.

    You know what? Trenberth, Dr. Kevin E. Trenberth that is, has been looking for this “missing” ocean heat for a very long time by now. He has been looking at various different depths but he hasn’t found it yet.

    – At least it shows that he can read a data-set when he sees one.

    Don’t try any harder, please!

  68. David Appell says:

    OH: Simply put, where is your data?

  69. David Appell

    My data is around here in various archives somewhere. But as I am not making any specific claims that need backing up with specialized data, I see no necessity to spend hours dragging them out.

    I will admit that sometimes I may quote, maybe loosely, from someone else’s story or claims but not if there is something serious at stake.

    When it comes to somebody else’s claims of warming by radiation to and from various gases and/or objects I would dearly like to be able to prove them right, but all my experiments have so far failed – and by the way – all around us is multiple evidence that what we call air is a very good blocking agent for what some people call IR radiation

  70. Kristian says:

    David Appell says: “What are you talking about?? If the rate of heat loss decreases, the ‘total heat loss’ does not increase.”

    Yes, but you see, the rate of heat loss only decreases in THEORY, David. That is, the TOTAL heat loss. Reducing but ONE of all the surface heat loss mechanisms at hand won’t cut it. ONLY in theory. Your static theory.

    I’m talking about what is actually observed to have happened globally out there in THE REAL WORLD over the course of the last three and a half decades, directly contradicting your theoretical atmospheric mechanism that only works if the total heat loss from the surface is reduced in the long-term.

    Or are you in fact now making the claim that the total heat loss (latent heat transfer + sensible heat transfer + net IR) from the Earth’s surface has been declining globally between the mid 70s and today …?!

    Stop avoiding the question. Stop twisting and turning. You seem more and more desperate not to answer it. At all costs.

    Just answer. And be done with it. I’ll ask you again:

    “How does the atmosphere make the Earth’s surface warmer by allowing its total heat loss to increase (both in the long-term)?”

  71. Oh and by the way Entropic man, I have read Dr. Spencer’s Global Warming 101 article on this site. His article comes in two main parts, first comes the basic explanation of global warming theory. That’s fine; I do believe that to be so.

    That is not to say that I believe it to be true.

    Then comes the second part which is what I would call a thought experiment which to many will make sense at first, as indeed it did to me.
    He further says: “The same energy balance concept applies to a pot of water on a stove set on “low”.”

    And his explanation of what happens to the water in the pot at each stage of increasing the pot’s heat input is ‘spot on’ – as far as I can tell -.
    Then I came to visualize and compare the water filled pot to the earth’s atmosphere and the stove to the earth’s surface.

    – And that’s when his story fell to bits. –

    You see, in my mind by tweaking the stoves heat up by increasing the energy input he was in fact simulating an increased solar radiation absorption by the earth’s surface. So what Spencer was doing was in fact simulating an increasing atmospheric heating by providing an increased “solar energy input” – again and again.

    What he should have done to show Greenhouse (GH) warming was to simply to put a lid on the pot thus keeping the heat inside the pot. – But he did not, maybe because we all know that an unvented pressure cooker will explode if the heat is not turned down – or off, in time. – Maybe it was because he would then be showing simulated CAGW – or could it be that he knows there is no solid roof or lid above the Troposphere?
    In any case he could not show, or explain, how back radiation from the pot’s departing water vapor was warming the water in the said pot.

    His AGW experiment 101 failed.

  72. Kristian says:

    OH Dahlsveen (am I right in assuming you’re Norwegian?),

    I found that same thought experiment to be peculiar. Because I agree. It corresponds rather to the (direct) SOLAR warming of the Earth’s surface than to the (INdirect) ATMOSPHERIC warming mechanism.

  73. Arfur Bryant says:

    O H Dahlsveen says:
    January 4, 2013 at 4:46 PM

    OHD, I hope you realise that I was quoting David Appell. Those were not my words.

    The trend discussion was about the rise in temperature. I agree there has been no proof of AGW, certainly not any quantitative proof anyway.

    Most pro-AGW commenters make the simple error of assuming that the known radiative properties of CO2 can be somehow transmuted into a significant global warming effect. They make a pseudo-scientific case based on models but are unable to objectively rationalise the lack of evidential data to support the models.

  74. Arfur Bryant says:

    tonyM says:
    January 4, 2013 at 7:46 PM

    Tony,

    Many thanks for your kind words.

    I agree 100% with your further comments. The climate sensitivity issue is particularly interesting. the main problem I see is this:

    No-one can state with any supporting evidence exactly how much of the 0.8C warming since 1850 is due to CO2. It could be somewhere between 0.01C and 0.79C. It is impossible for it to be 0.8C because that would deny the possibility of any natural forcing. It is implausible (but not impossible) for it to be zero because the known radiative properties of CO2 (and other nGHGs) must have a theoretical forcing effect, however small. It is this question of quantifying this CO2 effect that provides most of the argument IMO.

    Therefore, all anyone can say is that CO2 may have been responsible for an unknown portion of the observed warming since 1850. How much is up for debate.:)

    Regards,

  75. Sorry Arfur

    Yes, looking back at your posting now I realize my error. Still hopefully no great harm done.

  76. Arfur Bryant says:

    David Appell says:
    January 4, 2013 at 3:56 PM

    David,

    ‘Prove it?’

    Logic is its own proof. You argue that the lack of warming since 1998 is because of ‘masking’ factors. I repeat, if you accept this, then you have to accept that those same factors – in a different formula – have the ability to provide for short periods of accelerated warming. To deny this is to counter your own argument!

    This discussion between us started because you claimed ‘thermal inertia’ was present and therefore ‘trends of 19 years’ were insufficient. I asked you to explain the ‘thermal inertia’ comment. You gave me a vague answer of “the oceans, mostly”. Until you address this point, all thats going to happen is we are going to descend into the plug-hole of epistemological hand-waving.

    The issue is fairly simple:

    If ‘thermal inertia’ is present, how much is the lag and where is the evidence for it?

    If the lag is less than, say, 5 years, then the 14-year flattening has exceeded over two periods of lag with no sign of the ‘lagged’ warmth. If the lag is 15 years or more, then you will have to address the question of what cause the flattening 15 years prior to the flattening!

    You keep quoting F&R 2011. If that floats your boat, then fine. You say it starts in 1979, so here are two datasets (HadCRUt3/4 and UAH): Where is the AGW signal?

    http://www.climate4you.com/images/HadCRUT4%20GlobalMonthlyTempSince1979%20With37monthRunningAverage.gif

    http://www.climate4you.com/images/MSU%20UAH%20GlobalMonthlyTempSince1979%20With37monthRunningAverage.gif

    You’ll notice that both (actually three) sets all place today at about 0.25C below 1998. That is a reduction of 30% of the total warming since 1850!

    Sorry for the delay in my replies, I have a lot on and can only get online infrequently.

  77. Daniel Reppion says:

    Most of the ‘epistemological hand waving’ is coming from those obsessed with 1998. I look at that data – there is basic upward trend of about .5 of a degree over that period (34 years). You have ONE year out of 34, with which a silly tedious ballet of cant, counter cant and rhetoric is formed. Drivel comparing different data sources, arguing over the precise value of 6 monthly data points in a 400 odd month set.

    Make an under-grad happy, do a simple thought experiment for me. Make 1998 an average period in that series. what do you have? Essentially a warming series – with a flattening in the mid 2000s.

    Put 1998 back in what do you have? Exactly the same thing, but with an unusually warm patch in 1998. Looking at the UAH data, the average 2000s months are warmer than they were in the 90s, and the average 90s months were in turn warmer than those 80s. The same can be said for the unusually warmer months (with the caveat of ’98), and the unusually colder months. Both ‘sides’ (the fact that there are ‘sides’ tells me how little scientific value there is in these exchanges) seem to play a game of hockey with ’98, it’s irrelevant.

    Ultimately you ought to be discussing what causes these observations, not whether or not you can shape them to fit your view. If you want to say – ‘the last decade show a flattening trend’ then yeh – that’s a valid interpretation. You can apply that to your opinion on GW theory, knock yourself out.

    Please try and consider things across the entirety of the set, the central values as well as outliers, colder and warmer.

  78. David it is wishful thinkng on your part.

    The reason there WAS a warming trend from the end of the Dalton Minimimum to 1998, was due to natural factors led by solar activity.

    TABLE OF COMPARISOMES

    PERIOD AVG AA INDEX TEMP DIFFERENCE FROM 1910

    1900-20 14 0

    1980-96 27 +.6C

    maunder min. 0-12 -.6c

    That is the data, it shows a clear correlation between goemagnetic activity here on earth ,being exerted by the sun to the earth, and the correspondingly temperature response.

    Since 2005 the aa index has fallen sharply now being replace by the ap index, essentially the same index.

    DAVID THE DATA DOES NOT LIE.

    David also does not understand time lags and temperature response.

    The reason why temperatures have notactually gone down yet, even though the solar minimum conditions appeared in late 2005, is due in large part to the ocean heat content build up which took place over the last some 100 years due to the very strong solar activity. This takes time to dissipate. In addition low solar activity has only been going on since 2005, in contrast to mostly high solar activity since 1850 or thereabouts. Thirdly, we are currently in the maximum of solar cycle 24 although very weak, it is still a maximum.

    These three factors will be becoming less of a factor going forward, and once solar activity levels reach critical low or quiet values, combined with ocean heat content on the decline and the accumulation of sub-solar years increasing, the temperature trend will be down.

    Also there is no sign of stratospheric cooling, there are no real signs of any type of a strong postitive feedbacks between co2 and water vapor, as is evidenced by the lack of a lower troposheric hotspot near the equator.

    CO2 is near the saturation point of absorbing the OLR ,it does absorb, and the amounts of OLR being emitted from earth to space have no real definitive trend since 1979, when the satellite era commenced.

    David, unlike some others I do believe in a greenhouse effect, but a limited one.

    Some like Doug Cotton ,believe in no greenhouse gas effect at all. I don’t go near that far.

  79. Martinitony says:

    I am a lay person when it comes to climate. I have had college courses in statistics and probability.

    Reading this discourse on whether or not the data sets prove or disprove even if the warming trend (if it was a trend) of the last 30 years is ended, let alone whether or not it is (was) a function of increases in CO2, tells me that something is terribly wrong with our government’s policies regarding these matters.

    Being trained as an accountant and then working in a variety of business pursuits over 44 years, I can’t imagine making a business decision affecting millions of dollars based on the facts(or lack of facts) as presented by the science community.
    Now, I spoke of millions and the government has moved forward to spend or cause to be spent trillions of dollars.

    Someone step up and tell those of us who are not scientists what in hell is going on.

  80. John says:

    Ah, but Martinitony, your forget. The scientists who believe AGW are correct, all others are wrong according to the politicians pushing their agenda. Nothing else matters. It’s pure dogma.

  81. anthony beevor says:

    Chancellor Bismark said that nothing can be regarded
    as true until it has been officially denied.
    I am waiting for President Obama to deny AGW, when
    I might start believing in it.

  82. Arfur Bryant says:

    O H Dahlsveen says:
    January 5, 2013 at 4:06 AM

    OHD,

    Absolutely no problem at all old chap! You made a very good point! 🙂

    regards,

  83. Daniel Reppion says:

    Presumably Bismark Followed his statement by immediately denying it’s validity, to avoid an unfortunate paradox.

  84. anthony beevor says:

    I do not know why people get so excited and
    argue so much. It does not matter a tuppeny
    dam what ANY of us in the advanced countries
    think or do. China is now the No.1 producer
    of CO2 in the world having gone from annual
    3,000 megatonnes to 6,200 megatonnes in just
    a decade. They WILL (barring economic collapse,
    of course) go to 10,000 megatonnes before 2020.
    India, Brazil, Russia, et al, are all determined
    to follow suit.

    Somebody should give them a good ticking off.
    Perhaps send Mr Appell; that would learn ’em!

  85. Arfur Bryant says:

    Daniel Reppion says:
    January 5, 2013 at 8:26 AM

    Daniel,

    On the face of it, your comment is entirely sensible. However, 1998 is not important just because it is the ‘peak’ in (some) surface and (all) satellite datasets…

    The peak reached in 1998 was the ‘killer blow’ used by governments and some climate scientists to sell to the world (Joe Public) the ‘fact’ that catastrophic AGW was happening due to the increase in atmospheric CO2 by man-made emissions. it was the last point on the MBH98 ‘Hockeystick’ graph and was used in many public and government assertions that the planet was in danger from CO2.

    Today, my last paragraph is considered a ‘political’ statement by those who support the idea of CO2=cAGW. But the point is that, back in 1998 (and for years after), it was THE proof. Hardly anyone mentioned outliers. Hardly anyone mentioned lag (‘thermal inertia’). Hardly anyone (except for a few objective scientists) spoke about the poor science being used in splicing entirely different datasets and pronouncing a result!

    Today, I accept you can call 1998 an outlier. The problem is that the pro-cAGW commenters are trying to make out that the reason the global temperature is not continuing along the same path as it was immediately prior to 1998 is because of ‘other factors’.

    Remember, cAGW is theorised to be an accumulative effect. The temperature ‘should’ be rising at an increasing rate (especially if you believe the ‘thermal inertia’ nonsense!). If so, the steepness of the plot should be increasing. The IPCC stated that the effects of CO2-induced AGW would accelerate (they were talking about sea level rise, as a consequence of AGW, at the time). The warming is not accelerating. Sea level rise is not accelerating.

    So, yes, now 1998 can be called an outlier. Although I argue that the warming has flattened since 1998, I don’t argue that it will not warm further. I just maintain that any further warming cannot be shown to be due to CO2 using currently available data.

    As to what causes these observations – good point. I have already spoken about the fact that – whatever we say in these debates – there was a Greenhouse/Atmosphere Effect back in 1850 (pre current data). So what caused the GHE then? The increase since then (the enhanced GHE) is tiny compared to the significance theoretically attributed to CO2. Can you believe that the pro-cAGW scientists actually think CO2 contributes about 25% to the Greenhouse Effect?

    On the subject of ‘averages of decades’, I repeat my point made early in the thread:
    If you climb a hill then walk along a plateau, your ‘average height’ on the plateau will always be higher than when you were climbing up to the plateau. It is perfectly fair to say that this decade is ‘warmer’ than previous ones. It is not fair to say that we are ‘still warming’ until the temperature starts to climb again – which may or may not happen.

    There is no denying the fact that, according to observed data, the near-surface temperature has increased (in fits and starts) since 1850. I hope I have not given an impression otherwise.

    I hope this clarifies my point.

    Regards,

  86. Entropic man says:

    Arfur Bryant, Daniel Reppion

    I find this graph useful.

    http://www.metoffice.gov.uk/research/monitoring/climate/surface-temperature

    Look at Image 5, GLobal Average temperatures 1850-2010. the smoothed average with 95% confidence limits (blue line. This gives a good visual representation of the temperature record, with the year on year variations damped and an indication of the uncertainties.

    To decide if two periods are significantly different look at the 95% confidence limits. If they do not overlap, then the years are significantly different.

    Note that at latter 20th century rates of warming (0.1C/decade), you need 20 years of data to demonstrate a significant trend.

    This makes the arguments about warming, lack thereof or acceleration moot, since the time period is too short. All you can say with 95% confidence is that since 1998 the climate has warmed or cooled by no more than 0.2C.

  87. Entropic man says:

    Martinitony says:

    “Someone step up and tell those of us who are not scientists what in hell is going on.”

    In the 1970s fears of a nuclear winter after WW3 prompted serious research on climate change, and a realisation among scientists that a sustained warming trend was under way. The consensus was that increased CO2 released by industry was trapping more heat.

    In 1988 the Intergovernmental Panel on Climate change (IPCC)was set up to summarise the state of climate research and advise governments of probable future trends, reporting roughly every 5 years.Successive reports have predicted considerable warming, with probabilities and uncertainties for various outcomes and consequences such as sea level changes.

    Due to the complexity of climate no firm predictions are possible. Alas, it is not like predicting your next quarterly budget.

    The uncertainty allows some alarmists to predict immediate disaster, while others are convinced that it is all a false alarm. Considerable lobbying by interest groups on both sides creates even more smoke.

    For a government trying to balance scientific advice against political pressure, against limited funding; decisions are like placing bets.

    Should they spend money building better sea defences, and risk being seen to waste money if sea level does not rise, or should they leave defences as they are and risk them being overtopped by rising storm surge levels.

    Should they invest in renewable power generation to limit CO2 production, or burn more coal and risk the consequences if increased CO2 disrupts the weather?

    On this site we are arguing about the science for the fun of it. God help those who have to make such decisions for real!

  88. Entropic man says:

    O H Dahlsveen

    “You know what? Trenberth, Dr. Kevin E. Trenberth that is, has been looking for this “missing” ocean heat for a very long time by now. He has been looking at various different depths but he hasn’t found it yet.”

    It may have been found.

    http://www.nature.com/ngeo/journal/vaop/ncurrent/full/ngeo1375.html

  89. anthony beevor says:

    Daniel Reppion

    I think he had been fired by the Kaiser,
    when he made the statement. Typical politician,
    of course; told the truth…but millions were already
    dead in the wars he started with Austria and France.

  90. Kristian says:

    Entropic man,

    No, I don’t need to try this nor that. I know how the greenhouse effect is supposed to work.

    You should try answering my question instead, rather than spending time finding ways not to answer it.

    How does the atmosphere cause warming of the surface when the total heat loss from that same surface is observed to increase during the warming?

    Is this really such a hard question to answer, Entropic man?

    What source of surface warming does increasing total heat loss point to? Hint: It’s NOT anything anthropogenic …

  91. Kristian says:

    Was this posting somehow stuck in the spam filter?

    Arfur Bryant says:
    January 5, 2013 at 4:25 AM

    I want to stress a very important point when it comes to the HadCRUTgl datasets:

    In 1998 the Hadley Centre of UKMO switched data sources for their sea surface temperature record – the HadSST. This switch led to a very visible, but apparently never addressed, artificial upward shift in the data at the seam between the two data sources. This obvious error has never been corrected for, not even after the introduction of the HadSST3. It’s rather been swept under the rug it seems.

    (Bob Tisdale noted this peculiarity already in December 2008. See his first blog post about the matter here:
    http://bobtisdale.wordpress.com/2008/12/12/the-step-change-in-hadsst-data-after-the-199798-el-nino/ )

    Why is the HadSST upward shift at the 1997/98 transition such an obvious error?

    Compare ‘HadSST2gl’ with ‘Reynolds OI.v2?:

    http://i1172.photobucket.com/albums/r565/Keyell/OIv2vsHadSST2.jpg

    with ERSST.v3b:

    http://i1172.photobucket.com/albums/r565/Keyell/HadSST2vsERSSTv3.jpg

    and with HadISST1:

    http://i1172.photobucket.com/albums/r565/Keyell/HadSST2vsHadISST1.jpg

  92. Kristian says:

    The upward step in HadSST in 1998 compared to Reynolds OI.v2 gave a sudden (and permanent) artificial warming amounting to about 0.09 deg. C:

    http://i37.tinypic.com/ighm9s.jpg

    Since the 1997/98 switch in data sources AFAIK only concerns the sea surface temperature record, not the land record of CRU, the adjustment needed to be made for the total HadCRUT dataset (both 3 and 4) is down 0.09 X 0.7 = 0.064 deg. C:

    http://www.woodfortrees.org/plot/hadcrut3vgl/from:1979/to:1998/plot/hadcrut3vgl/from:1998/offset:-0.064/plot/none

    http://www.woodfortrees.org/plot/hadcrut4gl/from:1979/to:1998/plot/hadcrut4gl/from:1998/offset:-0.064

    This correction does of course not affect the trends since 1998, but certainly the trends drawn back to the 70s.

    And it puts the global GISTEMP (and NCDC) datasets in an even more conspicuous position post 1997/98 than before:

    http://www.woodfortrees.org/plot/hadcrut4gl/from:1979/to:1998/mean:6/plot/hadcrut4gl/from:1998/offset:-0.064/mean:6/plot/gistemp/from:1979/mean:6/offset:-0.08

  93. Entropic man says:

    Kristian

    Add CO2. The atmosphere absorbs and reradiates a greater part of the heat radiated from the surface back to the surface. The effect is to slow the rate at which heat from the surface radiates into space.
    The result is that the heat input from space exceeds the heat output to space, which raises the surface and atmospheric temperature.
    A new equilibrium occurs at a higher surface temperature, which restores the heat loss to space to the value it had before the increase in CO2.

  94. Kristian says:

    Entropic man,

    Yes. That’s the theory. I agree. But this is simply the premise of my question. Which you still didn’t answer.

    But we’re getting there.

    Because I hope you see the implications this setup has for the significance of the so-called enhanced GHE as a causative factor in the observed global warming since the mid 70s IF the total heat loss from the global surface (and/or, for that matter, the TOA) is observed to have INCREASED during the warming.

    Only the Sun can allow total heat loss to increase past the original level (before the forcing started) and still induce warming. This is because the Sun heats the surface of the Earth directly (it’s hotter than the Earth). The atmosphere, on the other hand, cannot allow this to happen IF it wants to keep its warming mechanism working. This is because the atmosphere can only make the surface warmer INdirectly (it’s cooler than the Earth’s surface), by as you said ‘slowing down’ its heat loss.

    So there you are, Entropic man. Has the total heat loss from the Earth system (surface, TOA or anywhere in between) increased or decreased during the observed warming since the 70s?

    What’s your guess?

  95. John says:

    David Appell: “what this really tells you is that 19 years is too short of a time period to make statistically significant conclusions about temperature trends — there is just too much thermal inertia in the system.”

    And too much noise.

  96. Day By Day says:

    Maybe salvatore del prete can tell me why it is being claimed that December in the NH is above the normal when there have devestating and global record lows all month long? I asked on WUWT and got some supportive comments but not an explanation.

    From http://icecap.us/ on Jan 5th, 2013
    Since late November the country has shivered at an average of minus 3.8 degrees Celsius, 1.3 degrees colder than the previous average, and the chilliest in 28 years, state news agency Xinhua said on Saturday, citing the China Meteorological Administration. The cold in Eurasia and elsewhere offset warmth in the US and created global temperatures below the NCEP model normal for December.

    I been following the record lows this December.Bitter cold has covered the globe in Dec-Jan. How can Dr Spencer’s data show this, “Northern Hemisphere: +0.14 C (about 0.25 degrees Fahrenheit) above 30-year average for December.”

    I don’t believe it. And the NCEP agrees with me.

    And Matt G from another blog wrote, A reminder for those that didn’t know, HAD3 had December 2010 about 0.5c to 1c above average for the UK when it was the second coldest December recorded.

    So am wondering if this December data showing December warmth for the NH is the same sort of mistake?

  97. Arfur Bryant says:

    Kristian says:
    January 5, 2013 at 3:44 PM

    Kristian,

    Looks like that post might have been stuck in the filter!

    Many thanks for the information (and the following post). I was not aware of that change in data source.

    Every day is a school day! 🙂

    Regards,

  98. Arfur Bryant says:

    Entropic man says:
    January 5, 2013 at 1:32 PM

    [“I find this graph useful…]”

    [“All you can say with 95% confidence is that since 1998 the climate has warmed or cooled by no more than 0.2C.”]

    I’m glad you find that graph useful, Entropic.

    Why not use an up-to-date graph or graphs using the same data source which is/are easier to read?:

    HadCRUt3:
    http://www.climate4you.com/images/HadCRUT4%20GlobalMonthlyTempSince1979%20With37monthRunningAverage.gif

    HadSST2:
    http://www.climate4you.com/images/HadSST2%20GlobalMonthlyTempSince1979%20With37monthRunningAverage.gif

    Or use the actual data linked from climate4you…

    How do you get the climate has ‘warmed’ by no more than 0.2C? There is no ‘warmed or cooled’ about it…

  99. Christian says:

    What do NCEP saying? (-90-90 and -180 to 180)

    Air-Temperature: Rank 11 of 64

    http://www.esrl.noaa.gov/psd/cgi-bin/data/timeseries/timeseries1.pl

  100. Christian says:

    Another point, who is really wonder about december temperature? Because we have not to forget, that we see the biggest Snowarea for a december this year and their is some kind of evidence that this can also be caused by arctic warming and changeing weather-Patters AO/NAO via more vertically propagating planetary waves into arctic stratosphere(Winter-Times) and more Sibiran-Snowfall in Auntuum.(Usefull for vertical propagations)

    So some kind of Stuff for it:

    http://iopscience.iop.org/1748-9326/7/1/014007
    http://polarmet.osu.edu/PolarMet/PMGFulldocs/wilson_bromwich_jgr_2011.pdf
    http://curryja.files.wordpress.com/2012/03/pnas.pdf
    http://onlinelibrary.wiley.com/doi/10.1029/2012JD018047/abstract

    And Orsolini et al 2011

    Also discussed and some evidence for Solar-Imprint in NAO/AO…

    Perhaps, we dont know well this, but its beeing stupid to think that declining sea ice will not influence the Atmosphere..

    So i think, the Januar could be global the same like December or a little bit cooler and the NH will cools down.. its show a cleary sign of feedback…

    greets

  101. anthony beevor says:

    Day by Day said

    “[How come] Global record lows all month [December]long
    [and yet a high average]?”

    I think he meant something like

    “How come record lows all OVER the Globe during December
    and yet a high average ?”

    One answer is that there is a lot of regional variation.

    BUT his point that this is ODD is correct. And that
    is because this talk about “averages” is footling.

    Temperature is what is called a distributed quantity
    and its distribution in the ocean/atmosphere system is non-homogeneous in respect of both time and space.

    “In cases in which the distribution is non-homogeneous,
    the attention must be directed to what takes place in
    small regions.”

    Edward Nichols, Professor of Physics in Cornell
    University, “Elements of Physics”,1896, p.23.

    In other words, “no averages”. The Carthaginians knew it; the Greeks knew it; Professor Nichols knew it; and now you know it.

  102. Christopher Game says:

    With respect, I would like to suggest to Dr Spencer that the 13-month average is not quite ideal for its purpose, which is to de-deasonalize and to smooth. It is used because it has the symmetry that the sequentially central month of the average coincides with the named month. But it worries me that the outer two months, the first and the thirteenth, are seasonally the same and get an unfair over-representation, with no benefit, just for the sake of the symmetry.

    Would Dr Spencer consider halving the weights of the two outer months, so as to have a twelve month average with the desired symmetry? Perhaps he already does just that but I am unaware of it? I think this should do the de-seasonalizing that the 13-month average aims at, but more fairly, and indeed more accurately? The smoothing would be hardly affected, perhaps slightly reduced.

  103. Entropic man says:

    Kristian

    “How does the atmosphere make the Earth’s surface warmer by allowing its total heat loss to increase (both in the long-term)?”

    Your question demonstrates a misunderstanding of the process.The atmosphere does not warm the surface by increasing heat loss. The warming is a secondary effect of the CO2 in the atmosphere DECREASING the rate of heat loss.

    Consider a simple analogy.

    An uninsulated copper hot water tank is heated by a 10W electric heater, switched on continually.

    The tank reaches equilibrium when the temperature is at that value which causes the tank to lose heat at a rate of 10W.

    Add a thin layer of insulation.

    The tank is no longer in equilibrium as it is losing heat slower than it comes in.

    The temperature rises until the heat loss reaches 10W, and equilibrium is reestablished at a higher temperature.

    Add more insulation.

    Each time you add more insulation you cause the tank to reach a new a new equilibrium at a higher temperature.

    The 10W heater is the Sun. The insulation is the CO2. The temperature of the water is the temperature of atmosphere, surface and ocean.The heat loss is the Outward Longwave radiation.

  104. Entropic man says:

    Kristian

    “So there you are, Entropic man. Has the total heat loss from the Earth system (surface, TOA or anywhere in between) increased or decreased during the observed warming since the 70s?”

    I don’t need to guess. With a continuing increase in CO2 the system remains out of equilibrium, and the total outgoing radiation reduced relative to solar insolation.

    http://eprints.whiterose.ac.uk/43307/2/JGR_2009JD012105%5B1%5D.pdf

  105. Entropic man says:

    Arfur Bryant

    “How do you get the climate has ‘warmed’ by no more than 0.2C? There is no ‘warmed or cooled’ about it…”

    You seem to have missed my ongoing point about statistical uncertainty, so I’ll go into this in rather more detail, giving accurate figures rather than my colloquial estimate.

    Look at the Hadcrut4 data for 1998 ( the sceptics’ favourite) and 2011.There is a data table at the bottom.

    http://www.metoffice.gov.uk/research/monitoring/climate/surface-temperature

    For 1998 the mean temperature is 0.52,lower and upper 95% confidence limits are 0.44 and 0.61.
    For 2011 the mean is 0.40, the limits are 0.31 and 0.50.

    Remember that our measurements are samples of the temperature. The limits are the boundaries within which the actual mean probably lay.

    If you just take the means, there is a temptation to oversimplify and say that the temperature dropped by 0.12C.(0.52-0.40)

    To take account of the uncertainty, you have to take the limiting possibilities.

    If the actual 1998 temperature was at the upper limit, and the actual 2011 temperature was at the lower limit the change would be 0.61-0.31, a drop of 0.3C.

    If the actual 1998 temperature was at the lower limit, and the actual 2011 temperature was at the upper limit the change would be 0.5-0.44, an increase of of 0.06C.

    Given the statistical uncertainty of this data you can only say with 95% confidence that the actual global average temperature has probably decreased by no more than 0.3C or increased by no more than 0.06C since 1998.

    Any more specific claim, such as “Temperatures have not risen for 15 years” is rhetoric, not justified by the science.

  106. David Appell says:

    Kristian asks, “”Has the total heat loss from the Earth system (surface, TOA or anywhere in between) increased or decreased during the observed warming since the 70s?”

    See, among others:

    “Observed changes in top-of-the-atmosphere radiation and upper-ocean heating consistent within uncertainty,” N.G. Loeb et al, Nature Geoscience (22 Jan 2012)
    http://www.nature.com/ngeo/journal/vaop/ncurrent/full/ngeo1375.html

  107. Kristian says:

    Entropic man says:
    January 6, 2013 at 9:03 AM

    “Your question demonstrates a misunderstanding of the process. The atmosphere does not warm the surface by increasing heat loss. The warming is a secondary effect of the CO2 in the atmosphere DECREASING the rate of heat loss.”

    Entropic man, I can’t even begin to understand from where you got the impression that I believe the atmosphere warms the surface by INcreasing its heat loss. My very point from the start has been that this cannot happen.

    But I thank you for confirming my understanding. You state plainly that “The warming is a secondary effect of the CO2 in the atmosphere DECREASING the rate of heat loss.”

    I of course agree wholeheartedly.

    And then back to my question (but apparently I will have to rephrase it slightly):

    “IF we observe that the (total) heat loss from the surface of the Earth from the 70s until today INcreased rather than DEcreased, where does that leave the claim that an enhanced GHE caused the warming, when the atmosphere can only warm the surface by DEcreasing its heat loss?”

    Care to answer that, Entropic man?

  108. David Appell says:

    Salvatore, CO2 is not near the saturation point of absorbing OLR. Read the sidebar box “Saturation fallacies” in

    Pierrehumbert RT 2011: Infrared radiation and planetary temperature. Physics Today 64, 33-38
    http://geosci.uchicago.edu/~rtp1/papers/PhysTodayRT2011.pdf

  109. Kristian says:

    David Appell says:
    January 6, 2013 at 10:25 AM

    You’re still not answering the question. You’re only avoiding it.

    I’m asking you again, David: “Has the total heat loss from the Earth system (surface, TOA or anywhere in between) INcreased or DEcreased during the observed warming since the 70s?”

    That’s all I’m asking. INcreased or DEcreased heat loss?

  110. Kristian says:

    David Appell and Entropic man,

    Read this:

    http://klimaforskning.com/forum/index.php/topic,1148.msg21543.html#msg21543

    There the foundation for my question is laid out in full.

  111. David Appell says:

    Kristian: Did you even read the abstract of Loeb et al? It says this:

    “We combine satellite data with ocean measurements to depths of 1,800 m, and show that between January 2001 and December 2010, Earth has been steadily accumulating energy at a rate of 0.50 +/- 0.43 W/m2 (uncertainties at the90%confidence level).”

    And this was given earlier:

    “An observationally based energy balance for the Earth since 1950,” D. M. Murphy et al, JOURNAL OF GEOPHYSICAL RESEARCH, VOL. 114, D17107, doi:10.1029/2009JD012105, 2009
    http://eprints.whiterose.ac.uk/43307/2/JGR_2009JD012105%5B1%5D.pdf

  112. Entropic man says:

    Kristian

    During the last 40 years the imbalance between incoming and outgoing radiation has grown slightly, as the outgoing radiation has DECREASED, while the incoming radiation has stayed constant.

    See Figure 4 in Murphy et al, 2009.

    By the logic given in your link, this means that the atmosphere is responsible for the warming, ie the increased insulation effect of CO2.

  113. That article you sent Dave, is the argument those like yourself, that have faith that co2 increases will cause the temperature to rise further present.

    Unfortunately for you and all the global warmers ,it is not correct, and I think the temperature trend of late not going up any further and way below the many global warming model projections, is proving this to be the case.

    Along with no stratopheric cooling, no tropical hot spot , and olr radiation showing very little change since 1979.

    Dave you should read what Doug Cotton has to say. He and his followers are on the other extreme of what you believe, in that they believe in no greenhouse gas effect at all.

    You should read all of the post under the article Dr. Spencer ,just posted about the greenhouse gas effect,just below this one..

    You will see that I think Doug, is wrong and I defend very much a limited greenhouse gas effect. I just don’t by into the degree that you and the article you present, believes in it and it’s evenual effects.

    I think the greenhouse gas effect can only be as effective as the energy it has to work with available in earth’s climatic system, and with the amounts of energy in earth’s climatic system weakening, due to the prolong solar minimum the effectiveness of the greenhouse gases will be on the decline.

    Still Doug’s views are ridiculous ,and there is a greenhouse gas effect.

    You should address what he has to say. He is way way off.

  114. anthony beevor says:

    The sidebar that David Appell refers to concerning
    CO2 contains the following:

    …radiation in the portion of the spectrum affected
    by CO2 escapes to space from the cold, dry upper portions
    of the atmosphere, not from the warm, moist lower
    portions.

    This is only partly correct. The better statement is

    …SOME radiation etc… while MOST escapes (so to say)
    by going back to the ground or sea where it [the energy]
    gets another chance to escape straight to space as
    black-body radiation – of a different wavelength, one
    not intercepted by green-house gases.

    So there are two things going on. Some heat-carrying IR has to “fight its way” through the atmosphere and out, being
    absorbed and re-radiated many times. Some heat-carrying IR “bounces back”, and this heat is largely re-radiated direct from the ground or sea to space. The first process will get “more difficult” with increasing CO2. The second will not get more difficult because it already happens,as intensely as it can, really low in the atmosphere; i.e. the process is saturated.

    Another wrinkle is that the “shoulders” of the absorption
    bands can and do widen. One can argue how much scope there is left for this to happen, but ultimately it, too, must
    enter saturation.

  115. Kristian says:

    Entropic man,

    Figure 4a in Murphy et al. 2009 shows that the net radiation (heat loss through radiation) from the Earth has INCREASED since the 70s, not DECREASED as you claim. To be exact, the persistent upward trend started in 1976 (the year of the Great Pacific Climate Shift), when global temperatures started rising. Because you know of course that heat loss is a NEGATIVE flux for the Earth, don’t you Entropic man?

    The caption underneath also clearly states: “(a) Radiative forcing and the increased net radiation from a warming Earth.”

    So by the logic given in my link, this means that the atmosphere is NOT responsible for the warming.

    My point exactly.

  116. Kristian says:

    David, you say: “Kristian: Did you even read the abstract of Loeb et al?”

    Stop your incessant dodging of uncomfortable questions. I’ll read it when you answer my simple question. OK?

    You’re quite a piece of work, aren’t you?

  117. David Appell says:

    Kristian, that paper answers your question.

    Otherwise, what are you asking?

  118. David Appell says:

    No Salvatore, that article explains the absorption spectrum of CO2 and why, in the atmosphere, it isn’t saturated.

    I’m going to take the understanding of a world-class climataologist over yours, any day.

  119. David Appell says:

    >> Figure 4a in Murphy et al. 2009 shows that the net radiation (heat loss through radiation) from the Earth has INCREASED since the 70s, not DECREASED as you claim. <<

    What are you talking about? The black line is going down….

  120. anthony beevor says:

    Further about the sidebar:

    It is misleading in another way.

    The IR energy that is “trapped” by the CO2 and
    has to fight its way out is in fact, after the
    initial event, emitted and received mainly by water;
    for all “trapped” IR immediately goes towards warming
    the atmosphere.The atmosphere can only radiate in the wavelengths in which it can absorb and those are mainly
    the wavelengths appertaining to the main,green-house
    gas:- water. Now the principal place in which water radiates
    to space is from the top of clouds. So the reference to
    the “dry,upper portions of the atmosphere” is a red herring.

    BOTH main processes of warming are saturated, if
    you do not mind the pun.

  121. Kristian says:

    We’re going in circles here.

    David, I’m not asking the paper to answer my question. You’re employing the classic ‘The answer is in there, now it’s up to you to find it’ tactic.

    I’m asking YOU to answer my question.

    My question is (again): “Has the total heat loss from the Earth system (surface, TOA or anywhere in between) INcreased or DEcreased during the observed warming since the 70s?”

    I’m asking because ‘the enhanced greenhouse effect’ (more GHGs in the atmosphere) says the atmosphere would make the Earth’s surface warmer by restricting its heat loss, NOT (at all) by strengthening it. The ONLY way the (cooler) atmosphere CAN make the (already warmer) surface warmer still is through this mechanism. If the heat loss increases past the original level, the atmospheric mechanism no longer works.

    So, INcreased or DEcreased heat loss? Not in theory. In reality.

  122. anthony beevor says:

    Daniel Reppion

    Not sure if that was a compliment or an insult.
    I have not read much by that historian if that
    is the alias.

  123. David Appell says:

    >> I think the greenhouse gas effect can only be as effective as the energy it has to work with available in earth’s climatic system, and with the amounts of energy in earth’s climatic system weakening, due to the prolong solar minimum the effectiveness of the greenhouse gases will be on the decline. <<

    There energy coming into the system is (1-alpha)*S, and a change dS will cause a change in the equilibrium temperature given by, to first-order, differentiating the Stefan-Boltzmann law:

    dT = (T/4)(dS/S)

    Plug in the numbers and you will find dT < 1 C even for severe climate minimums.

  124. Kristian says:

    David says: “What are you talking about? The black line is going down….”

    Oh My God! Read the whole comment. The black line is going down BECAUSE the heat loss (a NEGATIVE flux) is increasing. The more negative the flux becomes, the greater the heat loss.

    The caption accompanying the figure says: “(a) Radiative forcing and the increased net radiation from a warming Earth.” That ‘INCREASED NET RADIATION FROM A WARMING EARTH’ is the black line, David.

  125. David Appell says:

    Kristian, I simply do not understand why you think your question hasn’t been answered. Murphy’s Figure 4a shows there has been a net increase of heat into the Earth’s system. Harries 2001 shows a loss of outgoing radiation at GHG absorption frequencies.

  126. David Appell says:

    >> The black line is going down BECAUSE the heat loss (a NEGATIVE flux) is increasing. <<

    No. You seem to be making a sign error. There is a net flux of radiation into the system.

    Come on, this is the entire basis of everything: GHGs trap radiation so that less goes out than comes in.

  127. Entropic man says:

    David Appell

    Best ignore Kristian. I learned years ago that it is worthwhile investing time to educate an ignorant man, but a waste of effort debating with a fool.

  128. Arfur Bryant says:

    Entropic man,

    Two points on your statistical uncertainty argument:

    1. You do realise you have just completely demolished your own argument earlier in the thread, don’t you?

    You told Salvatore del Prete (January 3, 2013 at 7:18 PM):
    [“Note that NCDC, GISS and Hadcrut4 agree.
    2010 was the warmest year on record, followed by 2005. 1998 came in third.”]

    Now, according to your uncertainty argument, you must realise that you cannot make that statement as an argument about ‘warming or cooling since 1998’. Therefore, I would have to conclude that, as the HadCRUT3 set is the only dataset supported by satellite datasets (which clearly indicate 1998 as the warmest), you must, by your own argument, concede.

    2. Oh what a difference a day makes!

    January 5, 2013 at 1:32 PM
    Entropic man: [“All you can say with 95% confidence is that since 1998 the climate has warmed or cooled by no more than 0.2C.”]

    January 6, 2013 at 9:54 AM:
    Entropic man: [“Given the statistical uncertainty of this data you can only say with 95% confidence that the actual global average temperature has probably decreased by no more than 0.3C or increased by no more than 0.06C since 1998.”]

    So, you’ve gone from +/- 0.2C to a massive probability weighting favouring a large cooling (0.3C), rather than a small warming (0.06C)! As the probability of the ‘true’ 1998 reading being at the extreme ‘cool’ uncertainty and the ‘true’ 2011 reading being at the extreme ‘warm’ uncertainty, then would you not agree that the probability must be that 2011 was cooler than 1998? If you disagree, see point 1.

    On second thoughts, I could give you a £ for every tenth of a degree (mean) anomaly in 2011, and you could give me a £ for every tenth of a degree (mean) anomaly in 1998, and we’d both be happy, because – as far as you are concerned – science says you’ll be richer! (Yeh, I know I’m being flippant, but I couldn’t resist…) 🙂

    I realise you like to use statistical manipulation (I know you want to call it science, but it’s not, in this case it is equivocation).

    Oh, by the way, nice move quietly substituting HadCRUt4 data instead of the HadCRUt3 that was used in the MO graph…

    Regards,

  129. Arfur Bryant says:

    Entropic man says:
    January 6, 2013 at 2:55 PM

    Entropic,

    That comment is unworthy of you.

  130. For every paper Dave can come up with to support his claims , I can come up with a paper that will counter it.

    Dave, CO2 is very close to saturation for many olr wavelenghts. This is my opinion, and the opinion of many others.

  131. David Appell says:

    What papers show CO2 is very close to saturation, Salvatore?

  132. Kristian says:

    David Appell,

    No, you have not answered my question. Not at all. You have quite consciously, stubbornly and meticulously avoided answering it.

    Also, you seem willfully ignorant of what I’m trying to direct your attention to. Your continuing efforts to sidetrack the issue to avoid giving me a straight answer has led you to this position, where you can now brush me off as just another ‘crank.’

    You so obviously don’t want to answer my question while all the way pretending you could (and have), that I can now actually rest my case.

    Your writhing evasiveness is answer good enough for me.

    So thank you for that, David.

  133. Massimo PORZIO says:

    What looks crazy to me is that many of you are discussing about this or that paper which based their conclusion on a presumed correct measure of the outgoing radiation, when I already posted a link here, where every one can see how satellites spectrometers (and radiometers too) having a restricted field of view are no ways useful for measuring the outgoing LW IR radiation, because they just measure the transmittance of the atmosphere for their field of view angle.

    Note that the link that I already reported here more and more (this one: http://www.atmos-chem-phys.net/6/5025/2006/acp-6-5025-2006.pdf) it’s about a paper written by scientists who were trying to prove that the GHGs work as predicted by the atmospheric transmittance simulators such as Modtran (which it was predictable, if not obvious for the experts in the field); but as an unwanted byproduct they published in Fig.3 (upper plot) that the transmittance at the limb is almost complimentary to the one at nadir (the limb is tangent to the atmosphere, thus being the atmosphere almost spherical that graph is showing an outgoing flux too).
    For this the CO2 absorption pit at about 650cm-1 must be adjusted for the very different transmittance profile at angles different from nadir.

    In fact, the two logical consequence of that graph are:
    i) As the GHGs increases, the pit shown at the nadir became deeper and/or wider (as considered by all the papers you refer too), but the correspondent peak at the tangent of the TOA became proportionally higher and/or wider too.

    ii) there are many other fields of views between the nadir view and the tangent view at the TOA, those views surely have intermediary spectra between the extreme twos; all those field of views along the whole atmospheric view of the satellite must be taken in account for every single outgoing point of measurement at the TOA to really get all the outgoing radiation.

    For the above, until the scientists don’t realize that they have to abandon the three-dimensional Cartesian space of a mere directional flux measurement; and switch to the correct spherical space measurement of the Poynting vector, they can publish papers and papers on this argument, but one day those paper will be trashed as scientific garbage.

  134. Massimo PORZIO says:

    Hoops, the link don’t works because I attached the parenthesis to the and.
    Remove the parenthesis or click here:

    http://www.atmos-chem-phys.net/6/5025/2006/acp-6-5025-2006.pdf

    Sorry

  135. David Appell says:

    Kristian: I do not understand what your question is. Why don’t you state it directly instead of sending me to some poorly written Web site?

  136. David Appell says:

    Massimo: Harries et al 2001 do a correction for the different fields of view of the satellite detectors.

  137. Massimo PORZIO says:

    @David Appell.

    How do they did it ?

    Could you give me the link for that paper?

    Thank you in advance

  138. Kristian says:

    Entropic man,

    Ad hom is the last resort, isn’t it?

    This was my question to you:

    “IF we observe that the (total) heat loss from the surface of the Earth from the 70s until today INcreased rather than DEcreased, where does that leave the claim that an enhanced GHE caused the warming, when the atmosphere can only warm the surface by DEcreasing its heat loss?”

    What is foolish about that question? The closest you came to answering it was:

    “During the last 40 years the imbalance between incoming and outgoing radiation has grown slightly, as the outgoing radiation has DECREASED, while the incoming radiation has stayed constant.”

    Do you even know what we’re talking about here? What the total heat loss from the Earth’s surface comprises? It’s not just about radiation.

    At the TOA it’s about radiation. So your claim is that (total) outgoing longwave radiation at TOA has DECREASED since the late 70s …?

    Your interpretation of Figure 4a from Murphy et al. 2009 is clearly wrong. The caption for that very figure negates your interpretation. Read it again. Net radiation FROM the Earth has INcreased during warming, Entropic man. It’s right there in front of you. Yet you deny it with a straight face.

    One last time: The AGW hypothesis is based on the premise that the heat loss from the Earth’s surface (actually the total heat loss, as per the radiative-convective model) can NOT INcrease during warming in the long-term IF the enhanced GHE is doing the warming.

    My very simple question to you (and David) is and has been all along:

    What if we DO observe in the real world that the total heat loss from the global surface of the Earth (and/or TOA) during the warming has indeed increased and by a fair amount?

    What then?

    Well, I could tell you. Because I realize you will never produce an answer yourself. Now it’s all about ignoring, isn’t it. In other words: close eyes, fingers in ears, LA-LA-LA-LA-LA.

    If we observe increased heat loss from the Earth during long-term warming it means the Sun did the warming, NOT the atmosphere.

    There. Was that so hard?

  139. David Appell says:

    Kristian wrote:
    >> My question is (again): “Has the total heat loss from the Earth system (surface, TOA or anywhere in between) INcreased or DEcreased during the observed warming since the 70s?” <<

    A: There is no heat loss. The Earth is gaining heat, not losing it. There is a net flow of energy in.

    This is why the oceans are warming, the ice is melting, and the seas are rising.

    OK?

  140. David Appell says:

    Kristian wrote:
    >> It’s not just about radiation. <<

    Physically speaking, "heat" really doesn't exist, only energy. It gets transferred in a few different ways, one of them via radiation. In the end, all energy leaves the Earth as radiation, because the Earth is surrounded by a vacuum.

  141. David Appell says:

    Kristan wrote:
    >> What if we DO observe in the real world that the total heat loss from the global surface of the Earth (and/or TOA) during the warming has indeed increased and by a fair amount? <<

    This hasn't been observed. If it did, the Earth would be cooling overall. So what's your point?

  142. Kristian says:

    David Appell, you say: “No. You seem to be making a sign error. There is a net flux of radiation into the system.

    Come on, this is the entire basis of everything: GHGs trap radiation so that less goes out than comes in.”

    I am not making a sign error. Heat loss is a negative flux. If that flux becomes more negative, it means the heat loss is growing. The figure caption says: “(a) Radiative forcing and the increased net radiation from a warming Earth.” What is it about this sentence you don’t understand?

    The radiative heat loss is INCREASING, David. Believe it or not.

    Yes, the entire basis of YOUR HYPOTHESIS is: GHGs trap radiation so that less goes out than comes in.

    That’s THE THEORY, David. Not REALITY. Wake up to the real world.

    If the real world shows increasing heat loss during warming, it renders your hypothesized warming mechanism impotent and insignificant. No matter how beautiful it looks on the blackboard.

  143. Entropic man says:

    Arfur Bryant

    Kristian has asked two qustions. David Appell and I have both answered his questions repeatedly with supporting evidence, yet he continues to claim they go unanswered. What would you have us do?

    Regarding the statistics. In general conversation I think of the tempeature data as typically having 95% confidence limits of +/- 0.1c, hence my 0.2C variation. You missed my general point, so I chose a specific example and worked it through in detail.

    I am concerned at your willingness to make statements which ignore the uncertainties in the data. Such a willingness to reject statistical uncertainties as manipulation or equivocation worries me.

    As for using Hadcrut4 over Hadcrut3, I used it because I presumed that the later product would be more reliable than the earlier one.Both were in the data table in my link. I could have used GISS or NCDC, but they do not give as much detail regarding 95% confidence limits.

    I trust you are not an advocate of cherrypicking whichever data set gives the result which best suits you? Hadcrut3 and Hadcrut4 give results closest to your preferred outcome.They also give the best uncertainty information.
    If I were a cherrypicker I would have used GISS, or the BEST land data.

    The key point is that on the data available, nobody, including thee and me, really knows what’s happening so far in the 21st century.

    My private opinion is that the the apparant flattening of the temperature graph in the noughties is due to continued warming from CO2 being offset by reduced insolation since the abrupt and sustained drop in sunspot numbers in 2003.There’s circumstantial evidence for this, but I cant make a 95% confidence case for it, so I dont push it in public.

  144. David Appell says:

    >> The radiative heat loss is INCREASING, David. Believe it or not. <<

    Kritian: there is a net increase of energy in the Earth's system. More energy is coming in at the TOA than is leaving. This is why everything is warming and melting.

    Talking about decreases in heat loss, or whatever, just gets confusing. Heat is not a physical thing; energy is. And the double negative confuses things even further.

    OK?

  145. Kristian says:

    David Appell, you say: “A: There is no heat loss. The Earth is gaining heat, not losing it. There is a net flow of energy in.

    This is why the oceans are warming, the ice is melting, and the seas are rising.

    OK?”

    Well, at least now we’re getting somewhere.

    You’re talking about the energy balance between the Sun and the Earth.

    I’m talking about (and I thought that was quite clear from the beginning) the balance between the Earth’s surface and the atmosphere on top of it.

    The Sun provides the heat to the system, after all. That’s a given. No argument there. But somehow the Earth has to dispose of the received heat to keep the balance.

    Yes, there is a positive imbalance in the Earth system. More is coming in than going out.

    But in order to find out how this imbalance came to be, through a solar or an atmospheric forcing, one needs to have a look at how the total heat loss from the surface to the atmosphere (or from TOA to space) has evolved during the warming.

    It is not enough to simply say, there is no heat loss, there is heat gain and hence a positive imbalance. That tells us nothing about the cause of the imbalance.

    I hope I’ve made myself more clear now? Go back and read the link you so obviously didn’t read but only dismissed as being ‘some poorly written Web site.’ If you had read it, you would have already known what I’m telling you now.

    Look at the Earth surface-atmosphere system. The global heat flux between these two ‘layers’ always go UP.

    The hypothesis of ‘the enhanced greenhouse effect’ says that the atmosphere will have to make this upward heat flux smaller in order to make the surface warmer. It will have to slow down the cooling rate of the surface.

    THIS is the heat flux I would like you to consider, David. Leave the Sun out of it.

    Has this heat flux (from the surface to the atmosphere, or from TOA to space) INCREASED or DECREASED since the late 70s?

  146. Kristian says:

    Entropic man,

    “Kristian has asked two qustions. David Appell and I have both answered his questions repeatedly with supporting evidence, yet he continues to claim they go unanswered.”

    You haven’t answered either, Entropic man. It doesn’t help you much pretending you have. People reading this thread know you haven’t.

    “What would you have us do?”

    Answer the question(s), perhaps?

  147. David Appell says:

    Kristian, you can’t measure heat, only energy. “Heat” is not a physical thing; it is the change in energy content.

  148. Entropic man says:

    Arfur Bryant

    You might be interested in this.

    http://www.metoffice.gov.uk/news/releases/archive/2012/global-temperatures-2012

    These are the provisional figures for 2012, at the head of the table at the bottom.

    Would a warmist cherrypicker have been able to resist comparing Hadcrut4 for 2000 with 2010? 🙂

  149. Massimo PORZIO says:

    Ok David,
    I find the Harries et al 2001.

    In effect they say that they have measured the “observed difference spectrum for near global are 60°N-60°S”, but it seems they don’t addressed my point at all.
    In fact they used the IMG “Interferometric Monitor for Greenhouse Gases” (see instrument data here: http://suzaku.eorc.jaxa.jp/GLI2/adeos/Project/Img.html )

    and the IRIS “Infrared Interferometric Spectrometer” (see instrument data here:
    http://ntrs.nasa.gov/archive/nasa/casi.ntrs.nasa.gov/19650018039_1965018039.pdf ; Specifications are at page 35 )

    As anybody can read for both the instruments, they apparently don’t have any way to see at angles different from the nadir.

    Form page 35 of the second link above, the field of view for the IRIS is only 8°.
    While for the IMG instrument at this link:
    http://www.webpages.uidaho.edu/~vonw/pubs/WaldenEtAl_2010.pdf

    Page 521 says: “Each detector has its own square field of view of 0.6 degrees. This yields a ground footprint of about 8 km by 8 km.”
    This means that even if the satellite was orbiting at a very low altitude, say 800km the final field of view angle is abot 0.572°

    The problem I refer to is not that addressed by Harries et al. 2001, it’s a complete different issue.

    As far I know, the CERES mounted on AQUA has a swath limb to limb scanner, but it is a radiometer.
    So even if Lindzen and Choi 2011 using its data, found a very reduced CO2 forcing effect (that is an increased outgoing radiation), maybe they was unaware that the increased outgoing radiation measured can’t be simply averaged.
    That because the fields of views surely have very different spectra as function of the inclination angle.
    averaging different spectra without knowing the spectral density at each wavelength leads to an underestimation of the scattered radiation outgoing at angles diverging from the nadir.
    And more, due to the only one directional integration along the swath, which is perpendicular to the orbit path, none is known with sufficient certainty about the non-nadir radiation coming from the angles aligned to the orbit path.
    I hope I explained which is the problem.
    I’m an electronic engineer, not a scientist, but this is the reason when we deal with electromagnetic radiation, we use the spherical universe of the Poynting vectors.

  150. anthony beevor says:

    David Appell

    Now you are just being wild.

    “Heat is energy in the process of transfer between
    a system and its surroundings as a result of temperature
    differences. However, the term is still used also to
    to refer to the energy contained in a sample of matter.”

    Chambers Science and Technology Dictionary , 1991.

    Again:

    “Heat is a quantity which, when added to a body, produces
    changes in the physical condition of the body, accompanied
    in general by a rise of temperature. Heat has been shown to
    be equivalent to energy and may therefore also be defined
    as energy measured in terms of thermal units

    [H] = [M L2 T-2].

    The unit of heat is the heat necessary to raise the
    temperature of unit mass of water. In the metric system
    it is called a calorie; in the English system a British
    Thermal Unit (B.T.U).

    The heat necessary to raise the temperature of a gram of water one degree Centigrade varies slightly with the
    temperature. The calorie, therefore, becomes a definite
    quantity only when the temperatures selected for its
    determination are specified. The interval from 15C to 16C
    is generally chosen.”

    Definitions in Physics, 1913, K.E.Guthe, Professor of Physics, and Dean of the Graduate School, University of Michigan.

  151. Arfur Bryant says:

    This will be my last post fro a day.

    Entropic man says:
    January 6, 2013 at 5:24 PM

    I had already checked those figures, Entropic. I can see that 2012 is likely to be slightly warmer than 2011. The point was that you were prepared to use a different dataset to that which was used in the graph. It was unnecessary. There is no need to make an presumption about the relaibility of one against the other. The graph was based on HadCRUt3, so you should have just used that one.

    Entropic man says:
    January 6, 2013 at 4:43 PM

    That is not an excuse to make an unwarranted attack on Kristian’s intelligence or reasoning. I certainly do not think he is a fool. I don’t think you’re a fool either, for what its worth. What I wouldn’t do is call you such just because you are disagreeing with me.

    As to the rest of your post, I’ll let other decide who is doing the equivocation here. You have not addressed my point that your use of uncertainty effectively negates your earlier comment to Salvatore. You can’t eat your cake and have it Entropic. There’s no point whining about uncertainties now that the data isn’t going along with your dogma. You also haven’t addressed that fact that both the satellite datasets agree with HadCRUT3.

    I am certainly not cherry-picking. You can call foul on uncertainties as much as you like, you won’t change the fact that every single ‘official’ global dataset shows that 2012 is cooler than 1998! Please find the cherry-picking in that. (for info, that is GISS, NCDC, HadCRUt3&4, UAH and RSS. The IPCC used HadCRUt3 for most of its hype. Go figure.

    Finally, you say:
    [“My private opinion is that the the apparant flattening of the temperature graph in the noughties is due to continued warming from CO2 being offset by reduced insolation since the abrupt and sustained drop in sunspot numbers in 2003.”]

    Firstly, that date of 2003 neatly avoids talking about the 0.3C drop between 1998 and 2000.
    Secondly, does that mean that the warming before 2000 was caused by increased sunspots?
    Thirdly, do you have ANY idea how much of the GHE can be attributed to CO2 and the other nGHGs?

    Now THAT would be a question for you and David to answer! Should be fairly easy, seeing as how you are so sure that CO2 and those other nGHGs (total less than 0.04% of the atmosphere) are so powerful…

    Good night.

  152. David Appell says:

    Arfur, heat is not a physical thing. “Heat” is not a thing like water or air. Energy gets transferred between various physical components, that’s all. We call that change in energy “heat,” but it’s an inexact equivalence.

    Heat is a fiction, but a very useful fiction. It’s often used synonymously with energy, but that equivalence leads to problems, as in climate where it misses radiation.

    See also
    http://en.wikipedia.org/wiki/Heat#Usage_of_words

  153. David Appell says:

    Arfur wrote:
    >> do you have ANY idea how much of the GHE can be attributed to CO2 and the other nGHGs? <<

    See here, especially the table at the bottom:

    THE NOAA ANNUAL GREENHOUSE GAS INDEX
    http://www.esrl.noaa.gov/gmd/aggi/

  154. Jake says:

    I find it troublesome to find heat described as “fiction” considering it is included in the First Law.
    In addition, the lack of transfer of heat is central to adiabats, which are in turn central to climate theory.
    As such, I think how D. Appel deals with the term heat needs to be addressed.

  155. Day By Day says:

    anthony beevor, thank you for the explanation–it was very helpful.

  156. Kristian says:

    David Appell says:
    January 6, 2013 at 5:17 PM

    “Kristian, you can’t measure heat, only energy. “Heat” is not a physical thing; it is the change in energy content.”

    OK, since you’re apparently SO much against the concept of ‘heat’ and by extension ‘heat transfer’ and ‘heat loss’, then call it ‘net energy flux’. It’s exactly the same, but hopefully it will float your boat a bit better.

    Has the net energy flux from the Earth’s surface to the atmosphere INcreased or DEcreased during the global warming observed since the mid 70s …?

  157. anthony beevor says:

    You should thank the giant brains of the 19th century
    who sorted it all out, once and for all. They
    guessed – and then proved – that the phenomena
    known as heat were merely the expression of, and the
    results of, kinetic energy of microscopic particles.
    Just jiggling and banging, in fact. You might say
    that this is a disappointingly simple conclusion.

    Of course there are many details, which is why there
    is a book in my library called “A Treatise on Heat in
    Three Volumes” which tends to gather dust.

    The phenomenon known as “radiant heat” involved a bit
    of a mental strech, however. This is the transfer of energy
    by electromagnetic waves through space. Whenever this
    transfer seems to be connected with heat in the jiggly
    sense, and to involve temperature, we agree to write
    about it in the book called “Treatise on Heat in Three
    Volumes”.

  158. anthony beevor says:

    The comment immediately above was in reply to Day by Day.

  159. anthony beevor says:

    For general interest, I might point out that the
    prevailing hypothesis before the 19th Century
    (indeed, “dogma” is not too harsh a word)
    was that “heat” was a sort of fluid matter.
    This view had the authority of Sir Isaac Newton,
    which was unfortunate.

    In 1798, Count Rumford (who was an American,
    despite the title) did his cannon-boring experiments
    which showed that the mechanical equivalent of heat
    was a reality. And in 1799, Sir Humphrey Davey
    was led through various crucial experiments to say
    “heat is motion and the laws of its communication
    [i.e. how it works] are the same as those of the communication of motion.” About the same time Fresnel
    proved that “radiant heat” was propagated by some
    sort of wave – to a chorus of boos.

    Anyway, things sort of moved on from there, although
    it took about sixty years.

  160. anthony beevor says:

    I suppose I should also point out that,
    in a sense, the identification of heat with
    kinetic energy is an analogy. After all,
    it is not likely that the rules for describing
    a thrown or quivering baseball will be exactly
    the same as those for a thrown or quivering
    molecule. But what the heck, they are pretty
    close for a lot of calculations.

  161. Kristian says:

    David Appell says: ““Heat” is not a physical thing; it is the change in energy content.”

    Yes, and by that you will see that a cooler ‘object’ (such as the atmosphere) can never directly raise the energy content of a warmer ‘object’ (such as the Earth’s surface) with which it is in thermal contact.

    The cooler object can only do ONE thing to make the warmer object even warmer (increasing its energy content) and that is reducing the net energy flux going from the warmer to the cooler object – that is, slowing down the cooling rate of the warmer object, or suppressing its ‘heat loss’. (It’s assumed of course in this scenario that the warmer object already receives a steady supply of net energy from an external source (like the Sun)).

    The atmosphere can thus only raise the energy content of the surface INdirectly – not like the Sun does, directly – by reducing the temperature gradient between the two.

    And is this something that’s been observed in the real world? Nope.

    The energy content of the Earth system has been increasing since the 70s, by all means. But it’s the Sun doing the work. Not an enhanced greenhouse effect.

  162. I agree pretty much with this article. Dave you need to study Beer’s Law.

    Cold Facts on Global Warming

    http://www.randombio.com/co2.html

    Cold Facts on Global Warming. W hat is the contribution of anthropogenic carbon dioxide to global warming? This q

  163. Kristian says on January 5, 2013 at 2:40 AM:
    “OH Dahlsveen (am I right in assuming you’re Norwegian?),
    I found that same thought experiment to be peculiar. ———- — . “

    = = = = = = =

    Sorry, but I have been away from this site for a couple of days, but I see you are still here, so yes, your assumption is correct. I was born in Norway, in a town which can be found at around 60 °north.
    That however does not influence my way of looking at the “climate debate” and drawing my own conclusions that there must be some kind of “Global Warming Scam” going around.

    You may also have noted that Entropic man says nothing about my 101 comment. Instead he gets on to the “Missing Ocean heat-content” and gives me a link: http://www.nature.com/ngeo/journal/vaop/ncurrent/full/ngeo1375.html

    where I can read the following:
    “Here we present a revised analysis of net radiation at the top of the atmosphere from satellite data, and we estimate ocean heat content, based on three independent sources. We find that the difference between the heat balance at the top of the atmosphere and upper-ocean heat content change is not statistically significant when accounting for observational uncertainties in ocean measurements3, given transitions in instrumentation and sampling.”

    Guesswork galore once again where the main players are a “revised analysis of net radiation” and “we estimated ocean heat content”

    We can all do that; revise any earlier analysis and then arrive at our own estimates of whether pigs can fly or not.

    By the way as far as I know there are only a few languages, amongst which Norwegian is one, that spell your name the way you do Kristian .- Norwegian yourself perhaps???

    PS. One only need to watch a pig for a short while to whether it can or cannot fly.

  164. David Appell says:

    Salvatore, you said you had “papers” showing that CO2 was close to saturation. All you’ve given is a Web site, which is not close to a peer reviewed publication in a legitimate journal.

    Want to try again?

  165. Correctionn:

    PS. One only need to watch a pig for a short while to see (realize) whether it can or cannot fly.

  166. David Appell says:

    >> The energy content of the Earth system has been increasing since the 70s, by all means. But it’s the Sun doing the work. <<

    It's certainly not a change in solar irradiance — there hasn't been much of any:
    http://lasp.colorado.edu/sorce/tsi_data/TSI_TIM_Reconstruction.txt

    Nor have any other solar mechanisms pan out.

    Meanwhile changes in the brightness temperature at CO2 and CH4 absorption lines has been observed, just what theory predicts. The stratosphere has cooled, just what theory predicts (and what solar mechanisms do not).

    The enhanced greenhouse effect is expected, and observed. The only real question is climate sensitivity, which is still only known to about 50%.

  167. David Appell says:

    >> Has the net energy flux from the Earth’s surface to the atmosphere INcreased or DEcreased during the global warming observed since the mid 70s …? <<

    I still don't know what you're asking, or why. What do you mean by "the surface" — the ground and ocean surface? The air near the ground?

    The air is warmer. The ocean surface is warmer. Because more energy is coming into the TOA than is leaving the TOA.

  168. David Appell says:

    Kristian says:
    >> Yes, and by that you will see that a cooler ‘object’ (such as the atmosphere) can never directly raise the energy content of a warmer ‘object’ (such as the Earth’s surface) with which it is in thermal contact. <<

    This is an often-repeated but elementary error. The 2nd law of thermodynamics only applies to *adiabatic*, isolated systems, which the atmo+surface is certainly not.

  169. Dave, anything that is peer reviewed is garbage, just like your insistence on global man made warming due to an increase in CO2.

    Again you need to study Beer’s law.

    Dave ,you just can’t accept papers or people that don’t agree with your already pretty much proven wrong soon to be obsolete theory.

    As I demenstrated with data in an earlier post the aa geomagnetic index ,and temp. going back to the Maunder ,present a very strong correlation, unlike that of co2 and temp.

    Also the change in temp. since 1850, is among the smallest , going back to almost any previous time in earth’s climatic history.

    Changes both up and down many times greater then the recent .6c rise in temp. ,which by the way ended in 1998.

  170. David Appell says:

    Salvatore, now you’re getting comical. Peer review is the essence of science, a way to set standards. You rely on peer reviewed science ever hour of your day, and you don’t get to reject it just because you don’t like its conclusions.

    It’s just as I suspected — you don’t actually have any papers that show CO2 is near saturation.

  171. David Appell says:

    Salvatore, I am well aware of Beer’s Law, as are climate scientists. It has limitations, which is why climate science uses a much more sophisticated version called the Schwarzschild equation, which reduces to Beer’s Law in a certain limit (if the atmosphere is too cold to radiate significantly in the frequency under consideration, which is not true for CO2; Beer’s Law also neglects scattering), and a much more realistic atmospheric model that in the link you gave.

    I recommend you read section 4.2 of Ray Pierrehumbert’s textbook “Principles of Planetary Climate.” See especially section 4.2.2, “Some special solutions of the two-stream equations.”

  172. Kristian says:

    David Appell says:
    January 7, 2013 at 1:49 PM

    “I still don’t know what you’re asking, or why. What do you mean by “the surface” — the ground and ocean surface? The air near the ground?”

    Now you’re just playing obtuse, David.

    I think you DO know what I’m asking. And I certainly think you know WHY I’m asking what I’m asking. That’s why you absolutely go out of the way not to answer it. Rather you do you utmost to detract from the issue in a continuous string of pretend answers and red herrings, desperately trying to redirect attention toward aspects of the AGW hypothesis that don’t really concern my question to you at all – the issue at hand, an extremely important and basic premise of the whole notion of ‘the enhanced GHE’.

    Look at this diagram:

    http://earthobservatory.nasa.gov/Features/EnergyBalance/images/surface_energy_balance.jpg

    Borrowed from here:

    http://earthobservatory.nasa.gov/Features/EnergyBalance/page5.php

    And accompanied by the following simple explanation: “For the energy budget at Earth’s surface to balance, processes on the ground must get rid of the 48 percent of incoming solar energy that the ocean and land surfaces absorb. Energy leaves the surface through three processes: evaporation, convection, and emission of thermal infrared energy.”

    The 48% arrow coming in is the averaged out ‘net energy (heat) gain’ of the Earth’s surface, David, amounting to ~163-165 W/m^2.

    The 25%, 5% and 17% arrows combined is the averaged out ‘net energy (heat) loss’ of the Earth’s surface. In order for the surface not to warm or cool, the incoming net energy flux (the ‘heat gain’ arrow from the Sun) and the outflowing (composite) net energy flux (latent+sensible+IR – the ‘heat loss’ arrows UP from the global surface) must balance – they must equal each other.

    None of the three processes ridding the surface of absorbed energy from the Sun can add to the incoming net energy flux (the 48% arrow). Why? Because they are all going in the opposite direction.

    What they CAN do is affect the energy content of the surface (or subsurface). How? By slowing down the rate at which the absorbed energy from the Sun escapes the surface. If the incoming flux remains constant, then this will lead to a net accumulation of energy at and/or below the surface creating a positive imbalance – more energy is entering the surface than leaving per unit of time.

    THIS is the atmospheric surface warming mechanism. The ONLY one available. It does NOT warm the surface DIRECTLY, because it does not provide it with extra net energy (‘heat’), like the Sun would do.

    No ‘net energy flux’ is INCREASED when the atmosphere does the warming.

    The atmosphere instead warms the surface INDIRECTLY, by DECREASING a ‘net energy flux’ – the outflowing one (latent+sensible+IR).

    It REDUCES and then limits the ‘heat loss’ of the Earth’s surface. That’s how it can produce warming. There simply is no other way.

    Do you agree with all this, David? Or is it still completely foreign …?

  173. Mack says:

    @ David Appell,
    I don’t like being labelled a crank David.
    You contend that a trace gas wafts around in the air above the ocean-waves and by means of ‘backradiation”(a term not found in any physics books) warms the water beneath more than it would be otherwise by the sun. Considering this I start feeling the scientists hypothesising such things are not the full quid.
    Other scientists (eg Willis Eschenbach over at WUWT) will stand in front of you and with a bland face say that the atmosphere is stopping the oceans from becoming one FROZEN ball.! I don’t know about you David, but little alarm-bells go ringing off in my head saying this scientist is not thinking straight. This could be psuedoscience.
    So be careful David, when pointing your finger in our direction calling us cranks, 3 fingers are pointing back at you.

  174. David Appell says:

    Kristian, I haven’t understood what you’re asking, so don’t tell me I have.

    You are missing a crucial term your figure doesn’t show: radiation from the atmosphere. The atmosphere radiates in all directions, some of it downward. In fact, the surface receives more energy radiated from the atmosphere than it does from the Sun.

    See Figure 1 in the Trenberth et al BAMS 2009:
    http://www.cgd.ucar.edu/cas/Trenberth/trenberth.papers/TFK_bams09.pdf

    That amount of radiation is increasing as the greenhouse gases accumulate.

  175. David Appell says:

    Mack: “Backradiation” is just radiation from the atmosphere. The atmosphere is a gas at a certain temperature; it radiates energy, some of it downward.

    See Figure 1 in the Trenberth et al BAMS 2009:
    http://www.cgd.ucar.edu/cas/Trenberth/trenberth.papers/TFK_bams09.pdf

    (Actually the atmosphere is a continuum of gas layers, but it’s the same basic idea.)

    As Willis Eschenbach says, the radiation from greenhouse gases keeps the Earth’s surface warmer (about 33 C) than it would be without them.

  176. Dave, unless you write a paper that supports the scam of global man made warming, the paper will not get reviewed.

    They only will review papers that meet the criteria of the hoax, you and others keep trying to put upon the public.

    This is why Dr. Spencer, has a hard time in getting many of his papers out for review and he believes in the greenhouse effect to some extent, as I do.

    Even so the establishement wants no part of these kind of papers, because they are a threat to the scam that they and you keep trying to promote.

    The party ends this decade, Dave. Your done.

  177. David Appell says:

    Baloney, Salvatore. Editors are anxious to publish good papers no matter what they say — I’ve asked some of them this question directly. (One of them told me he would *love* to publish a paper that disproved AGW, if such a paper truly existed.) All kinds of papers come out questioning various aspects of the science. But, just as there are no papers disproving the fundamentals of quantum mechanics or the tobacco-cancer link or the mechanism of DNA, and any number of other results, there are none disproving the basics of climate science because that science has been established and proven, and science has moved on to the next level of questions.

    Claiming it’s a conspiracy is simply desperation, the last ploy you have left.

  178. Dave points of view are worthless ,just as Doug Cotton’s points of view from the exact opposite extreme of what Dave keeps trying to come across with are.

    They are both extreme, and most points of view which are extreme are very often found to be wrong.

    I am positive both of these individulas essentially don’t know what they are talking about, even though they both have opposite extreme views on this matter of the GHG effect, or lack of an effect.

    I feel much more comfortable being in middle ground, which will probably turn out to be the proper stance to take in all of this.
    I expect the extreme views of the GHG effects on THE climate wilL come to end end within a few years, as every single aspect of what thse clowns have been forecasting continues not to materlialize.

    Everything is happening opposite of what they said in the past, and this trend will continue going forward.

    They said stratosphere will cool, stratosphere has not cooled.

    They said a tropical hot spot would form due to positive feedbacks between co2 and water vapor.No tropical hot spot to be found.

    They said the atmospheric circulation would be more zonal, it is more meridional.

    I AM GOING TO SEND IF I CAN THE GREENHOUSE SCORE CARD WHICH SHOWS THERE FOOLISH PREDICTIONS AND HOW WRONG ALL OF THEM ARE.

  179. Historical Perspective

    •Theories

    •Politics

    •Greenhouse Scorecard

  180. It won’t come out but it can be found on the icecap.com web-site.

  181. David Appell says:

    Check the numbers again, Salvatore: UAH has the global lower stratosphere cooling at a rate of -0.37 C/decade over the lifetime of their record, with the last 10 years -0.10 C cooler than the previous 10 years.

  182. Dave the process is reversing ,and since 1996 it has been essentially unchanged.

    I have papers that support this , but then again they run counter to AGW theory, and don’t count. Right?

  183. David Appell says:

    Again, what papers?

    Since Jan 1996 the change in UAH global LS is -0.06 C, with a 2-sigma uncertainty of 0.04 C.

    2

  184. Mack says:

    David Appell,
    I’m not going to bother to get into an arguement with you at this point at Dr Spencers place, but after you have finished here on this thread, I would advise you to go read what I’ve said about Trenberth, frozen oceans,etc to Willis Eschenbach in his posting at WUWT ..The Forcing Conundrum Dec 12th. Reading all my comments might lead you on an adventure.
    ( Salvatore, you might also do this)

  185. Dr No says:

    Salvatore, 3 simple questions for you:

    How certain are you that the alarmists are wrong and the denialists are right? (e.g. 80%, 90% ..?)

    What do you estimate is the level of certainty that the alarmists attach to their predictions of global warming?
    (e.g. 80%, 90% ..?)

    What is the certainty that global average temperatures will reach a new record within the next 3 years?
    (e.g. if the climate is cooling – then it must be close to zero%?)

    p.s. we are experiencing record breaking heat waves here in Australia.

  186. Mack says:

    David Appell…Yes, here..
    http://wattsupwiththat.com/2012/12/12/the-forcing-conundrum/#comments
    You’re going to have to wade through the lot of the comments to get mine…Don’t overlook this link I’ve given in one of my comments here..
    http://jennifermarohasy.com/author/nasif-s-nahle/
    Happy reading David. (You too Salvatore)

  187. David Appell says:

    Mack, I’m not impressed. For example, this is just wrong:
    http://wattsupwiththat.com/2012/12/12/the-forcing-conundrum/#comment-1174326

    because it ignores the Earth’s albedo.

    Your other comments are also not very impressive, as Willis pointed out. I’m sticking with “crank.”

  188. David Appell says:

    Also, Mack, Willis is right about the solar intensity — its total incidence varies little with the seasons. You can see daily satellite measurements here:
    http://lasp.colorado.edu/sorce/tsi_data/daily/sorce_tsi_L3_c24h_latest.txt

    The Sun is so far away that light rays arriving at Earth are parallel, to a very good approximation, and so the Earth’s area intercepts the same amount regardless of its orbital position. And that’s what the data shows.

  189. Mack says:

    “And that’s what the data shows”
    I dunno David, When I look at the data and run the scroll bar up and down it shows a sort of flickering. Something like the variation of a flickering sun. I’m just a layman David, what would I know.

  190. David Appell says:

    >> When I look at the data and run the scroll bar up and down it shows a sort of flickering. <<

    How about some actual science? "A lot of flickering" isn't science, it's an eyeball observation that proves nothing. Download the data and calculate if there is a seasonal signal.

  191. David Appell says:

    I happened to have the daily TSI data (Mar 2003-Dec 2012) in a spreadsheet, and the monthly averages already calculated, so it was easy to take the average of each month for the 12 different months of the year.

    They varied little: between 1361.02 W/m2 (July) to 1361.15 W/m2 (December).

    OK?

  192. Mack says:

    David Appell says
    “How about some actual science?”
    You want science Dave ? I’ve already given it to you. Heaps of it. All you have to do is read it. In fact by the time you’ve finished reading Nasif Nahle you will have had science up to your back-teeth. So call it a day with me here David because I slso feel Dr Spencer is a little uncomfortable with my presence on his blog because I’m of the Doug Cotton ilk. Good-night.

  193. anthony beevor says:

    David Appell says:

    “The 2nd law of thermodynamics only applies to *adiabatic*,
    isolated systems…”

    *adiabatic* means “without loss or gain of heat” (Definition
    from any dictionary or textbook). It is completely untrue
    to say that the 2nd law only applies to such situations.
    Scratch the restrictive word *adiabatic*, therefore, and
    try:

    “The 2nd law of thermodynamics only applies to isolated
    systems…”

    The UNIVERSE is such an isolated system and therefore the
    law applies universally, in the common formulation:

    The total entropy of the universe never decreases.
    It either stays constant (reversible processes) or
    increases (irreversible processes).

    I am now going to continue, using the words of Giancoli
    of MIT in his extremely well-known text, “Physics.”

    “Since all real processes are irreversible, we can equally
    well state the second law as:

    The total entropy of any system plus that of its
    environment increases as a result of any natural
    process.”

    That is ANY system and ANY natural process. So far as
    we know, the 2nd law has NO restrictions or exceptions.
    It “applies” everywhere at all times.

    I think that Kristian is relying on the Clausius statement
    of the 2nd law (I write, “think” bacause I did not actually
    read most of what he wrote) and I am using Giancoli’s words
    again:

    “Heat will not flow spontaneously from a cold object
    to a hot object.”

    and its consequence that

    “No device is possible whose SOLE [my emphasis] effect is
    to transfer heat from one system at one temperature into
    a second system at a higher temperature.”

    Such a transfer is possible of course (heat pumps) but
    it involves work.

  194. anthony beevor says:

    Any way, this is all an argument about what SHOULD happen. Let’s look again at the graph which Dr Spencer provides to see what IS happening. Not a lot, I suggest. I have seen
    more action in an hibernating tortoise – and he turned out
    to be dead.

  195. David Appell says:

    Mack, you haven’t presented any science, and you’ve made assertions (here and at WUWT) that are easily checked and clearly wrong.

    But more importantly, several generations of scientists — tens of thousands of them, professionals, smart, hard-working, skeptical — aren’t wrong about something so basic. This is what amazes me about the greenhouse cranks, that you think you have discovered something that all these people somehow missed. It doesn’t fly.

  196. MikeB says:

    Dave Appel,

    You have some surprising figures for Total Solar Irradiance. You should be aware that the so-called Solar Constant is not actually constant. It varies throughout the year due to the elliptical orbit of the Earth around the Sun.. The Earth is closest to the Sun in January and to quote from Wikipedia,
    “The actual direct solar irradiance at the top of the atmosphere fluctuates by about 6.9% during a year (from 1.412 kW/m² in early January to 1.321 kW/m² in early July)”.
    So there is something wrong with your data and spreadsheet. I can see what you have done wrong – can you? Hint – you have used data corrected to 1AU, the correct data is in Column 10.

    Having said that, good luck in your attempts to educate the assorted pseudo-scientific cranks who display their ignorance here. I think that your efforts are futile because I suspect that they don’t want to understand and they are probably incapable of understanding anyway.

  197. DAVID ARCHIBALD SOLAR CYCLE 24 SOLAR CYCLE 25

    David Archibald: The potential impact of volcanic overprinting of the Eddy Minimum

    Tuesday, January 8th 2013, 3:23 AM EST

    Co2sceptic (Site Admin)

    There were five named solar minima in the last millennium – the Oort, Wolf, Spörer, Maunder and Dalton minima. At least the last four were all associated with cold climates. The astrophysics community has elected to name the current period of low solar activity the Eddy Minimum. John A. Eddy was an American astronomer who compiled data demonstrating the periods of low solar activity prior to the Dalton Minimum. The Eddy Minimum will include at least Solar Cycles 24 and 25, and could continue until late in the 21st Century.

    Benjamin Franklin was the first to suggest that volcanic eruptions might affect climate, in a 1784 communication to the Literary and Philosophical Association of Manchester:

    “During several of the summer months of 1783, when the effect of the sun’s rays to heat the earth in these northern regions should have been greatest, there existed a constant fog over all of Europe, and a great part of North America. This fog was of a permanent nature; it was dry, and the rays of the sun seemed to have little effect toward dissipating it, as they easily do to a moist fog, arising from water. They were indeed rendered so faint in passing through it, that when collected in the focus of a burning glass, they would scarce kindle brown paper. Of course, their summer effect in heating the earth was exceedingly diminished.
    Source Link: wattsupwiththat.com

    THIS ARTICLE CONTINUES

  198. David Archibald ,for those who don’t know about him is one of the leading astrophysicist in the world. His qualificatins and predictions make Dave and company look like amatures, which they are.
    This guy is one of the scientist that know where it is at, in regards to earth’s climatic system. I am in total agreement with his points of view on the climate going forward , and what will be happening, and why it will be happening..

  199. [PDF]
    Recent Stratospheric Temperature Observed from Satellite …

    88.167.97.19/…/Recent_Stratospheric_Temperature_Observed_from…

    File Format: PDF/Adobe Acrobat
    by Q Liu – 2009 – Cited by 6 – Related articles
    MSU and SSU measurements and provide evidence for a stratospheric temperature warming since 1996. Section 2 of this paper described

  200. One of many papers , DAVE WILL NOT BELIEVE, that show a warming of the stratopshere in recent years.

  201. Dr. No , David Archibald, the famous solar scientist I just mentioned in an earlier post today,is also from Australia.

    YOU SHOULD GOOGLE HIM AND READ ABOUT WHAT HE HAS TO SAY, AS FAR AS THE CLIMATE GOES. I ECHO HIS SEDIMENTS.

    The article I posted came from this web-site in regards to David Archibald.

    climaterealist.com

  202. anthony beevor says:

    Salvatore says:

    “I echo his sediments.”

    I know this is a typo for “I echo his sentiments,”
    but the original has a lovely savour to it.

  203. David Appell says:

    Salvatore, if you’re going to quote something, please be kind enough to post the link.

    PS: Blog posts aren’t science.

  204. David Appell says:

    MikeB: You are right; I am wrong. The solar irradiance number given by LASP is for one astronautical unit, per the notes atop the data page for column 5:

    http://lasp.colorado.edu/sorce/tsi_data/daily/sorce_tsi_L3_c24h_latest.txt

    Apologies, Mack.

    In his textbook, Pierrehumbert shows that the annual average solar irradiance varies as the square of a planet’s eccentricity, so that “the annual mean insolation varies little from what it would be for a circular orbit with radius equal to the semimajor axis.” For the Earth (e=0.017) the increase is about 0.02%, or 0.274 W/m2.

  205. Arfur Bryant says:

    David Appell says:
    January 6, 2013 at 7:22 PM

    David,

    I have been away from this thread for a day due to a problem at work, so I apologise for the delay in response.

    Your link to the NOAA Annual Greenhouse Gas Index does not in any way answer the question I posed:

    [“Do you have ANY idea how much of the GHE can be attributed to CO2 and the other nGHGs?”]

    It is a completely obtuse evasion of the question. I didn’t as how much of the radiative forcing from nGHGs is attributed to the five main nGHGs! I will try to rephrase the question:

    How much of the GHE (shall we say it is 33 deg C?) is attributed to CO2 and the other nGHGs? If you disagree with 33C, choose your own figure and explain.

  206. David Appell says:

    “Noncondensing greenhouse gases, which account for 25% of the total terrestrial greenhouse effect, thus serve to provide the stable temperature structure that sustains the current levels of atmospheric water vapor and clouds via feedback processes that account for the remaining 75% of the greenhouse effect. Without the radiative forcing supplied by CO2 and the other noncondensing greenhouse gases, the terrestrial greenhouse would collapse, plunging the global climate into an icebound Earth state.”
    — Lacis, A.A, G.A. Schmidt, D. Rind, and R.A. Ruedy, 2010: Atmospheric CO2: Principal control knob governing Earth’s temperature. Science, 330, 356-359.
    http://pubs.giss.nasa.gov/docs/2010/2010_Lacis_etal.pdf

  207. Dr. NO, The answer to your first question is 100%.

    Dr. NO, The answer to your second question is 100%.

    Dr. NO, Thwe answer to your third question is 0%.

    It is a very strong stance I admit, but why bother spending time on something if you don’t have a firm belief in what you think is going to happen, will infact happen.

    I say past history supports much of what I say.

    If you go back in past history and correlate temperature change to prolong solar minimum periods ,you will find everytime without exception the temperatures go down sooner or later after a prolong solar minimum period gets going,and the temperatures ,conversely go up when the sun is in a prolong active period.

    Lag times have to be appreciated, and one of the factors that delays a temp. drop at the start of a prolong solar minimum is ocean heat content, which builds during prolong active solar periods, as was the case from 1850- Oct.2005, at which time ,this most recent solar minimum started.

    Also I think certain minimum values in just how quiet the sun has to be and the correspondly geomagectic activity on earth has to be acheived, following several years of sub-solar activity in general.

    With that in mind once this maximum of sunspot cycle 24 passes on by, which should be no later then 2014, we will at that be going on 9 years of sub- solar activity, and as solar cycle 24 declines the values needed should be reached. They are solar flux readings of 72 or less, month after month, ap geomagnectic index readings of sub 5 month after month, and a solar wind speed of 350 km/sec. or less month after month.

    These values having been reached only one time since the Dalton Solar Minimum ended in 1820 ,after following a period of time of at least 2 sub- solar years and that was in years 2008-2010 ,for many of those months.

    The reason why the temperatures did not respond was because the total amount of sub-solar years proceeding this quiet period was only 2 or 3 years, not long enough. Rmember ocean heat content builds during prolong solar active periods and that is what we had more or less from at least 1850-2005.
    Right now solar maximum 24 is in progress which is very weak for a maximum, but still it is a maximum ,but once this passes by , I think the prolong solar minimum will start to exert itself on the climate.

  208. David Appell says:

    Arthur, you’re simply wrong about the 2nd law — it applies only to adiabatic systems. (Isolated systems, if you want to call them that.)

    The passage you quoted says “any system plus that of its
    environment….”

    The key word is ENVIRONMENT. For the Earth, its environment includes the Sun, not the Earth by itself and certainly not the just the atmosphere+surface. The atmo+surface isn’t “isolated.”

    Pierrehumbert wrote in his 2011 Physics Today article:
    “The planetary warming resulting from the greenhouse effect is consistent with the second law of thermodynamics because a planet is not a closed system.”
    – Pierrehumbert RT 2011: Infrared radiation and planetary temperature. Physics Today 64, 33-38
    http://geosci.uchicago.edu/~rtp1/papers/PhysTodayRT2011.pdf

  209. Dr No says:

    Salvatore, you are the first denialist I know who has been brave enough to give a figure. But, to claim 100% certainty about the future is very brave. Not even the daily weather forecasters have that much confidence. Nor stock brokers, nor economists, nor doctors, etc.. In fact, I cannot think of an example where an expert claims 100% certainty in their forecast (except for forecasting that the sun will rise tomorrow).

    Alarmists generally attribute 90% to 99% (BUT NOT 100%) to their certainty.

    Finally, by rights, you can give me odds of (at least) one million to 1 that there will be no new global record set in the next 3 years. Please accept my one dollar bet

  210. Daniel Reppion says:

    Yes, it’s rather warm down here right now. It’s a pity that the discover website doesn’t seem to have updated temperature data over the last few days.

    A similar problem developed last September, that platform seems rather problematic.

  211. MikeB says on January 8, 2013 at 8:04 AM:

    “Dave Appel,

    You have some — —- —-.

    Having said that, good luck in your attempts to educate the assorted pseudo-scientific cranks who display their ignorance here. I think that your efforts are futile because I suspect that they don’t want to understand and they are probably incapable of understanding anyway.”

    = = = = = = =

    Oh good, (pardon me for breaking in on your comment to Dave Appell) but when I see a posting by someone who obviously knows all there is to know about the “global warming by CO2 theory” I get a bit exited as I feel sure that I shall –at long last, have a chance to hear a believable answer to some of my basic questions.

    I have many questions but in order not to make this post too long I shall only ask one for now, and here it is:

    1) Why do Climate Scientists say that energy coming in to the “Earth System?” (ES) must equal energy leaving. – Or in other words: short wave (solar) radiation IN must = long wave (IR) radiation OUT?

    You see I know of no other system that does this as all other systems use the energy they receive to do work – and as far as I can understand no system works harder than The ES.
    I have got many more questions and reasons for as to why I cannot understand the Theory everybody else seem to believe in.

    I do thank you on beforehand for an informative answer.

    Regards OHD

  212. Kristian says:

    David Appell says:
    January 7, 2013 at 5:14 PM

    “You are missing a crucial term your figure doesn’t show: radiation from the atmosphere.”

    Yawn.

    ‘(IR) radiation from the atmosphere’ is included in the chart’s ‘NET thermal (IR) radiation’ (17%) arrow going UP from the surface, David. Because that arrow represents a NET (UP minus DOWN) ENERGY FLUX (‘heat’). And you know it.

    If the thermal radiation DOWN from the atmosphere increases (like with the hypothesized ‘enhanced GHE’), that simply means the NET thermal radiation flux (‘the radiative heat transfer’) from the surface to the atmosphere is getting smaller, i.e. the ‘heat loss’ by thermal radiation from the surface of the Earth to the atmosphere is reduced.

    It’s exactly the same concept, only you want to the different component fluxes of the NET IR energy flux to be shown (like Kiehl & Trenberth), so that it gives the impression that the radiation from the atmosphere somehow is a heat source all of its own for the surface.

    Well, it isn’t. It’s simply part of the net IR energy flux, that ALWAYS globally goes UP from the ground – hence it can never add to the solar heating directly; only indirectly by reducing radiative ‘heat loss’.

    Why is this so difficult to comprehend?

  213. Kristian says:

    OH Dahlsveen,

    Sorry, didn’t see your reply until now. Well, your name gave you away. And I guess mine did too. Yes, I’m from Norway, currently living in a town close to 70N with the coastline just north from here abutting the Barents Sea. Sun still below the horizon for another couple of weeks.

    Sounds cold and dreary, but isn’t really.

  214. tonyM says:

    Dr No,

    In any science there is never a guarantee that today’s findings and thoughts are right ad infinitum. Probabilities are always conditional so the questions as posed have little merit.

    Leaving that aside, my certainty that the alarmist climate warming hypothesis is wrong is 100% and echo Salvatore’s views. I am talking about the Hansen type forcings and feedbacks not some wild ill defined non falsifiable hypothesis or some wide range that T can increase from 0 to 8 deg latitude that even a schoolboy can make and be right.

    The empirical evidence shows clearly that the alarmist hypothesis is falsified. Take it from 1850’s and it is falsified. Over 85% of the increase in CO2 since the little ice age has happened post war. The alarmist warming ala Hansen et al is falsified since the mid 1940’s. In both cases the warming is about half that which should occur using Hansen’s approach.

    These are long enough periods to capture the bulk of forcings, feedbacks and give time to stabilise and bypass quasi temporary “phenomena” like large volcanic eruptions and abnormal el nino/nina

    Arfur Bryant and I talked about this earlier.
    January 4, 2013 at 2:37 PM
    January 4, 2013 at 7:46 PM
    January 5, 2013 at 4:03 AM

    Testing the hypothesis and its predictions avoids all the other obfuscation that takes place. I might add that there has never been a CAGW hypothesis which makes claims about some time series. So arguments along a statistical route are generally just obfuscation and excuses for what is supposedly a physics relationship. So too are arguments about this or that event ad nauseum.

    Ultimately it is not for a skeptic to provide the empirical evidence to disprove a hypothesis. The onus is always on the proponent to provide the evidence which shows the hypothesis and it’s predictions are in line with all the evidence – not just some cherry picked fragments. It helps in science to actually have a falsifiable hypothesis – anything else just doesn’t belong in science.

    Localised events like Australia or USA at specific times is rather meaningless when we speak of an event horizon of at least 50 years globally. Even that seems short when talking about a structural change. So why do you even ask about 3 years in climate change?

    In any case the current Aus highs is a result of low moisture in central Australia with little cloud and am angry sun up above – hardly the result of any CO2 effects. If anything, CO2 is supposed to increase moisture in the air. So where is it? (tongue in cheek)

  215. Arfur Bryant says:

    David Appell says:
    January 8, 2013 at 1:25 PM

    David, you are confused. I have not discussed adiabatic processes with you. I suspect you mean anthony beevor!

    David Appell says:
    January 8, 2013 at 1:13 PM

    Ok, so you agree that your original paper-link was irrelevant. Now you have at least given an answer based on the Lacis paper. I am amazed that you consider Lacis’ assessment to be even remotely likely.

    Are you serious? Do you actually think about this subject or do you just regurgitate dogma because it supports your belief?

    CO2 and the other nGHGs contribute 25% to the GHE? This is an answer so preposterous I am staggered you would consider it. This is the problems when pro-cAGW commenters just accept model outputs and conclusions from assumptions without even bothering to use rational thought.

    So Lacis (and you, obviously), says that of the current 33 deg C GHE, the nGHGs contribute 25%. OK, 25% of 33C is 8.25C.

    Back in 1850, the GHE was 32.2C (33C less the enhanced 0.8C over the past 162 years.

    25% of 32.2C is 8.05C.

    So you are saying that 280ppm of CO2 (and tiny amounts of the other NGHGs) can contribute significantly to the GHE in 1850 but 395ppm CO2 (and similar or greater increases in the other nGHGs) can only increase the GHE by an unknown (and possibly negligible) portion of 0.8C? And/or only increase its own contribution by .15C.

    Seriously? You and Lacis are deluding yourselves. His paper is predicated upon an assumption that Arrhenius was correct and he uses models, based on assumptive parameters, to produce an answer that defies logic, reason and observation.

    Sorry David, you’re going to have to be just a tad more sensible. It doesn’t matter how much you believe in the CO2=cAGW theory, it doesn’t matter how beautiful you think the theory is, it doesn’t matter how much you want the nasty observed data to go away, and it doesn’t matter how many ‘climate scientists’ produce papers which have absolutely no relevance in the real world. The figure of 25% is nonsense.

    Think about it. Please.

  216. Dr No says:

    Thanks tonyM.
    The problem with being 100% certain is that you need to explain why all the climate models from around the world yield a strong effect of enhanced co2. Even though they differ in the details, they all yield a significant response.

    Please dont tell me that they are all have the same error since there are up to 30 independent models that have been developed.

    Please dont tell me they omit correct physics unless you can identify the actual equations or physical constants that are wrong.

    Please dont tell me they are all part of the conspiracy.
    (How in hell could we convince the Chinese to take part?).

    Please dont tell me that they do not capture the effect of solar variations since this has been studied for decades and the numbers dont add up.

    Please dont tell me there has not been any significant global warming. Why else are the glaciers everywhere are retreating?

    I know that single events do not prove anything, but you cannot look at recent record heat waves in Russia, the USA and Australia and maintain 100% certainty!

  217. David Appell says:

    >> 1) Why do Climate Scientists say that energy coming in to the “Earth System?” (ES) must equal energy leaving. – Or in other words: short wave (solar) radiation IN must = long wave (IR) radiation OUT? <<

    They don't say it has to be equal. They say that an imbalance leads to a change of temperature until the balance is restored.

  218. David Appell says:

    Kristian: I don’t understand what your point is — that energy has to balance? That if the atmosphere radiates more the surface will also radiate more? What??

  219. David Appell says:

    Arfur: I don’t believe for a microsecond that you have an argument against Lacis et al. All you’re saying is ‘it can’t possibly be true!’

    That’s not an argument, it’s a wish. And wishes aren’t science.

  220. Entropic man says:

    Salvatore and Tony achieve 100% certainty in the rightness of their position for one reason only.

    They BELIEVE and are therefore unconstrained by the rules of evidence.

  221. tonyM says:

    Entropic Man
    http://www.drroyspencer.com/2013/01/uah-v5-5-global-temperature-update-for-december-2012-0-20-deg-c/#comment-68367
    You say:
    They BELIEVE and are therefore unconstrained by the rules of evidence.

    My reply:
    It takes a special kind of myopia to put the interpretation that you have when I am being guided purely by the empirical evidence which falsifies the hypothesis of catastrophic AGW. I have stated the parameters clearly; even with your myopia you surely could not miss it.

    Science is the unique area of study which is based on empirical evidence as being paramount. You would have us discard that which is true and substitute it with your own thought bubbles. You would have us change that empirical data to fit in with your thoughts and models.

    In short you would have us behave no differently to religious bigots.

    I can’t speak for the future as if enough people make enough predictions then one or more may turn out to be right even if for the wrong reasons.

    I opened with the comment that today’s thoughts may not hold tomorrow – in the light of any new evidence or advances. Alarmist warming does not wish to incorporate much new evidence it seems to me. Neither do you. Then, follow your religion in peace!

    Dr No:
    I don’t feel you take Entropic Man’s approach so read some of my comments to him with a lighter tone – but they do address some of your comments.

    Models of their own are quite meaningless unless they have been validated against observation. Sure models may be good in certain selective areas and may improve. But a model is surely quite useless if its predictions are out or if it can’t, without contortion, model the past.

    I do not expect models to predict the economic activity (which is what CO2 will have responded to mainly). But I do expect their relationships to map the actual variables and subsequent results. If they don’t then what real purpose do those models serve?

    Sure in science we have at times had very limited models in evolving. But at all times we seemed to strive to ensure those models did conform to the empirical evidence. When they did not we were concious of that and used them where they were appropriate. We didn’t try to pretend otherwise – at least most of the time.

    I give you a personal example. In studying the structure of diamond I suggested to the professor that it could not hold at the surface. His answer was quite simple: “we don’t know the answer there!” Nor was there some convoluted nonsense to justify the basic model. I wasn’t beaten into submission for being a “denier;” we were positively encouraged to question.

    The great Einstein had no compunction in accepting where some of his ideas were wrong (well – mostly).

    Sure the ether theory kept going for a while despite the Michelson and Morley experiments but ultimately a new era of physics just left it in its wake.

    Specific events you point to have little to do with the CAGW hypothesis. All these types things have happened in history. Look at the Sahara migration to Egypt hypothesis in the last 10,000 years. There are many other localised changes to which one can refer.

    This is the reason why I chose longer time-frames and focus on the key measure of CAGW.. Admittedly even that is questionable measure: what exactly is the meaning of average T globally in a non equilibrium syatem?

    One thing that should not be assumed, although much vaunted by alarmists, is the conspiracy concept supposedly held by skeptics. People including scientists migrate to a particular view or field without there being any conspiracy. That does not mean that confirmation bias is absent as is seen often in the medical field.

    The only people that I will say have deliberately distorted the the science in the political field are Hansen and the late Schneider by their own admissions. Mann – I leave for you to interpret when one of his own team wanted to puke at his implied suggestion to being the gatekeeper in science.

  222. Kristian says:

    David Appell says:
    January 8, 2013 at 6:57 PM

    “Kristian: I don’t understand what your point is — that energy has to balance? That if the atmosphere radiates more the surface will also radiate more? What??”

    Yes, I realize you’re playing the ‘dumb’ card. And have for a while. And you feel you’re coming close now to my simply giving you and the whole issue up. So that you can just shake it all off and move on to your next soapbox from where you can once again proclaim to the ignorant fools out there (of which I am apparently one, at least according to Entropic man) your certain knowledge that AGW has already been proven and that you know for a fact (because there are tons of preconcluded (but peer-reviewed, so there) papers and model studies and important people out there saying so) that our emissions of CO2 raise the global temperature of our planet’s surface to dangerous levels …

    Any normal, self-thinking, grown-up, scientifically curious human being would have understood long ago the concept I’ve been trying to communicate to you, David. There is nothing difficult or complex or novel about it in any way.

    Even Roy running this site has explained this very concept several times, for instance here:

    http://www.drroyspencer.com/2012/02/more-musings-from-the-greenhouse/

    “The temperature of something (the Earth’s surface, an atmospheric layer, the human body, a pot of water on the stove) is related to rates of energy gain and energy loss. Thus, generally speaking, you can increase temperature in one of two ways: (1) increase the rate of energy gain, or (2) decrease the rate of energy loss.”

    “It does not matter whether we are talking about radiative heat transfer, or conduction, temperature is a matter of energy gain versus energy loss.

    The Greenhouse Effect Decreases the Rate of Energy Loss by the Earth’s Surface”

    Those are Dr. Roy Spencer’s words. Not mine.

    Do you agree with this concept, David Appell?

  223. Christopher Game says:

    Perhaps it might be clearer if Dr Spencer’s words here had been ‘The Greenhouse Effect Decreases the Rate of Energy Loss by Earth’s Surface, other factors being held equal’?

  224. anthony beevor says:

    David Appell says:

    “…the 2nd law – it only applies to adiabatic systems
    (isolated systems…)

    On page 868 of “Chemistry”,2nd edition,by “Moore,
    Stanitski,Jurs” you will see a worked example in
    which the second law is applied to a system which
    is neither adiabatic nor isolated.

    Incidentally, all three authors are Professors of
    Chemistry, with Doctorates. However, since they
    disagree with you they must be cranks.

  225. nigel ray says:

    Yes, it is true that in Chemistry we use the
    second law A LOT. That is because we need to
    know what reactions are possible and whether
    Nature has given us any room to improve them.

    We have to make assumptions sometimes – such
    as that a transfer of energy occurs in reversible
    steps when it can’t really.

    Somebody in this thread said something about the
    essence of science being agreement through peer approval.
    Fiddlesticks! The essence is understanding something
    so well that you can rely on it for practical
    purposes. That is one big step on from “Everybody
    agrees, then?”

  226. anthony beevor says:

    I wish there WERE situations in which the second
    law of thermodynamics did not apply. Then I could
    finish my perpetual motion machine.

  227. Kristian says:

    Christopher Game says:
    January 9, 2013 at 2:06 AM

    “Perhaps it might be clearer if Dr Spencer’s words here had been ‘The Greenhouse Effect Decreases the Rate of Energy Loss by Earth’s Surface, other factors being held equal’?”

    Yes, but let’s not confuse the matter with immaterial caveats. The basic concept remains: With a constant solar input, the atmosphere cannot allow the TOTAL heat/net energy loss from the surface to increase past its original level if warming is to occur.

    That is, if the combined strength of the three processes available for ridding the Earth’s surface of absorbed net energy from the Sun (again, assumed constant) increases, then the surface will not warm. It will cool.

    In other words, the simple reality: If we observe increased total heat loss (latent heat transfer (evaporation) + sensible heat transfer (conduction/convection) + net thermal radiation (IR)) from the global ground/sea during a long-term warming period, then the mechanism causing that warming simply cannot have been atmospheric. It has got to have been solar.

  228. Tim Wells says:

    The British met office have just lowered their expectations for global warming, basically they are saying that from 1998 for another 20 years, there will be no further global warming. 1998 was the hottest year at 0.4 c and they are saying that up to 2017 the average will remain at 0.43. I suspect they will be lowering their figures in a few years, as climate variability kicks in and the world cools down.

  229. MikeB says:

    O.H. Dahlsveen asks “Why do Climate Scientists say that energy coming in to the “Earth System?” (ES) must equal energy leaving”.

    This is an application of the 1st Law of Thermodynamics – Energy cannot be created or destroyed.

    The Earth receives energy from the Sun. As a consequence it warms. All warm bodies emit their own radiation, according to their own temperature (Stefan’s Law). So the Earth emits radiation of its own. This happens to be in the infrared region, because this accords with the Earth’s temperature, typically 300K ( Planck’s Law). At the top of our atmosphere (TOA) there is a ‘radiation balance’. That is the Earth emits as much radiation to space at it receives from the Sun. This has to be so! If it wasn’t so, then the Earth would receive more energy than it emits and as a consequence it would heat up. As it heats up it would radiate more until, at a higher temperature, a new balance would be achieved. Remember, energy cannot be created or destroyed. Any body at a steady temperature ( and the Earth’s mean temperature is more or less steady year on year) must be in equilibrium. It must be emitting as much energy as it is receiving. Again, if this was not so then its temperature would rise or fall until such a state was attained.
    Note that the radiation balance applies only at TOA. It does not apply at the surface because there other forms of heat transfer are possible, e.g conduction, convection, evaporation etc. However, across the boundary between the vacuum of space and the Earth system only radiative transfer is possible and there ‘Energy In’ must equal ‘Energy Out’

  230. anthony beevor says:

    There is not much new under the sun.

    In the middle 1950’s I was receiving
    a geography lesson in a London school,
    during a nasty winter cold-snap. I
    had chapped lips and chillblains.

    The teacher said:

    “Industrial Man is putting many substances
    into the atmosphere. This may even affect
    the weather. Calculations show…

    [pause for effect]

    that in five thousand years…

    [even longer pause – milking it – he was a ham]

    we may be able to take our coats off!”

    Two minutes of schoolboys’laughter (we were hams too).

  231. Entropic man says:

    Tim Wells

    1998 was the hottest year at 0.4 c and they are saying that up to 2017 the average will remain at 0.43.

    That’s an odd way of saying that there will be no more global warming. They are saying that the hottest year on record for Hadcrut3 up to 2013 will soon become a below average year by 21st century standards.

  232. warming: 2012 was warm continental U.S-wise, but not globally — admits the New York Times

    NYT: “Even so, the last year’s record for the U.S. is not expected to translate into a global temperature record when figures are released in the coming weeks’

    (The continental U.S. is only 1.6% of Earth’s surface — Meanwhile, Alaska is cooling!)

    AP warmist reporter Seth Borenstein cranks the hype meter to 12: In describing an average temperature of 55.32 degrees F, uses words like ‘superhot’ and ‘roasts’

    UK Daily Mail: ‘GLOBAL warming is NOT as bad as feared’: Met Office under fire as it claims Earth’s temperature is rising more slowly than first thought (and could even have stalled)

    ‘Global warming is not causing temperatures to rise as quickly as previously feared, the Met Office has claimed. Today the weather agency released its revised forecast which was quickly seized upon by climate change skeptics who used the data to claim global warming has stopped’

    Meteorologist Joe Bastardi: ‘Since we are going to tout US warmth ( 2% of globe) lets look at that global temp trend shall we?’

    NOAA: 2012 was warmest year ever for US, second most ‘extreme’

    Reality Check: Meteorologist Joe Bastardi: ‘If you used the stations used in 1930s — in other words –measured temps today with what we used in 1930s, it is not warmest yr on record’ —

    ‘We have many more stations and so many many more records that can be broken over shorter time spans. US is only 2% of the globe thats only .04 above’

    UWash Dean Howard Frumkin: Climate change causes depression: ‘Climate change hurts real people, right now — respiratory diseases, injuries, depression, displacement, upended lives’

    [email protected]

    Flashback 2010: Fmr. Senior CDC official Frumkin Demoted: ‘Endured scathing criticism from Congress & media for ATSDR’s poor handling of public health problems created by formaldehyde-contaminated trailers that govt provided to Katrina victims’

    NASA’s James Hansen fundraises to keep Haitians in the dark

    ‘Instead of advocating/fundraising for the electrification and development of Haiti, Jim Hansen sees poverty- and earthquake-stricken Haiti as a way to advance his twisted global warming agenda’

    ‘At midnight w/NO tornado deaths it’ll tie RECORD 197-day stretch of #tornado-death-free days set in ’86-’87per (data to 1950)’

    More UN IPCC AR5 Leaks: ‘The IPCC hasn’t learned a thing from the Himalayan glacier scandal’

    ‘Under the guise of ‘scientific expert review,’ it recently permitted aggressive, behind-the-scenes lobbying of its authors by WWF employees and other activists. The draft version of the Working Group 2 report currently lists publications produced by the WWF and Greenpeace among its end-of-chapter references’

    Breaking News: Meteorologist discovers U.S. government announcing records before all data analyzed; ‘warmest ever’ July not true

    Meteorologist Anthony Watts announced on Sunday that he has discovered serious inconsistencies in the temperature data released to the public by the National Climatic Data Center (NCDC) of NOAA. This finding is important since it reveals that the widely-reported assertion that July 2012 was the hottest month in the instrumental record for the contiguous U.S. is wrong’

    Analysis: Greenland Snow Cover Has Expanded By 1000 Manhattans Since 1974…Clear Rising Trend!

    Many agree that the CO2 man made global warming theroy is rubbish. It is just shut off by the mainstream as far as making the news, and in the case of peer reviews of papers that say otherwise.

    Key Climate Reports
    U.S. Senate Report: 700 Plus Scientists Dissent Over Man-Made Warming Claims
    UN IPCC
    Mann’s Hockey Stick
    Global Temp Trends
    Global Temp Trends 2
    Rising CO2
    Spotless Sun
    Clouds
    Antarctica
    Arctic
    Greenland’s ice
    Mount Kilimanjaro
    Global sea ice
    Causes of Hurricanes
    Extreme Storms
    Extinctions
    Floods
    Droughts
    Ocean Acidification
    Coral Reefs
    Polar Bears
    Extreme weather deaths
    Frogs
    Global Cooling Predictions
    Lack of atmospheric dust
    Malaria
    Failure of oceans to warm
    Sea Level

    Global warming at a standstill, new Met Office figures show — ‘Downgraded its forecast for global warming to suggest that by 2017 temps will have remained about same for 2 decades’

  233. Entropic man says:

    Looking for more information on recent climate behaviiour I found this.

    http://www.atmos-chem-phys.net/11/13421/2011/acp-11-13421-2011.pdf

    It’s a bit of a mouthful and discusses a lot of different mechanisms, but I also found a partial summary here, which relates to my passing discussion about sunspots and recent damping of warming with Arfur.

    http://www.huffingtonpost.com/bill-chameides/has-the-earths-missing-he_b_1268673.html

  234. MikeB says on January 9, 2013 at 7:00 AM:

    “O.H. Dahlsveen asks “Why do Climate Scientists say that energy coming in to the “Earth System?” (ES) must equal energy leaving”.”

    = = = = = = =

    Thank you MikeB for that. The explanation that followed was very good, concise and more or less exactly as I understand it. – Namely that when it comes to radiation exchanges between the earth and ‘outer space’ it is what happens at the top of the atmosphere that matters. The earth’s surface, IMHO, sends out but a fraction of the (IR) radiation that eventually leaves for space.

    You do – as far as I can see – correctly state: “It does not apply at the surface because there other forms of heat transfer are possible, i.e. conduction, convection, evaporation etc.”

    I also happen to believe that if it was not for the fact that, in most areas of our planet, water vapor is clinging to the surface in quite a high percentage and that the increased surface vibrations that begins to happen at day break, or sunrise, (and the accompanying rising surface temp.) all are transferred to the air by conduction only, The IR radiation that should have happened, cannot, according to Fourier 1824 – and all sorts of other observations, penetrate H2O. Thereafter convection takes over.

    IMHO, people put by far too much weight on IR radiation from the surface. In the end it becomes hard to separate out exactly what they mean

  235. Arfur Bryant says:

    David Appell says:
    January 8, 2013 at 7:00 PM

    David,

    That’s the trouble. You keep arguing from what you ‘believe’ rather than what the real evidence is. You have no way of countering the logic of my argument with Lacis et al so you just dismiss it with some vague notion of scientific authority. Logic is the truth behind any science. Basing your argument on the output of models, the input to which is partly limited to the whim of the programmer and his assumptions is doomed to failure. You really need to try to be a little more objective.

    Your lack of ability to counter the logic demonstrates the level of your indoctrination into the pseudo-scientifc world of ‘climate science’.

    Don’t worry though, you’re not alone. Lacis also ran away when I presented him the anomaly behind his paper!

    Until you and the other pro-cAGW commenters learn to be objective about ‘real’ data and actually think about the subject, you’ll never get past the ‘I believe’ stage.

    All the best to you.

  236. David Appell says on January 8, 2013 at 6:55 PM:

    “They don’t say it has to be equal. They say that an imbalance leads to a change of temperature until the balance is restored.”

    = = = = = = = = =

    Nitpicking is a wonderful pursuit. It makes one feel good and righteous.

  237. David Appell says:

    Kristian: I *still* don’t know what your point is — you spend more words disparaging me than making your point. I can’t fish your point of out them.

    The statement on temperature change and energy gain and energy loss is fine. So what is your point?

  238. David Appell says:

    Arfur Bryant says:
    >> Basing your argument on the output of models, the input to which is partly limited to the whim of the programmer and his assumptions is doomed to failure. <<

    *All* science is based on models. All of it.

    Like all other science, a climate model like used by Lacis et al tries to describe the situation in equations that capture the physics, and then solve them.

    The equations are too complex to solve by hand, so computers are used to approximate the solutions. That's all a climate model is: a numerical solution to the equations that describe the physics.

    You got a better way to do it?

  239. David Appell says:

    Salvatore: you cut-and-paste from Climate Depot very well. Just what Morano was hoping….

  240. anthony beevor says:

    MikeB gave a gentle hint to David Appell about Appell’s
    assertion that the solar incidence on the earth did
    not vary with the season; an assertion which Appell based
    on a data table from a satellite.

    Appell acknowledged a mistake in a rather cryptic way.

    For anyone who did not know what it was about…

    Appell was looking at the WRONG column.

    Appell was working with Column 5 which gives the irradiance
    at 1 AU from the sun and is as constant as the sun.
    The actual irradiance, day by day as the earth moves, at the Top of the Atmosphere is in Column 10, and varies
    by 6 or 7% through the year.

    Well, anyone can make a mistake. I found myself
    staring in the fridge today, puzzled why the pie I
    had put in the microwave was not there. What I find
    more interesting is that Appell made up a theoretical
    REASON for its not changing, so we cranks and morons would
    go “Ahh! Just so!!” – a reason which was glibly unsound.
    After Appell acknowledged a mistake he came up with yet
    another theoretical calculation, which is up in this
    thread, in which he implies his error was only 0.02% or
    0.272 Watts/sq M.

    His real – unacknowledged – error was nearer 7% or
    90 Watts/sq M. If you do not believe me just follow the
    imbed in Appell’s Post of Jan 7 at 9:16 p.m. and
    read Column 10. Here,for example, are two entries:

    2003 06 10 1,319.6464 Watts/sq M.
    2004 01 01 1,408.0438 ” “.

    MikeB saw how Appell was not being exactly forthcoming,
    and he wrote admiringly

    “David, you have some —–”

    but he did not let the rest of us in on the joke – because the real joke is supposed to be on us.

  241. Nigel Ray says:

    Anthony Beevor,

    Yes, I have looked and I see exactly what you mean.

    I thought there was something peculiar, but I did not
    notice the byplay between Appell and MikeB.

    I will call you “Perry Mason” from now on.

  242. Entropic man says:

    salvatore del prete

    That style of debate is known as the Giss Gallop, an attempt to swamp one’s opponent with a large number of vague arguments that sound plausible, until examined in detail.
    It doesnt help your case. On the contrary, it suggests you have run out of sensible points to make. Please stay on topic.

  243. Entropic man says:

    O H Dahlsveen

    David Appell says on January 8, 2013 at 6:55 PM:

    “They don’t say it has to be equal. They say that an imbalance leads to a change of temperature until the balance is restored.”

    = = = = = = = = =

    “Nitpicking is a wonderful pursuit. It makes one feel good and righteous.”

    ==========================================================

    You may not have noticed, but David Appell’s statement is at the core of this discussion. It is what the convinced on this thread have been saying is the underlying mechanism of global warming due to CO2, and what the sceptics are denying!

  244. Dr No wrote on January 8, 2013 at 6:37 PM

    “The problem with being 100% certain is that you need to explain why all the climate models from around the world yield a strong effect of enhanced co2. Even though they differ in the details, they all yield a significant response.”

    And he continued: “Please don’t tell me that they all have the same error since there are up to 30 independent models that have been developed.”

    = = = = = =

    Well, it should be very obvious to any primary school kid that all the models must have been told that CO2 is a GHG – i.e. – strong – very strong, and, or – all empowering. How else would the computer know that it is not Oxygen that is the heat controller?

    Let’s postulate that Oxygen (‘O’) cools the atmosphere in “normal times” but that nowadays ‘O’ atoms are increasingly being chemically bound to Carbon (‘C’) atoms and therefore the ‘atmospheric CO2 increase’ exactly matches the loss of atmospheric Oxygen (‘O’) which used to cool the atmosphere.

    Hence the trace gas CO2 is “masked” by a more abundant gas; Oxygen.

    You just wait until the IPCC have got time to pick the bones out of these “research results” from “Professor OHD”

    – well, all our research show that as CO2 increases, so ‘O’ and ‘O2’ decreases

  245. David Appell says:

    Anthony, I clearly acknowledged my error.

    Then I showed that the annual average depends only very slightly on eccentricity — that is, that it is justifiable to take the annual average at the semimajor axis distance.

    This is what’s relevant to the underlying question: is the intrinsic intensity of the Sun varying?

    The answer is no.

  246. Entropic man says on January 9, 2013 at 6:16 PM

    “You may not have noticed, but David Appell’s statement is at the core of this discussion. It is what the convinced on this thread have been saying is the underlying mechanism of global warming due to CO2, and what the sceptics are denying!”

    = = = = = =

    “The skeptics”, my friend are the people, sometimes they include prominent scientists, who are skeptical as to whether or not an increased atmospheric CO2 concentration can ever be dense enough to cause “catastrophic global warming” (CAGW) –

    To my intense dislike – they are denying nothing. –

    I however am a denier, not of the “smokescreen” they call “The Holocaust” but of the infantile claim that you make which is that CO2 concentration can cook the Earth. – Or even warm it a bit more than the Sun can.

    – The Atmosphere as a whole cools the Earth by convecting the heat away to it’s upper regions.

    Why do you think a 100 watt light bulb is larger (in physical seize) than a 45 watt one? – please do not expect an answer from me before you can show you have thought about it.

    But do study the electrical light bulb (the incandescent one that is.) – and if you are a bit clever you will get to understand how the beginning of the “Blackbody theory” came about. You will also, eventually, understand why energy that accompanies “red, or visible light, does not accompany IR radiation. i.e. IR radiation is a bit like “reflected radiation”,

    – only

  247. I have frolicked with Bacchus and am now ready for a long sleep, –

    in my own bed – all alone and relaxed.

  248. Doug Cotton says:

    Climate predictions

    Below is a prediction which I archived on a special page on my website the year before last. So far so good: Roy’s figures are:

    2010 0.394
    2011 0.130
    2012 0.161

    From 2003 the effect of El Niño had passed and a slightly declining trend has been observed. This is the net effect of the 60-year cycle starting to decline whilst the 934 year cycle is still rising. By 2014 the decline should be steeper and continue until at least 2027. (This statement was archived 22 August 2011 here)

  249. Kristian says:

    David Appell says:
    January 9, 2013 at 4:39 PM

    “The statement on temperature change and energy gain and energy loss is fine. So what is your point?”

    My point is, if you think this statement (from Roy) is fine:

    “The temperature of something (the Earth’s surface, an atmospheric layer, the human body, a pot of water on the stove) is related to rates of energy gain and energy loss. Thus, generally speaking, you can increase temperature in one of two ways: (1) increase the rate of energy gain, or (2) decrease the rate of energy loss. (…)

    It does not matter whether we are talking about radiative heat transfer, or conduction, temperature is a matter of energy gain versus energy loss.

    The Greenhouse Effect Decreases the Rate of Energy Loss by the Earth’s Surface”

    Then this statement (from me) should also look fine to you:

    “If we observe INcreased total net energy loss (latent heat transfer (evaporation) + sensible heat transfer (conduction/convection) + net thermal radiation (IR)) from the global ground/sea during a long-term warming period, then the mechanism causing that warming simply cannot have been atmospheric. It has got to have been solar.”

    Why?

    Because, “With a constant solar input [ENERGY GAIN to the surface], the atmosphere cannot allow the TOTAL heat/net energy loss [ENERGY LOSS from the surface] to increase past its original level if warming is to occur.

    That is, if the combined strength of the three processes available for ridding the Earth’s surface of absorbed net energy from the Sun (again, assumed constant) INCREASES, then the surface will not warm. It will cool.”

    In other words: In the atmospheric warming scenario, the ‘energy gain’ for the Earth’s surface remains the same. The ‘energy loss’ is reduced. This reduced energy loss is THE atmospheric mechanism that would force the temperature of the surface to rise.

    But WHAT IF we observe in the real world that the (total net) ‘energy loss’ from the surface in the long-term is NOT reduced but has rather INCREASED and the surface temperature has risen all the same?

    This is basically the same question I asked you about 574 comments ago (for the first time out of … many). We’ve come full circle.

    This time I’ll answer it for you. In case you once again feel the need not to ‘understand the question’ or ‘see my point’ to avoid having to answer it.

    >>>IF we observe in the real world that the (total net) ‘energy loss’ from the surface in the long-term is NOT reduced but has rather INCREASED and the surface temperature has risen all the same, then it simply means the atmosphere (‘the enhanced GHE’) DID NOT DO THE WARMING. It couldn’t have. It means the Sun did.<<<

    So the AGW test is: Has the total net energy loss from the Earth's surface DEcreased or INcreased during the observed global warming since the latter part of the 70s?

    The fundamentals behind this test once again properly outlined here:

    http://klimaforskning.com/forum/index.php/topic,1148.msg21543.html#msg21543

  250. anthony beevor says:

    David Appell says:

    “Anthony, I clearly acknowledged my error.”

    I will leave other people to make up their minds
    about that. You merely said “Apologies,Mack” not
    “Apologies, everyone – I may have misled you.”

    Just to be clear – and using your words, under –
    you did not say “average” on Jan 7, because the
    matter in question was seasonal variation. After all,
    it would be ABSURD to suggest for a second that the
    sun’s output depended on the Earth’s orbit; and
    you are not ABSURD, are you?

    You said:

    “…the solar intensity – its total incidence
    varies little with seasons…”

    and according to you that is BECAUSE

    “…the Earth’s area intercepts the same amount
    regardless of its orbital position…”

    To my mind, the real shocker is that you could make
    up and believe the second of these misstatements.

    I think you are in the proverbial hole. I suggest
    you stop digging.

  251. torontoann says:

    So the main driver can increase 7% in six months?

    From the perspective of a control engineer, that
    is NOT something I would be happy to “average”.

  252. Nigel Ray says:

    torontoann

    “From the perspective of a control engineer” …

    what would you do with the sort of chart that Dr Spencer
    is giving us?

    Genuinely curious about this.

  253. torontoann says:

    Well, if it were a factory you would stick it on
    an obscure wall and call it “The Control Chart.”
    You would draw horizontal lines at the previous high
    and low (+0.6 and -0.6) and call those the Warning
    Lines. You would ask the most junior clerk to keep
    plotting it, and to tell you when it strayed for three
    consecutive months beyond either of those lines.
    Then you would turn your attention to other business.

    If the clerk does tell you, sometime, that either of
    the lines has been crossed in a definite manner,
    you will say to yourself “Well, I have been warned;
    some control action may be required.” What that control
    action may be, I can not tell you. If it is on the
    upside, perhaps ask the developing world, very nicely,
    to go back to feudalism. If it is on the downside, buy
    oil futures.

  254. anthony beevor says:

    torontoann says

    “Then you would turn your attention to other business.”

    Superb idea.

    Same time next year, then, for another look at this chart?

  255. Nigel Ray says:

    If the Oceans haven’t boiled away.

  256. Entropic man says:

    Kristian

    “In the atmospheric warming scenario, the ‘energy gain’ for the Earth’s surface remains the same. The ‘energy loss’ is reduced. This reduced energy loss is THE atmospheric mechanism that would force the temperature of the surface to rise.”

    This is what is happening. David Appell and I gave you evidence days ago!

  257. Nigel Ray says:

    O H Dahlsveen says:

    “I have frolicked with Bacchus…”

    I have stolen away from the crowd in the groves,
    where the nude Statues stand, and the leaves point
    and shiver at ivycrowned Bacchus.

    The author of this is unexpected for most people.

  258. Entropic man says:

    Kristian

    This is probably the best recent review of energy flows and forcing.

    http://www.atmos-chem-phys.net/11/13421/2011/acp-11-13421-2011.pdf

    Look particularly at Figure 18. Tthe top right hand graph shows how energy flow imbalance has increased since 1970, with the net inflow increasing, even though solar insolation (the bottom row of graphs) has hardly changed.

    If the net inflow has increased, while the solar irradiation has remained constant, the only possibility is that outflow has decreased.

    By your own argument, this must be due to an atmospheric effect, rather than a solar effect.

  259. David Appell says:

    Anthony: I wrote “I am wrong.”

    If that’s not good enough for you, then nothing is.

  260. David Appell says:

    Kristian: Has anyone ever told you you are a terrible writer?

    Then let me be the first — you do not have much talent in getting your point across. Long quotes and capital letters don’t help. Nor do double and triple negatives.

    In any case, you are wrong: the question isn’t about total net energy loss from the Earth’s surface. As far as I know that has never been measured, nor can I imagine how it could.

    The point is simply this: more energy now streams into the Earth than goes out. Hence, its temperature is rising. Greenhouse gases absorb infrared radiation, and re-emit it. Some of that goes downward. That increases the temperature of the lower atmosphere.

    All of the things in the last paragraph have been predicted, and have been observed.

  261. anthony beevor says:

    David Appell

    When you wrote “MikeB You are right, I am wrong”, that
    seemed to be part of a private conversation. Since you
    now say that was meant as a general acknowledgement of
    a mistake, then that is, indeed, good enough for me.

  262. Kristian says:

    Entropic man says:
    January 10, 2013 at 10:50 AM

    “This is what is happening. David Appell and I gave you evidence days ago!”

    Haha! What evidence? You mean that graph with the negative (‘energy LOSS’) flux growing stronger (i.e. MORE negative) with rising temperatures (proving MY point) that you so triumphantly declared as evidence of the exact opposite? You guys are just too funny!

    Almost as good as your newfound ‘proof’ – Hansen’s (pure) MODEL conclusions of how the world in his mind ‘should’ operate and evolve.

    What you present there, Entropic man, does not connect with observational data from the real world.

    Look at these two graphs:

    http://i1172.photobucket.com/albums/r565/Keyell/Varmetapsmekanismenegl.jpg Global

    http://i1172.photobucket.com/albums/r565/Keyell/VarmetapsmekanismenetropSt.jpg Tropics

    These are results from the ERA Interim data assimilation project showing the absolute change (in W/m^2) 1979-2012 in Earth’s three net UPWARD global (and tropical) surface energy fluxes (that is, representing the evolution in net energy (heat) LOSS of the surface of the Earth). Green is sensible heat transfer (conduction/convection), red is net thermal radiation (IR) and blue is latent heat transfer (evaporation). Watch how the change in the latter flux completely overwhelms the other two.

    Latent heat transfer (and deep convection) is what matters at the Earth’s surface and in the troposphere. That and the Sun of course. The other mechanisms are just ‘there’.

  263. Kristian says:

    These results are confirmed by global specific humidity and total OLR at TOA measurements. They have both INCREASED significantly since the late 70s and 80s. During (and along WITH) the global warming.

    http://www.metoffice.gov.uk/hadobs/hadcruh/CRUBLENDNEWjul08_ts_q_global7303.png

    http://i1172.photobucket.com/albums/r565/Keyell/BAMS-glvanndamptotalatmsyle.jpg

    http://i1172.photobucket.com/albums/r565/Keyell/BAMS-glluftfuktighet.jpg

    http://tamino.files.wordpress.com/2010/08/humid1.jpg

  264. Kristian says:

    http://i1172.photobucket.com/albums/r565/Keyell/OLRvedTOA.png

    INCREASING total net energy loss for the Earth system during the modern long-term global warming. Easily points to the Sun as the driver and initial cause of the energy imbalance, the heat loss mechanisms working towards CLOSING the gap rather than widening it. Hence, it can’t be the atmosphere.

    Read more about ERA Interim here:

    http://klimaforskning.com/forum/index.php/topic,1148.msg21546.html#msg21546

  265. Arfur Bryant says:

    David Appell says:
    January 9, 2013 at 4:43 PM

    [“That’s all a climate model is: a numerical solution to the equations that describe the physics.

    You got a better way to do it?”]

    Yes. Obey the scientific method. Look at the observed data, realise that your pet theory is total nonsense, and change it.

    I know it is a cliche, but climate models are merely a perfect example of GIGO. That’s why the don’t work.

    Stop trying to dance around an answer, David. Your bluster doesn’t impress me and I doubt it impresses anyone else either.

    Address my argument showing the massive logical anomaly demonstrated by your (and Lacis’) assertion that CO2 and other nGHGs contribute 25% to the Greenhouse Effect. That’s 8.2 degrees C out of 33 degrees C. What was it back in 1850?

    Go on. Have a go at being scientifically objective.

  266. Kristian says:

    David Appell says:
    January 10, 2013 at 3:01 PM

    “Kristian: Has anyone ever told you you are a terrible writer?”

    I see my attempts at spoonfeeding you the message has gone awry. Go figure. You display a total lack of basic understanding about the processes governing our Earth’s climate, David. And of will to learn. Completely blinkered.

    So don’t blame me for your being a terrible reader.

    I’m done here now.

  267. Doug Cotton says:

    In regard to Salvatore’s cogitations that “Doug is wrong” I refer readers to this comment as well as this one below it.

  268. Doug Cotton says:

    If those links don’t work, the comments are on that thread dated January 10 at 2:03PM and 4:54pm

  269. Entropic man says:

    Kristian

    Could you clarify your first link. The graph looks as though cut and pasted by an amateur.

    What is the label for the Y axis? It has become obscured.

    Is the X axis labelled in 20th century years?

    What do the abbreviations FD, ERBS, AIRS and CERS stand for?

    What is the provenance for this graph?

    How does it demonstrate your point?

  270. David Appell says:

    Kristian: Make your point, simply.

    Can you do that?

    It occurred to me that there is an approximate measure of surface energy flux: ocean heating.

    It is significant, in the direction of warming:
    http://www.nodc.noaa.gov/OC5/3M_HEAT_CONTENT/

  271. David Appell says:

    And so, Arfur: you admit then that the intrinsic brightness of the sun has not changed recently?

    And that therefore the Earth is not warming from a brighter sun?

  272. David Appell says:

    Arfur wrote:
    >> but climate models are merely a perfect example of GIGO. That’s why the don’t work. <<

    They do work, fairly well:

    IPCC AR4 WG1 Ch8 – Chapter 8: Climate Models and their Evaluation
    http://www.ipcc.ch/publications_and_data/ar4/wg1/en/ch8.html

    Again: do you have a better way to calculate future climate, than numerically solving the equations that try to describe the physics?

  273. David Appell says:

    Kristian says:
    >> INCREASING total net energy loss for the Earth system during the modern long-term global warming. Easily points to the Sun as the driver and initial cause of the energy imbalance, <<

    Then why is the stratosphere cooling?

  274. David Appell says:

    Kristian says:
    >> INCREASING total net energy loss for the Earth system during the modern long-term global warming. Easily points to the Sun as the driver and initial cause of the energy imbalance <<

    Then why do satellite measurements show no change in the intrinsic brightness of the sun?

    http://lasp.colorado.edu/sorce/tsi_data/TSI_TIM_Reconstruction.txt

  275. David Appell says:

    Kristian says:
    http://i1172.photobucket.com/albums/r565/Keyell/OLRvedTOA.png

    Have you ever heard of sourcing your information?

    Or is it permitted to just throw up any old chart and expected it to be believed?

    Not to mention, this chart isn’t even readable.

  276. Doug Cotton says:

    David said assertively that the stratosphere is cooling.

    Well, here is what has happened at 60,000ft (21Km) these last four years. Which altitude and period did you cherry pick David?

  277. Doug Cotton says:

     
    The NASA data is readily available for various altitudes since 2002. In that time, according to Roy’s data, 2008 was the coolest year and 2010 was the hottest.

    Click here to see the temperatures at 60,000 ft and 80,000 ft for those two years.

    You would have to agree that the stratosphere showed no significant difference between the hottest and coldest years in the last 11 years.


  278. anthony beevor says:

    Arfur

    You can put this in your collection of stubborn
    people having their noses rubbed in a fact and
    yet not giving an inch.

    I do not know if you follow English Football. Chelsea
    is a ‘big’ club which has had a billion pounds pumped
    in by one of those lovely Russians, and Swansea is an
    ordinary ‘little’ club.

    Two nights ago Swansea beat Chelsea, on Chelsea’s home
    ground, 2-0. This is what the manager of Chelsea had to
    say about it.

    “…if you play this game ten times maybe you will win
    nine of them…if we had scored one or two it would have
    been different…I was happy with the way the team were
    working…we were there, controlling!”

  279. Nigel Ray says:

    Beevor

    What’s the climate like in Swansea?

  280. anthony beevor says:

    Horrible.

  281. Arfur Bryant says:

    anthony beevor says:
    January 11, 2013 at 5:11 AM

    Anthony,

    I was born in Swansea! (Uplands) 🙂

    Nice pick up on Benitez’s musings. It was a cracking result from a Jack point of view! Two fabulous goals. I hope we can hang on to both Michu and Graham. I also believe we have the two best goalkeepers in the Premiership! Having said that, I’m really an Ospreys fan…

    As to David ‘Benitez’ Appell and Entropic ‘Abramovich’ man…

    I’ve had it with them. I have tried to treat them with respect and mutual regard. Their last two posts to me simply demonstrate that they are incapable of answering arguing a simple point without window-dressing or deflecting onto another subject.

    Ho hum. The only time they will realise the folly of their belief is when there is even more evidence which falsifies the CO2=cAGW postulation.

    Thanks for making me smile!

    ps, the weather in South Wales today is fabulous! The CO2 must be causing it!

  282. Arfur Bryant says:

    David Appell says:
    January 10, 2013 at 8:14 PM

    And…

    David Appell says:
    January 10, 2013 at 8:17 PM

    David,

    Nice attempts to change the subject away from you being unable to defend your own position. As you are incapable of debating in a rational, mature way, I will let you wallow in your own fantasy.

    I wish you well.

    Good day,

    Arfur Bryant

  283. Arfur Bryant says:

    Entropic man says:
    January 10, 2013 at 7:20 PM

    Entropic,

    A you tube video from John Cook?

    Ha Ha. Too funny. Bless you for trying, though.

    Meanwhile, in the real world, check out how warm 2012 is compared to 1998 in EVERY SINGLE official global dataset when they are updated this month.

    That’s it from me.

    All the best,

    Arfur

  284. Kristian says:

    David Appell says:
    January 10, 2013 at 8:10 PM

    “Kristian: Make your point, simply. Can you do that?”

    I’ve already made my very simple point probably around 15 times, David. You’ve employed the silliest of all tactics to avoid answering it, by pretending not to understand the question, even what issue the question is supposed to address and then just go on repeat asking me to ‘make my point.’

    If your beloved hypothesis had ANY merit, you would’ve had no problem answering my questions … But you felt the need already from the onset only to deflect. I think this tells the people following this thread a lot about the strength (weakness, that is) of your position.

  285. Hops says:

    I keep seeing references to there being no warming for 16 years because 1998 is somehow a selected baseline. But if you pick 1996 or 2002, there has been considerable warming. That gives you the paradox that there has been considerable warming for 17 years, and for 11 years, but not for 16 years.

    Can we all agree that cherry picking 1998 is no more valid than picking 1997?

  286. nigel ray says:

    Arfur says

    the weather in South Wales today is fabulous

    But is this statistically significant fabulosity?
    And have you cleared your statement with the Inquisition?

  287. Hops says on January 11, 2013 at 12:28 PM:

    “I keep seeing references to there being no warming for 16 years because 1998 is somehow a selected baseline —- — —.
    Can we all agree that cherry picking 1998 is no more valid than picking 1997?”

    = = = = = = = =

    1998 is a “selected baseline”, I believe in most cases, because for a long time after the IPCC, the UK Met. Office (and other AGW peddlers), chose 1998 as “The warmest year on record”

    As late as early/mid January 2011, when the right figures were in, the UK Met Office announced that 2010 was the second warmest year after 1998. – 2010 had only been a couple of tenths of a deg. cooler than 1998 they wrote.

    It was then quickly pointed out to them that if that was the case then it was quite evident that there had been no warming since 1998.

    Then, the Met. Office quickly countered that 1998 could not be relied upon because 1998 was an El Niño year. – That, by the way, was the first time I had heard any “warmists” even mention any “El Niño” year. – Nor have they said anything like “And 2010 was also an “El Niño” year.

    During all the years that had passed from the mid 1970s – after and including1998 were CO2 warming years, including 2010.
    “Only since, or after, the 2011 Met. Office “gaffe” have the “Official AGW Scientists” been including El Niño/La Niña in their talks. – And then only on occasions when they wish to remove 1998 from the calculus.

  288. Arfur Bryant says:

    nigel ray says:
    January 11, 2013 at 1:44 PM

    Nigel,

    Sorry. What I should have said was:

    “The weather in South Wales today is very likely to be statistically better than it was yesterday, making it the 14th highest ‘fabulous’ day since the records we’re deciding to use today began, which is continuing evidence that less than 0.04% of the atmosphere is likely to cause catastrophic sales in Joe’s ice cream parlour, Swansea.”

    Better? 🙂

    ps, it’s the best ice cream in the world! Evah!

  289. Arfur Bryant says:

    O H Dahlsveen says:
    January 11, 2013 at 1:49 PM

    OHD,

    A very fair summary.

  290. Nigel Ray says:

    Arfur

    But what computer model were you using?

  291. Arfur Bryant says on January 11, 2013 at 4:06 PM:

    “OHD,
    A very fair summary.”

    = = = = =

    Thanks, I can but guess that there are at least “a couple of commenters” above who think it was all a lot of rubbish, like a figment of my imagination perhaps. – They may even ask for the appropriate graphs – and references.

  292. Doug Cotton says:


    There can be no doubt that the world has not seen any further upward movement in the roughly sinusoidal 60 year cycle which peaked around 1998. Sure there was a second slightly lower peak in 2010, but since then we have had two more years which are back on the cooling trend, and temperatures have not in any year exceeded the 1998 maximum. We can expect slight cooling to continue till at least 2027 or 2028. Yes there will be 30 years of warming after that, but around that time the long term (~1,000 year) cyclic trend will start a 500 year overall cooling period.

    So the conjecture of greenhouse warming is simply not working, because it simply violates the First Law of Thermodynamics in the very first fundamental assumption that there would have been a zero lapse rate (isothermal atmosphere) in the absence of WV and GHG. Such an atmosphere would be creating energy, just as if you could throw a stone in the air and it would keep going upwards for ever, even though it was gaining potential energy. Molecules are no better at creating energy than are stones. Neither succeed one little bit.

    The foundation stone of the GH conjecture (Roy’s (6) in his recent post thereon) is removed and the whole thing crumbles to the ground, which it wasn’t warming in the first place.

    Oxygen and nitrogen keep the surface warm with non-radiative processes just by being there at almost the same temperature. And they are at that temperature because of the autonomous formation of a thermal gradient as molecules swap KE and PE when in free flight between impacts – even in still air – even without convection – even at the poles of Venus where no sunlight ever reaches down. The great planets receive virtually no solar insolation at their surfaces, so where is the energy for any back radiation?

    That is the real world. That is the real Solar system. That is the real universe, because physics is universal. The autonomous thermal gradient in the atmosphere, together with solar insolation which sets the overall level of the thermal profile, determines the surface temperatures on Venus, Jupiter, Saturn, Uranus, Neptune and – wait for it – Earth.


  293. Entropic man says:

    O H dahlsveen.

    “Then, the Met. Office quickly countered that 1998 could not be relied upon because 1998 was an El Niño year. – That, by the way, was the first time I had heard any “warmists” even mention any “El Niño” year.”

    Look at the UAH graph at the top of this blog. Even Dr. Spencer recognises 1998 as an unusual El Nino year, worthy of special mention.

    Among climate scientists it is widely regarded as a statistical outlier, rather than a typical year. Political sceptics like yourself, of course, find it a useful cherrypick.

  294. Entropic man says:

    David Appell

    Arfur Bryant referred to us as ” David ‘Benitez’ Appell and Entropic ‘Abramovich’ man…”

    Once again I am encouraged to see a sceptic resorting to insult.

    We are making progress.

  295. Entropic man says:

    Hops

    If you pick 1994, or almost any earlier date, the increase to 2012 is 95% statistically significant.

  296. Entropic man says on January 11, 2013 at 6:48 PM:

    “O H dahlsveen.

    Among climate scientists it is widely regarded as a statistical outlier, rather than a typical year. Political sceptics like yourself, of course, find it a useful cherrypick.”
    = = = = = =
    The difference between “Warmists” and “Climate Scientists” is IMHO that the former call themselves Climate Scientists, possibly in order to baffle brains, while people like Dr. Spencer are scientists who study the climate. –

    Climate science involves the study of all of earth’s sciences, even including history, and is therefore to ‘heavy a toolbox’ for one person to carry.

    Dr. Spencer can be seen as an expert on “El Niño” and he has been talking about it for years.

    By the way, why do you state: “Political sceptics like yourself, of course, find it a useful cherrypick.”?

  297. Arfur Bryant says:

    Nigel Ray says:
    January 11, 2013 at 4:21 PM

    Duh! I used the model that gave me the answer I wanted, of course! 🙂

  298. Nigel Ray says:

    Entropic Man says on Jan 11

    “Once again I see a skeptic resorting to insult.
    We are making progress.”

    On Jan 6 at 2:55 PM Entropic Man said

    “Best ignore Kristian. I learned years ago that it is
    worthwhile investing time to educate an ignorant man,
    but a waste of effort dealing with a fool.”

    Seems clear that Entropic Man threw the first stone.

  299. Arfur Bryant says:

    Entropic man says:
    January 11, 2013 at 6:52 PM

    Entropic, If you have taken offence to me comparing you to a highly successful multi-billionaire, then I offer you my apologies that you found my comment offensive.

    As you can see, I do not find it difficult to offer an apology if I have caused offense.

    {Entropic man says:
    January 6, 2013 at 2:55 PM}

    Just like you apologised after calling Kristian a fool. Oh, wait a minute…

  300. Nigel Ray says:

    I was wrong. It was Appell that threw the first
    stone, on Jan 4, 5:52 PM

    “…today, the cranks pick on the greenhouse effect.”

  301. torontoann says:

    Thank you, Nigel, for bothering to track
    that back.

    The blog log keeps us honest.

    In the old days of late-night student
    argy-bargy, I could usually get away
    with screaming “I NEVER said that!”
    Sometimes,I would even convince myself.

  302. anthony beevor says:

    Entropic Man says

    “Among climate scientists [1998] is widely regarded
    as a statistical outlier.”

    The following is from the accompanying documentation
    to one of the standard computer statistics packages:

    “Without a consistent laboratory policy on when you
    remove outliers, you are likely to only remove them
    when it helps push the data towards the results you
    want.”

  303. torontoann says:

    Re: possible “statistical outlier” in above graphed data:

    Ran Grubbs’ test on annual temperature anomalies data
    (can’t use monthly, because of moderate autocorrelation):

    Result

    NO OUTLIERS DETECTED.

  304. Arfur Bryant says:

    All,

    I’ve said it before and I’ll say it again…

    Nobody said anything about ‘statistical outliers’ when the MBH98 was used to sell catastrophic global warming to Joe Public.

    This is a classic case of pro-cAGW commenters wanting to have their cake and eat it…

  305. Nigel Ray says:

    torontoann says

    NO OUTLIERS DETECTED

    I just ran the same test; I also tested the
    first differences, because of the autocorrelation.
    I found:

    NO OUTLIERS DETECTED

    Turning points are not automatically outliers!
    They are just local extremes.

  306. torontoann says:

    “local extremes” is probably right.

    So, I repeat my recommendation to put “warning lines” at
    the upper and lower extremes of the last 34 years – and,
    well… that’s it.

    One thing I will be following “real time” is the
    suggestion that we now have an “aborted El Nino.”
    That would be an interesting phenomenon.

  307. David Appell says:

    Arfur Bryant says:
    >> Nobody said anything about ’statistical outliers’ when the MBH98 was used to sell catastrophic global warming to Joe Public. <<

    One of the reasons MBH was a significant advancement was the way it allowed uncertainties to be incorporated and quantified.

  308. David Appell says:

    Doug Cotton says:
    >> Well, here is what has happened at 60,000ft (21Km) these last four years. Which altitude and period did you cherry pick David? <<

    These are raw temperatures that have no been processed. Do you not see the caveat at the bottom of the data page? It says:

    "The global-average data displayed on this page have only limited quality control, can undergo unannounced changes, and so should only be used as a general guide. Official, quality-controlled global lower-tropospheric temperatures, using more extensive processing procedures (and possibly different satellite instruments) are updated every month and are available at: http://vortex.nsstc.uah.edu/data/msu/t2lt/&quot;
    http://discover.itsc.uah.edu/amsutemps/caveat.html

    Also, 4 years is too short a time period to discern a trend.

  309. David Appell says:

    Kristian says:
    >> I’ve already made my very simple point probably around 15 times, David. <<

    I still don't know what it is, except maybe some claim about energy flux at the Earth's surface.

    If so, the only way I know to measure that is by looking at ocean heating, which is, for 0-2000 meters at least, positive:
    http://www.nodc.noaa.gov/OC5/3M_HEAT_CONTENT/

    It would help if you made your claim in straightforward, simple language, without a lot of capital letters and double negatives, and without all the insulting verbiage.

  310. David Appell says:

    Arfur, again:
    do you have a better way to calculate future climate, than numerically solving the equations that try to describe the physics?

  311. Arfur Bryant says:

    David,

    …try to describe the physics? Have a think about your deflective and irrelevant question. Have a real think about it.

    Now read my post of
    Arfur Bryant says:
    January 11, 2013 at 7:29 AM

    Play your games elsewhere.

  312. Entropic man says:

    I will apologise for calling Kristian a fool if he can meet David Appell’s request for a coherent answer to his own question. His answer should includeproperly presented peer reviewed data, such as graphs with properly labeliied axes, colour coding and, where necessary, expansion of acronyms.

  313. David Appell says:

    Arfur: Yes, that try to describe the physics. No one has come up with a better way to determine future climate than with a climate model. Since you dismiss them completely, I’m guessing you must have a better method. So what it is?

  314. Doug Cotton says on January 11, 2013 at 9:12 PM:

    “OHD and Entropic

    See this comment …

    http://www.drroyspencer.com/2013/01/waste-heat-as-a-contributor-to-observed-warming/#comment-68674

    = = = = = = = = = =

    I am very curious now Doug as to what I have so far said – in these comments – that disagrees with what you have said in: “comment-68674” referenced above.
    You may be surprised to learn that I agree with a lot (nearly all) of what you are saying in most of your comments.

  315. Arfur Bryant says:

    David,

    Stop with the attempted deflection.

    You are trying to deflect the discussion away from the fact that you are unable to defend your asserted position that CO2 and other nGHGs are responsible for 25% of the Greenhouse Effect (8.25 degrees C). I have shown you that this is a logically fallacious assertion. It is not up to me to help you dig yourself out of your hole.

    Your prevaricating attempts at erecting a strawman argument are noted.

    This thread is nearing its natural end – just like the theory that a trace gas can have a significant effect on global temperature. See the first comment.

  316. Doug Cotton says:

    OHD It was mainly that I noted your discussion with Entropic and also wanted to draw your attention to what I’d said about his comments. Are you in agreement about the gravity effect demolishing the GHE?

    David OK I’m the first to agree that long-term trends should be done as I did myself in the Apppendix of Radiated Energy and the Second Law of Thermodynamics published on several sites in March 2012. There I showed how the rate of increase has declined from 0.06C/decade to 0.05C/decade since the year 1900. This is in keeping with the usual up and down movement of about 2.5C each 500 years. When are you going to come to grips with the “Second School of Thought” in Planetary Surface Temperatures. A Discussion of Alternative Mechanisms?

  317. Doug Cotton says:

    David

    “No one has come up with a better way to determine future climate” Of course I have – it’s not hard to do better than something which is based on a false assumption in the first place. I predicted slight cooling till 2028 over a year ago.

    One simple question for you …

    In an “ideal” still atmosphere (with the same composition as Earth’s) does gravity produce

    (a) isentropic conditions with a temperature gradient, or

    (b) isothermal conditions with an entropy gradient.

    If (a) then the GHE is dmeolished.

    If (b) then the First Law of Thermodynamics is demolished.

  318. Nigel Ray says:

    “try to describe the physics…”

    by incorporating “empirical” model parameters; otherwise
    known in the forecasting business as applying a big dollop
    of hot chocalate fudge.

  319. Nigel Ray says:

    I spelled chocolate wrong! It is a very emotional subject
    for me.

  320. anthony beevor says:

    Only time I got stopped at Dover Customs coming
    back from the Continent.

    “Are those ten kilos of Belgian chocolates for
    your own consumption, Sir?”

    “Snarl!”.

    “Well, carry on then. And good luck with the diabetes!”

  321. Entropic man says:

    Speaking of chocolate fudge. One of the best extended jokes on Hot Fudge Sundae was in Larry Niven’s book “Lucifer’s Hammer”.
    Baen Books include a summary of Chapter 9 on their website.

    http://www.baenebooks.com/chapters/0872234878/0872234878.htm?blurb

  322. Entropic man says:

    Doug Cotton

    “In an “ideal” still atmosphere (with the same composition as Earth’s) does gravity produce

    (a) isentropic conditions with a temperature gradient, or

    (b) isothermal conditions with an entropy gradient.”

    Trick question.
    The answer is (a), of course.

    However, your ideal still atmosphere would only occur in a closed system, without solar insolation, outward longwave radiation, greenhouse effect or any other energy flows.

    Your ideal would have to be in complete thermal equilibrium.The real atmosphere never reaches this ideal still state.

    You cannot use an ideal system which, by definition, has excluded all energy flows, to disprove the existance of one in particular.By your logic solar insolation, OLR, convection and all other energy flow processes do not exist either.

  323. Doug Cotton says on January 13, 2013 at 6:11 AM”

    “Are you in agreement about the gravity effect demolishing the GHE?”

    = = = = = =

    Yes, is the short answer. – To explain exactly why I agree is going to make this posting so long that not many would have the patience to read and understand it all. But in short:

    “If it was not so there would be no “Fohen/ Føhn Winds” or “Chinooks” as the Americans call them. – In other words –Adiabatic cooling and heating, moist and dry rates being similar world wide, is down to gravity. Temperature, for the whole globe, is down to the rays of the sun in conjunction with the surface’s various absorption rates and resistance to penetration and to atmospheric dencety –

    Air movements horizontally along the surface distribute air-and ground temperatures around the world. Air movements vertically up cool that air, vertical air down warms it back up. – And – as different air masses ascend at different rates – those that stay near to the surface longer keep their temperature steady longer.
    So, I therefore always ask; “where does cooling by “lightning speed radiation” come in?”

    I have my own answer to that question too, but there again –long postings and readability – – – -.

  324. David Appell says:

    Nigel Ray says:
    >> “try to describe the physics…”
    by incorporating “empirical” model parameters <<

    What's wrong with that? Those were used back in the day due to a lack of computing power, and are now mostly gone.

    Again, do you have a better method?

  325. David Appell says:

    Doug, Entropic Man is right, of course: the atmosphere is not isentropic — there’s a huge source pouring energy into it all the time.

  326. David Appell says:

    Arfur Bryant says:
    >> You are trying to deflect the discussion away from the fact that you are unable to defend your asserted position that CO2 and other nGHGs are responsible for 25% of the Greenhouse Effect (8.25 degrees C). <<

    That's what the peer reviewed science shows. And, yes, it's logical.

  327. Nigel Ray says:

    Modellers might try getting the mesh size down by
    several orders of magnitude. The last one I was
    invited to play with, had areal blocks of 50 kilometres
    by 50 kilometres.

    Part of the trouble is that the models really often need
    to be run millions of times to assess their sensitivity to simultaneous changes of parameters. Most people do not
    have Crays! I started with the old Titan at Cambridge
    in 1963. A million ops a second. After six months we were
    moaning, Not enough!

  328. Arfur Bryant says:

    David Appell says:
    January 13, 2013 at 12:14 PM

    David,

    That is your defence? [“That’s what the peer reviewed science shows. And, yes, it’s logical.”]

    That is what the peer-reviewed says, not what it shows. It doesn’t ‘show’ anything because it doesn’t use real evidence. Models are not evidence.

    So, where is your logic?

    I repeat…
    In 1850, the GHE was 32.2C, and the CO2 was 280ppm.
    In 2012, the GHE is 33C and the CO2 is 395ppm. That is a 41% increase in CO2 and a 2.5% increase in GHE. The two are not proven to be correlated. The 0.8C increase in global temperature since 1850 may or may not be due to anthropogenic emissions of CO2. You can’t say that it is, and I can’t say that it has nothing to do with CO2. But it doesn’t matter. The anomaly, which you say is logical, is that a forcing strong enough (according to you) to contribute 8.25C to the GHE has to have a bigger effect than ‘a portion of 0.8C’ for a 41% increase..

    You can’t have it both ways. The 25% figure is illogical. Peer-reviewed or not.

    Be objective.

  329. torontoann says:

    You should really use the physics mainly for constraints.

    For example.

    According to NASA, or most other sources you try, the
    main players in the game of ridding the earth of heat
    are the atmosphere+clouds and the surface of the earth.
    They radiate, on average, 199 and 40 W/m2 to space, respectively.It is also generally agreed that the earth system is absorbing net heat energy at 0.6 W/M2.

    Total-global-warming will stop, therefore, when the temperature of the atmosphere and the surface of the earth jointly rise enough to increase outward radiation from 239.0 W/M2 to 239.6 W/M2*. Assuming the rough applicability of black-body rules, and the 4th power rule for temperature dependence, we can calculate the requisite
    rise as 0.2 C.

    That is the maximum further rise that is “built-in”
    by GHG history to date.

    * Changes in transfers between the atmosphere and the
    surface will under these assumptions be neglible.

    So the net imbalance is a sort of leading indicator,
    to borrow parlance from economics; and is possibly
    more useful than trying to “solve the whole system”.

    Economics went through the phase of building complex
    econometric, structural, models – and it went wrong.

  330. torontoann says:

    Of course, that rise of 0.2 C MIGHT have unexpected effects – for instance, on cloud cover – that change the imbalance
    again; but the burden of proof would have to be on the one who made claims of such effects.

  331. Nigel Ray says:

    If the atmosphere alone had to take on
    the “burden” of increasing the OLR, the
    figure would be little changed.

  332. Nigel Ray says:

    In case torontoann went too fast for anybody:

    239.0 to 239.6 is an increase of 0.25%. The 4th power
    rule for temperature means that the system has to increase
    in absolute temperature by 0.25%/4 = 0.06%. The existing
    absolute temperature is about 300K. 300 times 0.06% is
    0.18 degrees – say 0.2 C

  333. anthony beevor says:

    To tell the truth, this is all becoming tedious.

    One way or another the human race is going to
    **** the planet, or itself. A few tenths of a degree C
    here or there in an average is not the biggest of my
    worries. As Nigel Molesworth, the Sage of St Custards,
    said in 1957, “The human race is all swankers and rotters; everybody should jump in the sea.”

  334. Who says this is getting “tedious” mr beevor?

    According to the GHG theory, the earth’s surface can radiate “Heat Energy” to GHGs which then absorb the energy and therefore get hotter – these little magical molecules then do not ascend as is usual to do for air pockets that are warmer than the surrounding air, but they send their newfound heat straight back to the surface which now is getting hotter as it is, as we all can see, re-receiving the energy it got rid of in the first place.

    What I would like to know now is; “By what mechanism do GHGs avoid absorbing “Heat Energy” from each other? – Is it just because the natural laws says that “Perpetual Mobile” is not permitted?

    This could be very exiting!!!!

  335. anthony beevor says:

    Actually the GHG’s do absorb heat from each other.
    That is why the energy intercepted by CO2 is largely
    radiated to space by H20. It is a communal thing.

    My children have taken exception to the suggestion
    they should jump in the sea. Instead, apparently, they
    are happy for me to do it on my own.

  336. Entropic man says:

    Nigel Ray

    “I started with the old Titan at Cambridge
    in 1963. A million ops a second. After six months we were
    moaning, Not enough!”

    I remember Titan.

    My father lectured in computing in Cambridge in the 1960s.He took my younger brother and I in to the Maths Department off Downing Street to see Titan one day.

    We played Space War with a 6″ circular screen and a row of four switches on each side. Two circular spaceships with guns sticking out shot full stops at each other, like a precursor of Asteroids.

    I must have been about twelve.

  337. Entropic man says:

    Here’s a good reason for us all to be polite.

    http://www.desmogblog.com/2013/01/10/science-why-comment-trolls-suck

  338. David Appell says:

    Arfur Bryant says:
    That is what the peer-reviewed says, not what it shows. It doesn’t ’show’ anything because it doesn’t use real evidence. Models are not evidence.
    ——————————-

    It’s a result of a calculation — solving the equations that describe the underlying physics. That’s what ALL physics is — solving the equations.

    Here, because the equations are so complicated, they are solved by numerical methods using a computer. Lots and lots of science is done this way.

  339. Entropic man says:

    torontoanne

    Nice reasoning.

    One small thing; your stable point at +0.2C is based on existing atmospheric CO2.

    Since we are still pumping more CO2 into the atmosphere the imbalance is likely to increase, and the equilibrium temperature rise with it.

  340. David Appell says:

    Nigel Ray says:
    Modellers might try getting the mesh size down by
    several orders of magnitude. The last one I was
    invited to play with, had areal blocks of 50 kilometres
    by 50 kilometres.
    =====================================

    And how do you propose they do that? Grid size depends on how much computing power you have — when that increases, grid sizes decrease and more physical factors get put in the models. You can’t do better than your processor allows.

    See here for a picture of the evolution of climate models:

    http://davidappell.blogspot.com/2011/04/progress-in-climate-models.html

    Fig 1.2 (page 99) here has a picture of the progress in incorporating physics:

    http://www.ipcc.ch/pdf/assessment-report/ar4/wg1/ar4-wg1-chapter1.pdf

  341. David Appell says:

    Arfur Bryant says:
    In 1850, the GHE was 32.2C, and the CO2 was 280ppm.
    In 2012, the GHE is 33C and the CO2 is 395ppm. That is a 41% increase in CO2 and a 2.5% increase in GHE.
    ========================================

    Oh dear.

    First, you have to use absolute temperatures if you want to do percentage changes — otherwise it depends on what scale you choose.

    Secondly, your numbers for the GHE aren’t accurate. Figure 2 in the Lacis et al paper I cited show it to be about 35 C — to be precise, if noncondensing GHGs (CO2, CH4, etc) were suddenly taken out of a preindustrial (280 ppm) atmosphere, the surface temperature would end up 35 C cooler, taking about 20 years to get there.

    Finally, you are assuming linear relationships when the science doesn’t find them. Forcing from CO2 is logarithmic, but the temperature change depends on feedbacks too, like increases in water vapor, so you have to use the climate sensitivity.

    Lacis et al is perfectly logical, since it’s a logical deduction from the physics.

  342. Doug Cotton says:

    In still air in adiabatic conditions any region of the atmosphere has a propensity towards isentropic conditions such that molecules move retaining PE+KE=constant in free path motion between impacts. This means there must be a thermal gradient, not formed by convection but by diffusion. Convection can form it, but is not essential. Venus temperatures can only be explained by diffusion which has ensured isothermal conditions in horizontal planes right around the globe, but temperature gradients in vertical planes. The gravity induced gradient in the troposphere is then reduced by up to about a third due to intra-atmospheric radiation from warm to cool layers above.

    There never can be no radiation absorbed or emitted by any atmosphere. Even hypothetical pure nitrogen and oxygen atmospheres would absorb and re-emit some UV and visible radiation, this being the source of heat for such atmospheres at all altitudes. The heat then diffuses where necessary to “perfect” the gradient in calm adiabatic conditions. Obviously weather conditions cause variations, but these are just like waves on the top of the ocean – everything settles down to the required level in calm conditions.

    I have summarised all this in a new article just published on Principia Scientific International entitled “The 21st Century New Paradigm in Climate Change Science” which should be able to be found on Google soon. You can of course just go to the PSI Home page and use the link top left.

    It’s all there, and you should find answers to all the above questions that several have asked. The key issue is to consider the atmosphere as it is, and the effect of variations, such as additional water vapour causing more intra-atmospheric transfer of heat from warm to cool layers, thus reducing the thermal gradient and hence the surface temperature.

    There’s also my paper on “Planetary Surface Temperatures. A Discussion of Alternative Mechanisms” which provides cited papers, experiments etc in support of this.

    I’ll be in hospital tomorrow, so won’t be answering questions for a while. As I said, you should find all you want to know about what we all at PSI are now talking about in this new paradigm shift, whereby radiation reduces the thermal gradient, whilst oxygen and nitrogen play the main role supporting the surface temperatures.

    And that’s the way it has to be, because nothing else keeps within all the laws of physics and explains all observations (even on other planets) as does this hypothesis.


  343. torontoann says:

    Entropic man says:

    “nice reasoning”

    Thank you.

    Entropic man also says:

    “we are still pumping in more CO2”.

    Naturally; that is why I said built-in by GHG HISTORY.
    The idea that existing CO2 levels have “doomed us” is
    contrary to these simple calculations.

    As to your comment about politeness, I quite agree.
    I think most people would. But it is so hard to get
    visual and physical things across by TEXT. It is
    hard work writing it, and even harder work reading
    it. Everybody gets frustrated. And if you try putting
    a bit of maths in, the formatting usually goes wrong!
    And anyway, people will think you are “swanking” –
    to use that lovely old word of which beevor reminded us.

    I went to see “The Hobbit” yesterday. Plenty of trolls
    and goblins died horribly.

    As someone here said, the Chinese, etc. are going to
    COMPLETE this CO2 experiment for us, and we will just
    have to wait and see.

  344. Nigel Ray says:

    Entropic Man says:

    “In Cambridge in the 1960’s…”

    You will remember, therefore, the hard winter
    of 1962/1963. Almost 50 years ago to the day,
    I went for a walk in the night with a friend.
    There had been a new fall of snow of about six
    inches, and there was no wind at all. The sky
    had cleared and there was a mass of stars.
    The river was frozen solid, and we walked ON IT,
    alone, through the backs. On each side – just a few
    feet away – the ancient college buildings
    reared up, with soft lights showing through the
    leaded windows. Total silence. A magical experience.

  345. Nigel Ray says:

    Ever increasing computer power, tweaking of parameters,
    hindcasting…that way can lie madness. And I mean that
    literally. I have an elder brother whom the family has
    thought at times about committing to an asylum.

    He went abroad in the late 1950s and make a large amount
    of money on Wall Street by trading in a rather unorthodox
    manner. He should have retired at that time but he did not. Somebody put a worm in his brain, by saying to him “If you
    put your methods into a program, a computer could do your trading for you, and probably do it better!”

    He started. First, I tried his programs for him. They did not work in real time. Then he hired a computer deparment at
    a U.S. University to work with him. The programs did not work. Then he bought a computer company so that he could force the employees to do the programming – that did not work out at all well! Then he persuaded some investment funds to try the programs. They did not work. Ever since, he has probably employed about fifty different programmers to “finalise” his systems. They all work wonderfully – in the past. Needless to say, he has been broke for quite a while now. And needless to say, his wife left him quite early on in the process.

  346. Kristian says:

    Entropic man says:
    January 12, 2013 at 3:37 PM

    I don’t need your apology, Entropic man. You’ve already shown your true face by calling people who disagree with you fools. An apology can’t really save that face.

    What I do need is for you (and David Appell) to show (not just say) that the radiative imbalance that you go on and on about is being caused by reduced total OLR (outgoing longwave radiation) rather than increased net DSR (downwelling shortwave radiation minus albedo) at TOA. I’ve already shown you here:

    http://www.drroyspencer.com/2013/01/uah-v5-5-global-temperature-update-for-december-2012-0-20-deg-c/#comment-68573

    http://www.drroyspencer.com/2013/01/uah-v5-5-global-temperature-update-for-december-2012-0-20-deg-c/#comment-68575

    how the radiative imbalance at the Earth’s surface can’t be the result of reduced energy loss. This is because the energy loss from surface to atmosphere has become larger, not smaller, during the global warming period, mostly because of increased evaporation from the world ocean.

    The most reliable (satellite) sources we have all tell the same story, about increased OLR at TOA since the 80s. That goes for ERBE-CERES, ISCCP FD and HIRS along with NOAA OLR Interpolated all the way since the late 70s. The NCAR/NCEP Reanalysis also agrees.

    http://meteora.ucsd.edu/~jnorris/reprints/02_Norris_and_Slingo.pdf

    From Norris & Slingo 2009: “The most recent results [after adjustments of ERBS data] indicate a slight trend towards more LW emission [OLR at TOA] (consistent with a weakening of LWCRF) but a larger trend towards less SW reflection so as to produce a net gain of energy to the Earth. Measurements of ocean heat content are consistent with a net gain of energy during the past two decades (Wong et al. 2006).”

    The radiative imbalance is there in spite of INCREASED total energy loss from Earth, not because of REDUCED total energy loss.

    That way we can be pretty certain the Sun did it, not the atmosphere.

  347. Daniel Reppion says:

    Arfur I think you’re digging a bit of a hole here. The presumption, that an increase in CO2 creates a proportional and direct linear increase in temperature response, isn’t physically correct.

    CO2 has defined absorption bands in the infrared that it affect (~ 12 – 15 µm IIRC), thus the temperature effect it can have lessens with increasing amounts, as that band approaches saturation. There fore it is highly inaccurate to make inferences based on contemporary temperature and CO2 change in order to falsify CO2s existing effect. The alteration in temperature attributable to a change in atmospheric C02 content from 0 ppm to 200 ppm would be far greater than that of an increase from 200 ppm to 400ppm, for example.

    This isn’t to say I agree with David’s figure of 25%, as CO2’s potential effect would be highly dependent on the presence of water vapour, which overlaps the absorption spectrum of CO2. Higher humidity would lead to a lessened CO2 effect (as that band is already controlled by H2O, there’s little for CO2 to accomplish), lower humidity the opposite.

    In very dry polar air it might be as high as 25% (for all I know), at the tropics in monsoon conditions it might be more like 5%. Certainly temperature anomaly figures are suggestive that this might be the case.

    Insofar as I can comment from a current tertiary ed perspective, a doubling of CO2 from pre-industrial is meant to produce 3° C (with an error range 1.5 – 4.5°C) of warming, which is much closer to the temperature change you stated for the 100ish ppm change in CO2 content. That comes with the obvious caveat that a. ultimate temperature change from an immediate CO2 increase takes place over time and b. deriving a temp figure back to 1850s must come with a hefty margin for error. Even if those stations were all 100% reliable the global lack of coverage alone would make for a very broad data range.

  348. Nigel Ray says:

    Appell says:

    “You have to use absolute temperatures if you want to
    do percentage changes…”

    Surely not for the point Arfur was making, which was
    comparing an estimated effect at one time with the
    estimated effect at another time.

    You seem to think that Arfur was saying something like
    “A change of ambient temperature from 32.2 C to 33.0 C
    is 2.5%” , when it is a change from 305.4 K to 306.2 K
    i.e. 0.26% on the absolute scale.

    I understood him to be saying “Greenhouse gases are
    supposed to have made things warmer (than otherwise)
    by 32.2 C at one time, and now by 33.0 C. The impact
    of GHG is 2.5% bigger.” Any temperature scale will
    do for such a statement.

  349. Arfur Bryant says:

    Nigel Ray says:
    January 14, 2013 at 9:26 AM

    Nigel,

    Yes, precisely. I’m going to have to answer David and Daniel separately, but you are correct. The point is valid and no amount of pedantry will change the simple, but really important, fact:

    in 2012 there is a GHE. Lacis himself puts it at 33 deg C. (Lacis et al 2010)
    1850 there was a GHE. By process of deduction (or subtraction!), it is 32.2 C (HadCRUt3 data).

    The logic is simple, IF CO2 was powerful enough for a concentration of 280ppm to equate to 8.05C in 1850, then a 40% increase in CO2 to 395ppm MUST have had a greater effect than 0.8C – and that assumes that ALL of the 0.8C rise was due to CO2!

    Yes, my simple figures use a linear relationship, and yes, of course I know that the CO2 relationship is not linear. But adopting a non-linear relationship would actually re-inforce my argument in that the remaining 60% to a doubling of CO2 would give rise to a warming of no greater than 0.8C!

    So, according to the warmist rhetoric on one hand, and observed data on the other, a doubling of CO2 could only give us a portion of about 1.6C. Now, since the rise of 1910-1945 is of a similar amount (0.7C), and it has been argued by warmists that the CO2 effect only started since about 1950+, then the actual contribution of CO2 to the ‘observed’ warming is, logically, tiny (as torontoann has deduced). This means that Lacis and David’s assertion that CO2 contributes 25% is demonstrably incorrect.

    I hope this clarifies. I have read acres of stuff written by ‘climate scientists’ on this subject and have argued this point with more warmists than I care to number. Not one of them seems to realise the massive anomaly that these figures represent. When people like David regurgitate Lacis’ figure (20% CO2 and 5% other nGHGs), or K&T, or Schmidt, or scienceofdoom (26%), they seem blissfully unaware that ‘something’ had to be responsible for the ‘atmosphere effect’ in 1850. That ‘something’ could not possibly be CO2 (and other nGHGs) in the sort of prominence allocated to it now.

    Regards,

  350. Arfur Bryant says:

    David Appell says:
    January 13, 2013 at 7:14 PM

    David, at the risk of furthering your attempted deflection away from the subject, for the equations to work in the real world, they must be based on the correct figures! If you have too many unknowns or variables in the equation, it can’t be solved in any valid quantified sense.

  351. Arfur Bryant says:

    David Appell says:
    January 13, 2013 at 7:33 PM

    David,

    ‘Oh Dear’ yourself.

    Lacis himself states the GHE is 33C. If you think you can persuade anyone that it has gone up by 2 whole degrees C in two years, you are deluding your self.

    Yes, I know that the relationship is not linear. But my using a linear relationship keeps the point I am making simple. You go ahead an use a logarithmic effect to explain the 0.8C warming since 1850 (or at least the part that YOU think is due to CO2) and see what happens to your climate sensitivity.

    Feedbacks, particularly from water vapour, are totally unproven. If they existed, the temperature would be warmer and the warming would be accelerating.

    Lacis figure of 25% is wrong. If it was right, the world would be MUCH warmer by now!

    Try to be objective. Work back from the observed data and question your theory.

  352. Arfur Bryant says:

    Daniel Reppion says:
    January 14, 2013 at 8:33 AM

    Daniel,

    Again, on the face of it I seem to be digging a hole, I know! However, it is the pro-cAGW theory that is digging its own hole, as I shall try to explain.

    Firstly, I am well aware of the logarithmic effect of CO2 absorption. I use linear a relationship in my question to simplify things. But it raises some interesting points:

    1. Your comment about ‘0-200ppm is a far greater warming than from 200-400ppm is correct. But how much? If you go back in doublings of CO2, then if pro-cAGW commenters are right about 3C for climate sensitivity, then 198ppm (395/2) would have equated to a temperature of 30C. Further back, a concentration of 99ppm would have equated to 27C. Etc etc, you get the picture. Unless you are suggesting that each doubling has a different level of warming…

    Now, if you (not personally, but warmists in general) want to change the goalposts and vaguely attribute a lesser warming due to the previous doublings, or a greater warming to the previous doublings, (depending on their interpretation or dismissal of those temperature figures), they are going to have to explain how they come up with the goal-moving. Either way, they can’t eat their cake and have it. Either CO2 is a powerful atmospheric forcing agent (in which case why hasn’t the temperature gone up for a 41% rise in CO2?) or the global feedback/forcing/natural variability machine is just serenely going about its business keeping the global temperature ‘around about’ the same temperature, as indicated by the longest running dataset in Central England (total warming appx 1 degree in 360 years).

    2. Re your point “That comes with the obvious caveat that a. ultimate temperature change from an immediate CO2 increase takes place over time and b. deriving a temp figure back to 1850s must come with a hefty margin for error.” Ok…

    a. This is just the usual excuse about thermal lag which David and I discussed much earlier in this thread. There is no proof or logic behind this assumption. Any such lag would have been built into the observed data already. For example, if the lag is 15 years, then what caused the current flattening to start 15 years before 1998? if the lag is 3 years, why have we not seen any further warming since 3 years after 1998? If the lag is 50 years, what caused the 1910-1945 warming of 0.7C fifty years before 1910? Ocean heat is the usual response, but then the pro-cAGW commenters have to explain how the global ocean (huge heat capacity) has warmed from the atmosphere (tiny heat capacity) without any corresponding surface warming? If you look at the graphs, the surface warming is almost parallel with the air warming.
    b. As for margin error, you may be correct, or you may not. I suspect that the people recording temperatures back then were dedicated and their instruments were reasonably accurate. When you consider that most global datasets now use some sort of averaging formula, I tend to treat the results of each dataset as being relatively proportional. What I don’t accept is the comparing of different types of datasets, such as proxy with instrument. If the data range is indeed broad, then the 0.8C rise since 1850 seems even more paltry, doesn’t it?

    Regards,

  353. Entropic man says:

    Kristian

    Please accept my sincere apologies, wanted or not.This is more like it.

    Am I right in thinking that you are proposing an increase in surface absorbtion as the warming mechanism, rather than the insulating effect of increased CO2?
    This is the mechanism creating the Urban Heat Island effect.

    With the largest change occuring in the latent heat transfer, an increase in ocean warming due, for example, to reduced Arctic ice cover would induce this effect.

    The higher surface temperature would increase heat transfer to the atmosphere, which would then transfer it into the OLR.

  354. Entropic man says:

    Arfur Bryant

    “logarithmic effect of CO2 absorption.”

    Something we agree on. The warming effect of CO2 varies in proportion to the natural logarithm (log. base e)of the CO2 concentration.

    In one past calculation of this heating effect I did both the simplified linear calculation and the full logarithmic equivalent.

    The logarithmic calculation gave a slightly higher temperature change from 1880 to the present, (280ppm to 390ppm) and a slightly lower temperature change to 560ppm.
    Since the difference only affected the third significant figure I’ve stuck to the linear approximation since.

  355. Entropic man says:

    Nigel Ray

    I remember fen skating on flooded water meadows at Earith that year, with racing on extensive flooded land at Whittlesey and on the Forty Foot drain.
    There was more skateable ice in 1967 and occasionally thereafter. The last time I remember skateable conditions in East Anglia was 1979, the year I married an Irish lass and became a dishonorary Ulsterman.
    My father would have liked to continue skating, but he rarely got the opportunity thereafter. I think the only two real fen skating opportunities were 1996 and 2010.

  356. Nigel Ray says:

    Entropic Man

    You would like the 7.8 km long Rideau Canal
    Skateway, in Ottawa. Some people commute to
    work along it.

  357. Arfur Bryant says:

    Entropic man,

    Thank you for that comment, Entropic.

    Several years back I had a very long debate with a Professor at MIT and this subject was covered in detail. We basically came to the same conclusion that the difference was there, but minor.

    Regards,

  358. David Appell says:

    Arfur Bryant says:
    Lacis himself states the GHE is 33C. If you think you can persuade anyone that it has gone up by 2 whole degrees C in two years, you are deluding your self.
    ==========================================

    Look at their Figure 2, Arthur. Surface temperature is the black curve.

    To me, it looks like it goes from 14 C to -21 C in about 25 years. That’s a change of 35 C.

    How does it look to you?

  359. David Appell says:

    Arfur Bryant says:
    Yes, I know that the relationship is not linear. But my using a linear relationship keeps the point I am making simple.
    =========================

    You are an idiot. You can’t use something that is not true just to keep things “simple.”

    If it’s not true it’s not true. Have you ever done a lick of science in your life??

  360. David Appell says:

    Arfur Bryant says:
    Feedbacks, particularly from water vapour, are totally unproven.
    ===============================

    Fact: Atmospheric water vapor content is up 4% in 30 years.

    Do you not think water vapor is a greenhouse gas?
    If not, then show us why it isn’t a feedback.

    Really, Arthur, you seem willing to deny anything if it keeps you from admitting you are wrong.

  361. Nigel Ray says:

    On Jan 12 I pointed out that David Appell had
    made a rude, ad hominem, remark on Jan 4.
    Above, he has made another, for he called
    someone “an idiot”.

    I suggest we ignore him totally from now on, as
    evidently he cannot control his nastiness.

  362. torontoann says:

    Nigel Ray says

    “…ignore him…”

    Yes. He is incorrigible.

  363. torontoann says:

    Arfur says

    “…feedbacks are totally unproven…”

    They don’t really matter that much for interpreting
    past data. If you should agree, for the sake of argument,
    that the anomalies numbers have “gone up” (whatever
    that really means!) 0.3 C since 1970 and that is “the
    result of” more CO2, then that is the result of the
    extra CO2 AND whatever feedbacks; i.e. you would
    be making the direct CO2 effect less to the extent
    there was effective feedback. So any warming argument,
    as a whole, is not supported less or more by the data
    than before.

    The IPCC in 2007 did not assert a proven feedback
    from water vapor. The relevant sentence in the
    background science specifically said
    “…assuming …an increase of 4% since 1970…”
    would be a way of explaining certain observations.

    A basic theorem in control theory is; for a system
    of any complexity at all, a feedback cannot be said
    to be intrinsically positive or negative. The climate
    system – like ecological webs – is intractable when
    it comes to predicting the ultimate effects of changes.
    More water vapor might mean more clouds and a higher
    albedo. Who can guess?

  364. Kristian says:

    David Appell and torontoann.

    The increased global water vapor content of the lower atmosphere since the 70s is no evidence of a significant positive feedback mechanism to tropospheric warming. It rather confirms that evaporation from the global sea surface has increased as a response to warming SSTs. Evaporation (latent heat transfer) works as the ocean’s primary heat loss mechanism and is a negative feedback to raised surface temperatures, not a positive feedback to raised tropospheric temperatures. People have got this all turned on its head. The latent heat transfer is in the end (when the water vapor eventually condenses) what causes the troposphere to warm in the first place, as a response to what happens at the surface – that is, solar heating.

    http://klimaforskning.com/forum/index.php/topic,1148.msg21544.html#msg21544

    Increased evaporation during warming: Not evidence of an atmospheric driver – evidence of a SOLAR driver. The atmosphere cannot allow the total energy loss from the surface of the Earth to increase beyond the original level if it is to promote warming/accumulation of absorbed energy.

  365. torontoann says:

    Kristian says,

    a number of things.

    There are indeed many processes. The interactions
    of them is a reason why any short term analysis of
    the dynamics may be fruitless.

  366. anthony beevor says:

    torontoann says

    “…interactions…”

    The following passage from W Ross Ashby’s “Introduction
    to Cybernetics” , 1957, is interesting in this regard:

    “The concept of “feedback”, so simple and natural in
    certain elementary cases, becomes artificial and of
    little use when the interconnexions between the parts
    become more complex. When there are only two parts
    joined so that each affects the other, the properties
    of the feedback give important and useful information
    about the properties of the whole. But when the parts
    rise to even as few as four, if every one affects the
    other three, then twenty circuits can be traced through
    them, and knowing the peoperties of all the twenty
    does NOT give complete information about the system.
    Such complex systems cannot be treated as an interlaced
    set of more or less independent feedback circuits, but
    only as a whole.”

  367. anthony beevor says:

    “Properties” meant, not “peoperties.”

  368. Entropic man says:

    I happened upon these graphs today.

    http://sealevel.colorado.edu/

    The temporary pause in sea level rise in 2010 has passed, and the ensuing rapid rise has restored the original trend.
    I wonder if the pause in global average temperature rise will go the same way?

  369. Entropic man says:

    kristian

    Your link discusses the patterns expected from different types of forcing.

    Examine tis graph, the GISS temperature record. Note the 11 year periodicity in the 5 year average, showing most clearly from 1950 on.The amplitude of this oscillation is a fairly consistent 0.1C.

    http://data.giss.nasa.gov/gistemp/graphs_v3/Fig.A2.gif

    Now examine these graphs, showing the peaks of 20th century solar cycles. The temperature peaks match the solar cycle peaks. That is your solar forcing, a fast forcing as described at klimatforskning.

    http://www.google.co.uk/imgres?imgurl=http://www.ucar.edu/news/releases/2006/images/figpredic24-1.jpg&imgrefurl=http://www.ucar.edu/news/releases/2006/sunspot.shtml&h=551&w=534&sz=102&tbnid=5tVr0eNVX0wwHM:&tbnh=86&tbnw=83&prev=/search%3Fq%3Dsolar%2Bcycle%2Bgraph%26tbm%3Disch%26tbo%3Du&zoom=1&q=solar+cycle+graph&usg=__GRhdpBssIrCLYwDB40VHvQ1hrL4=&docid=jXNNDPwqTi9zeM&sa=X&ei=m3X4UJ3uKqaZ0QXE6oDoDw&ved=0CDsQ9QEwAw&dur=1235

    Examine the GISS graph again. This time look at the long term trend. There is steady long term temperature increase, especially from 1960. This is the second forcing. There is no equivalent increase in any of the possible forcing effects to match, except CO2 concentration and its fellow proxies for industrial activity. This is a slow forcing as described at klimatforskning.

  370. Arfur Bryant says:

    David Appell says:
    January 16, 2013 at 10:03 PM

    [“To me, it looks like it goes from 14 C to -21 C in about 25 years. That’s a change of 35 C.

    David, there you go with an assumption again…

    While you are subjectively interpreting their graph, this is what they actually say:

    [“The difference between the nominal global mean surface temperature (TS = 288 K) and the global mean effective temperature (TE = 255 K) is a common measure of the terrestrial green- house effect (GT = TS – TE = 33 K)”]

    So it doesn’t really matter what it looks like to me or to you, does it?

    I keep telling you to be objective. It is because pro-cAGW commenters like yourself keep arguing from assumptions that you keep having to dig yourselves out of your own holes.

    You must be the only person – warmist or otherwise – who thinks the radiative GHE is 35 degrees, not 33.

    Pathetic.

  371. Arfur Bryant says:

    David Appell says:
    January 16, 2013 at 10:06 PM

    Fatuous handwaving. You have no coherent argument. Do the math like I said. Even if you assume ALL of the 0.8C warming since 1850 is due to a 40% rise in CO2 (which would be a blatantly wrong assumption), what would be the CS for a doubling of CO2 using the logarithmic effect?

    As for the ad hominem, thanks. Coming from you I’ll take it as a compliment.

    So far, your ‘science’ arguments have all revolved around models and peer-review. Best of luck with those…

  372. Arfur Bryant says:

    David Appell says:
    January 16, 2013 at 10:22 PM

    [“Fact: Atmospheric water vapor content is up 4% in 30 years.

    Do you not think water vapor is a greenhouse gas?
    If not, then show us why it isn’t a feedback.”]

    LOL! You want me to prove fairies don’t exist? Your risible response comes nowhere near proving the concept of feedback from a CO2 increase.

    Pathetic, again.

  373. Arfur Bryant says:

    David Appell and all…

    The ‘problem’ with pro-cAGW commenters’ use of feedback as a specious and tangential ‘assist’ to their theory (CO2 = cAGW) is that the observed data includes ALL forcings and ALL feedbacks (if they exist at all).

    This means that the 0.8C rise since 1850 is all-encompassing. David Appell and others want to use the ‘thermal inertia lag’ to excuse the lack of warming since around 1998 but these various forcings and feedbacks have been in play throughout that period. The 0.8C rise is what it is! (It’s what it says on the tin!)

    Nobody can say how much of the 0.8C is due to CO2, just as nobody can say it is all entirely due to natural factors. I’ve said this up-thread.

    Just as today’s climate modellers cannot model the complexities of the atmosphere without making assumptions, neither can they prove ‘feedbacks’ without making assumptions.

    I agree with torontoann, Kristian and anthony beevor about the complexity around feedbacks and maintain that, whatever the intrinsic nature of each feedback, the overall effect has so far been observed to be far less than that predicted by the cAGW theory, and may even be zero or negative.

    I will be offline for a day or two…

  374. Entropic man says:

    Kristian

    Is this the sort of mechanism you are looking for to decrease surface albedo?

    http://www.bbc.co.uk/news/science-environment-21033078

    http://onlinelibrary.wiley.com/doi/10.1002/jgrd.50171/pdf

  375. anthony beevor says:

    The Australian Government’s official climate-change
    website has the following, bald, statement.

    “ALL [my emphasis] climate models incorporate
    [a 50%] water vapour feedback in their climate
    simulations.”

    Obviously “50%” is really just back-of-the-envelope stuff. But I suggest we embrace it AMUSEDLY, because it is PEANUTS as feedbacks go.

  376. Doug Cotton says:


    Long term climate predictions are certainly possible because the trends shown in this plot appear to be continuing quite well and allowed me to make predictions of 2011 and 2012 being cooler than 2010.

    Read carefully what the plot is all about – basically first and second derivatives of a curved function …

    http://img845.imageshack.us/img845/9686/appendix60yearcycle.jpg

  377. Doug Cotton says:

    Feedback from water vapour is negative for reasons given in my paper “Planetary Surface Temperatures. A Discussion of Alternative Mechanisms” – basically the wet adiabatic lapse rate means the intercept with the surface is at a lower temperature.

  378. anthony beevor says:

    Doug Cotton:

    links to a piece which is essentially about a
    possible, persistent, sixty-year cycle of climate
    acting within or helping to define a thousand-year
    cycle.

    Of course, the whole ocean can come into some sort
    of heat-balance* with the rest of the earth over a
    period of one thousand years (because the ocean turns
    over and mixes in about six hundred years**), while
    it cannot do this fully over sixty years.

    * It takes four thousand times as much heat to uniformly
    warm the ocean by 1 C as it does to uniformly warm the atmosphere by 1 C.

    ** A suggestion was made, by Manabe and Stoufer, that
    this thermo-haline circulation might stop at some point, because of CO2-induced warming. But they calculated
    that a quadrupling of CO2 might cause that. So, a bit
    remote from present conditions.

  379. Doug Cotton says:

    Anthony, I agree that the ocean provides a “stabilising effect” and in fact the far greater amount of energy in the core, mantle and crust does also. For any long-term significant rise in surface temperature, the whole conduction plot from the core to the surface would have to rise at the surface end, and that would take orders of magnitude more energy than is in the oceans. That’s the physics of conduction.

    However, the atmosphere can rise and fall in temperature within a degree or so over the course of the sixty year cycle, without having to raise or lower the temperature of all the ocean waters. We don’t measure climate down in the depths of the ocean. We measure it 1.5 to 2 metres up into the atmosphere.

    The plot I linked to makes it blatantly obvious that there is a 60 year cycle, and there is plenty of other statistically significant proof, as Dr Nicola Scafetta has documented.

    That is why we are now experiencing slight cooling, which will continue until about 2028, as I documented in an archived “forecast” in August 2011.

    That is why any near linear, ever increasing climate projection (IPCC style) is garbage. Those curved trends Roy used to publish are not meaningless.

  380. Doug Cotton says:

    PS: Show me the calculations re that 4,000 times. I agree the specific heat is about 4 times that of the atmosphere, but I’ve also seen other estimates that energy is split about 4% atmosphere, 6% land and 90% ocean. Maybe these estimates were wrong, I don’t know, but they seem reasonable. I’m genuinely interested in your calculations, because mine would be only about 100 times based on the above.

  381. anthony beevor says:

    I miscalculated the relative mass of the atmosphere
    and the hydrosphere. The mass of the atmosphere is
    about 5 x 10^21 grams and the mass of the hydrosphere
    is about 1.4 x 10^24 grams. So the hydrosphere is
    about 360 times as massive as the atmosphere. Since
    the specific heat of water is roughly 4.2 times that
    of air, the heat capacity of the hydrosphere is

    4.2 x 360 = 1,500 times that of the atmosphere.

    I, also, have seen respectable estimates that 90% of
    recent “excess heat” has gone into the ocean. It
    seems to me that it would only be natural for a
    still larger percentage to end up sequestered in
    bottom water within a few hundred years. Naturally,
    the idea that this energy is only temporarily stored,
    and is waiting to “leap out” and melt us is risible.

    Of course, the rocks of the earth are immensely more
    massive than even the ocean, but it is hard to decide
    whether this matters much as a sink for surface heating.
    Heat mainly spreads down from the surface by conduction,
    and this is extremely slow. In boreholes, one can find
    the faint trace of events such as the Middle Ages Optimum, but after eight hundred years the effect has only gone down
    about three hundred meters – and shows up as an anomaly of
    just 0.1 C. In other words the absorbed heat from a warm
    episode of a couple of hundred years, of about + 2 C in
    the European atmosphere, was pretty small.

  382. anthony beevor says:

    Once, as part of a botany course I actually did
    some bore experiments on heat in soil. Near the
    surface, heat flow direction reverses between day
    and night. And between seasons. The diurnal
    effect is barely visible one meter down and the
    annual effect at ten meters. Heat conduction is
    faster where there is moisture in the pores.
    Once you get below the ground water, therefore,
    the rate of diffusion decreases markedly.

    If you go down far enough, you meet with increasing
    temperatures,of course,as in South African gold mines.
    But this flow from the interior of the earth works on
    a scale of millions of years.

  383. anthony beevor says:

    There is a further interesting fact about
    the Thermo-Haline circulation. Because of
    the present arrangement of Continents and
    Ocean Basins (an arrangement which is, clearly,
    merely an accidental result of history), the
    Northern Hemisphere at 60 N and towards
    the North Pole, is 6 Degrees C warmer than
    the Southern Hemisphere at 60 S and towards
    the South Pole.

    Two thoughts occur. Firstly, some melting
    around the North Pole should not mean that
    “the SAME is ‘imminent’ in the South Polar
    region.” Second, why should we imagine
    that a worldwide anomaly of a few tenths of
    a Degree C “matters”, when an existing
    difference as large as 6 Degrees C between
    Hemispheres does not seem disastrous to life.

  384. DJ. Cotton says:

    Anthony Thanks for the calculations. Yes good point regarding NH and SH – more land in the NH is the reason. Basically the heat capacity of the surface cannot be defined, because we don’t know how far down we should consider as “land surface.” But I think the ratio of ocean : land heat capacity is certainly more than 90% : 10%, so sea surface temperatures should be weighted at least this much, not around 70% : 30%.

  385. MikeN says:

    Any comment on GISS’s latest update. It appears they have warmed the whole planet up by .02-.03C without explanation. The baseline is reported the same 1951-1980 14.0C but at least the last 15 years have warmed over the numbers they showed last month.

  386. Entropic man says:

    Mike N

    “Any comment on GISS’s latest update. It appears they have warmed the whole planet up by .02-.03C without explanation.”

    All the groups calculating long term temperature averages fine tune theri data calculations, trying to iron out uncertainties and systemic errors in their data and get their averages, which are samples of a larger system, as close as possible to what actually happened.
    Even Dr. Spencer adjusts his UAH figures as he thinks necessary.

  387. MikeN says:

    Fine tune? That is a wholesale update without explanation. They did a major change some time back to get to version 3.

  388. Doug Cotton says:

    MikeN

    I’m genuinely interested in the point you make but would like to be sure of the facts. I know John O’Sullivan (CEO at Principia Scientific International) is interested too, so maybe you might consider joining PSI and then writing an article with him which could be read by tens of thousands on the PSI website and elsewhere.

  389. Arfur Bryant says:

    MikeN,

    The GISS Version 2 (GHCNv2, to 2011) and Version 3 data are here:

    http://data.giss.nasa.gov/gistemp/tabledata_v2/GLB.Ts+dSST.txt

    and

    http://data.giss.nasa.gov/gistemp/tabledata_v3/GLB.Ts+dSST.txt

    There is a discussion about the change here:

    http://climateaudit.org/2008/04/06/rewriting-history-time-and-time-again/

    Hope this helps.

    Regards,

  390. MikeN says:

    Doug Cotton, I don’t have a point beyond noticing a somewhat substantial warming of .03C of the 90s and 00s while cooling the 40s and 30s by the same amount..

  391. Entropic man says:

    MikeN

    During WW2 British and US ships used different techniques to take water temperature readings.
    The Royal Navy used a standard canvas bucket. Wind and evaporation caused the water to cool slightly and temperatures to be underread.

    The US Navy took the temperature in the cooling water inlet, warmed by the engine room and overreading slightly.
    This was worked out quite recently and may be the reason for the GISS cooling correction for the 30s and 40s.

    http://blogs.nature.com/climatefeedback/2008/05/postworld_war_ii_cooling_a_mir.html

  392. MikeN says:

    Thanks for the links.

    I can’t find a GISS sea only measurement, but the land only numbers have cooled even more than the sea for the 20s & 30s.

    -8 -13 -18 -14 -16 5 -7 -4 -23 -5 0 -2 -17 0 -13 -4 6 12 -6 10
    -16 -21 -25 -22 -25 -4 -18 -14 -34 -17 -10 -13 -28 -12 -24 -11 -1 5 -13 6

    Anyone else having trouble with reply on this blog?

  393. Lonnie E. Schubert says:

    Dear Dr. Spencer,

    What is the global mean temperature of your data set? What is the temperature corresponding to zero on your graph of the departure?

    I’m sure I can find it published somewhere, but I don’t see it here on your site.

    Thanks.

  394. Arfur Bryant says:

    MikeN,

    I can’t be absolutely sure, but I have a feeling GISS uses the following Met Office dataset for its ocean data. This is what NCDC uses, and I think GISS uses the same. Not sure though. The GISS server is having problems.

    http://www.metoffice.gov.uk/hadobs/mohsst/

    Replies from Dr Spencer here are very sporadic.

    Regards,

  395. MikeN says:

    What I meant is that when I click Reply I am never able to post. I can only do a fresh comment.

  396. David Appell says:

    Doug Cotton says:
    January 19, 2013 at 4:41 AM
    Feedback from water vapour is negative for reasons given in my paper “Planetary Surface Temperatures. A Discussion of Alternative Mechanisms”
    ———————————-
    This isn’t a “paper” until you submit it to a real journal.

    Until then it’s just something you typed up.

  397. David Appell says:

    Arfur Bryant says:
    January 17, 2013 at 5:04 PM
    David Appell says:
    January 16, 2013 at 10:03 PM

    [“To me, it looks like it goes from 14 C to -21 C in about 25 years. That’s a change of 35 C.

    David, there you go with an assumption again…

    While you are subjectively interpreting their graph,
    ———————————————————

    I am simply reading numbers from the graph’s coordinates.

    How do you read them?

  398. Arfur Bryant says:

    David Appell,

    Are you serious?

    You leave the thread for ten days and come back to re-iterate a nonsensical argument which I have already responded to!

    See my post at: January 17, 2013 at 5:04 PM

    It says it all.

    You are making a subjective interpretation of a time-series MODEL graph to prove your point that the GHE is – according to you and only you as far as I can make out – 35 deg C. Whereas I am giving you what the authors of the paper (same paper!) actually state!

    Here it is again:
    [“The difference between the nominal global mean surface temperature (TS = 288 K) and the global mean effective temperature (TE = 255 K) is a common measure of the terrestrial green- house effect (GT = TS – TE = 33 K).”]

    That is what Lacis actually says, so you can stop with the nonsense of what you think he says following your interpretation of a model! Sheesh…

    Be objective! Your argument is a ridiculous attempt at deflection.

  399. Entropic man says:

    Lonnie E. Schubert

    “What is the global mean temperature of your data set? What is the temperature corresponding to zero on your graph of the departure?”

    Hadcrut4 gives a mean anomaly for 1998 of 0.52, on a baseline average of 14.0C.

    Dr Spencer’s data give an anomaly of 0.409C for the same year, suggesting that his baseline is 13.9C.

    Treat this as an estimate. The two sets of data may use differnt years when calculating the baseline average. The satellite data may also give different annual means from a data set including measurements taken at ground level and directly from the sea.

  400. Lonnie E. Schubert says:

    Thanks Entropic man, but I’m hoping to know what the satellites measure for the global arithmetic mean of the temperature. References to other data sets seem irrelevant.

  401. Entropic man says:

    Lonnie E. Schubert

    All the different datasets express their temperatures as anomalies. These are the difference between the average for a particular year and a baseline temperature,0 on their graphs.

    The baseline is usually the average of a number of years in the latter 20th century. Thus Hadcrut use, I think, the average of the temperatures from 1950-1979, with an average of 14.0C

    Since my last post I have found that the baseline years for UAH are 1981 to 2010.

    If you want to know the actual average temperatures recorded, add or subtract the anomaly temperature from the baseline temperature. Thus 1998 on Dr. Spencer’s record wuold be 13.9 + 0.42 = 14.32C.

    Lacking a source for Dr. Spencer’s baseline I used the difference between his data and Hadctut’s to make an estimate.If you find the actual baseline temperature, please post it.

  402. Doug Cotton says:


    AN OPEN PUBLIC CHALLENGE TO DAVID APPELL


    David Appell

    “This isn’t a paper” – That’s why “Planetary Surface Temperatures … ” is still on the PROM menu at Principia Scientific International – Peer Review in Open Media – and I’m genuinely interested to see if anyone in the world has a valid counter argument. So, yes, it’s still subjected to world-wide open peer-review, and you are welcome to submit an attempted rebuttal. To date (since late November) no one has submitted a valid rebuttal, so be the first and it will be considered and discussed with you by several team members at PSI.

    You may do well to remember that it is a review type paper, merely reviewing work by other scientists and bringing it all together. I seek no credit for being the first to raise the issue of gravity induced thermal gradients nor to have done the 21st century experiments which prove that such occur. Loschmidt proposed the hypothesis in the 19th century, and I have rebutted every attempt (of which I am aware) to prove him wrong. Now we have the empirical evidence that shows he was right, so if you want to set up experiments to prove these experiments wrong, go to.

    And if you think the Second Law of Thermodynamics could be broken with an atmosphere which, according to the IPCC and Roy Spencer, would have been isothermal without water vapour and CO2 etc, then go to and prove the Second Law is wrong. That should be worth a Nobel Prize. Just don’t forget that the required thermodynamic equilibrium has to be the state of maximum available entropy.

    I’m still waiting for your own personal explanation as to how the poles of Venus get so hot when less than 1W/m^2 of direct Solar insolation gets to them.

    Finally, if you think you can prove that water vapour actually makes the gradient (AKA wet adiabatic lapse rate) steeper than the dry rate, then go to and prove the climatologists all wrong.

    In the meantime, your comments here are not peer-reviewed either and, as they show no evidence of a clear understanding of atmospheric physics, I suggest you get a physicist to read anything you propose using in an attempt to rebut the standard physics I have used. Otherwise, I’ll pull apart every incorrect statement you make, backed up with documentation of the physics involved, pinpointing precisely where the flaws in your “argument” lie.

    So, yes, I’m throwing down the gauntlet to you, David Appell. Silent readers will no doubt be watching for the fun.

  403. Entropic man says:

    Doug Cotton

    AN OPEN PUBLIC CHALLENGE TO DAVID APPELL

    Not again, please!

    We’ve aleeady been through this once.You lost.

    If we have to go through it all again I may lose the will to live.

  404. Doug Cotton says:

    I can see you are not capable of even pointing to where and why you happen to think I “lost” Entropic let alone using physics to prove that Roy’s point (6) about an isothermal atmosphere somehow is in fact (or so you think) a thermodynamic equilibrium state of maximum entropy, thus in keeping with the requirements of the Second Law of Thermodynamics.

  405. I think this is one of the most significant info for me. And i am satisfied studying your article. However should commentary on some common issues, The site style is ideal, the articles is in point of fact excellent : D. Good process, cheers

  406. I’m really loving the theme/design of your site. Do you ever run into any
    browser compatibility problems? A handful of my blog audience have complained about my blog not working correctly in Explorer but looks great in Chrome.

    Do you have any suggestions to help fix this problem?

  407. mamaligadoc says:

    With respect !!!

  408. Yemen Trks says:

    I every time spent my half an hour to read this
    web site’s articles or reviews everyday along with a cup of coffee.

Leave a Reply to Entropic man