UAH Global Temperature Update for January, 2013: +0.51 deg. C

February 5th, 2013 by Roy W. Spencer, Ph. D.

Our Version 5.5 global average lower tropospheric temperature (LT) anomaly for January, 2013 is +0.51 deg. C, a substantial increase from December’s +0.20 deg. C. (click for large version):
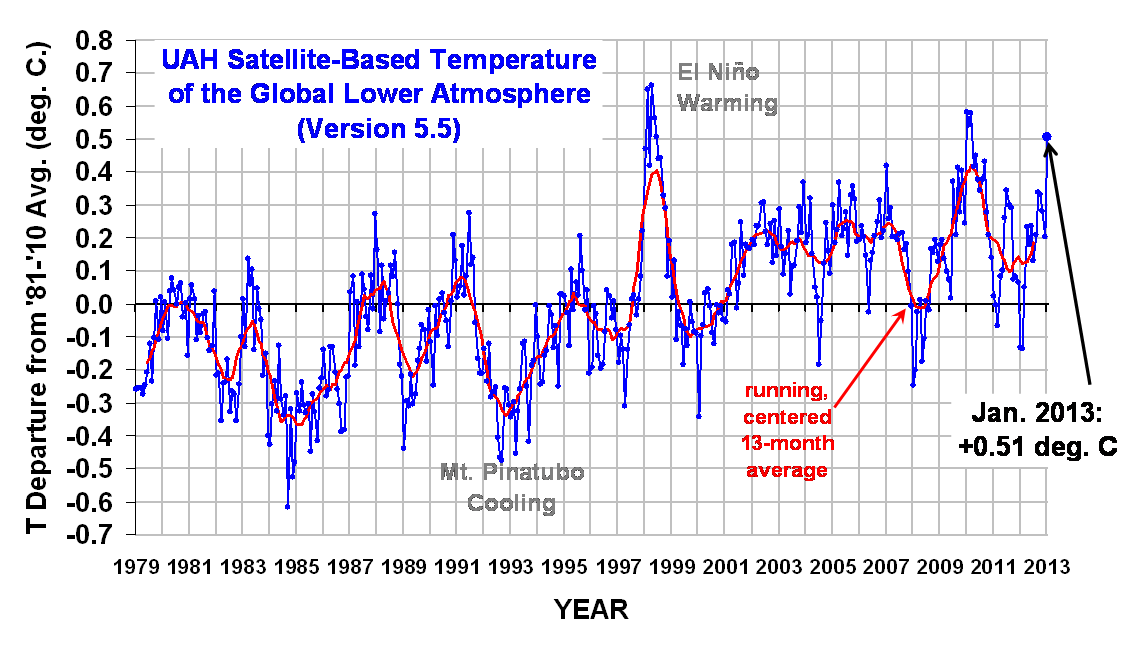
The global, hemispheric, and tropical LT anomalies from the 30-year (1981-2010) average for the last 13 months are:

YR MON GLOBAL NH SH TROPICS
2012 1 -0.134 -0.065 -0.203 -0.256
2012 2 -0.135 +0.018 -0.289 -0.320
2012 3 +0.051 +0.119 -0.017 -0.238
2012 4 +0.232 +0.351 +0.114 -0.242
2012 5 +0.179 +0.337 +0.021 -0.098
2012 6 +0.235 +0.370 +0.101 -0.019
2012 7 +0.130 +0.256 +0.003 +0.142
2012 8 +0.208 +0.214 +0.202 +0.062
2012 9 +0.339 +0.350 +0.327 +0.153
2012 10 +0.333 +0.306 +0.361 +0.109
2012 11 +0.282 +0.299 +0.265 +0.172
2012 12 +0.206 +0.148 +0.264 +0.138
2013 1 +0.506 +0.553 +0.459 +0.375

Due to the rather large 1-month increase in the temperature anomaly, I double checked the computations, and found that multiple satellites (NOAA-15, NOAA-18, and Aqua) all saw approximately equal levels of warming versus a year ago (January, 2012), so for now I’m accepting the results as real. The most common cause of such warm spikes (when there is no El Nino to blame) is a temporary increase in convective heat transfer from the ocean to the atmosphere. This would suggest that the global average sea surface temperature anomaly might have actually cooled in January, but I have not checked to see if that is the case.

Archived color maps of local temperature anomalies will be updated shortly are available on-line at http://nsstc.uah.edu/climate/;

The processed temperature data (updated shortly) is available on-line at http://vortex.nsstc.uah.edu/data/msu/t2lt/uahncdc.lt


44 Responses to “UAH Global Temperature Update for January, 2013: +0.51 deg. C”

Toggle Trackbacks

  1. Werner Brozek says:

    How 2012 Ended on Six Data Sets

    Note the bolded numbers for each data set where the lower bolded number is the highest anomaly recorded in 2012 and the higher one is the all time record so far.

    With the UAH anomaly for December at 0.202, the average for 2012 is (-0.134 -0.135 + 0.051 + 0.232 + 0.179 + 0.235 + 0.130 + 0.208 + 0.339 + 0.333 + 0.281 + 0.202)/12 = 0.161. This would rank 9th. 1998 was the warmest at 0.42. The highest ever monthly anomaly was in April of 1998 when it reached 0.66. The anomaly in 2011 was 0.132 and it came in 10th.

    With the GISS anomaly for December at 0.44, the average for 2012 is (0.36 + 0.39 + 0.49 + 0.60 + 0.70 + 0.59 + 0.51 + 0.57 + 0.66 + 0.70 + 0.68 + 0.44)/12 = 0.56. This would rank 9th. 2010 was the warmest at 0.66. The highest ever monthly anomaly was in January of 2007 when it reached 0.93. The anomaly in 2011 was 0.54 and it came in 10th.

    With the Hadcrut3 anomaly for December at 0.233, the average for 2012 is (0.206 + 0.186 + 0.290 + 0.499 + 0.483 + 0.482 + 0.445 + 0.513 + 0.514 + 0.499 + 0.482 + 0.233)/12 = 0.403. This would rank 10th. 1998 was the warmest at 0.548. The highest ever monthly anomaly was in February of 1998 when it reached 0.756. One has to back to the 1940s to find the previous time that a Hadcrut3 record was not beaten in 10 years or less. The anomaly in 2011 was 0.340 and it came in 13th.

    With the sea surface anomaly for December at 0.342, the average for the year is (0.203 + 0.230 + 0.241 + 0.292 + 0.339 + 0.352 + 0.385 + 0.440 + 0.449 + 0.432 + 0.399 + 0.342)/12 = 0.342. This would rank 8th. 1998 was the warmest at 0.451. The highest ever monthly anomaly was in August of 1998 when it reached 0.555. The anomaly in 2011 was 0.273 and it came in 13th.

    With the RSS anomaly for December at 0.101, the average for the year is (-0.060 -0.123 + 0.071 + 0.330 + 0.231 + 0.337 + 0.290 + 0.255 + 0.383 + 0.294 + 0.195 + 0.101)/12 = 0.192. This would rank 11th. 1998 was the warmest at 0.55. The highest ever monthly anomaly was in April of 1998 when it reached 0.857. The anomaly in 2011 was 0.147 and it came in 13th.

    With the Hadcrut4 anomaly for December at 0.269, the average for 2012 is (0.288 + 0.208 + 0.339 + 0.525 + 0.531 + 0.506 + 0.470 + 0.532 + 0.515 + 0.524 + 0.512 + 0.269)/12 = 0.436. This would rank 10th. 2010 was the warmest at 0.54. The highest ever monthly anomaly was in January of 2007 when it reached 0.818. The anomaly in 2011 was 0.399 and it came in 13th.

    If you would like to see the above month to month changes illustrated graphically, see:
    http://www.woodfortrees.org/plot/wti/from:2012/plot/gistemp/from:2012/plot/uah/from:2012/plot/rss/from:2012/plot/hadsst2gl/from:2012/plot/hadcrut4gl/from:2012/plot/hadcrut3gl/from:2012

    On all data sets, the different times for a slope that is at least very slightly negative ranges from 8 years and 3 months to 16 years and 1 month.

    1. UAH: since October 2004 or 8 years, 3 months (goes to December)
    2. GISS: since May 2001 or 11 years, 7 months (goes to November)
    3. Combination of 4 global temperatures: since November 2000 or 12 years, 2 months (goes to December) (Needs to be confirmed)
    4. HadCrut3: since April 1997 or 15 years, 9 months (goes to December) (Needs to be confirmed)
    5. Sea surface temperatures: since March 1997 or 15 years, 10 months (goes to December)
    6. RSS: since December 1996 or 16 years, 1 month (goes to December)
    RSS is 193/204 or 94.6% of the way to Santer’s 17 years.
    7. Hadcrut4: since November 2000 or 12 years, 2 months (goes to December.)

    See the graph below to show it all.

    http://www.woodfortrees.org/plot/hadcrut3gl/from:1997.25/trend/plot/gistemp/from:2001.33/trend/plot/rss/from:1996.9/trend/plot/wti/from:2000.9/trend/plot/hadsst2gl/from:1997.1/trend/plot/hadcrut4gl/from:2000.8/trend/plot/uah/from:2004.75/trend

    This analysis indicates for how long there has not been significant warming at the 95% level on various data sets.
    For RSS the warming is NOT significant for over 23 years.
    For RSS: +0.126 +/-0.136 C/decade at the two sigma level from 1990
    For UAH, the warming is NOT significant for over 19 years.
    For UAH: 0.143 +/- 0.173 C/decade at the two sigma level from 1994
    For Hacrut3, the warming is NOT significant for over 19 years.
    For Hadcrut3: 0.098 +/- 0.113 C/decade at the two sigma level from 1994
    For Hacrut4, the warming is NOT significant for over 18 years.
    For Hadcrut4: 0.098 +/- 0.111 C/decade at the two sigma level from 1995
    For GISS, the warming is NOT significant for over 17 years.
    For GISS: 0.116 +/- 0.122 C/decade at the two sigma level from 1996
    (If you want to know the times to the nearest month that the warming is not significant for each set, they are as follows: RSS since September 1989; UAH since April 1993; Hadcrut3 since September 1993; Hadcrut4 since August 1994; GISS since October 1995 and NOAA since June 1994.)

  2. Werner Brozek says:

    The latest on six different data sets.

    Since it is February, I will do things a bit differently than the rest of the year. I will give the latest anomaly I have and indicate its relative ranking if that anomaly were to stay that way for all of 2013. (Of course it won’t.)

    The UAH anomaly for January was 0.51. This would rank 1st. (1998 was the warmest at 0.42. The highest ever monthly anomaly was in April of 1998 when it reached 0.66.

    The GISS anomaly for December was 0.44. This would rank 15th.

    The Hadcrut3 anomaly for December was 0.233, This would rank 19th.

    The sea surface anomaly for December was 0.342. This would rank 8th.

    The RSS anomaly for December was 0.101. This would rank 16th.

    The Hadcrut4 anomaly for December was 0.269. This would rank 19th.

  3. Climate Weenie says:

    When should we look for version 6?

    I note that for the MSU era, UAH is in line with the menagerie of other global t measures.

    But since 1995 and since 2001, UAH LT is the high outlier.

    Consistency remains the hobgoblin, but I am curious if version 6 puts UAH back in the pack.

  4. Daniel Reppion says:

    The link to the processed data doesn’t seem to work. ðŸ™

  5. Brian D says:

    In regards to SST anomalies, Tisdale is showing a drop in global SST’s from the prelim data (-0.066C).

    http://bobtisdale.wordpress.com/2013/01/28/preliminary-january-2013-sea-surface-temperature-anomaly-update/#more-3025

  6. Brendon says:

    I’m confused, people said the warming had stopped. What’s Up With That?

    • Sun Spot says:

      @Brendon says: February 5, 2013 at 5:06 PM
      I’m confused, people said the warming had stopped. What’s Up With That?

      Brendon you do seem confused as to what people are saying ! What people are saying is warming is continuing at the same rate as always since the end of the little ice age (LIA) and modeled accelerated warming due to hypothetical positive feedback from CO2’s influence is NOT happening !! That’s watts up with that.

  7. crandles says:

    SST from ESRL:

    Year ………… Jan ….. Dec
    1981-2010 average 13.01 …. 13.20
    2012 ………………….. 12.271
    2013 ………… 13.191
    2012 anomaly …………… +0.07
    2013 anomaly …. +0.18

    So an increase in SST anomaly.

    Perhaps Dr Spencer intended ocean heat content rather than SST? (I haven’t looked at this. Just wondering if perhaps when ocean heat comes to the surface and warms the atmosphere, some of that extra heat remains in the SST so atmosphere and SST look high but ocean heat content falls?)

  8. John Williams says:

    Brendon, perhaps you missed this in such a confused state:

    “The most common cause of such warm spikes (when there is no El Nino to blame) is a temporary increase in convective heat transfer from the ocean to the atmosphere. This would suggest that the global average sea surface temperature anomaly might have actually cooled in January, but I have not checked to see if that is the case.”

    http://bobtisdale.files.wordpress.com/2013/01/preliminary-global.png

  9. Werner Brozek says:

    Update.

    RSS just came out with their anomaly for January and they also showed a huge jump from December. It went from 0.101 to 0.442. At 0.442, this would be the third hottest year if it stayed this way.

    (As I said before, the UAH anomaly for January at 0.51 would rank first.)

    I must confess that I find this very surprising since the ENSO meter dropped during January and it now at -0.49. But as was noted, there are other factors involved.

    • JCH says:

      I’ve been expecting it.

    • john parsons says:

      Having watched your predictions for the last year and a half, I can imagine that you are very surprised ideed. I’ve also wondered why you place such significance on weather data rather than climate data. You, more than most, should understand that datasets with timeframes of less than thirty years say nothing about climate. By definition. JP

  10. Brendon says:

    @John Williams, did they not happen in the 80’s?

  11. Alex Harvey says:

    Dear Roy,

    To what extent is this jump localised to the southern hemisphere where the heatwaves have been seen all over Australia?

    Kind regards,
    Alex Harvey

    • Truthseeker says:

      Alex,

      As someone who has lived in Australia all my life and more than half a century, there has not been “heatwaves … seen all over Australia”. There have been a few hot days but the summer itself has been a mild one just like the last few years. I can remember the “long hot summer” being weeks of 30C+ days, broken up by afternoon thunderstorms. This year and recent years we are lucky to get 3 days of sunny weather in a row.

      The reality is that we have had a few hot days that were turned into heat waves by hyperbole rather than observations.

  12. Daniel Reppion says:

    We had a few VERY hot days – 42°C in Hobart wasn’t normal (nor was the bushfires that followed, I was born in Tassy) . You might view it as hyperbolic, but Australia’s record nationwide average for a daily maximum was broken on Jan 7th (40.3°C). Not only that, but sequential records were also broken for nationwide maximum averages at the start of January, 7 straight days being over 39°C degrees, 11 straight over 38°C, which is substantially above your 30°C. Individually central Australia saw periods above 40° lasting 2 to 3 weeks, Birdsville recorded more than 30 days above the mark (another record).

    This was a very widespread event which lead to a record January across the country. You can choose to see as much or as little significance as you like, but the observations run counter to your claim.

    http://www.bom.gov.au/climate/current/statements/scs43e.pdf

  13. Thanks, Dr. Spencer.
    I have updated my Web pages with your latest graph.

  14. Nigel Harris says:

    Roy’s figures seem to imply that the increase happened much more strongly in the Northern Hemisphere than down south. Australia was very hot, but it is only 1.5% of the globe, after all.

  15. Werner Brozek says:

    “You, more than most, should understand that datasets with timeframes of less than thirty years say nothing about climate.”

    On the other hand, NOAA says:
    ”The simulations rule out (at the 95% level) zero trends for intervals of 15 yr or more, suggesting that an observed absence of warming of this duration is needed to create a discrepancy with the expected present-day warming rate.”
    To verify this for yourself, see page 23 at:
    http://www1.ncdc.noaa.gov/pub/data/cmb/bams-sotc/climate-assessment-2008-lo-rez.pdf

    • john parsons says:

      Werner, the quote you linked to is a description of what one of ten models ‘suggests’ may be the minimum length of time where that model might show a discrepancy with other models. It is not an attempt to change the definition of the word climate. You can spin it any way you like, but climate is long term weather, universally accepted as being a minimum of thirty years.

      A much less obscure NOAA quote can be found on their outreach site, where you’ll find their Glossary of Terms: “Climate – The average of weather over at least a 30-year period.”

      Nice try. JP

  16. John Owens says:

    I have been reading the blogs and I don’t find any speculation on the cause of the higher temperatures other than some comments on increased water vapor and wind flows. I think that this is a unique event that should be investigated further. The reasons that I say this are: The largest temperature increase was in the Northern Hemisphere during winter and during the period of minimum sunlight. The Arctic Circle received practically no sunlight during this time. Any increase in temperature was not due to Solar heating – TSI. The Antarctic showed heating while the Tropics showed minimum heating. The event appeared to be global. The most likely cause for a global effect would be an increase in cloud cover. The effects on the polar regions would indicate some type of magnetic influence. During the 6 days of Jan 10 to Jan 15 the Sun became active, 53 class C flares and 4 class M flares, and sent a quantity of ionizing radiation and particles to Earth. I do not know what resources could determine if the activity of the Sun caused additional clouds to form by providing nuclei for condensation. There has been considerable discussion about cosmic rays providing such nuclei;but,I don’t seen any reason that the Sun could not do the same thing.

  17. Jiri Salek says:

    Is there any reason why January 2013 temperature anomalies are so symmetrical in North and South hemisphere? I haven’t done any extensive research but it looks like the hemispheres were somehow communicating. The only way I can think of is ENSO.

  18. Hank Roberts says:

    > John Owens says:
    > February 7, 2013 at 10:12 PM
    >
    > I have been reading the blogs and I don’t find any
    > speculation on the cause of the higher temperatures …

    That’s the problem with blog speculation, isn’t it? They don’t tell you what’s known about what’s happening.

    Here: some of the science.

  19. Gary Crough says:

    The jump in temperature from Dec to Jan seems quite large given no external event (like an El Nino) was noted prior to the announcement. Can you provide some better insight into what month-to-month variation is to be expected? For example, if you calculated a weekly global temperature would it jump around more than the monthly one simply because the greater data in the monthly one smooths things out?

    Also it seems to me that the satellite-based global temperatures show larger month-to-month movements than land-based global temperatures. I had assumed the satellite-based ones were simply more accurate and more responsive. Is that the case or does the amount of data used cause a smoothing effect buffering out big changes in the land-based global temperatures?

    • john parsons says:

      “Can you provide some better insight into what month-to-month variation is to be expected?”

      Gary, The “variation to be expected” is zero. That’s what’s meant by an anomoly. And that’s what’s leaving the usual denizens of Roy’s fine blog either “surprised”, “confused” or speechless. JP

  20. Entropic man says:

    Jiri Salek says:
    February 8, 2013 at 5:17 AM
    “Is there any reason why January 2013 temperature anomalies are so symmetrical in North and South hemisphere? I haven’t done any extensive research but it looks like the hemispheres were somehow communicating. The only way I can think of is ENSO.”

    We’re still ENSO neutral at present, so its not a likely candidate. If it’s happening worldwide, look for an external cause such as the upcoming solar maximum.

  21. Day By Day says:

    john parsons says:
    February 8, 2013 at 4:31 PM
    “Can you provide some better insight into what month-to-month variation is to be expected?”

    Gary, The “variation to be expected” is zero. That’s what’s meant by an anomoly. And that’s what’s leaving the usual denizens of Roy’s fine blog either “surprised”, “confused” or speechless. JP

    Dear John, I am one of those “surprised,” “confused” and “speechless.” There have been record breaking cold and snow reports all over the northern hemisphere–many thousands of deaths from the cold in both Dec and Jan. When there are record breaking warm temps we always hear how this or that month is the hottest ever globally and I expect it, but when there is widespread record breaking cold, no such report–its still warmer, hotter, hottest.

    I trust Dr. Spenser so I don’t see a conspiracy here–but something is not right. It’s like we hear, when it gets hotter, wetter, more snowy, more extreme weather, less extreme weather, drought and floods–they are ALL a result of warming. Somethings not right with what is begin reported and until I see some consistency other than “everything” is a result of warming, I remain “confused” and skeptical.

  22. Day By Day says:

    I messed up on my html code, sorry–it might be a bit confusing above.

  23. Chris says:

    @Day By Day says:

    I don’t think you understand properly the context of the things you are being confused by and what the represent in reality.

    1. Record breaking snow means what? The only thing that matters is it’s effect on albedo. Most of the snow cover is over areas receiving little to no radiation during January. There has been low snow cover in much colder months and higher snow cover in much warmer months.

    http://climate.rutgers.edu/snowcover/png/monthlyanom/nhland12.png

    http://climate.rutgers.edu/snowcover/png/monthlyanom/nhland01.png

    2. There has not been record breaking cold all over the Northern Hemisphere. During a period in mostly December the Polar Vortex sat over Asia while it helped spread snow cover pretty far South. This weather pattern temporarily caused an extra negative “feedback”.

    But regardless the March 2012 heatwave in North America was an epic historical event much more anomalous than the cold this winter.

    How did March 2012 do? No record warmth that month globally.

    3. It can still get cold. January was 0.51C above the 1981-2010 average globally, the Earth is pretty big, so that spacing that out will leave possibly major cold or warm areas.

    4. GHG are causing an increase in radiative forcing combined with other feedback’s, so this is expected.

    5. OHC is at record levels. So this is expected.

  24. Entropic man says:

    Day By Day

    This explains the link between increased winter snowfall and climate change.

    http://thinkprogress.org/climate/2013/02/08/1561331/epic-blizzard-poised-to-strike-new-england-what-role-does-climate-change-play/

  25. john parsons says:

    Day by Day,

    I too trust Dr. Spencer. And I too am a skeptic.

    You seem to believe that there has been an under-reporting of cold spells. As a skeptic, simply examine the global records. You can easily determine if there have been more record hot days than record cold days. Doing so will eliminate any doubt you may have about how the media, the bloggers or any others may spin it.

    Are there examples of extreme cold conditions? Of course. Are there examples of extreme heat? Of course. But the secular trend is undeniable. You’re smart enough to raise the question, so you don’t need my help locating the data. Because I have a bias, I don’t want to link you to information. You might rightly be skeptical of the sources I recomend. Just check out sources you trust and you’ll be able to see for yourself.

    Spoiler alert: Globally, there are increasingly far more record hot days than record cold days. JP

  26. Entropic man says:

    Day By Day

    It is easy to get confused by the soundbite science coming from the media and the propoganda sites. To understand properly you need to do some study.

    There is no Royal Road to Meteorology

  27. Day By Day says:

    Thanks Chris and Entropic man–the explanations help and Chris especially your point 3–that was great. That being said,

    Chris says, There has not been record breaking cold all over the Northern Hemisphere. During a period in mostly December the Polar Vortex sat over Asia while it helped spread snow cover pretty far South. This weather pattern temporarily caused an extra negative “feedback”.

    OK–forget the snow–Chris, There HAS been record breaking cold all over the NH. See these limited headlines, compliments of iceagenow.info:
    **********************************************
    Record low temperature in Bermuda
    by ROBERT on JANUARY 28, 2013 ·

    Midwest locked in deep freeze
    by ROBERT on JANUARY 26, 2013 · 8 COMMENTS
    Bitter temperatures stretch into a fourth day across several states. Four deaths so far.More and more people freeze to death in Russia

    by ROBERT on JANUARY 24, 2013 · 8 COMMENTS
    Record snowfalls and extreme sub-zero temperatures during Russia’s freezing winter

    Extreme Cold: Hydro-Québec reports record electricity consumption
    by ROBERT on JANUARY 24, 2013

    Cold weather kills 29 in Mexico
    by ROBERT on JANUARY 20, 2013 · 2 COMMENTS
    “Cold snap” hits a number of Mexican states – results in 29 deaths.

    Record low temperature in Seattle WA
    by ROBERT on JANUARY 18, 2013

    Mexico coldest in 42 years
    by ROBERT on JANUARY 16, 2013

    Ireland – Two die of hypothermia in their Dublin flat
    by ROBERT on JANUARY 16, 2013

    Bitter cold grips Nevada – Shatters previous record
    by ROBERT on JANUARY 15, 2013

    Forget global warming – Alaska headed for an ice age
    by ROBERT on JANUARY 1, 2013

    Record-breaking cold in Los Angeles
    by ROBERT on JANUARY 15, 2013

    Bitter cold grips western U.S. – Price of lettuce skyrockets
    by ROBERT on JANUARY 15, 2013

    Prolonged Frigid Blast Surges Across New Mexico
    by ROBERT on JANUARY 14, 2013

    Hard Freeze Warning in Southern Arizona
    by ROBERT on JANUARY 13, 2013
    Tucson has a Hard Freeze Warning until Tuesday morning that could break historic cold records tonight

    California freeze threatens $2 billion citrus harvest
    by ROBERT on JANUARY 12, 2013

    California temperatures to hit 6-year low
    by ROBERT on JANUARY 11, 2013

    Pakistan – Severe cold breaks all previous records – Video
    by ROBERT on JANUARY 11, 2013

    Snow chaos to cripple Britain – Minus 15C weather forecast
    by ROBERT on JANUARY 11, 2013

    China – Historic Cold Creates Massive Inflation In Vegetable Prices
    by ROBERT on JANUARY 9, 2013

    Pakistan – Skardu drops to a record low of -17C on Tuesday
    by ROBERT on JANUARY 9, 2013

    Bihar, India – Cold causes railway tracks to crack
    by ROBERT on JANUARY 9, 2013

    Severe cold grips northern India
    by ROBERT on JANUARY 8, 2013

    Sea ice early in Alaska
    by ROBERT on JANUARY 7, 2013

    Pakistan – Severe cold to continue
    by ROBERT on JANUARY 6, 2013

    Unusual cold expected to stay until February in Japan
    by ROBERT on JANUARY 6, 2013

    1000 ships stuck in sea ice in China
    by ROBERT on JANUARY 5, 2013

    Record cold in India
    by ROBERT on JANUARY 4, 2013

    Record cold grips Korean Peninsula
    by ROBERT on JANUARY 4, 2013

    Beijing – One of the coldest New Year periods in local history
    by ROBERT on JANUARY 4, 2013

    Coldest day in New Delhi in 44 years
    by ROBERT on JANUARY 2, 2013

    Ice roads open early
    by ROBERT on JANUARY 1, 2013
    “Bone-chilling temperatures have been a boon to builders of Manitoba’s northern winter roads this year,”
    **************************************
    That is only partially reported–there was much much more. that is not just asia–its widespread.

    JP–Spoiler alert: Globally, there are increasingly far more record hot days than record cold days. JP

    and Entropic man, There is no Royal Road to Meteorology

    Yes, I agree– and yes, I will research further, yet I can’t help but be suspicious of the “record hot” and “record cold” because of articles like this:

  28. john parsons says:

    Day by Day, You could list tens of thousands of record cold temperatures, but it would do nothing to affirm your suspicions if, at the same time, there were twice as many record warm temperatures as a corallary.

    I compliment you on your willingness to do the research. My question is this: If the results of your research show that it is in fact the case that there are far more record warm temperatures, are you willing to accept that fact? That’s the difference between being skeptical and being in denial. JP

  29. J Williams says:

    JP, I agree that listing various cold weather accounts is not very meaningful or scientific. I think a good way to dig into the temperature extreme data, at least here in the US, is to visit this NOAA site:

    http://www.ncdc.noaa.gov/extremes/records/

    From there, you can see for yourself how record colds and record highs stack up against each other, and using data from all sites with sufficient records; not just a convenient sample. In 2012, there were about 5 times as many record highs as record lows. And, so far in 2013, record highs occurred ~6.5 times more than record lows. I like visiting this site periodically, especially to see how actual data stack up against media accounts suggesting that we are going through temperature extremes (hot or cold).

    I’m not aware of comparable tabulations for weather stations worldwide, unfortunately.

  30. Hops says:

    Am I correct in understanding that these temperature measurements are believed to be +/- 0.08C?

    If so, are these comparisons of “warmest” and “second warmest” really to be treated as fact, or is it ambiguous?

    Thanks,
    Hops

  31. Day By Day says:

    Thanks–I did my research. Naturally I don’t want to be in “denial” but still have BIG doubts about all this. I read this paper “Relative increase of record high maximum temperatures compared to record low minimum temperatures in the U.S.” (http://tinyurl.com/ck28km7) They are using models again….sigh.

    Then I went to NOAA–followed your links. Then I went here:

    http://tinyurl.com/y63xecr

    Last week there were more record lows–but its only a week–means little to nothing in the overall scheme of things, I know. But as Meehl says in the paper above–as temperatures rise we will see a continued rise in the ratio of the record highs to record lows. His paper says this ratio has been evident since 1970’s but his sample data is from 2000.

    So if the record highs have outpaced the record lows by two to one for 13 years, how come the global temperature has not risen? Do you see why I have trouble with this? I read the anecdotal stories of freezing weather all over the northern hemisphere only to hear that it was a very warm January globally. Since the annual temps are not rising globally, how come everything is reported as warmer (month, year, season, March, April, and so on–)? yet the global temperature hasn’t risen significantly in so many years when the record highs so outpace the record lows? Some thing is not being reported correctly and I think you are missing the point of what I’ve been saying–although agreed I am not saying it very eloquently.

  32. JackmanTex says:

    Dr spencer can you fit a 10 point polynomial to the data set so the we can all laugh at you again – just for entertainment purposes

  33. J Williams says:

    A few FYIs, DBD:

    > The Meehl paper presents findings based on observational data. Yes, models are used for predicting what might happen in the 21st century (and one must use models for such forecasting obviously), but the increased number of record high in the U.S. in the 20th century was based on observed values.

    > Meehl’s paper is not based only on data “from 2000.” The observational data are from nearly 2,000 stations and span the time frame 1950 to 2006. He did say we can expect to see an increase in the ratio of record highs versus lows, and that’s certainly what is evident from the NOAA data I linked to previously, at least when one looks at reasonably long time scales.

    > I see nothing inconsistent with the greater number of record highs (versus record lows) and the global temperature record. All of the global temperature records I’m aware of place the last decade as the warmest over the past 100+ years. So, the fact that we are seeing more extremes in recent years is consistent with the longer term global trend. The global temperature record is noisy, but if you look at longer averaging times (e.g., decadal), you will see a pretty smooth upward trend that continues today.

    Have a good weekend…

  34. Day By Day says:

    I know he used observational data from a longer period, but the “data” he used to conclude that recent higher max temp highs is a sign of global warming are in models even though for the period that had the higher 2 to 1 ratio there has been no warming. (bold mine)

    “As of the end of September, 2009, inspection of the National Climatic Data Center web site that archives observed annual record high maximum and record low minimum daily temperatures from weather stations across the U.S. (http:// http://www.ncdc.noaa.gov/oa/climate/research/records/) showed that since January 1, 2000, there had been 291,237 record high maximum daily temperatures set, and 142,420 record low minimum daily temperatures, or a ratio of roughly two to one. Since January 1, 2009 (also compiled to the end of September, 2009), there had been 11,711 record highs and 7,449 record lows, with a ratio of just less than two to one…”

    I find it strange that you see “nothing inconsistent with the greater number of record highs (versus record lows) and the global temperature record” when there has been a step up in heat (1998) and then a plateau for 17 years? The Meehl paper also reported:

    “It is also seen that the recent period when the ratio has been 2 to 1 is just the latest value characteristic of a warming climate, while the ratio was less than that in the previous several decades..”

    He is talking about 1999 to 2009 and explaining that the 2 to 1 is a RESULT of global warming–when there was no warming! And the two decades earlier there was relatively steady warming but not the high ratio. Are you saying there is a 10 year lag?

    “Analysis of observed annual U.S. record high maximum compared to record low minimum daily temperatures shows that the recent values of the ratio of about 2 to 1 are just the transient values of a ratio that has been increasing with mean annual mean temperature over the U.S. since the late 1970s”

    So again do you see my problem, the ratio has NOT been increasing with the mean annual temperature.

    Thanks for getting me to think about it. I must be in denial.

    and Hops, I think its ambiguous.

  35. Hops says:

    Well, Day by Day, the highs and lows are measured in selected places on land, and specifically the data set in question is for the U.S. The much larger ocean is warming less quickly, so it would tend to drag down the average temperature.

    In general, the projection is for land to warm much faster than the ocean.

    I also like to point out that climate can change more than global average temperature. Storms dump heat into space by convection of warm air to the upper atmosphere, forming a negative feedback. Perhaps we’re getting less warming because of more and bigger storms. We are also melting our ice cubes.

  36. J Williams says:

    DBD: Just a quick afterthought…

    I’m not saying there is a 10-year lag. All I am saying is that if someone were to ask me, based on the global temperature record, when I would expect to see more record highs than record lows, then I would say most definitely in the recent decade. I would also expect the ratios to generally go down as one moves to earlier decades. That’s perfectly consistent with Meehl’s paper. There will undoubtedly be shorter times when these ratios are lower or higher than the ratio for a given decade and there will also be locations that experience greater fluctuations in these ratios, but that is to be expected with a somewhat noisy signal. Also, Meehl not only attributes the shift in the ratio to the changing average temperature, but also to the increased variance, which others have reported on as well.

    I never suggested you were in denial about anything. I hope you didn’t infer that I was implying as much. I generally don’t like using those labels.

  37. always a massive fan of linking to bloggers that I really like but do not get quite a bit of link appreciate from…

Leave a Reply