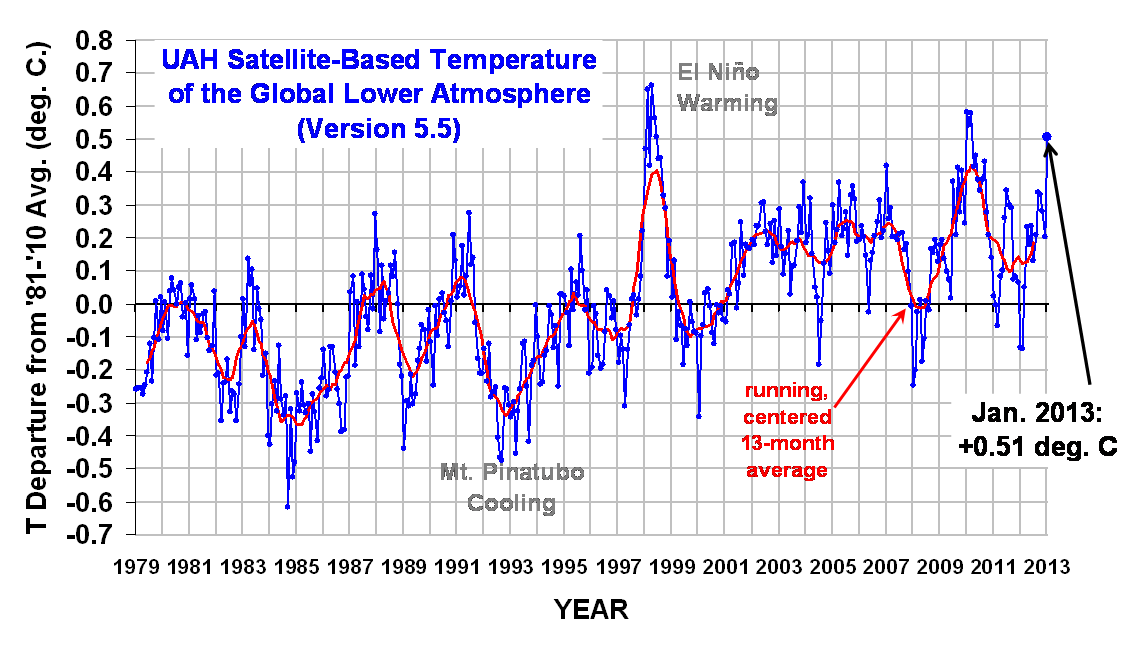
Our Version 5.5 global average lower tropospheric temperature (LT) anomaly for January, 2013 is +0.51 deg. C, a substantial increase from December’s +0.20 deg. C. (click for large version):

The global, hemispheric, and tropical LT anomalies from the 30-year (1981-2010) average for the last 13 months are:
YR MON GLOBAL NH SH TROPICS
2012 1 -0.134 -0.065 -0.203 -0.256
2012 2 -0.135 +0.018 -0.289 -0.320
2012 3 +0.051 +0.119 -0.017 -0.238
2012 4 +0.232 +0.351 +0.114 -0.242
2012 5 +0.179 +0.337 +0.021 -0.098
2012 6 +0.235 +0.370 +0.101 -0.019
2012 7 +0.130 +0.256 +0.003 +0.142
2012 8 +0.208 +0.214 +0.202 +0.062
2012 9 +0.339 +0.350 +0.327 +0.153
2012 10 +0.333 +0.306 +0.361 +0.109
2012 11 +0.282 +0.299 +0.265 +0.172
2012 12 +0.206 +0.148 +0.264 +0.138
2013 1 +0.506 +0.553 +0.459 +0.375
Due to the rather large 1-month increase in the temperature anomaly, I double checked the computations, and found that multiple satellites (NOAA-15, NOAA-18, and Aqua) all saw approximately equal levels of warming versus a year ago (January, 2012), so for now I’m accepting the results as real. The most common cause of such warm spikes (when there is no El Nino to blame) is a temporary increase in convective heat transfer from the ocean to the atmosphere. This would suggest that the global average sea surface temperature anomaly might have actually cooled in January, but I have not checked to see if that is the case.
Archived color maps of local temperature anomalies will be updated shortly are available on-line at http://nsstc.uah.edu/climate/;
The processed temperature data (updated shortly) is available on-line at http://vortex.nsstc.uah.edu/data/msu/t2lt/uahncdc.lt

 Home/Blog


