UAH v5.6 Global Temperature Update for June, 2013: +0.30 deg. C

July 9th, 2013 by Roy W. Spencer, Ph. D.

After 10 days in Michigan’s U.P. for my 40th high school reunion, here’s the belated monthly global temperature update.

We added two satellites to the processing, Metop-A starting in 2007 and NOAA-19 starting in 2009. The resulting anomalies, which we will call Version 5.6, differ by as much as 0.04 deg. C from v5.5. You can read the details of the new processing here.

We are now making good progress on Version 6.0, which includes a variety of improvements in our processing procedures which have taken much more time than we anticipated.

The Version 5.6 global average lower tropospheric temperature (LT) anomaly for June, 2013 is +0.30 deg. C (click for large version):
UAH_LT_1979_thru_June_2013_v5.6

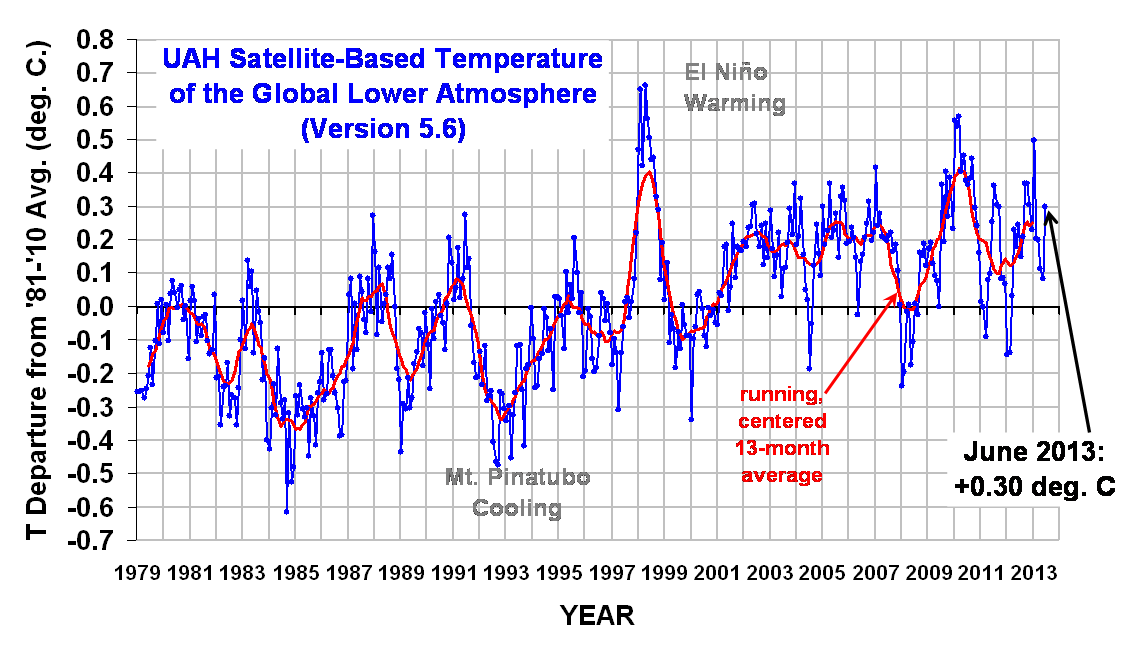
The global, hemispheric, and tropical LT anomalies from the 30-year (1981-2010) average for the last 18 months are:

YR MON GLOBAL NH SH TROPICS
2012 1 -0.145 -0.088 -0.203 -0.245
2012 2 -0.140 -0.016 -0.263 -0.326
2012 3 +0.033 +0.064 +0.002 -0.238
2012 4 +0.230 +0.346 +0.114 -0.251
2012 5 +0.178 +0.338 +0.018 -0.102
2012 6 +0.244 +0.378 +0.111 -0.016
2012 7 +0.149 +0.263 +0.035 +0.146
2012 8 +0.210 +0.195 +0.225 +0.069
2012 9 +0.369 +0.376 +0.361 +0.174
2012 10 +0.367 +0.326 +0.409 +0.155
2012 11 +0.305 +0.319 +0.292 +0.209
2012 12 +0.229 +0.153 +0.305 +0.199
2013 1 +0.497 +0.512 +0.481 +0.387
2013 2 +0.203 +0.372 +0.034 +0.195
2013 3 +0.200 +0.333 +0.068 +0.243
2013 4 +0.114 +0.128 +0.101 +0.165
2013 5 +0.083 +0.180 -0.015 +0.112
2013 6 +0.298 +0.337 +0.259 +0.221


125 Responses to “UAH v5.6 Global Temperature Update for June, 2013: +0.30 deg. C”

Toggle Trackbacks

  1. More of the same.
    Once this weak maximum of solar cycle 24 passes by let us see what happens to the temperature trend. I call it the moment of truth, and we should have a clearer picture, although I think to get significant temperature changes thresholds have to be met, nevertheless I expect a gradual temp. decline once solar maximum 24 passes by ,which should be within 6 months or so.

    I still think the main cause behind major climatic change is the strength of the solar /geomagnetic fields. When weak colder, when strong warmer. They have to phase, in a degree of magnitude and duration of time that brings about thresholds through the secondary effects associated with the change in strengths of the magnetic fields.

    I say this theory is as good as anything that is out there.

    If not this ,what?? Explain all the abrupt up/down major temperature changes earth has had in the past, often times up to 20x greater then what has happened this past century.

    Explain(anyone) how co2 theory can apply to past abrupt temp. changes. You can’t!

    Something or I should say some combination of things caused this and it has been the rule not the exception.

    Time might tell this decade since it looks like a very weak solar magnetic field will be the rule ,while the geomagnetic field of earth is on the decline and should continue going forward.

    • barry says:

      The last few ‘abrupt’ temperature changes are the ice age cycles, which are coincident which CO2 changes. Orbital variation is the triggger, and CO2 amplification is one of the feedbacks, which takes some hundreds of years to kick in. The last ice age shift to interglacial took 5000 years. CO2 tracks with the major ice age changes very well (correlation is excellent).

      The quaternary changes is a good period to compare with present, because the geology of the planet is not materially different (ocean geology is the same), and the time is too short to have to worry about factoring in the aeaons-long process of the inexorably warming sun. Apples with apples.

    • Cupsui says:

      Its high school chemistry/physics.

      High intensity solar radiation which goes from ultra violet to beyond infra red (and centered on the visible light range) interacts with certain molecule, obviously all visible objects that’s why we see them, but also some outside the visible range Ozone (which interacts with high energy UV rays.

      Solar radiation heats up the Earth, then during the night (especially) the Earth releases this energy but it is now lower energy radiation and this energy happens to interact with the greenhouse gases, CO2, H20(v), CH4, SF6 etc. The energy that “interacts” with these gases is trapped in the atmosphere and not re-released into space. That is why the Earth is liveable at all. A purely natural process (YES the greenhouse effect is natural).

      Where things go wrong is the ENHANCED greenhouse effect. Humans have drastically increased the concentration of CO2 and CH4 (methane: a more important GHG than CO2 per molecule) in the atmosphere. Hence more heat energy is being trapped.

      The logical step is that things are getting hotter. Which they have been over the last century. But more heat also means more evaporation (more H20(v) in the atmosphere), which can cause (I) more rainfall (II) more heat to be trapped, (III) less sunlight to reach the Earth, (IV) A combination of (I) and(II) causing a perturbance of natural rainfall patterns (increased flooding, storm activity, greater draughts, etc in different places).

      hence why predictions are difficult. But the one certain thing is HUMANS ARE DRASTICALLY CHANGING THE CLIMATE and I think its also safe to say not in a positive way!!

      Unless we do something about our CO2 and CH4 emissions increases rapidly we are going to make this planet a lot harder to live in…

  2. Hops says:

    Is there any way to separate the temperature anomoly over land from those over the oceans as a way to get insight as to whether oceans are absorbing or releasing heat?

    Thanks,
    Hops

    • Hops says:

      I plugged the available numbers into Excel. The sum of degree-months for the northern hemisphere is about 4.5 degree-months, while the southern is about 2.3, about half. Since the southern hemisphere is more ocean than the northern, this would seem to indicate that the oceans are absorbing heat and bringing down the average, at least for now.

      For the first 6 months of 2013, the NH sum is about 1.8 degree months, whereas for the first 6 months of 2012 it was about 0.65 degree months.

      I also wonder about Antarctica. Won’t the ice be no warmer than 32 degrees F? It seems like the cryosphere should be factored out at both poles.

      I still want to know when a sharp temperature drop will cause a reversion to the mean.

      Hops

    • Ray says:

      Hops,

      More detailed data are available here:

      http://vortex.nsstc.uah.edu/data/msu/t2lt/uahncdc.lt

      Unfortunately these haven’t yet been updated with most recent figures.

  3. Daniel Reppion says:

    Is the discover data completely defunct now? I get an error message when I try and view it.

  4. Bertrand says:

    Salvatore: “Explain(anyone) how co2 theory can apply to past abrupt temp. changes. You can’t!”

    where did you get the impression all changes in climate are due to co2?

  5. kristopertree says:

    30 years of data is the minimum for a scientific study. Even this data shows an obvious exponential growth. Clearly you know nothing of past climate change or the science behind it. What a disgrace for a weather site to have you “doctor” on here.. I call bull

    • Ted says:

      Kristopertree: perhaps you could clarify your comment. I find it very unclear.

      Your basic maths may not be very good so I will try to help you out. Dr Spencer’s data starts in 1979 and runs until the present, 2013.

      That is 33 years, is that good enough for you.

      On this site you just see the data as it is.

    • Perfekt says:

      I love when the warmist trolls display their complete ignorance.

      This is not a weather site, it is about climate.

      You have more than 30 years of data here, go ahead and do your scientific study. For a starter, please tell us the value of the exponent in your “exponential growth”

      I am also interested in your credentials, since you think you are superior. You can read about dr. Spencer here: http://www.drroyspencer.com/about/
      Where can we read about your credentials?

  6. I DON’T HAVE THAT IMPRESSION ,RATHER THE AGW CROWD HAS THAT IMPRESSION.

  7. Bertrand says:

    Salvatore: “I DON’T HAVE THAT IMPRESSION ,RATHER THE AGW CROWD HAS THAT IMPRESSION.”

    not from the papers and textbooks I read.

  8. Gordon Robertson says:

    Roy. Any news of more satellites being launched in the future? I have suspected that NOAA will try to stifle you by not launching any more and waiting for the the old one’s to fade away.

    A couple of years ago, I was standing on the banks of a river (the Thompson) near the hottest part of Canada, Lytton, BC. It’s pure desert country there with sage brush, small cactii and all, and only 150 miles NE of Vancouver, which is in a rainforest climate. When alarmists talk about climate change I wonder which one, we have a half dozen distinct climates within a few hundred miles of Vancouver alone.

    Anyway, it was plus 40 C in the shade that day and the direct Sun was unbearable. I could not stand being out in it. Later, I talked to a hotel owner who laughed at my discomfort, claiming they put thermometers outside in direct sunlight and watch them climb to the mid 50s C.

    Dick Lindzen claimed that without convection currents, the direct solar energy could go as high as 72 C. I can believe that. On that day, there was not a breeze and it was miserable.

    Why are people so hung up on anthropogenic warming when natural weather can produce such a fluctuation in solar energy?

    I don’t know how it works, but how can convection mitigate the direct rays of the Sun? I understand the cooling effect on the skin but why would the Sun feel so much hotter (20 C in the shade) within 150 miles at the latitude of Vancouver?

    Meteorology is a far more complex discipline than what many people are willing to let on.

    • Max™ says:

      Convection is a process by which energy absorbed by the surface is transported upwards into the atmosphere through bulk movement of gases warmed by their proximity with the surface.

      The hotter the surface becomes, and the greater the differential between the atmosphere and surface temperature becomes, the more effective convection becomes at cooling the surface.

      Place three surfaces of the same material with the same albedo into three containers: one with a vacuum, one with gas at ~1 atmosphere pressure and no moisture, and one with gas at ~1 atmosphere pressure and a thin layer of water on the surface.

      Expose the top end of the containers to sunlight, the surface in the vacuum cools least effectively and reaches the highest temperature, the container with gas cools at a rate set by the height of the container (and thus how effectively it can convect heat upwards from the surface), while the container able to undergo convection and evaporation will cool most rapidly.

      • Gordon Robertson says:

        Max…I appreciate your response but it doesn’t answer my question. Why should convection make the Sun feel so much warmer, to the point of feeling unbearable, in regions that are essentially at the same latitude?

        I can experience the same effect even in Vancouver but not as much. There are days when it warms to 25 C (or even 30 C) here and I can walk about in the Sun feeling little discomfort. At other times, the solar rays feel very intense.

        I am sure it has something to do with atmospheric conditions and maybe a personal interpretation of what I am feeling.

    • Why are people so hung up on anthropogenic warming when natural weather can produce such a fluctuation in solar energy?

      Consequently, why should people be hung up about a new glacial, if it happened? After all, globally averaged temperature was only 4 to 7 deg. C lower during the Last Glacial Maximum compared to today.

      • Gordon Robertson says:

        Jan…my point is that no one has proved the warming we have experienced has anything to do with anthropogenic forces. Roy’s temperature graph shows 15 years without a warming trend. We can explain any warming we have had through natural forces such as El Nino’s and rebound warming from the Little Ice Age. Maybe, even through the Earth’s natural warming/cooling cycles.

        By getting hung up on anthropogenic warming, I mean buying into the theory, which is based entirely on climate models, to the point where we distrust what we are seeing about us. I live on the coast and I am not seeing tidal increases, droughts or floods. Why should I get hung up on a theory proclaimed circa 1988 by James Hansen, when there is no evidence 25 years later to support it?

  9. let us say this, they think co2 is one of the main drivers of climate at best. Wrong.

    • Steven Mosher says:

      actually no. the main driver is the sun. without 1360 watts of input energy you got nothing. However, one of the main drivers of climate CHANGE is GHGs. Its pretty simple. If you hold the sun constant and increase GHGs the temperature will go up. That makes GHGs a “‘driver” of the climate. The question is how important are GHGs. that’s a real debate. But trying to win that debate by misconstruing your opposition doesnt really work. It doesnt work because the real debate happens between scientists like Roy who think the GHG effect is somewhat smaller than his colleagues think and you are not part of the real debate. You can’t be a part of that debate and no one will listen to you as long as you get basic facts wrong.

      • Stephen Richards says:

        one of the main drivers of climate CHANGE is GHGs. Its pretty simple

        If it were climate models would be accurate and not totally inept.

        • barry says:

          If CO2 was the only factor determining climate change, the models would be more accurate. Having unchanging weather would also help, but we have to deal with reality.

      • The assertion that GHG’s are a main driver of climate change is a hypothesis. It’s certainly not evident in the last 30 years of atmospheric temperature data. At the very least natural factors seem more important than GHG’s for the last decade or more. Mosher is very enthusiastic about how reliable scientific guesses are. I’m not sure why. For every thousand hypothesis presented only a handful work out to be true. There is a bias problem here, because everyone remembers Einstein got his theory right. Few remember the thousands who tried to solve the same problems and got it wrong.

        • barry says:

          It can’t be the sun or the PDO driving climate chane over the satellite period. So what is the main driver?

        • Gordon Robertson says:

          Will…we live in an era where physics has been taken over by theoretical mathematicians. Physicist David Bohm, who was a friend of Einstein, once claimed that equations without a reality to back them are nothing more than garbage. I think he was describing climate models.

          He was also describing the Big Bang, black hole theory, space-time curvature, and time dilation. It seems all you need to validate a theory these days is to have enough people agree with you.

      • Gordon Robertson says:

        Steve …I like to use an example based on all GHGs making up 1% of the atmosphere. If a greenhouse had 100 panes of glass, that 1% would be 1 pane. The equivalent greenhouse to the atmosphere would be a 100-pane greenhouse with 1 pane remaining.

        It gets worse. All CO2 makes up only 0.04% of the atmosphere and anthropogenic CO2 is only 4% of that value based on a density of about 390 ppmv. Those numbers come from the IPCC. That means ACO2 account for about 1/1000 of 1% of the atmosphere, based on 390 ppmv.

        Exactly how much of the huge surface flux of IR could that piddly amount absorb? Dick Lindzen, an MIT prof who teaches atmospheric physics, has calculated that a doubling of all CO2 would not warm the atmosphere more than a few tenths C.

        I am afraid the anthropogenic theory is based on a lot of speculation that cannot be proved. Trenberth admitted in his radiation budget calculations that it was all derived from theory.

        • Cupsui says:

          Ever heard of the atmosphere!? Without any greenhouse gases all energy that the earth absorbs from the sun would be re-released into space and the earth be freezing (approx. average global temp of -18 degs C; about 33 degs C less than current). Nearly all life could not survive such a planet. Thus CLEARLY small changes in the concentrations of GHGs cause big changes in the planets “radiation budget”

          Ever heard of methane?! A causes more Earthly radiation to be trapped per molecule than CO2. However yes, its less important than CO2 in the greenhouse effect because there is considerable less CH4 in the atmosphere. Still important nonetheless…

          Again it’s simple science if you want to be open to it a learn and not just blot out things you don’t want to hear

  10. Bertrand says:

    Salvatore: “let us say this, they think co2 is one of the main drivers of climate at best.”

    yes, co2 is a major driver of climate. did I miss some of your vaunted, peer-reviewed publications, Salvatore?

    • Perfekt says:

      That depends on what you mean by “major”

      To me it is major in the sense that it keeps the Earth substancially warmer than it should have been without it.

      I don´t see how it could be a major explanation to current temperature changes.

  11. Bertrand says:

    gordon, you really believe temperatures reach 130 F in Canada? care to cite statistics to back that up? or is there nothing you won’t believe?

    • Gordon Robertson says:

      Bertrand…my report of 55 C was hearsay but believable. Here is something about Lytton, where the record is 44.4C or about 112 F. I reported what a local told me about other locals putting thermometers in direct sunlight. There could be other issues due to direct radiation that caused such a high reading.

      http://en.wikipedia.org/wiki/Lytton,_British_Columbia

      That is in the shade. Why is so unbelievable that temperatures in direct sunlight could be 10 C warmer?

      BTW…that record of 44.4 C for BC happened in July 1941, and has yet to be broken.

      It so happens that the German scientist Kreutz recorded CO2 levels over 400 ppmv near the same time in the 20th century. He took over 25,000 readings using state of the art technology and was careful to eliminate effects that could give spurious readings.

      The record for the US is still in the 1930s, although some diehard alarmists are trying hard to remove that record. With the high CO2 levels recorded by Kreutz, I think that gives credence to the notion that warming produces higher levels of CO2, and not the other way around.

  12. NO IT IS NOT A MAJOR DRIVER OF CLIMATE.

    PEER REVIEW IS GARBAGE REVIEW

    • Cupsui says:

      that is the most ridiculous statement I have ever heard. Not even you overuse of caps could legitimize it.

      Should we all just submit to you for review from now on?

  13. We will see this decade who is correct and who is wrong.

    This decade will feature weak solar magnetic fields if major driver temperatures will decline.

    This decade will feature co2 on the increase if major driver temperature should rise.

    Let us see what the temperature trend does, that is the only review that counts.

    • Hops says:

      Here’s a deal then: let’s cut CO2 emissions to zero for a century or two and see what happens.

      Three hundred years from now, if CO2 is obviously not an issue, our great … great grandchildren can go back to burning coal, if they want to, which I doubt.

      Hops

      • John K says:

        Seriously? How do you expect to get the requisite 7 billion people on this planet to do much of anything let alone reduce their hydrocarbon consumption and reduce CO2 emissions to zero for your amusement? Unless of course, you only directed your comments to Salvatore and yourself in which case the impact will hardly be noticeable. In fact, even if the entire U.S. civilian population suffered temporary insanity and made the same effort the real impact on annual CO2 growth would be minor. Common sense suggests you need not waste time on such trivial, pointless self-denial but that hasn’t stopped the truly gullible before and I doubt if it will in the future.

        BTW how do you plan anyone including yourself to hold their breath and thereby not emit CO2 for even a few minutes let alone a century or two? If you seriously plan to attempt such a feat please keep a video log of the event. You shouldn’t need much recording tape or computer memory before you’re back to emitting CO2 like a chimney, but at least everyone here can have a laugh!

        • Bertrand says:

          John: Breating merely recycles carbon, it does not create new carbon.

          The carbon you exhale comes from the carbon in the plants you eat, or the animals you eat who eat plants. Thus breating is carbon-neutral.

          In any case, it is only about 0.9 kg/day, about 1/40th that due to burning fossil fuels.

          • John K says:

            Seriously Bertrand?

            You should realize that many people on this blog, myself included and with the possible exception of Hops, have some understanding of basic biological processes such as photosynthesis (plants), respiration and the Krebs cycle (animals). Unfortunately you, however, seem to lack basic reading comprehension. Hops suggested reducing CO2 emmissions to zero. He wrote nothing about either carbon neutrality, net emmissions or net atmospheric CO2 growth rates (which Roy has provided the Mona Loa data for on this blog). As I mentioned before if any climate paranoid wishes to cut his CO2 emmissions to zero, please record your efforts. In any case, the energy consumed to provide you web access and the very ability to partake in this exchange of ideas will prove on a moments reflection to be in no way, shape or form carbon neutral. Therefore Bertrand you should to be consistent ask yourself if the rather simplistic but irrelevant point you made proved to be worth the extra warming you imagine must result.

            BTW since you introduced the rather vacuous, ill-defined phrase “carbon neutral” please define precisely and in measured terms your exact meaning. There exists of course any number of political charlatans who claim all kinds of psuedo science quackery. For example many delusionally assert that by purchasing a plot of land with trees on it they somehow offset their myriad carbon emmissions. Such pablum should have no place in a rational discussion. If you wish to have a rational discussion, define your terms and measure your claims. Thanks and have a good day.

        • Hops says:

          I’ve listened to the lectures in this class, and the topic of breathing (and decomposition) is covered and said to be net neutral. The only thing that matters is what we dig out of the ground.

          http://oyc.yale.edu/geology-and-geophysics/gg-140

          Those who think they know it all should take the class. As always, the more educated people are, the less they think they know everything.

          • John K says:

            Hello Hops,

            Thank you for the post. You should probably know from my previous post that I never even implied breathing to be a cause of either increasing atmospheric CO2 levels or any perceived climate change. As to what we dig from the earth and spew into the air, we should account for anything that threatens lives and property. While too much of anything will kill, most all life on earth requires CO2 to survive, plants directly and most animals indirectly (obvious exceptions include deep sea life utilizing chemosynthesis to extract energy from chemicals derived from undersea volcanic vents, anaerobic bacteria, etc.). CO2 has no known level of toxicity. The only example I can recall of anyone ever perishing as a result of excessive CO2 happened in Africa some decades ago. A lake emitted such an enormous quantity of CO2 that it supplanted most of the regions normal air/oxygen levels and the people suffocated. They died due to a lack of oxygen. Currently automobiles emit primarily CO2 and water. They likely generate more CO2 than in the past. Why? Due to an invention called the catalytic converter. You should be glad. In the past cars emitted far more carbon monoxide (CO) and particulate matter than they do now. CO being a diatomic gas compound may not be a “greenhouse” gas but can be quite toxic. Reducing VOC’s, particulate matter in car exhaust, CO and other such chemicals almost certainly saved lives.

            What has a paranoid fear of a life enhancing chemical CO2 and legal attempts to restrict it like ethanol restrictions and the Kyoto Protocol produced? (1) Food riots due to counterproductive ethanol subsidies and legislation affecting corn prices (2) Mindless destruction destruction of U.S. industrial infrastructure and relocation to third world countries (3)Absolutely no observable reduction of CO2 or measurable change in climate. Review the Mona Loa CO2 measurements yourself. CO2 levels have risen since measurements began their in 1958. Please identify any legislation, or human effort that purports to reduce global CO2 production to below 1958 levels. Of course, in all likelihood none exists. If I’m wrong please present it.

            You hilariously wrote: “As always, the more educated people are, the less they think they know everything.”

            That statement cuts both ways. While I take the admonition and certainly do not pretend to know everything, you should take stock of the obvious fact that many AGW alarmists dishonestly claim various political nostrums will reduce CO2 and improve the climate when in fact they provide no objective means of doing either. They simply seek to re-distribute confiscated wealth from one group and transfer it to another. While they profess to know the climate, they prove by their actions that they neither understand it or care much about it. They apparently only seek political power.

          • John K says:

            Hello Hops,

            One point of clarification to my post above. I wrote: “Please identify any legislation, or human effort that purports to reduce global CO2 production to below 1958 levels.” While no human legislative action has or likely will reduce CO2 emissions to pre 1958 levels, private wealth accumulation, innovation and achievement will allow the development of technologies capable of providing people with far greater control over their own environment including CO2 or any other emissions.

          • Cupsui says:

            You say:
            “CO2 has no known level of toxicity.”

            Then you totally contradict your self with a truth:
            “The only example I can recall of anyone ever perishing as a result of excessive CO2 happened in Africa some decades ago.”

            Then finish it with an fallacy:

            CO2 is toxic
            “In addition, hemoglobin responds to carbon dioxide with a decrease in oxygen affinity, thus facilitating the release of oxygen in tissues with a high carbon dioxide concentration. In the presence of carbon dioxide at a partial pressure of 40 torr, the amount of oxygen released approaches 90% of the maximum carrying capacity.”

            http://www.ncbi.nlm.nih.gov/books/NBK22596/

            “Carbon dioxide not only lowers the pH, increasing the likelihood that hemoglobin will release its bound oxygen, but carbon dioxide also acts as a poison for the body.”

            http://en.wikibooks.org/wiki/Structural_Biochemistry/Hemoglobin

            Then all you do is focus on the automotive industry and how reducing emissions is bad (mainly for money and also for CO)…

            It is bad and if we could get cars off the road and people in public transport we would save huge emissions. Just as we would if we moved to renewable clean energy over coal. They do not contribute to net carbon increases.

            Look things up don’t just assume you know the answer. Just finding the things you want to hear because you don’t want people to move away from big money coal and oil industries is not real research

  14. Bertrand says:

    salvatore del prete says:
    “NO IT IS NOT A MAJOR DRIVER OF CLIMATE.
    PEER REVIEW IS GARBAGE REVIEW”

    salvatore, you come across as a child who sticks his fingers in his ears and says, “I can’t HEAR you!!!!!”

    your schtick is old by now. and utterly unconvincing.

  15. Thanks, Dr. Spencer. I have updated your graph in my weather and climate pages (English and Spanish).

  16. Bertrand says:

    salvatore del prete says:
    “We will see this decade who is correct and who is wrong.”

    you have been saying the exact same thing for years.

    by now, it is beyond comical. there is no reason to take you the least bit seriously.

    • Ted says:

      Bertrand says: “you have been saying the exact same thing for years.

      I would have thought that the last 15 years would have given Salvatore a reason to at least suspect that he may well be on the right track.

  17. sky says:

    As long as the global monthly anomaly keeps popping its head above ~0.25K on a fairly regular basis, the prospect for a cyclically expected bona fide global cooling remains dim.

  18. Walter Dnes says:

    Could you have a link to the ftp website on your monthly blogposts? I believe the new one is…

    http://vortex.nsstc.uah.edu/public/msu/t2lt/tltglhmam_5.6

    Also, could someone please have a look at the file-mimetype on the download webpage? I run linux. Both Opera and Firefox seem to think the file is a “man page” and attempt to open it with “nroff”. Let’s just say that doesn’t work. I have to use “wget” to download the plaintext file, and view it locally. It needs to be either…

    1) force mimetype to plain text

    or

    2) rename the file to “tltglhmam_5.6.txt” so that the browser default is to treat it as a plain text file

  19. Hans K Johnsen says:

    Looking at the temperature graph it seems to me there is a step change around 1997, when solar cycle 23 started. On each side of 1997 the temperature is essentially constant. Wonder why.

    • John K says:

      Hello Hans K Johnsen and Roy,

      I’ve made the same observation in regards to the 1997-8 stair-step increase in temperature. It appears as though average global temperatures between 1979 and 1979 fluctuate within a fairly stable, flat range then leap up almost a full degree centigrade in 1997-8 to settle at a new plateau .4-.5 degrees centigrade higher than previously. If I remember correctly sometime back in the 1990’s some people criticized the satellite orbital trajectory claiming a cooling bias. Apparently, corrections had to be made.

      Allow me to pose a question to ROY. What kind of adjustments if any did UAH make to the satellite data back in the 1990’s? Does the pre 1997-8 satellite temperature data represent precisely the same observational platform/perspective as the post 1997-8 satellite temperature data? If not, what changes were made to the satellite observation parameters and how did you and UAH reconcile these changes into one unified graphic presentation?

      Thank you Hans for your post. Thank you Roy for any information you can provide.

      • John K says:

        Hello Hans and Roy,

        Just a minor correction to my post. The second sentence in the first paragraph of my post should have read:

        “It appears as though average global temperatures between 1979 and 1997 fluctuate within a fairly stable, flat range then leap up almost a full degree centigrade in 1997-8 to settle at a new plateau .4-.5 degrees centigrade higher than previously.”

        Thank you for your patience.

        • barry says:

          Physics-free curve-fitting. One can find such ‘step-changes’ all over the temperature records. You are implying that some mechanism caused a 1C change in global temperature in one year, and climate was stable either side of it. I look forward to an explanation of the ‘driver’ that caused that!

          • barry says:

            ‘1C’ should be 0.5C.

          • John K says:

            Hi Barry,

            Thanks for your post. If you read my post carefully you’ll notice I in no way mean to imply that a sudden mechanistic change must have caused the recorded temperature increase. In fact, I questioned it. Notice I used the word “appear.” Bear in mind all temperature records will be no better than the measurement tools used and subject to human error, bias and/or manipulation. Like the villain in the Hitchcock movie “North by Northwest,” one should always be wary of neatness including a neat stair-step temperature increase. They often reflect human manipulation intentionally or otherwise. BTW average global satellite temperature data (the only meaningful global temperature data that exists) has only been around since 1979 when satellites capable of measuring it came into use. Please show me the other stair-step temperature patterns in the RSS or UAH MSU global satellite data. I’d love to see it. Thanks again.

          • barry says:

            John, UAH trends 1979 – 1997, and 1999 – 2013 look like this.

            Findng a similar ‘step’ feature in the RSS data is easy, and the trends are flatter than for UAH 1999 – 2013.

            Using similar periods and the same method (excising 2 years in between ‘steps’), one can find plenty of apparent analogs in the HadCRUt4 data. (All trends are smaller than that for UAH 1999 – 2013 slope)

            There would be many more than I found across the data sets. The ‘step-changes’ are just a function of the data, not error. Shortened time periods – like the ones you apply – will give you many results like these.

            I see now you were not attempting to hypothesise a real-world event. My bad for skimming your post.

          • John K says:

            Hi Barry,

            Thanks for the RSS & UAH links. Your first two links provide largely similar temperature data from these two sources. They
            appear to show the same stair-step temp increase. Which should be expected from two satellites measuring largely the same thing using a similar MSU method. Your HadCRUT4 data analogs provide interesting information. However, as suggested above I do not put much stock in global temperature data constructions prior to 1979 since they can at best involve spotty airplane, balloon and/or surface data. While step-changes may or may not be error, global averages obtained from data prior to 1979 will probably inevitably fall victim to numerous assumptions, biases and errors to numerous to account or control for. All that said pre 1979 data sets may provide excellent regional data and I do appreciate the link and effort on your part. Thanks again for the assist.

          • Cupsui says:

            So you don’t put anything into the earlier data because you don’t like the look of it right?!

            Sure the data isn’t as reliable but its not like they are just completely wrong. They are within a margin of error (as is all data) its just that this margin is going to be greater. But the trend is still the same. temps were rising before 1979 and while the increases have slowed (a little) they are still increasing. Even in your “golden age” since 1979

            Variation is going to occur with or without climate change hence why there are so many troughs and peaks.

        • barry says:

          Final comment. I should probably have done this the first time around.

          There are ‘step changes’ for HadCRUt3, HadCRUt4, and GISS, using the same periods and break as the satellite records. Doesn’t look like the result is due to satellite data error.

    • JCH says:

      The key Land and Ocean series are all very similar. The satellite series have a start date. That start date, imo, distorts the trend.

      Somebody needs to create a satellite-like record before 1979. Say from 1970 to 1979. It seems like there is enough satellite data now to do a fairly accurate facsimile of earlier years. I think that would result in a trend that is very similar to that of Gistemp or HadCrut4.

  20. Dan Pangburn says:

    Four papers on the web, that you may find of interest, provide some eye-opening insight on the cause of change to average global temperature and why it has stopped warming. (The recent UAH up tick must be considered in light of historical stochastic s.d. approximately +/- 0.1 K.) The papers are straight-forward calculations using readily available data up to May, 2013.

    The first one is ‘Global warming made simple’ at http://lowaltitudeclouds.blogspot.com/ . It shows, with simple thermal radiation calculations, how a tiny change in the amount of low-altitude clouds could account for half of the average global temperature change in the 20th century, and what could have caused that tiny cloud change. (The other half of the temperature change is from net average natural ocean oscillation which is dominated by the PDO)

    The second paper is ‘Natural Climate change has been hiding in plain sight’ at http://climatechange90.blogspot.com/2013/05/natural-climate-change-has-been.html . This paper presents a simple equation that, using a single external forcing, calculates average global temperatures since they have been accurately measured world wide (about 1895) with an accuracy of 90%, irrespective of whether the influence of CO2 is included or not. The equation uses a proxy which is the time-integral of sunspot numbers. A graph is included which shows the calculated trajectory overlaid on measurements.

    Change to the level of atmospheric CO2 had no significant effect on average global temperature.

    A third paper, ‘The End of Global Warming’ at http://endofgw.blogspot.com/ expands recent (since 1996) measurements and includes a graph showing the growing separation between the rising CO2 and not-rising average global temperature.

    The fourth paper http://consensusmistakes.blogspot.com/ exposes some of the mistakes that have been made by the ‘Consensus’ and the IPCC

    • None of these links leads to scientific papers, only to opinion articles on opinion blogs with different urls, apparently created and written all by you. Are you creating a new blog for every new opinion article that you write?

      • Dan Pangburn says:

        They are mostly engineering calculations that were made using accepted credible data. Feel free to point out any specific errors in the math or logic.

      • Chris says:

        The following link shows two temperature change charts. The one on the left is attributed entirely to natural causes, and the one on the right has generally been attributed entirely to AGW.

        Can you explain the natural causes that caused the change on the left, and can you explain why these natural causes were 0 on the right?

        http://www.woodfortrees.org/plot/hadcrut3gl/mean:12/from:1910/to:1944/plot/hadcrut3gl/mean:12/from:1964/to:1997.6/offset:-0.35

        You need to be specific and address the original cause of the change, and not wave your hands and say its the result of some computer simulation.

        If you cant explain the past, what hope do you have of explaining the future?

        • Dan Pangburn says:

          Cris – I have compared HadCRUT3, HadCRUT4, NOAA and GISS from 1880 to now. All exhibit trends with similar periodicities and magnitudes. The graph shown in http://climatechange90.blogspot.com/2013/05/natural-climate-change-has-been.html is a normalized average of these. These all use essentially the same raw temperature measurement data base. Each group processes the data slightly differently from the others. Each believes that their method is most accurate. To avoid bias, each anomaly trajectory is shifted (reference-temperature change only) so its average is the same as the average for HadCRUT4 over the time period for which both are given and then the average from the available values (as-shifted if not HadCRUT4) for each year is calculated. The graphs that you reference (after accounting for the 0.35 offset of the right-hand (green) trace) match quite closely the graph of the average. Look at my graph to put the two traces that you reference in context.

          Firstly the rapid (year-to-year) oscillations are not physical. The huge effective thermal capacitance of the oceans prevents them. They are artifacts that result from random uncertainty (equivalent s.d. ≈ ± 0.1 K) introduced by the measurement methodology. Thus about the only thing immediately useful from the measurements are the position and slope of the trends.

          The equation places the lows at 1909 and 1973 and the highs at 1941 and 2005. Including the last 9 years of the down trend from 1941 to 1973 in the green trace creates the false illusion that the uptrend of the red trace is steeper than the green.

          Atmospheric CO2 level rose rapidly during the period following 1973 as did the temperature. This caused many to see the correlation and deduce cause and effect. With appropriate scale factors applied, it was erroneously concluded that the rise in temperature was caused by the rise in CO2, i.e. AGW. What hardly anyone noticed is that the net energy gained by the planet as determined using the time-integral of sunspot numbers as proxy also rose rapidly during that period. This is shown in a graph on page three of an earlier (and otherwise superseded) paper at http://climaterealists.com/attachments/ftp/Verification%20Dan%20P.pdf .

          Both traces in your reference are the sum of (1) natural ocean surface temperature oscillation and (2) the time-integral of sunspot numbers (with appropriate proxy factor). The red trace was caused mostly by natural ocean surface temperature oscillation uptrend because the sunspot time-integral was in a slight down trend. The period 1941-1973 was only slightly down trend because the sunspot time-integral was still going down while ocean surface temperature oscillation was going up. After 1973, both ocean surface temperature and sunspot time-integral were going up.

          Instead of just the period 1973-2005 which correlates with CO2, however, the time-integral of sunspot numbers, combined with ocean oscillations, matches all temperatures since before 1900 with an R2 of 0.9. Atmospheric carbon dioxide change had no significant influence.

          I agree that if you can’t explain the past, you can’t hope to explain the future.

          • Chris says:

            Thanks for taking the time to answer. I still don’t get why the IPCC needs to invoke different explainations for what appear to be very similar changes in temperature – I suppose that is another story. Many people don’t even seem to know that early 20th century temperature changed in a similar way to what happened late in the century.

            I can understand in a qualitative way why ocean surface temperature affects the weather, but I find that part of your explanation somewhat empty. What is it that is actually driving these changes – especially when the oscillations vary from a few years to a few decades – and even a hint that some oscillations might be a few centuries.

            Further if one makes the assumption that heat can be hidden in the oceans depths, then that begs the question of both when that heat will return, and also what effect are events from hundreds of years ago having on our current weather.

            Finally, on a slightly different topic, great reliance is placed on computer modelling. My understanding is that the models are run, then parameters adjusted until the simulation matches the known data, and then allowed to run into the future. Even if the known data was perfect, I recall being warned against extrapolating data for functions of only one variable. In this much more complex situation of many parameters, where the known data uses a range of measuring techniques, at locations where there is no control of external influences, even if the model is perfect, the parameters will be wrong as the known data is not consistent. Given that we know the model is not perfect, and the known data is inconsistent why is any faith placed in the computer models at all – other than for scientific curiosity.

    • Bertrand says:

      Dan: If global warmin ended in 1996, why are the oceans hotting up?

      • Chris says:

        Surface temperatures dont look like there going anywhere either.

        http://www.woodfortrees.org/plot/hadsst3gl/from:1997/mean:12

        From 1990 – 2000 we must mesaure global warming using air temperature, then from 2000 – 2002 on we must mearure the ocean surface temperature and then we must use the deep ocean temperature. What will it be this decade?

        Personnally I think it is more believable that the same force that caused temperature increases from 1910 were the same as caused the increase in the late 20th century. I don’t know what that is – do you, or does anybody know?

        Here in Australia AGW predicted that our rivers would dry up and never fill again.

        That is not consistent with the actual observations.

        Actual global temperatures are not consistent with the predictions either.

        If you were a physicist, or chemist that would be enough for your theory to be discredited.

        I don’t understand why climate “scientists” are not under the same scrunity.

        • In 1880-1890 the planet was cooling -0.4 degrees. Germany developed its agriculture importing Chilean nitrate (NaNo3). 1910-1912 German cargo ships sink in ocean blocking the import of nitrate. Haber & Bosch develops the manufacture of ammonia directly from the atmosphere. 1914 explodes the great world war. 1920 American’s industrial spy the proscesso can copy the manufacturing of ammonia and begins to spread around the world, with fertilization of amönia derived.The planet begins to warm. 1945 explodes 2a War.
          Ammonium is diverted from agriculture to manufacturing explosives. The planet back to cool. The sequence from here all know.
          Explanation ….. ammonium solubilizes the ground clay in the soil falling the soil profile blocks pores and micropores thus hindering the water storage. We do not have sufficient water for evaporation and convective motion by a moist adiabatic. Alters the distribution of energy in the profile of the atmosphere and so…warm the planet.

        • Cupsui says:

          Here in Australia the rivers dried up from one of the worst draughts in history then filled up by some of the worst floods the country has seen…

      • Dan Pangburn says:

        The equation puts the peak in 2005 although the trend has been flat since 2001.

        I am aware of claims of recent increased deep ocean heat content. Why would the heat suddenly start showing up down there? Even if it is warmer than it was down there, it is colder than the surface. How does the increased heat get to the surface and influence AGT? If it actually exists and when it shows up at the surface, it will be taken in to account. Meanwhile, most people live at or near the surface.

  21. nigel says:

    10 days at a high school reunion?
    10 minutes would be enough for me.

  22. nigel says:

    Regarding the sunspot cycle 24, I refer yo’all to
    the Astrophysical Journal, 693, 1173-1177, 2009 March 10:

    “NonLinear Prediction of Solar Cycle 24”
    by A Kilcik et al.

    “…we forecast that Cycle 24 will reach its maximum
    in 2012 December at approx. 87 sunspot units.”

    So far, we have a maximum, in 2012 November, at 95 sunspot units.

    Seems a pretty damn good forecast to me.

    They also predict a general, marked reduction in sunspot
    activity to 2050.

    • Stephen Richards says:

      That is not the forecast or the measurement given by NASA. There no. is 67 date of max uncertain.

  23. I have been saying once these solar parameters are met and sustained then the temperatures will decline.

    The parameters are

    solar flux sub 72
    solar wind sub 350 km/sec or lower
    ap index 5.0 or lower 98%+ of the time spikes the other 1%
    solar irradiance off .15% to .2 % or even more

    uv light off upwards of 35%

    If you notice these values have not been attained since the maximum of solar cycle 24 arrived 2 years or so ago. Once this maximum of solar cycle 24 passes by which will be in the near future(within 6 months likely) those solar parameters I mentined should be attained and be with us for over 20 years.

    I expect the decline in temp. to then set in.

    I NEVER said the temperatures would decline with moderate solar activity which is what we have had for the past 2 years or so. Solar maximum 24 although very very weak for a solar maximum is still a maximum and has brought overall solar activity to the moderate range of late. This will soon be a thing of the past and we will then find out.

    This time when very low solar values are met ,as they were from 2008-2010, the number of years of sub-solar activity will be much longer, the ocean heat content influence will be less, and the solar conditions of QUIET this time should last for many many years, not just two or three years.

    • Cupsui says:

      So with the temperatures as high as they have ever been in our history and right up there with all time. You are telling us this is a weak max. in a “moderate solar activity”. So what happens when we go to a high solar activity, let alone a solar max in a high solar activity?! the temps will be off the charts.

      Clearly the sun has a huge influence on climate but what you are missing is that the gases that trap heat energy in the atmosphere clearly have a huge influence too. hence why the moon is so freaking cold during the lunar night. hence why mercury goes -187 C to 427 C…

  24. Bertrand, your side has been saying for years and years that the temperature would go up. 17 years and counting with no temperature rise.

    • And here a fact check. Temperature trends in Kelvin per decade since 1996.5 (about 17 years) with 2 sigma intervals.

      GISTEMP: +0.087+/-0.123 (.gt. 80% statistically significant)
      NOAA: +0.064+/-0.116 (.gt. 70% statistically significant)
      HadCRUT4: +0.07+/-0.12 (.gt. 75% statistically significant)
      RSS: +0.009+/-0.205 (not significant)
      UAH: +0.099+/-0.207 (.lt. 1 sigma)

      (http://www.skepticalscience.com/trend.php)

      • Dan Pangburn says:

        The data from these 5 agencies are all plotted on the same graph in Figure 1 at http://endofgw.blogspot.com/ . Look there and see why that ‘warmer’ site picked 1996 as the starting year. If you start in 2001, the trend of the average of all 5 is flat.

        • Bertrand says:

          “17 years” wasn’t my choice.
          It’s not a very good one, which is why most people choose 30 years.

          • Dan Pangburn says:

            The 30 year choice is arbitrary. Most people also use a linear regression. A linear regression, like all other curve fits, is a statistical process on existing data that has no predictive ability. To be predictive, a method must be based on the physical phenomena involved. Physical phenomena were used to develop the equation at http://climatechange90.blogspot.com/2013/05/natural-climate-change-has-been.html . But prediction by this depends on future sunspot numbers and future ocean surface temperature oscillation behavior, neither of which has been confidently predicted for more than a decade or so. This is discussed further at http://endofgw.blogspot.com/ .

        • Cupsui says:

          Seriously you are choosing a smaller cycle. There are obviously fluctuations caused by things such as el nino etc. look at a longer period. Say since industrial revolution and you see a 150yr increase that is unprecedented…

  25. Also earth’s magnetic field is in a sustained weakening trend ,and the weaker the geomagnetic field is, the greater the effects will be from solar conditions.

    More cosmic rays ,more muons or changes in concentrations of them, with weak solar/geomagnetic fields could or are thought to make the tetonic plates of the earth slightly more unstable which might promote an increase in geological activity. Volcanic activity,colder temp. but lined to solar activity.

    Not to mention any solar storms in a mostly very weak solar conditions for 99% of the time , and a weaken geomagnetic field would probably be much more significant, then would be the case under other conditions.

    Time wil tell

  26. But who determines the climate is CO2?
    Let us make two simple experiments.
    1 – With an infrared thermometer try to measure in a flame of gas lighter, the flame temperature and the temperature of the gases CO2 and water vapor to 4 inches above the flame. We will see that the gases extracted from a flame at about 2,000 degrees but not submitted atraz the wall temperature of the flame as the flame is between 90 and 95 degrees centigrade. Proof that CO2 and water vapor has no power to transmit IR.
    2 – Let us take the site http://weater.uwyo.edu/cgi-bin/soundeing.html the pool’s Manaus-Amazonas – Brazil 12Z (08AM) and 00Z (8pm) we calculate the variations of each 100mb amount of steam. This change is the transformation of water into steam droplet. Compute the total energy stored in the form of latent heat to be discharged during the night and find him as media for 12 hours 735w/m2 that halved indicates that 367.5 w/m2 will be sent into space and sent 367.5 w/m2 the ground as counter-radiation or greenhouse. Nothing to do with CO2.
    3 – To complete. The transmission efficiency of electromagnetic waves is limited to the body of half wavelength. Water droplets with d>4 microns.

  27. nigel says:

    Stephen Richards says:

    That is not the forecast or the measurement
    given by NASA.

    Indeed: these are the ISES figures. Which all will
    understand are calculated with such an algorithm as
    to have a sytematic difference from NASA figures.

    There [sic] number is 67 date of max uncertain.

    There is still a (fading) possibility that there will be
    a renewed run-up in the numbers. That is why I wrote
    “so far”.

  28. nigel says:

    “Syst-ematic” of course, not “sy-tematic”.

  29. nigel says:

    The main points of Salvatore, of course, are:

    the slight increase in temperatures, noticed in
    some series over the last 120 years, has been
    associated with an increase in sunspot activity;

    some theories predict a decrease in sunspot activity
    over the next 40 years;

    perhaps there will be a corresponding decrease in
    the temperature series.

    A very simple story, in essence. We shall see.

  30. nigel says:

    “67” is, most likely, the smoothed number
    made from the individual monthly numbers.

  31. nigel says:

    I made a mistake. The maximum to date was in
    November 2011, (not 2012) and the smoothed
    maximum was in January 2012.

    Those damn charts with years along the bottom
    are so hard to read.

  32. Exactly my argument Nigel.

  33. ML says:

    The island of Rongelap, which now belongs to the Marshall Islands, is an atoll of three square miles, with, at last count, a population of 19 persons. It was discovered by Spanish navigators in 1527.

    By the assertions of proponents of climate change theory, this island would, along with a number of other areas, become inundated if rising temperatures change sea levels. Likewise, you, not accepting the climate change theory (more correctly–the idea of a high-sensitivity climate system), are arguing, from this layperson’s perspective, that Rongelap will not disappear and maps will not be updated. Its “disappearance” would solely be attributed to anthropogenic activities.

  34. The only sunspot data that is useful is the layman sunspot data. All the rest is useless.

    layman sunspot data shows solar cycle 24 being the WEAKEST cycle since solar cycle 5.

    sunspot cycle 24 is tracking sunspot solar cycle 5.

  35. RichardLH says:

    How far down , timewise, into the complex load response that is the Earth’s redcution of the Sun’s input (1461 days), do you think Solar output variations will show up?

    Surely, given the smoothing timespans that are being used, an overall RMS value of the cycle would be the most usefull?

  36. Lewis Guignarfd says:

    Gentlemen,

    Always interesting to read the comments of those who are so well versed in the ideas and science. I find especially interesting the thoughts on AGW etc, as my personal focus is more on politics. What has been commented on recently includes a comment by John K. (July 11th – 7:25 PM)referring to the use of AGW etc by proponents as a way to control economic assets. Having long been a proponent of that view I take it a small step farther. The arguments about AGW etc are about whether man influences the climate by his actions. Some proponents of this argue that we should stop adding GHG’s to the atmosphere in order to stop man’s influence. Perhaps, but to that view should be added this: will stopping or changing man’s additions to the atmosphere cause the climate to remain the same? If the answer is not an unequivocal yes, then why should we?

    The true answer has to do with using AGW/GHG arguments as a method of control of industrial society which, it is well proven, has been a great boon to mankind. But fear not. The fact that Pr. Obama is intent on shutting down coal fired electrical generations facilities is only a blip on the screen. The coal will remain in the ground for those of the future to use when their need becomes strong enough to overcome the nay-sayers.

    Perhaps solar will become economical feasible in the meantime. If so, great. In the meantime, the oceans will grow and shrink and I, personally, prefer warm to another iceage.

  37. Lewis Guignard says:

    Misspelled my own name.

  38. RichardLH says:

    Lewis Guignarfd says:
    July 12, 2013 at 4:28 AM

    “I, personally, prefer warm to another iceage.”

    Well this design should work well in colder climates. Larger thermal diode then 🙂

    http://i1291.photobucket.com/albums/b550/RichardLH/solar_zps30776dd1.png

    • Bertrand says:

      “I, personally, prefer warm to another iceage.”

      What about the other trillions of beings on this planet?

      • Lewis Guignard says:

        It seems there are plenty of reptiles who would prefer warmer, insects as well. Don’t think most mammmals will prefer ice. (bacteria, viruses, algae, plankton etc didn’t poll well) No, it only seems to be a minority of humans who are concerned that the hydrocarbon producing facilities/machines of man are adding CO2 to the atmosphere. Nor do they care if that is related to global warming and don’t see GCW as a bad thing in any case. Nope, most of the beings seem to prefer warm to iceages. It is only those who wish to control their fellow humans and those who have built their artificial caves on the coasts of Florida and elsewhere and are afraid of loss of prime real estate along the coast who are advocating drastic change in man’s behavior to assuage their selfish concerns. Note – higher CO2 concentrations and longer growing seasons do much positive for agriculture. Canadians and Russians are both happy for the positive effects. (I just hope Salvatore is wrong)

        • Bertrand says:

          Many times throughout history where CO2 has spiked (much slower than today) have seen mass extinctions. Animals cannot adapt fast enough, and ocean currents change or cease. It is by no means obvious this spike will be any different.

          • Scott Basinger says:

            And with all those mass extinctions, over millions of years, life goes on to where you are today…

  39. IT LOOKS LIKE THE END OF THE SOLAR MAXIMUM PERIOD OF SUNSPOT CYCLE 24 COULD BE WINDING DOWN.

    N.H. SUNSPOTS NO LONGER HAPPENING. A VERY GOOD CLUE THAT THE CURRENT MAXIMUM COULD BE COMING TO A CLOSE.S.H. NEVER REALLY GOT STARTED. ANOTHER VERY GOOD CLUE.

    This is what I have along with others have been saying about the sun, in direct opposition to NASA, who as recently as 2008 predicted sunspot cycle 24 would be one of the strongest on record, and recently and now many have been predicting this cycle would be like solar cycle 14. WRONG/WRONG.

    LAYMAN SUNSPOT SITE HAS HAD IT RIGHT AL ALONG. THEIR THEORY IS ANGULAR MOMENTUM OF THE PLANETS IS THE CAUSE OF MANY /FEW SUNSPOTS. I CONCUR.

    This cycle,cycle 24 ,is as weak if not weaker then solar cycle 5 associated with the DALTON MINIMUM.

    It is looking like the first part is right, which was solar activity is going to be very weak and stay that way for decades.

    The second part is, will this very weak solar activity and all the secondary effects we think are associated with it have an impact on the climate?

    I say yes, and I say if the sun reaches a solar flux reading of less then 90 that will be enough to start the temp. decline much less sub 72 which I think will be the rule once the maximum of solar cycle 24 is gone, which will be soon.

  40. The Peculiarity of Methane says:

    Two graphs on the subject of methane are interesting and I have copied the links. It is the Global average methane mixing ratios from the GMD cooperative air sampling network.

    http://en.wikipedia.org/wiki/File:Methane-global-average-2006.jpg

    This is a more updated version
    http://en.wikipedia.org/wiki/File:Mlo_ch4_ts_obs_03437.png

    Methane concentrations are increasing, but the increase itself is lagging. It was more dramatic up to about 1998, moving from 1690 to 1770 nmol/mol, but then, leading up to 2006, reached a sort of plateau, and then moved up again to where it is at present at about 1820.

    This is in major contrast to the Keeling Curve, where CO2 has been without any complex characterizations other than one simple upward line. But with CH4, it is 80 nmol in 14y, and only 50 in essentially the next 15y. There have also been studies which suggest that methane release could cause temperature declines (burning of particles in the atmosphere causing negative feedback) and that the scenario of a dramatic change in climate is less likely on account of the nature of the gas itself.

    The temperature record is also interesting, and this is something I cannot reconcile. From the NASA temperature anomaly, I took offhand decadal averages for years ending 1989, 1994 etc. and compared. The 1991 Pinatubo eruption accounts for declines during the early 1990s.
    Decadal Change, decade ending 1979/89: +22
    Decadal Change, decade ending 1984/94: +17
    Decadal Change, decade ending 1989/99: +13
    Decadal Change, decade ending 1994/04: +29
    Decadal Change, decade ending 1999/09: +23

    Also took an average for readings July 1993–June 2003 and July 2003–June 2013, and the difference is +20. This suggests a declining trend in an increase of the increase.

    HOWEVER, that is not all. February, 1994 was the last single-digit global reading, as the effects of Pinatubo subsided, and if I compare the average for 1994–2004 with JL03–JE13, then this change is remarkably less: +14.

    Readings in the immediate future will need to show an even greater increase in temperature to keep pace. I have a book from 1992 which mentions the IPCC’s projected decadal increase of +0.30C. This is not happening. What is also thoroughly elusive is that the first decade of the century did not “compensate” for the lack of warming caused by Pinatubo in the 1990s average.

    • Bertrand says:

      What book from 1992?

      Is science allowed to refine its predictions as methods, observations, and computers improves?

      Do you want to know what else science didn’t understand in 1992? (Start with dark energy, for one.)

      • The Peculiarity of Methane says:

        The book is, my thrift store treasure, Encyclopaedia Britannica Science Book of the Year 1992 (1991).

        What little we all knew two decades ago. My point was not about the abilities of methodological refinement; my point is that the IPCC (probably circa 1988) made a prediction that the decadal increase in temps would be +30C above the average anomalous trend. It is this figure that is the question. Of course, they could make refined measurements, but in so doing the number that is being observed is, consequently, LESS than what they are predicting. It is the NUMBER that is the issue. An impending crisis of any sort depends on what that the prediction is.

        Yet, to be fair, you may look at my average difference for decades ending 1994/2004 and call that +29C very close; but the caveat to that is that the warming at the beginning of the century was the “veritable compensation” for the effects of temperature from the previous decade from the Pinatubo eruption. What happened beginning 1998 or so was that “correction,” or in essence the lack of one.

        I am really looking for an explanation to the trend I am describing, both in the temp record and in the irregular methane concentrations record.

      • John K says:

        Bertrand,

        You hilariously declared:

        “Do you want to know what else science didn’t understand in 1992? (Start with dark energy, for one.)”

        Guess what! Scientists still don’t understand dark energy in 2013. Dark matter/energy has never been observed, but has been conjured up to explain the tight formations of galaxies and other phenomenon that Newtonian physics and Einstein’s theories cannot explain. They could just as well call it “mysterious energy.” The label simply points out what everyone already knows. They haven’t a clue.

  41. torontoann says:

    Bertrand asks we take into account the trillions
    of other beings on the planet. I am one of them.
    I vote for “warm” ,’cos I get chilblains.

    Somebody else asked for a data series that did not
    show global warming in the last 120 years. I do not know
    about “global”, but there are plenty of
    individual and regional series. For example
    the United States Historical Climate Network
    temperature data before (cough, cough) adjustments.
    An NOAA report on the matter states:

    The cumulative effect of all adjustments is approximately
    a one-half degree Fahrenheit warming in the annual
    time series over a 50-year period from the 1940’s
    to the last decade of the [20th] century.”

  42. torontoann says:

    I have now consulted the bacteria in
    my gut, and obtained their proxies*.
    That makes 100-trillion + 1 votes for warm!

    * Was I wrong to threaten them with “a good dose of salts”
    if they didn’t agree?

  43. I think the start of the temperature decline will commence within six months of the end of solar cycle 24 maximum and should last for at least 30+ years.
    My question is how does the decline take shape, is it slow and gradual or in jagged movements as thresholds are met. I think some jagged movements then a leveling off then another jerk etc etc. Will thresholds be met?

    I KNOW THEY ARE OUT THERE.

    I think the maximum of solar cycle 24 ends within 6 months, and once the sun winds down from this maximum it is going to be extremely quiet.

    Solar flux sub 72, although sub 90 is probably low enough.
    Solar Wind sub 350 km/sec.
    AP INDEX 5.0 or lower 98+ % of the time.
    Solar Irradiance off .2% or greater.
    UV light off upwards of 50% in the extreme short wavelengths.

    This conditon was largely acheived in years 2008-2010 but the number of sub- solar years of activity proceeding theese readings back then was only 3 or 4 years, this time it wil over 8+ years of sub- solar activity, and no weak solar maximum wil be forthcoming.

    Lag times come into play mostly due to the oceans.

    It is clear that the greenhouse effect ,how effective it is ,is a result of energy coming into and leaving the earth climatic system. The warmer the oceans the more effective the greenhouse effect and vice versa.

    With oceans cooling in response to a decrease in solar visible light the amounts of co2/water vapor will be on the decrease thus making the greenhouse effect less effective going forward. At the same time the albedo of earth will be on the increase due to more low clouds,ice and snow cover.

    ROUTE CAUSE OF THE CLIMATE TO CHANGE

    Vey weak solar magnetic fields, and a declining weak unstable geomagnetic field, and all the secondary feedbacks associated with this condition.

    SOME SECONDARY EFFECTS WITH WEAK MAGNETIC FIELDS

    weaker solar irradiance
    weaker solar wind
    increase in cosmic rays
    increase in volcanic activity
    decrease in ocean heat content
    a more meridional atmospheric circulation
    more La Ninas ,less El Ninos
    cold Pdo /Amo

    I say the start of a significant cooling period is on our doorstep, it is months away. Once solar cycle 24 maximum ends it starts.

    This has happened 18 times in the past 7500 years(little ice ages and or cooling periods ) ,number 19 is going to take place now.

    Two of the most recent ones are the Maunder Minimum(1645-1700) and the Dalton Minimumm(1790-1830).

    I say this one 2014- 2050??

  44. MikeR says:

    Dr. Spencer, what has become of the Sea Surface Temperature updates? Thanks.
    Congratulations on your testimony in Congress.

  45. Susan says:

    My partner and I stumbled over here coming from a different website and thought I might as well check things out.

    I like what I see so now i am following you. Look forward to going
    over your web page again.

  46. Marcus says:

    Hi There. Any idea when this dataset will be updated?

    http://vortex.nsstc.uah.edu/data/msu/t2lt/uahncdc.lt

  47. Thank you for letting us discover your works. I had a great time reading this! Amazing job!
    https://electrician-minto.com.au/

Leave a Reply