UAH v5.6 Global Temperature Update for July, 2013: +0.17 deg. C

August 2nd, 2013 by Roy W. Spencer, Ph. D.

The Version 5.6 global average lower tropospheric temperature (LT) anomaly for July, 2013 is +0.17 deg. C (click for large version):
UAH_LT_1979_thru_July_2013_v5.6

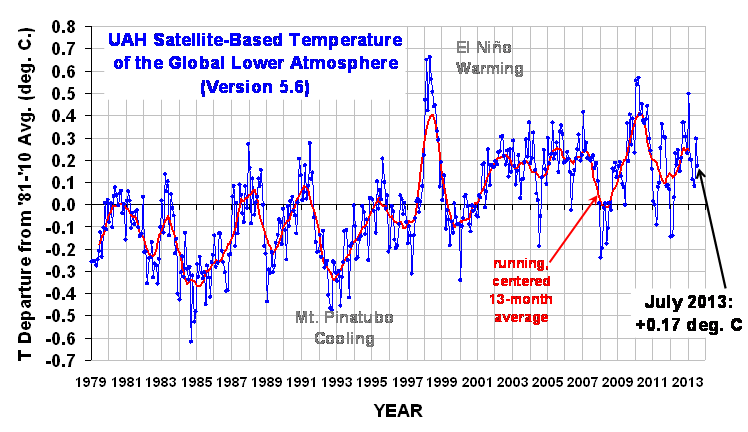
The global, hemispheric, and tropical LT anomalies from the 30-year (1981-2010) average for the last 19 months are:

YR MON GLOBAL NH SH TROPICS
2012 1 -0.145 -0.088 -0.203 -0.245
2012 2 -0.140 -0.016 -0.263 -0.326
2012 3 +0.033 +0.064 +0.002 -0.238
2012 4 +0.230 +0.346 +0.114 -0.251
2012 5 +0.178 +0.338 +0.018 -0.102
2012 6 +0.244 +0.378 +0.111 -0.016
2012 7 +0.149 +0.263 +0.035 +0.146
2012 8 +0.210 +0.195 +0.225 +0.069
2012 9 +0.369 +0.376 +0.361 +0.174
2012 10 +0.367 +0.326 +0.409 +0.155
2012 11 +0.305 +0.319 +0.292 +0.209
2012 12 +0.229 +0.153 +0.305 +0.199
2013 1 +0.497 +0.512 +0.481 +0.387
2013 2 +0.203 +0.372 +0.034 +0.195
2013 3 +0.200 +0.333 +0.068 +0.243
2013 4 +0.114 +0.128 +0.101 +0.165
2013 5 +0.083 +0.180 -0.015 +0.112
2013 6 +0.295 +0.334 +0.255 +0.219
2013 7 +0.174 +0.134 +0.215 +0.077

Note: In the previous version (v5.5, still provided due to contract with NCDC) the temps are slightly cooler, probably due to the uncorrected diurnal drift of NOAA-18. Recall in v5.6 we include METOP-A and NOAA-19, and since June they are the only two satellites in the v5.6 dataset whereas v5.5 does not include METOP-A and NOAA-19.

New names of popular files:

uahncdc_lt_5.6
uahncdc_mt_5.6
uahncdc_ls_5.6


104 Responses to “UAH v5.6 Global Temperature Update for July, 2013: +0.17 deg. C”

Toggle Trackbacks

  1. Another month absent increased warming.

    Once the maximum of solar cycle 24 passes by the trend in temperatures will be down.

    The solar parameters(below) have yet to be reached in a long enough duration of time or a degree of magnitude consistent enough to cause a definitive temperature drop in my opinion, and yet the temperature rise is no longer.

    Readings needed

    solar flux sub 90 , but sub. 72 very significant

    ap index sub 5.0 (98+% of time)

    solar wind sub 350 km/sec sub 300km very significant

    uv light off 50%+

    solar irradiance off .15% +

    following several years of sub-solar activity in general which started in earnest in late 2005.

    Ocean Heat Content is high due to the strong solar activity of last century but this will be diminishing as the prolonged solar minimum continues.

    Will the climate reach thresholds due to secondary effects brought about by very quiet prolonged solar minimum conditions? I don’t know. If they should be reached then the temperature change could be rapid ,if not it will be slow and gradual but the trend is down,down ,down for the rest of this decade.
    The bottom line at present is CO2 is still increasing while the temperatures are no longer increasing.

    • David Appell says:

      The bottom line at present is CO2 is still increasing while the temperatures are no longer increasing.

      Well, at least not on the surface (which is about the worst place to look for a GHG-induced energy imbalance). But the 0-700 m layer of the ocean has warmed 40% more in the last 15 years than in the 15 years before.

      Data:
      http://data.nodc.noaa.gov/woa/DATA_ANALYSIS/3M_HEAT_CONTENT/DATA/basin/3month/ohc_levitus_climdash_seasonal.csv

      • Perfekt says:

        But it is surface temps that the warmists have claimed should be higher according to their settled science models.

        The models say nothing about warming disappearing soewhere else.

        Ergo: BIG FAIL!
        Why should we trust you again?

        • David Appell says:

          The models say nothing about warming disappearing soewhere else.

          False. See

          “Separating signal and noise in atmospheric temperature changes: The importance of timescale,” B. D. Santer et al, JOURNAL OF GEOPHYSICAL RESEARCH, VOL. 116, D22105, doi:10.1029/2011JD016263, 2011

          among many other papers.

          • Perfekt says:

            After the fact, yes. Did the gold standard settled science of 2007 say anything about it? NO!

            These people make it up as they go.

        • Hops says:

          If you look at a long-term chart of the differences from the mean, you see long stretches of time in which the temperature not only didn’t change, but went down. It went down considerably from ~1940 to ~1950, and there was no net change from 1940 to 1980, yet there was a distinct up trend from 1880 to the present.

          Can you imagine how assertive the skeptics would be if the anomaly went down for a decade? But maybe that just doesn’t happen anymore, in which case, that’s a big change.

          http://www.nasa.gov/images/content/616910main_gisstemp_2011_graph_lrg%5B1%5D.jpg

          In the mean time, the current anomaly is still pulling the trend line up, or to look at it another way, a running average over 20 years or more would still be going up as cooler years drop out of the sample.

      • Stuart L says:

        How does heat pass through the thermoclime?

      • david says:

        funny, now that the atmosphere ain’t warming anymore, we’ll quickly refer to the ocean(s) instead…!?!? Please stick to your guns; AGW theory is based on a warming atmosphere, due to increase levels of atmospheric CO2 from manmade sources. It is not based on a warming ocean. IF that be the case, then the CO2-link theory is nullified. Please explain therefore why the atmosphere is not warmING anymore, but don’t refer to something else. That’s a diversion technique used by 3yr olds…

        Here’s a very simple idea to explain the observations: cycles! That’s a new one!?! These cycles are around 32yrs and plain to see for everybody in the data. Referring to the longest data-record: HadCrut4, there’s a clear cooling cycle from 1880 to 1910, then warming from 1910 to 1945, followed by cooling from 1945 to 1975, and finally warming from 1975 to 2007, cooling since (and suggested to continue until mid 2030s…). No denying that, loud and clear to see without even doing any data-analyses, which if you did would show it!

        Based on these cycles, global temperatures appear to increase by on average 0.5C during the warming cycles and decease by around 0.2C during the cooling cycles, suggesting a net-warming of around 0.25C/~64yrs since 1850 (which is 2-4x less than the model predictions used by the IPCC…). Using linear regression the slope of the regression line is estimated at 0.0047C/yr for the entire HadCrut4 data, starting 1850, translating to 0.30C/64yrs since 1850, which is in line with the net-warming based on the 32yr cycles. However, since global temperatures are clearly cyclical, applying linear regression is incorrect. Cyclical stochastic trend analyses is the correct way!

        Everything goes in cycles, from the day/night cycle to the seasonal cycle, to the ocean’s ENSO cycle, to the planetary cycles, etc. Hell, we all know also the 30day menstrual cycle, stock market cycles, societal cycles, etc. EVERYTHING goes in cycles. All these cycles are common knowledge, though when it comes to AGW the science and it’s (model) predictions become all of a sudden linear… weird…

        It’s staring us right in the face, open your eyes and see it!

        • cloudpoint says:

          The end result of all these ‘cycles’ is to leave the planet warmer than it was before. They are really just rise, flat, rise, flat sequences for the most part, just as we are seeing a flat one now. That’s the normal pattern for any data that contains more noise than the signal that one wants to measure.

          The cooling periods you allude to were no more than a drop back to the long term trend after some noise that pushed things ahead of the long term trend at some point. The long term surface warming trend hasn’t changed for decades other than showing a slight increase.

          • david says:

            I don’t see how you can call a cooling of 0.25C/64yrs a “flat” period, and 0.5C/64yrs a “rise”? Cooling is cooling, as much as warming is warming. Please leave subjective terms out of objective science. Also, data analyses of the HadCrut4 dataset shows that the warming isn’t increasing at all; one has to go back more than 15yrs to find a statistically significant warming trend.

            they key is that one can’t apply linear methods (or linear thinking) in cyclical data. That’s statistically, scientifically, etc incorrect. What you refer to as the LT trend is -in this case- nothing more than a trend SINCE 1850. We need to allude to this fact every time when stating trends etc. Simply because it are trends determined in that particular data set.

            That said; atmospheric CO2 levels have increased and continue to increase at an almost linear rate since 1958 (note that also CO2 concentrations are cyclical on an annual scale… see cycles are EVERYWHERE!!!). The clear cyclical nature of GSTA, albeit a net-warming since 1850, do therefore not support the theory that CO2 is the main driver of climate change/AGW.

            Global temperatures have NOT increased at a linear rate since 1850, they increase cyclically since 1850. Linear regression of the data may provide the same net-warming since 1850 in the end but it’s getting the right answer for the wrong reasons!

            Cyclical stochastic analysis is a more proper model; the right answer for the right reasons. Knowing where GSTA are within the current cycle is key to predicting future GSTA. Currently, based on analyses of the HadCrut4 data, GSTA are in a cooling cycle, suggesting decreasing temperatures for around 32 yrs. This cooling trend, while atmospheric CO2 concentrations will keep on increasing, rejects the hypothesis that CO2 is the main driver of AGW.

            That is sound science: create a hypothesis, test the hypothesis using measurements, if the measurements disagree with the hypothesis, the hypothesis is wrong. There’s nothing more to it. It doesn’t mean the scientist who made the hypothesis is stupid, an idiot, etc. It simply means the scientist was wrong. Now he needs to adjust his theory and thinking and start over. That’s the ONLY way to advance science.

          • cloudpoint says:

            First, you are examining trees rather than seeing the forest. The recent bout of global warming has raised temperatures by about 0.8 °C since industrialization, 0.75 °C in the last century and over 0.5 °C since 1975 alone. That is not a cycle – it is a clear exponential trend taking us into uncharted territory. Trends need to be considered in light of their magnitude, not just their rate of change (slope). Small magnitude changes can show large but meaningless slopes. They are noise, not signal.

            Second, year-to-year average global temperatures jump around wildly, by the equivalent of a couple decades of the underlying GW signal. There was a 0.29 °C climb from 1976 to the following year and a 0.25 °C drop after 1998. The swings are even bigger measured over several years because of autocorrelation between close years. For example, the 5-year buildup to the mega 1998 El Niño entailed a 0.44°C climb in the average global temperature. Any trend measured from that peak will appear flat or falling since the GW trend was temporarily doubled up. This is all statistical noise that allows easy but false cherry-picking of trends. To cancel out the noise, you need to look at trends over 30-year periods or longer to see what climate is really doing. If you do this, you will find that the CO2 trend and warming trend aligns well.

            Third, the warming trend was increasing up to mid-2007. An extended period of cool and neutral ENSO cycles since 2007 has caused some cooling of the atmosphere. This is not unexpected. When the intensity of solar radiation is at a maximum, during sunspot maxima (2012-2013), the South Pacific Ocean tends to go into its La Niña condition, becoming cooler rather than being warmed by the increased solar insolation (more evaporation and clouds maybe?). Trying to argue that warming hasn’t occurred for 15 years is to ignore the mountains between two valleys and conclude that you are on flat plain, and it ignores temporary physical causes.

            Lastly, as statistical major I know that statistics can be made to show almost any result you really want. Unless you apply proper understanding to what you measure and you can also show a physical basis for what you claim, you are doing statistricks and not statistics.

          • cloudpoint says:

            When someone quotes statistics I always try to check by running the numbers myself.

            You say that average warming was 0.30 °C for each of your two selected 64-year periods since 1850 in the HadCRU4 data set, with alternating 32-year stretches of warming and cooling. Looking at the actual trends using your suggested cherry-picked breakpoints reveals a different story.

            1850.0-1880.0 = 0.04°C/decade, flat
            1880.0-1910.0 = -0.06°C/decade, flat
            1910.0-1945.0 = 0.14°C/decade, rising a lot
            1945.0-1975.0 = -0.01°C/decade, flat
            1975.0-2007.0 = 0.20°C/decade, rising big time
            2007.0-2013.42 = -0.02°C/decade, flat but meaningless

            Furthermore, your two 64-year periods don’t show 0.30 °C of warming each. One has nearly twice as much warming as the other:

            1880.0-1945.0 = 0.05°C/decade = 0.33 °C of total warming
            1945.0-2007.0 = 0.09°C/decade = 0.55°C of total warming

            Your ‘cycles’ are just flat and rise sequences as I said earlier. Your model has no predictive power. And your hypothesis is wrong.

            Essentially you are trying to determine the periodicity of data that has just two complete cycles in it, if indeed they are cycles. Periodicity can only be determined reliably using many cycles, plus you need a physical basis for the cycle even existing. You have neither. More than seven 64-year periods would be needed given the noise within climate data. From what we know about Holocene climate, no 64-year periodicity exists before 1850. There is some evidence of a 1470-year periodicity in North Atlantic Ocean salinity that seems to temporarily (for a century or so) affect the local climate by shifting the location of deep water formation southwards thereby affecting the North Atlantic Drift current strength (the European LIA would be the last instance of this happening).

            Yes there are cycles in nature. You won’t really see them in climate model output because models are designed to remove the cycles and just show the underlying trend. The equivalent thing is done with observations by combining 30 years of observed data since we only have one set of observations. Only these two statistics can be meaningfully compared.

            I doubt very much if there are any externally-driven regular cycles in market data. If there were, investors would only invest at the beginning of each cycle and then bail at the end of each cycle leaving the market high and dry in the opposite cycle. What cycles exist must be internally-driven by the investors. What you sometimes see instead is that some small signal triggers feedbacks leading to a herd mentality or even panic that drives the market into wide swings and then it stabilizes for a while. The proper model here is one that handles stochastic effects in unstable system. Climate is combination of this kind of model and a deterministic model.

            At least we do agree that warming continued up to 2007 per your breakpoint selection, not to 15 years ago. Statistically significant warming only since before 1997 doesn’t mean there wasn’t warming afterwards. It just means you can’t categorically rule out a flat period afterwards given all the noise. But you can be fairly sure there was warming, as you found.

      • tetris says:

        Without any of the heat transfer showing up in the 3000+ Argos sensor data? Alchemy a la Trenberth, anyone?

      • M Hastings says:

        But then wouldn’t we expect more CO2 to be emitted from the ocean also? Have we seen this?

  2. Stephen Wilde says:

    Not going up much is it?

    Just passed the weak peak of solar cycle 24 and El Nino (warming) is clearly fading relative to La Nina (cooling) within the ENSO cycle.

    I agree with Salvatore in broad terms but we have some differences on matters of detail.

    The lower level of solar activity is having an effect on the gradient of equator to poles tropopause height which allows the jets and climate zones to shift equatorward causing longer lines of air mass mixing, more clouds,less energy into the oceans and a skewing of ENSO towards La Nina rather than El Nino with a cooling ocean and atmosphere in due course.

  3. nigel says:

    Yet another month in a “sideways pattern,”
    which has lasted for sixteen years now.
    Any stock which goes nowhere for sixteen
    years is known technically as “a dog!”

  4. nigel says:

    Professor Q.-B Lu of the University of Waterloo has
    yet another explanation for the patterns of the
    last sixty years. He considers increasing CFC’s the
    cause of the late 20th Century warming; and for several
    years now has predicted a pause followed by a cooling,
    as CFC’s have been banned and are disappearing slowly.

    So many plausibilities. The only sure thing is that
    not everybody can be right. And perhaps nobody is right!

  5. Thanks, Dr, Spencer.
    I have updated your graphic in my pages.

  6. Mike Flynn says:

    Oh dear, what can the matter be,
    The Greenhouse Effect has gone down the lavatory,
    I think that I saw it last Friday or Saturday,
    Now it’s gone goodness knows where!

    Live well and prosper,

    Mike Flynn.

  7. Ted says:

    I’m assuming that because of the different land to ocean ratios in the Nthn and Sthn hemispheres, that all all other influences remaining unchanged, that as we shift from Nthn hemisphere summer to Sthn hemisphere summer that we could expect temperatures to fall slightly. Then a slight trend up during the next Nthn summer.

    That is if all other influences were to remain unchanged. So I guess a hypothetical.

    I’m happy to be corrected if I’m missing something.

  8. nigel says:

    I believe these are “anomalies”, comparisons
    with the same month in the past.
    As such they do not need further seasonal correction.
    Of course, there is always the red line in
    the graph, which is a centred 13-month
    moving average – it gives a smoothing over the year.

    The CO2 game is pretty well played out; a zombie theory.

    • nigel says:

      The news release says:

      (a) it is years away;
      (b) it would be much more costly than natural gas.

      Any new technics are welcome – but don’t get any
      ideas about picking my pockets to pay for “pilot plants”.
      Opec, the Seven Sisters,and the Green Lunatics have
      together emptied them already.

  9. Kristian says:

    Seriously, at some point this will have to be resolved:

    RSS & UAH vs. HadCRUt4, 1979-2001:
    http://i1172.photobucket.com/albums/r565/Keyell/RSSvsHC479-01_zpscb6d5a9e.gif

    RSS vs. HadCRUt3 and 4, 2001-13:
    http://i1172.photobucket.com/albums/r565/Keyell/RSSvsHC301-13_zps0b0f341f.gif

    UAH vs. HadCRUt3 and 4, 2001-13:
    http://i1172.photobucket.com/albums/r565/Keyell/UAHvsHC301-13_zps41901770.gif

    Both satellite datasets cannot show the right temperature evolution since 1979. The divergence of the UAH series from the surface datasets since ~ 2001 is particularly striking. But also its apparent non-warming from ’79 to ’97 …

    Looking at satellite SST datasets like Reynolds OI.v2, RSS also sees lower troposphere temperatures tracking sea surface temperatures much more closely than UAH.

    But then again, is that to be expected? Or not?

    I’m not saying who’s right and who’s wrong here (maybe I’m insinuating or at least implying …), only that the quite obvious and pretty significant discrepancy needs to be resolved somehow.

  10. john says:

    Um, not to mention the State’s grabby hand!
    In Europe, the sales taxes per fill-up
    amount to $75.00.

  11. Marco says:

    6th warmest year so far, going by the first 7 months: 2002, 2007, 2005, 2010 and 1998 were warmer.

    8th warmest July: 2002, 2007, 2005, 2010, 2009, 2011 and 1998 were warmer.

  12. Bob Witchita says:

    Then again, the average anomaly over the last 48 months is the highest of any 48 month span in the data set. Same is true for the last 60 months.

    • Jake says:

      And how did this average temperature anomaly compare to the average anomaly of CO2 in the atomosphere during the same time span?
      The ultimate point is that current data trends seem to indicate that CO2 is not the only driver of global temperature change (if a significant driver at all), and that the government needs to change its policy in terms of how it spends its money on climate research

      • Ted says:

        Well Jake you would appear to be right. Note the big step up in 1998 coinciding with the 1998 El Nino, and possibly another slight one in 2010.

        Following is a link worth looking at. Presentation of about an hour but I think it helps to explain this.

        http://www.youtube.com/watch?feature=player_embedded&v=lmjaNO5DD_Q

      • Jon says:

        Since the Keeling curve, leaving aside the seasonal cycle, has only been going up since they started measuring it long before satellite temperature measurements began, the CO2 content of the atmosphere over the last 60 or 48 months would also be the highest observed for any comparable time span in the period of satellite temperature observations.

  13. The solar activity has been moderate(past 16 months or so) during solar cycle 24 maximum which would equate to more or less neutral temp. due to solar effect.

    Again once this maximum of solar cycle 24 passes and the solar readings go down to sustained low levels ,as I posted in my first post I think the temperature response will show an even clearer trend down.

    We should know soon, within a year ,if this maximum ends and the expected solar very quiet conditions prevail.

    I can’t wait to see how this is all going to unfold.

  14. Ted says:

    Just a bit on an earlier comment raised on this post.

    Antarctic ice mass.

    http://rsta.royalsocietypublishing.org/content/364/1844/1627

    http://www.sciencemag.org/content/308/5730/1898.short

    As Antarctic sea ice has been increasing since the beginning of the satellite record.

    http://arctic.atmos.uiuc.edu/cryosphere/IMAGES/seaice.anomaly.antarctic.png

    And Antarctic temps falling very slightly over that time. From Remote Sensing Satellite

    ftp://ftp.ssmi.com/msu/graphics/tlt/plots/rss_ts_channel_tlt_southern%20polar_land_and_sea_v03_3.png

    It’s hard to visualise any ice emass loss excepts where the warmer than normal ocean current is affecting the peninsula.

  15. Ralph Snyder says:

    Considering his whole body of work, Dr. Spencer is clearly highly qualified, highly skilled and highly experienced. Yet, when it comes to anything involving global warming, he cherry picks the data. I don’t get it.

  16. torontoann says:

    Stuart L says

    ” How does heat pass through the thermocline? ”

    The answer is :

    GRADUALLY – through the process of Oceanic overturning
    known as the thermo-haline circulation.

    Ocean currents transport water to the poles,
    where ice formation leaves the rest of the water cold,
    salty, and dense. It sinks, and creeps out as “bottom water.” As a result, the lowest parts of the Oceans are only a couple of degrees above 0 degrees C. This is an ENORMOUS heat sink for the world, since the heat capacity
    of the Oceans is 1,600 times that of the Atmosphere.

    The “mixing time” for the Oceans is 500-1000 years.*
    This is nothing to a bristle-cone pine, but represents
    quite a few generations to humans. On a scale marked
    in Centuries, the warming or cooling of the Oceans IS
    the GLOBAL warming or cooling rate, since they constitute
    99.5% of the global fluids which make up the skin of
    the Earth.

    A comparison of the new Argo data with the Challenger
    voyages data, from 130 years ago, shows that the upper
    1000 feet of the Oceans has warmed by about 0.4 degrees C
    and the lower Ocean has (maybe) warmed by 0.1 degrees C,
    since the days of Queen Victoria. Whether you find this
    exciting or not, I do not know.

    Of course, heat that has gone hundreds of meters deep
    into the sea is not coming back any time soon. And all
    such heat is precluded from participating in any sort
    of positive feedback in the realm of sun and air.

    *Some people think the circulation could just “stop.”
    That is wishful thinking.

    • cloudpoint says:

      That’s one side of the story, how heat gets into the ocean depths. The other side is how heat gets out. The warmed seas radiate their heat upwards (and in other directions) and the upward radiation eventually hits the surface skin of the ocean and continues up through the atmosphere to space.

      Unfortunately, increased atmospheric GHGs are warming the skin layer of all the oceans through the absorption of all that extra IR radiation coming from the sky, and this impedes heat from moving past the skin layer, leaving some of the heat stuck in the deeper ocean.

      Sustained deep ocean warming will lead to a slowing and then a reversal of oceanic overturning. This happened during the Cretaceous Period and we ended up with tropical temperatures at the poles, hot house temperatures elsewhere, plus much higher sea levels. Continental positions and other factors play a role in what eventually happens too but the general idea is described.

      • Kristian says:

        cloudpoint says, August 4, 2013 at 6:56 PM:

        “Unfortunately, increased atmospheric GHGs are warming the skin layer of all the oceans through the absorption of all that extra IR radiation coming from the sky, and this impedes heat from moving past the skin layer, leaving some of the heat stuck in the deeper ocean.”

        Still harping on about that ancient RealClimate blog article by Peter Minnett are we? Yo’ve still got nothing else, it seems, after all these years. Not a shred of evidence of a working CO2 mechanism. All you warmists ever refer to is Minnett’s clearly preconceived conclusion about what caused the effect he observed under cloudy skies in the tropical East Pacific 7 or 8 years ago.

        He didn’t show any mechanism, you see. He speculated about a hypothetical one which he already firmly believed in before he set out testing it. That’s a very different thing. That’s called ‘confirmation bias’. He used his hypothesis as the explanation. Without it being objectively confirmed by his data. Circular reasoning. Begging the question.

        It’s pretty well agreed upon that clouds in the tropics have a net cooling effect on the surface, given a certain amount of time, not a warming one. This means that whatever Minnett observed, it was at best a short-term/transient effect.

        And the thing is, he seemingly didn’t even consider other possible explanations. For example, it is just as likely, in fact more likely, that what he observed was a perturbation by the clouds covering the sky of the evaporative regime from the surface up, much like putting a lid on a freely evaporating surface of water and watching the vapor (and temperature, and radiation) profile above the surface ‘thicken’. This suppresses the rate of energy escaping the surface by way of latent heat transfer and would have an immediate effect on the skin layer – the surface would warm a bit. Until the blocking of (solar) heat input from above overcomes this effect and we start seeing cooling instead.

        Instead of taking this alternative explation into account, Minnett ‘jumped to conclusions’. Because already before he started out he was conditioned to believe, he wanted to believe, that the temperature effect he saw was caused by ‘back radiation’ from the cloudy sky. That’s what he set out to ‘prove’. So he did what Fourier did in the early 19th century when looking at the results from de Saussure’s experiment. He jumped to the conclusion that they stemmed from a radiative effect when in fact what he observed resulted from various degrees of convective restriction … as is always the case with these experiments done in air.

        Either way, cloudpoint, we observe that the skin layer (the surface) of the ocean isn’t warming. And it hasn’t been for the last 12-16 years. And still the OHC has gone up. How does that work? In my book that’s a clear real-world refutation of exactly this idea that you seem to be promulgating that it’s the atmospheric CO2 causing the bulk warming by sending ‘extra’ IR down from the cooler atmosphere to warm the warmer surface. It simply can’t be because the heat seemingly piles up down there even with the skin layer not getting warmer. Big problem!

  17. david says:

    torontoann says:

    “…the upper 1000 feet of the Ocean has warmed by
    about 0.4 degrees C and the lower Ocean has (maybe)
    warmed by 0.1 degrees C, since the days of Queen Victoria.”

    Is that it?

    Is that what this global warming panic is all about?

    Talk about a kitten farting in a gale!

    • Massimo PORZIO says:

      Ok David,

      tell us what it is about from your point of view.

      Anyways I concede you that you finally used the right words to identify the argument: “global warming panic”.

      Definition of “panic” from the Oxford on-line dictionary:
      “sudden uncontrollable fear or anxiety, often causing wildly unthinking behaviour”

      But it works better the Italian definition from the Devoto-Oli dictionary which explains:
      “Panic – reaction, mostly collective, which invaded suddenly faced with a real or IMAGINED danger, removing the capacity for reflection pushing the escape or unthinking acts”

      Could your be a freudian lapsus?

    • Ted says:

      I think for the deep water the figure is .007C. Beyond the accuracy of the much adjusted Argo buoy data.

      The truth is we really don’t know.

  18. torontoann says:

    Don’t blame me; I didn’t make the smell.

    • Massimo PORZIO says:

      By the way, for what it’s worth, I fully agree with you.

      From my point of view, you wrote words of wisdom.

      Have a nice day.

      Massimo

  19. nigel says:

    Ah, the voyage of the Challenger;
    when scientists were gentlemen, and British
    lips were stiff.

    “…the Challenger cast off from the jetty at
    Portsmouth at 11:30 A.M. on Saturday the 21st
    December, 1872. Leaving England with the drum up,
    in the middle of an unusually trying winter,
    it was not to be expected that we should escape
    without roughing it a litle.”

    The Voyage of the Challenger, Volume I The Atlantic,
    Sir C Wyville Thomson (Chief Scientist) 1878 Page 71.

    Translation: Those Royal Navy b**ds took us out at
    the worst possible time of the year. Ten minutes
    after leaving, we all wanted to die!

  20. MikeR says:

    http://rankexploits.com/musings/2013/ar5-trend-comparison/
    Lucia finds that almost all AR5 models are rejected at 5% significance level. And all are rejected in the same direction – too hot.

    I have very little patience for the “it’s all a big fraud” kind of nonsense, but I do wish that more climate modelers would come clean on this. Their models are not working well at all, and the out-of-sample error (forecast) predictions are doing far worse than the in-sample error (hindcast). That means that the models are overfitted, tuned, whether they know it or not.

  21. MikeR says:

    Dr. Spencer, what has become of the Sea Surface Temperature posts?

  22. MikeR says:

    http://bishophill.squarespace.com/blog/2013/8/3/the-validity-of-climate-models-a-bibliography.html
    The Met Office provides a list of references of model validation. The commenters try to read them, and aren’t too impressed, YMMV. See Ross McKitrick’s additional references there of his own validation attempts.

  23. nigel says:

    In parts of the Ocean, the major “surface” currents do an effective job in mixing the water down to, say, a thousand feet,long before the Poles are reached. In other words
    they are not purely “surface” phenomena morphing into
    “deep” phenomena.

    When “Challenger” took temperature measurements in
    the Gulf stream, for example, the surface temperature
    of the sea was 18.3 C and the temperature at 1,500
    feet was only a little lower, at 17.2 C. Since the
    Gulf Stream is shifting 30 million tons of water per
    second at that latitude, that represents a lot of mixing.

  24. nigel says:

    I should say that the temperature measurements I
    quoted were actually not IN the Gulf Stream but taken
    approaching it from the South. They do indicate the
    wider mixing that the current produces below the surface;
    but the actual current on the surface is distinctly
    warmer (23 C), and obvious (“like a mill race”),in a comparatively narrow band. The temperature immediately
    below this is in fact low, because of the counter-running
    cold current from Labrador which passes under.
    As one passes out of the Gulf Stream towards the North-West,
    the surface temperature typically plummets by 12 C.

  25. torontoann says:

    Ted says:

    “The truth is we really don’t know [about warming in the bottom water.]”

    We know enough to know that any temperature change in
    the Deeps since the Challenger expedition, is totally inconsequential.

    With an ocean-turnover time of a few Centuries, one
    would hardly expect that energy from a small imbalance
    in the Earth’s surficial heat budget over a hundred
    years, could yet have sent a measurable signal to
    the bottom. Given enough time (say 10,000 years) we
    could return to the conditions of the Cretaceous period,
    when the Oceans were warm (15 C all the way down)
    and high. It is more likely that the 21st ice-age, of
    the current series will have started. Either way,
    Toronto is doomed! Do NOT buy into the condominium-boom.

  26. john says:

    torontoann says:

    “Do NOT buy into the condominium-boom.”

    Unless you intend to “flip it”. Who wants
    to live in those rabbit-hutches in the sky,
    anyway?

  27. david says:

    So what would happen if the the thermohaline circulation
    “stopped” and, incidentally, why might it?

  28. torontoann says:

    Why might it?

    Oh, some fleet of icebergs freshening the water near the North Pole or some equally absurd fiction. This probably
    did happen a few times when the Laurentian Ice shield was melting; but that was then.

    What would happen?

    Because the water that sinks in the Arctic largely upwells
    near the South Pole, the PRESENT effect of the circulation
    is to INCREASE the net transfer of heat from the tropics to
    the North Pole and to DECREASE the similar transfer to the South Pole. Hence the Northern Hemisphere is about 6 C warmer
    than the Southern ((very)loosely speaking). So if the circulation “stopped” the Northern Hemisphere (where most of us live)would get colder and the Southern Hemisphere would get warmer. At least, that is my moderately educated guess.

  29. Bevan says:

    Why do the above postings continue to link increasing temperature with increasing CO2 concentration in the atmosphere? The following figures seem to indicate that the reverse is more likely.

    The most prominent spectral line for CO2 is at a wavelength of 4.3 microns. Applying Planck’s Law, gives us a spectral radiance of 0.73 Watts per (steradian metre squared) per micron for an Earth emitting at a temperature of 288 degrees Kelvin. For the incoming Sun’s spectral radiance at the Earth’s orbit, the figure is 2.24 W/(sr m^2)/micron for a Sun temperature of 5780 degrees Kelvin. Clearly, absorption and reradiation of the sunshine in the upper atmosphere at this wavelength is going to cause cooling of the Earth as the concentration of CO2 increases.

    The next significant emission line is at 15 microns where the line intensity is about one tenth of that for the 4.3 micron line. Here the Earth spectral radiance would be 5.82 W/(sr m^2)/micron but for the lower line intensity and the fact that this is within the emission spectra of water vapour for which the concentration is somewhere between 25 and 100 times greater than that for CO2. In all likelihood the Earth spectral radiance is well below 1 W/(sr m^2)/micron. The incoming Sun’s spectral radiance at 15 microns is 0.019 W/(sr m^2)/micron.

    The next significant emission line is at 2.7 microns where the line intensity is about one hundredth of that for the 4.3 micron line. Here the Earth spectral radiance is 0.0076 W/(sr m^2)/micron and the incoming Sun’s spectral radiance is 11.96 W/(sr m^2)/micron before accounting for the reduced line intensity.

    Further spectral lines occur with diminishing line intensity at shorter wavelengths for which the Sun’s spectral radiance far exceeds that for the Earth’s surface radiation. Factor in an emissivity of less than 1 for the Earth’s emissions and it seems as though the dominant 4.3 micron line should be causing cooling of the Earth rather than heating as the CO2 concentration increases due to re-emission back into space of that part of the Sun’s radiation. Obviously an exact account depends on the variations in the spectra resulting from changes in pressure and temperature with height above the Earth’s surface.

    To conclude, the correlation of increasing Earth temperature with increasing CO2 concentration is not a causal but a chance statistic. Physical science would seem to indicate that a negative correlation should exist.

    • Hops says:

      By this logic, Venus should be really cold, no?

      • Bevan says:

        Well Hops, it is on Mars, yes?
        Perhaps that has something to do with Venus having a surface pressure of 9.3 MPa and Mars being 0.64 kPa regardless of the CO2. After all there is more to the solar spectrum than the CO2 absorption lines.

        • Hops says:

          Bevan, yes there is more to the spectrum. That’s the whole point of the greenhouse effect.

          http://oyc.yale.edu/geology-and-geophysics/gg-140/lecture-6

          “A simple model of the overall Earth’s heat budget is derived. The Earth is assumed to be in equilibrium with the input of solar radiation balanced by the output of infrared radiation emitted by the Earth’s surface. Using this model, the Earth’s surface temperature is calculated to be cooler than in reality due to the lack of an atmosphere and the greenhouse effect in the model.”

          Hops

          • Kristian says:

            The key point being: “… due to the lack of an atmosphere …”

            Of course the surface of the Earth would be cooler without an atmosphere than with an atmosphere. No one is claiming otherwise. You only need to look to the Moon. The atmospheric warming effect on the surface simply isn’t radiative. Radiatively, our atmosphere acts to cool the surface, by depriving it of 45% of its potential heat input from the Sun on a daily basis.

            It is of course the mass of the atmosphere weighing down upon the surface exerting a constant force from above that the heated surface air has to overcome at a pace fast enough to balance the rate of absorption of incoming energy from the Sun, that forces the surface temperature up.

          • Bevan says:

            No doubt, Hops, you will be pleased to read that I have viewed your link to the Yale geology and geophysics lecture. Furthermore it has certainly changed my perceptions.

            During my career I worked at times with (at least) one Yale graduate who was a highly esteemed and competent scientist. Added to that I understood Yale to be a dominant world leader in tertiary education. I now see in this video that for science, at least, Yale has degenerated into teaching politically correct dogma as promulgated by the IPCC.

            The video clip exposes the teaching of a totally irrelevant model for the energy budget of the Earth. It is the “flat-earth” model of Trenberth and company that has appeared in the last three IPCC Assessment Reports and shown to be present in the yet-to-be released 5th Assessment Report. The model has its origins in astrophysics where it is used to calculate the temperature of stars from their measured radiation. It assumes a spherical body in thermodynamic equilibrium with the same radiance (hence temperature) everywhere. That is, no night and day, no seasons, a perfectly smooth uniform surface – no oceans, ice sheets, mountains, and so on, radiating directly to space, i.e. no atmosphere.

            I can assure you Hops that this is not the Earth that I have experienced, studied, measured and reported on over the past three-quarters of a century. To then claim that because the temperature from the model is different to that of the Earth, it proves there is a greenhouse effect is false. It proves that the model is inadequate.

            Thus it is very concerning to see that an institution such as Yale is teaching pseudo-science to students who, apparently, are not sufficiently inquisitive to see the contradictions. In conclusion, I judge science to be in a state of serious decline.

          • Hops says:

            I can understand people who insist there is uncertainty about the magnitude of warming caused by present levels of CO2, as Dr. Spencer likes to say, altough I think uncertainty cuts both ways, and we don’t know whether natural variability may be holding back surface warming, and I see a slowdown in that as no reason for complacency.

            What I consider completely demented is the idea that the whole climate change issue is motived by politics and some sort of vast leftist conspiracy. That is just nonsense. I read a lot about the issue because I’m concerned about the children I will leave behind, and that is the primary motivation for virtually everyone concerned about climate change.

            This notion of a leftist conspiracy is the sort of nonsense promoted by the likes of Rush Limbaugh who makes big $$$ getting his audience fired up about conspiracy theories.

            Bevan’s post below, in which he says “Yale has degenerated into teaching politically correct dogma as promulgated by the IPCC” is typical of this sort of hystestical nonsense. The professor in question is providing a simple model of radiation balance as part of an introductory class on the atmosphere, which I shared because Bevan’s post indicated a basic lack of understanding of how the greenhouse effect works.

          • Kristian says:

            Hops says:

            “What I consider completely demented is the idea that the whole climate change issue is motived by politics and some sort of vast leftist conspiracy. That is just nonsense. I read a lot about the issue because I’m concerned about the children I will leave behind, and that is the primary motivation for virtually everyone concerned about climate change.”

            Hence, you’re apparently not motivated by a thirst for knowledge, by science. You’re motivated because you’re being alarmed by the imaginary hobgoblin that is (C)AGW, clamouring to be led to safety by a claimed politico-economic remedy. (Paraphrasing H.L. Mencken’s quote about the aim of practical politics.)

            As for your ‘vast leftist conspiracy’. I’m afraid that’s just a strawman argument. It’s not a conspiracy. It’s just what politics is all about. It’s how society works. It’s how the human mind and group dynamics work.

          • John K says:

            Hello Hops,

            You wrote:

            “What I consider completely demented is the idea that the whole climate change issue is motived by politics and some sort of vast leftist conspiracy. That is just nonsense. I read a lot about the issue because I’m concerned about the children I will leave behind, and that is the primary motivation for virtually everyone concerned about climate change.”

            Much of this statement proves empirically false on a moments reflection. If you and/or any panicked/concerned citizens, committed leftists, legislative enviro-thugs, etc. truly believe carbo-loading the atmosphere poses a significant threat to the planet and justifies the use of government coercion to correct, why hasn’t anyone provided a serious plan to address it? Aside from the empirical geological fact ( which I have discussed to some degree in previous posts ) that past periods of much greater average global temperatures have provided for an apparently far larger and more abundant quantity, quality and variety of life forms how do you Hops plan to reduce global CO2 production?

            If you’ve analyzed the Mona Loa data you should know that atmospheric CO2 levels have only increased since consistent and continuous monitoring began in 1958 except for two years where CO2 levels remained approximately unchanged if I remember correctly. Some claim that 19th century CO2 levels in the 280 ppm range fall well below any Mona Loa data. Since the 1960’s and 1970’s when the anti CO2 global warming propaganda scare commenced (remember since the time of Arrhenius most people thought global warming to be a good thing) many plans have been presented to redistribute capital and assets(I believe in some cases globally) but none as far as I know have promised to significantly reduce CO2 levels at all. Remember the Kyoto protocol? If I remember correctly that legislation only sought to reduce European CO2 production to 1985 levels. After passing the Kyoto legislation, artificially increasing business and consumer costs and failing to meet even that target the Euro-left cranks continued to point at the U.S. and others for not adopting similar costly, arbitrary and ultimately meaningless legislation. Roy’s Mona Loa data clearly shows that annual planetary CO2 growth in 1985 was about 2-3 ppm almost the same as current annual CO2 growth. Further, remember that Kyoto sought to curb only European CO2 production. BTW I have not even addressed yet Clinton legislation sacrificing US coal production in favor of Indonesian producers or current Obama EPA regulations none of which has reduced or can reduce atmospheric CO2 levels.

            Of course, you could as I discussed in previous posts adopt the “green Nazi” Jacques Cousteau plan (if I remember correctly) and simply exterminate 2/3 of the human population. Since current human population falls somewhere near 7 billion, that leaves approximately 2-3 billion people (earth population during part of the 20th century) alive to continue to increase CO2 production just as has been done throughout the 20th century. Keep in mind I have not even addressed the CO2 impact of carrying out mass murder on such a scale. How much CO2 did ~45K Nazi crematoriums produce? If you don’t plan to adopt such homicidal and ineffective measures, how do you plan to encourage ~7 billion people on the earth to voluntarily forgo hydrocarbon benefits and reduce their global CO2 contribution to pre-1958 and/or pre 19th century levels?

            Al Gore already admitted that his support for ethanol subsidies arose from his desire to help local farmers (redistribute wealth from the public at large to friends). Everyone knows such ethanol subsidy legislation would likely contribute to global warming not reduce it.

            If you cogently cannot answer these simple questions and account for the facts presented, why do you believe anyone should take you and/or the enviro-left seriously? If you simply wish to leave your children a better planet as you see it and not merely bankrupt industrial societies to subsidize global poverty and population control schemes and if you truly believe you can accomplish that goal, what is your plan?

            P.S. – Simply supporting draconian legislation to curb other people’s carbon appetite all the while ignoring your own never really cut it. Again, if you’re serious about reducing carbon consumption prove it. In addition, you may want to explain to everyone what you believe the proper planetary temperature should be and why everyone (including yourself) must sacrifice to help you accomplish either your schemes or anyone else’s. That would be yet another of the many climate control issues left completely ignored for decades by the “environmental”/redistributionist community.

          • John K says:

            Post correction – I wrote: “Everyone knows such ethanol subsidy legislation would likely contribute to global warming not reduce it.”

            I should have said: “Most educated people know such ethanol subsidy legislation would likely contribute to global warming not reduce it.”

          • John K says:

            Correction to the statement:

            “How much CO2 did ~45K Nazi crematoriums produce?”

            It should have read:

            “How much CO2 did a Nazi crematorium produce?”

            the 45k figure simply reflects the most recent estimate of Nazi concentration camps.

        • Hops says:

          Well, Bevan, I got the impression from your post that you didn’t understand even the basics of the greenhouse effect, so I provided a reference to an introduction. Your disparagement of Yale aside, are you really saying you understand the dynamics of this more than the vast majority of climate scientists and can correct them? If so, by all means publish a paper…

          • Bevan says:

            No, Hops, I am not saying that I “understand the dynamics of this more than the vast majority of climate scientist”. I am simply stating the facts as I see them. If I am wrong I would be pleased to be informed accordingly. However you have not stated a single fact to support your position, having merely expressed your bigotry in writing. It is a great trick to say “by all means publish a paper” knowing full well that this is a long and arduous task for an individual.

            As for facts, look at your reference to the Yale lecture. Early in the video, the lecturer explains Planck’s law and states that the amplitude of the emitted radiation from a black body increases as the temperature of the body increases and does so “at every emitted wavelength”. According to my physics references this statement is plainly wrong, see my initial posting above for some comparative values.

            Later the lecturer writes up values about the relative temperatures of Venus, Earth and Mars which are similar to those in the 1990 First Assessment Report of the IPCC. These correspond to a greenhouse effect of 456 deg.K for Venus, 36 deg.K for Earth and 34 deg.K for Mars and are qualified by the statement that Venus, with a massive CO2 atmosphere, has the grand-daddy of all greenhouse effects. No mention is made of the disparity in the surface pressure of these planets.

            The most recent values that I have found, show that as a result of the Mars lander programme, the average temperature on Mars is now considered to be 210 deg.K with an atmosphere of 95.32% CO2 (almost the same as that for Venus) leading to a greenhouse effect of -6 deg.K, yes, a negative greenhouse effect. How is that possible? Of course, the IPCC Assessment Reports have gone silent on the matter, clearly not wanting the public to be aware of this discrepancy.

            As for my disparagement of Yale University, certainly I am extremely disappointed that what was previously a highly respected institution is now a party to the global warming fraud.

          • Kristian says:

            That’s very interesting, Bevan. I’ve done some calculations myself and came up with an ‘atmospheric warming effect’ on Mars’s global surface of around 5K (positive, but tiny). So +/- 5K. That’s not a very impressive warming. And yet, the absolute average density of so-called ‘radiatively active’ gases above the Martian surface is in fact greater than above the surface of the Earth. Molecules per unit of volume of ‘air’ above the surface. And on Earth, the atmospheric surface temperature ‘enhancement’ is 56K (24%) as opposed to (my) 5K (2.4%) on Mars. Go figure!

            Especially knowing at the same time how much much lighter the Martian atmosphere weighs down on the surface. Makes you think.

            How can they miss this? How can they not see? How obvious is this …?

          • Kristian says:

            In fact, if you just plainly calculate the effective planetary emission temperatures of Venus, Earth and Mars, you end up with 184K, 255K and 210K respectively.

            This gives the following apparent magnitude of the radiative GHE for the three planets:

            VENUS: 551K (ERL – 52.6 km above the surface)
            EARTH: 33K (ERL – 5,1 km above the surface)
            MARS: 0K (ERL – AT THE SURFACE!)

            How can an atmosphere containing almost nothing but CO2 (and a total absolute density of ‘radiatively active gases’ per volume of ‘air’ above the surface that’s on average ~75% higher than on Earth) not raise the ERL at all?!

            A clear real-world refutation of the ERL (and hence, the GHErad) hypothesis right there.

        • Hops says:

          Bevan,

          By this logic, Neptune should be really hot.

          Given PV = nrtT, an increase in pressure will increase temperature, but the heat dissipates and volume decreases; hence air conditioning. So Neptune is a ball of cold liquified gases.

          I also think your analysis is missing the fact that there is such a thing as night. Indeed, CO2 may reflect some wavelenths during the day, but at night it only keeps is in.

          Surely, you’re not seriously claiming that the greenhouse effect is a “fraud” for some reason perpetrated by the IPCC? The concept goes back to Svante Arrhenius in 1896.

  30. david says:

    CLOUDPOINT; thanks for the comments but you got the cycle timing wrong, hence why you get different numbers. Also, I am glad we can agree that 2007 was the max (both modeled and measured, which I will show in a minute). Question remains thus, are we now in the next ~32yr on average cooling period or not? The 4 cycles in the current HadCRUT4 data seem to suggest so (like any model, we have to work with the data we have and use the past to predict the future). Let me explain, stochastic data analyses of the HadCRUT4 data set finds the following dates with corresponding max and min cycle dates and GSTA values

    max 1879.2 (-0.094), min 1911.7 (-0.362): 32.5yr period
    min 1911.7 (-0.362), max 1945.7 (+0.186): 34.2yr period
    max 1945.7 (+0.186), min 1976.7 (-0.310): 31.0yr period
    min 1976.7 (-0.310), max 2007.0 (+0.829): 30.3yr period

    the dates with the actual max and min are:
    max 1878.1 (+0.403), min 1911.1 (-0.774): 33.0yr period
    min 1911.1 (-0.774), max 1945.6 (+0.362): 34.5yr period
    max 1945.6 (+0.362), min 1976.2 (-0.439): 30.6yr period
    min 1976.2 (-0.439), max 2007.0 (+0.829): 30.6yr period

    As you can see, this is why I mentioned the ~32 yr period/cycle; which is an average of these 4 cycles (please give nature a break if it’s cycles are not always exactly the same to the day… 😉 ).

    It also means one shouldn’t start at 1850, which is what you unfortunately did. And as you can see, the model does a VERY good job in finding the dates with the max and min values. The stochastic model calculates and uses differences between several LT exponential moving averages of the GSTAs to determine max and min values, hence why the model-determined max, min dates (Except for 2007) are always a few months later than the actual max and min dates.

    Having determined these dates we can then apply -if one would like to do so- linear regression for each period to determine a slope.

    using the actual dates of max, min GSTA values we can determine for each corresponding period/cycle the following slopes
    -0.0076 C/yr, R2=0.18 (stat. sign.)
    +0.0141 C/yr, R2=0.52 (stat. sign.)
    -0.0020 C/yr, R2=0.02 (stat. not sign.)
    +0.0193 C/yr, R2=0.64 (stat. sign.)

    using the model-determined dates of max, min GSTA values we can determine for each corresponding period/cycle the following slopes
    -0.0066 C/yr, R2=0.15 (stat. sign.)
    +0.0136 C/yr, R2=0.50 (stat. sign.);
    -0.0022 C/yr, R2=0.02 (stat. not sign.)
    +0.0186 C/yr, R2=0.62 (stat. sign.);

    As you can see, the model-determined slopes for each cycle are in very good agreement with those based on using the actual max, min values, showing -again- how accurate and useful the model is!

    Now you can also see why I mentioned originally “global temperatures appear to increase by on average 0.5C during the warming cycles and decease by around 0.2C during the cooling cycles, suggesting a net-warming of around 0.25C/~64yrs since 1850”; namely the warming cycles: 0.0136 C/yr x 34.2yrs =0.465C, and 0.0186 C/yr x 30.3 yrs = 0.563C (on average 0.51C); the cooling cycle: -0.0066 C/yr x 32.5yrs = 0.21C.

    I excluded the 2nd cooling period as it was not significant. So yes, you can blame me for that, if we add it then the average cooling is ~0.14C/cycle.

    However, if we need to wait for seven 64yr-periods before we can supposedly validate this model, then why don’t we also wait with claiming AGW is real!? And why seven 64-yr periods? Why is forcing a linear line through non linear data all of sudden OK? It’s even worse.

    My point is that stochastic trend and cycle analyses clearly finds periods of about equal length where temperatures rise or decline. The latest warming cycle, until 2007, indeed saw temperatures rise more rapid then the previous warming cycle (0.19 vs 0.14; both actual and model-determined). Simple linear regression, starting arbitrarily at 1850, forcing a linear regression line through the data, clearly and obviously, does a bad job in predicting and following the GSTA trends. Stochastic trend and cycle analyses nails it on the head pretty much.

    Question now is if taking out the cycles in models is really the appropriate way to make predictions about future temperatures as the trend is non-linear?!?!? Including them makes for much more powerful and realistic models, which I’ve clearly shown!!

    Another question is if we should really worry about a 0.05C/yr difference between the past two warming cycles? Final question; why did the GSTAs stopped increasing after 2007? Regression analyses of the data from 2007.0 till 2013.4 shows a slope of -0.002 and an R2=0.001. Hence, although likely ~25yrs of data for this cooling cycle are lacking, hence the low R2, the slope is already similar to that of the previous cooling cycle…

    Again, CO2 can therefore NOT be the main climate driver!

    As for the investor-mentality you touched upon; I suggest you start reading about elliot wave theory and try to determine in which cycle the financial markets and our society currently are.

    ps: here are some references to ~30yr natural cycles and fractions/multiplications thereof.

    Giese B.S., Ray S. 2011. El Niño variability in simple ocean data assimilation (SODA), 1871–2008. Jounral of Geophysical Research, 116, C02024, doi:10.1029/2010JC006695.
    Knudsen et al. 2011. Tracking the Atlantic Multidecadal Oscillation through the last 8,000 years. Nature Communications, 2:178 | DOI: 10.1038/ncomms1186)
    http://www.nwr.noaa.gov/Salmon-Hydropower/Columbia-Snake-Basin/upload/Briefings_3_08.ppt%5D
    Chambers et al. 2012. Is there a 60-year oscillation in global mean sea level? Geophysical Research Letters, 39 (18), DOI: 10.1029/2012GL052885
    UN Food and Agricultural Organization (FAO), 2001. Climate Change and Long-Term Fluctuation of Commercial Catches. ftp://ftp.fao.org/docrep/fao/005/y2787e/y2787e01.pdf
    http://en.wikipedia.org/wiki/List_of_solar_cycles
    Scafetta, N.,2010. Empirical evidence for a celestial origin of the climate oscillations and its implications. Journal of Atmospheric and Solar-Terrestrial Physics, doi:10.1016/j.jastp.2010.04.015.
    http://www.esrl.noaa.gov/gmd/ccgg/trends/
    Landscheidt, T. New Little Ice Age instead of global warming. Energy and Environment 14, 327-350, 2003.

    • david says:

      EDIT: “Another question is if we should really worry about a 0.005C/yr difference between the past two warming cycles?”

      Note that if we apparently -and subjectively- shouldn’t worry about a 0.002C/yr cooling, then why worry about a 0.005C/yr difference in warming between the two different warming periods?

  31. Tim Wells says:

    It looks like this winter we will start to see a shift into the negative on the UAH figure, as we progress back towards a Maunder minimum over the next 100 years.

  32. sky says:

    The UAH Global average anomaly has been fluctuating around ~0.3K for quite some time now, but predictive filters show little tendency toward a significant retreat. In fact, after a triple-dip La Nina, one should expect an El Nino episode this year or next. Let’s see what happens then relative to the 1998 and 2010 anomaly levels. It should be a revealing, pivotal event.

  33. nigel says:

    The NOAA Forum consensus was updated
    today, and is “ENSO-Neutral” for the
    next few months.

  34. Dan Pangburn says:

    Many (if not all) really missed the boat when they looked at TSI, didn’t see any effect and ruled sunspots out as a factor. If they had thought of conservation of energy and looked at the sunspot time-integral they might have discovered what drives the average global temperature.

    One corroborating study is described at http://hockeyschtick.blogspot.com/2010/01/blog-post_23.html . This shows a trajectory based on the sunspot number time-integral beginning in 1610. The decline of the LIA and rapid rise since approximately 1941 are evident.

    After about 1895, accurate temperature measurements were made world wide and revealed the oscillations above and below the sunspot-number-time-integral-trajectory that are caused by the net effect of ocean cycles (which are dominated by the PDO). The resulting graph and physics-based equation that calculates it are shown at http://climatechange90.blogspot.com/2013/05/natural-climate-change-has-been.html

  35. nigel says:

    Dan

    I see from these writings of yours
    that you have a clear prediction for
    the next ten years – cooling.

    For your model to be validated, the R^2
    should stay above 0.8 I think for those
    ten years.

    We will see, provided the Grim Reaper stays
    away.

  36. JCH says:

    Wood for Trees has picked up .118 for their July number, not .174.

  37. Bert Sh says:

    New names of popular files

    Dr. Spencer, would you please give complete URLs to your data files?

    And would you please provide a decent interface to them? They are scattered all over your FTP directory and one has to be an expert to dig them out. This data is important and should be accessible to everyone, not just insiders.

    Thank you.

    • An Inquirer says:

      Bert, I agree. But over the years, Dr. Spencer has implemented few — if any — of my suggestions for better communication.

      You might try this link: http://wattsupwiththat.com/reference-pages/global-weather-climate/global-temperature/

      WUWT has aggregated in one spot the relevant data series for various measures of global temperature. One that particularly interest me is the lower stratospheric temperatures. One fingerprint of AGW was to be decreasing stratospheric temperatures while surface temperature rises. However, stratospheric temperatures have been flat for 18 years — and historic falls are linked to massive volcanic eruptions.

  38. Werner Brozek says:

    JCH says:
    August 10, 2013 at 7:55 AM
    “Wood for Trees has picked up .118 for their July number, not .174.”
    WFT uses the 5.5 version and not the 5.6 version. The 5.5 version has a negative slope going back to January 2005 whereas the 5.6 version has a negative slope going back to July 2008 according to Walter Dnes. In contrast, RSS has a negative slope going back to December 1996.

  39. torontoann says:

    I was going through some old books, wondering what
    to do with them, when I chanced across the following –
    from “Climate and the Changing Sun,” an article in
    The 1979 Britannica Yearbook of Science and the Future, written by John A. Eddy, Senior Scientist at the High Altitude Observatory, National Center for Atmospheric Research, Boulder, Colarado:

    The Maunder Minimum, once it was clearly identified
    in both historical records and tree-ring carbon-14,
    was the Rosetta Stone that enabled scientists to
    read the much longer record of solar history found
    in the wood of long-lived trees like the bristle-cone
    pine. In the long tree-ring carbon-14 record, which
    presently reaches more than 8,000 years into the past,
    one can see the marks of repeated solar excursions
    like the Maunder Minimum. Each of these prolonged
    lows in solar activity corresponds to a similar period
    of anomalous cold on Earth, as derived from records
    of mid-latitude glacier advance, as best these are known.
    The correlation seems to confirm the more-than-chance
    connection between the Maunder Minimum and the cold
    excursion of the Little Ice Age.

    Also evident in the tree-ring carbon-14 record are times
    of anomalously high solar activity, one of which is
    the present era, and each of these corresponds to times
    of warm climate and glacier retreat.
    Page 158

    I am keeping this book.

  40. nigel says:

    The rate of production of carbon-14 is a proxy for
    external influences on our atmosphere. The rate is
    also affected by shielding by the magnetic field
    of the Earth. I assume a weakening of that is rather
    similar in its effects to a strengthening of solar activity.
    The strength of the field seems to have been declining
    since 1840 at a rate of about 5% per hundred years.
    Could that be another source of the slight secular
    warming since Victorian times? It seems as good a
    theory as any other.

  41. Ragh says:

    WRONG!!!!!!!!:P

  42. I read this piece of writing completely concerning the comparison of most recent and preceding technologies, its awesome article.

  43. Pretty! This was an incredibly wonderful post. Thanks for providing this information…

  44. This is a truly accommodating post and extremely enlightening there is not even a shadow of a doubt. Lot of thanks to you for sharing this.
    https://electricianbeecroft.com.au/

  45. Jack WILL says:

    Beautiful blog post indeed. Go to our website https://trendmoversdubai.com/

Leave a Reply to Kristian